
Abstract
Prior studies have found persistent gender segregation across majors in higher education. We build on this literature by documenting segregation within majors through examining student experiences at a student-by-course level. We measure the variation in the proportion of students’ classmates who are their same gender and explore which levels of sorting explain this variation. We observed that considerable variation persists within majors: 61% of the variation in the proportion of same-gender peers arises from within-major variation for female students, and 48% for male students. We also find that sorting by gender is more prevalent for certain groups of students. Our study offers a guide for measuring this phenomenon in various campus contexts, examining how curricular choice can affect student sorting within majors. This study suggests that previous work examining sorting only at the major level misses some important opportunities for understanding the mechanisms through which gender segregation occurs in higher education.
Keywords
Introduction
Since the 1980s, female students in the U.S. have earned a proportionally larger share of college degrees when compared to their male counterparts (Kao, 2015), thus narrowing, or even reversing, the gender gap in educational attainment. However, the decrease in vertical stratification has been coupled with a troubling persistence in horizontal sorting. Male and female students are sorted into qualitatively different kinds of education both across and within institutions (Charles & Bradley, 2002; Gerber & Cheung, 2008). In particular, female students are underrepresented in fields with greater labor market returns, including some STEM and technical fields (Barone, 2011; Bobbitt-Zeher, 2008; Davies & Guppy, 1997; Iannelli et al., 2018). Gender segregation across fields of study has persisted for the past three decades in many countries and research has identified multiple sociocultural, institutional, and psychological factors that have contributed to gender segregation across fields of study (Barone, 2011; Barone & Assirelli, 2020; Bobbitt-Zeher, 2008; Charles & Bradley, 2002; DiPrete & Buchmann, 2013; Ganley et al., 2018; Gerber & Cheung, 2008; Penner, 2015; Speer, 2017; Wang et al., 2013; Xie et al., 2015).
However, examining segregation only across majors could mask considerable segregation that occurs within majors. Even students within the same fields can find themselves in different courses due to various curricular structures, which encompass factors such as elective courses and general education courses (Chaturapruek et al., 2021; Mann & DiPrete, 2013; McFarland, 2006; Scott-Clayton, 2015). For example, in the Biological Science department in our focal university, “Biology of Aging” has a relatively low proportion of female students (48%), while “Mood Disorders” has an average high proportion (83%). In Sociology, “Social Networks and Social Support” has an average of 56% female students, while “Sociology of Education” has an average of 79% female students.
Such horizontal sorting is somewhat akin to tracking, a concept that has garnered considerable attention in the K–12 literature for its forms and effects (Domina et al., 2019; Lucas & Berends, 2002; Sorensen, 1970). Tracking in higher education is manifested in both explicit and implicit ways. By dividing students into different majors, colleges channel the instruction, learning opportunities, and peer environments through degree/course requirements. Gender segregation at the major level, including the underrepresentation of women in STEM and more lucrative fields, shows one of the salient results of college tracking. Across critical post-college outcomes, gender sorting by field of study is consistently linked to the income gaps by gender and occupational differences (Bobbitt-Zeher, 2008; Sloane et al., 2021). Unlike K–12 education, the majors and curricular experience of college students are widely considered their personal choices. Such conventional understandings ignore the impact of institutional factors (e.g., general education, major requirements, course offerings, prerequisite) on students’ college pathways, and are insufficient to explain why students’ sociodemographic characteristics are systematically correlated with their major choices and curricular experiences.
The significance of gender segregation among students in the same major is twofold. First, given that human capital developed at the course level is consequential in the job market, within-major sorting can lead to both occupational sorting and differential economic outcomes. Different courses involve different instruction, curricular content, and student learning. Recent studies have provided evidence of the strong labor market returns to student coursework in career and technical education (CTE) fields even without a credential or degree (Bahr, 2018; Giani et al., 2020), as well as the differential labor market returns to different specializations in the same field of study (Zölitz & Feld, 2020). Second, within-major sorting can lead to peer sorting and thus differential peer effects. For example, students surrounded mostly by peers of the same gender could develop less diverse networks and more homogeneous social norms, as compared to students in classrooms with a more even gender composition. Such differences could influence crucial individual outcomes such as future career choices, accumulation of social capital, and the development of diverse perspectives (e.g., Raabe et al., 2019; Zölitz & Feld, 2020). If the mechanisms driving gender sorting across majors also operate at the course level within majors, female students may be disproportionately sorted into courses with lower economic returns. For example, they may be more likely to enroll in specializations or courses that involve fewer technical skills or less training valued by the labor market, ultimately contributing to the gender wage gap in their post-college careers.
To begin to fill this gap in the literature, this study explores gender sorting both across and within majors by examining what proportion of each student’s classmates are of the same gender over the full trajectory of their college careers. Classroom context, as the basis of potential learning and social interactions, can provide a more accurate depiction of how students experience gender segregation in higher education than overall major context. We accomplish this using a unique data set that captures each class a student takes in and out of their major and their peers in that class. In our main analyses, we use in-department classes as a proxy for major-required courses. This is a somewhat noisy proxy for the major-level curricular requirements that constrain student course choices (e.g., courses in the Chemistry department are usually required for Biology majors). Thus, to examine the validity of our results, in online Supplemental Appendix C, we include subsample analysis that provides more accurate hand-coded measurement of curricular requirements.
We utilized a selective public university in the American West as a case study to showcase our methodological innovation in analyzing student peer composition within majors. Although our research is based on a single institution, the methodology is designed for broad applicability. This study focused on gender, given the substantial body of prior empirical work mentioned above that has demonstrated the social significance of gender segregation in both majors and occupations for life-course outcomes. If we find evidence of high gender segregation within certain majors that lead to more lucrative labor market outcomes, it may suggest that the curriculum structure of those majors can reinforce gender disparities. Additionally, we also use gender as a proof of concept to demonstrate the extent to which peer sorting exists within majors and to illustrate the significance of our measures. A similar approach could easily be applied to examine within-major gender sorting on other campuses or to explore sorting in other significant student demographic groups, such as first-generation college student status or race and ethnicity.
This study extends beyond the analysis of gender segregation at the major level, advancing our understanding of how variation in the gender composition of students’ classmates occurs both across and within majors. If gender sorting exists at both major and the course level, the gender gaps in critical post-college outcomes that are well established in the prior literature could also play out at the course-level within major.
Specifically, we ask:
RQ1: In five cohorts of students at a selective four-year college in the American West, how much variation is there across students in the proportion of same-gender classmates?
RQ1a: Does the proportion of same-gender classmates vary by sociodemographic background?
RQ1b: How does the median proportion of same-gender classmates vary across majors?
RQ2: How much within-major variation is there in the proportion of same-gender classmates?
RQ2a: Is within-major variation in the proportion of same-gender classmates driven by classes students take outside their home department (e.g., general education requirements)?
Literature Review and Theoretical Framework
Institutional Constraints on Students’ Course-Taking Patterns
Literature on tracking from the K–12 context, although not perfectly analogous to the curriculum structure in higher education, provides insights to help us understand course-taking patterns for students of different genders and how institutional constraints can affect gender segregation. The term “tracking” is used to describe the institutional practice of separating students into groups that experience different instructional exposures. It has received considerable research attention in the K–12 literature. Many schools no longer have official policies to separate students formally into qualitatively distinct tracks (e.g., vocational track vs. academic track), but there are common and binding organizational practices that continue to sort students into qualitatively different individual courses (e.g., academic placement, honors, remedial) (Lucas, 1999).
One reason for the continuous research attention is that researchers consistently find that students from different socio-demographic backgrounds end up in different courses, studying different subjects, and being exposed to different peers (Armstrong & Hamilton, 2013; Bottia et al., 2016; Domina et al., 2019; Lucas & Berends, 2002). The other reason is that these differences in student experiences are associated with variation in student academic and labor market outcomes. In a highly tracked school, students are more likely exposed to peers with similar socio-demographic backgrounds and abilities, and experience greater variation in learning opportunities and instructional content across tracks (Gamoran, 1987; Moller & Stearns, 2012; Moller et al., 2013; Sorensen, 1970).
Although tracking has received less empirical examination in higher education than in K–12 education, it is arguably more explicit and pronounced. In K–12 education, courses under the same subject are usually divided into different levels both vertically (e.g., Introductory Physics vs. AP Physics) and horizontally (e.g., Mandarin vs. Spanish) (Ferrare, 2013). In higher education, tracking is commonly perceived as more student-directed, meritocratic, and preference-based. By allowing students to make individual choices based on their interests and ability and implementing different requirements (e.g., prerequisites), tracking in higher education is rationalized as providing curricular specialization in response to students’ interests, skillsets, and autonomy. However, akin to tracking in K–12, these “personal choices” are influenced by the institutional constraints and curricular structures.
University structures curriculum in multiple ways, including major requirements, general education requirements, and elective course requirements (Scott-Clayton, 2015). Multiple factors systematically play roles in this process which leads to observed gender segregation across and within majors. Mann and DiPrete (2013) have found gender difference in curricular goals even within STEM fields. Female students are more likely than their male counterparts to value a diverse set of courses and liberal arts curriculum, which can be achieved through elective courses and general education. Some fields of study have competitive admissions processes, and some have intentionally challenging introductory coursework, which functions to deter and redirect students to other majors (Astorne-Figari & Speer, 2019). Female students might be more susceptible to this highly competitive environment or may perceive a higher opportunity cost associated with failing certain courses. Majors have different concentrations, levels of difficulty, prerequisite structures, course schedules, instructors, etc. In the following sections, we will discuss how students are sorted at different levels and why it is important to look at gender sorting in higher education both at the major and course level.
Gender Sorting at Major Level
Gender segregation between majors is a long-standing feature of higher education (Barone, 2011; Barone & Assirelli, 2020; Bobbitt-Zeher, 2008; Kao, 2015; Ganley et al., 2018; Jacobs, 1986; Penner, 2015; Speer, 2017; Xie et al., 2015). The gap in college enrollment between gender is narrowing; in certain countries (e.g., the U.S.), female students even outperform male students in overall college attainment. However, gender segregation between majors has persisted (Kao, 2015; England & Li, 2006). Female students are underrepresented in most STEM fields such as physical science, engineering, math, and statistics. Specifically, only around 24% of bachelor’s degrees in engineering were earned by women in 2020, compared to 19% in 2011 (NCSES, 2022). Female students are more likely to choose majors with lower labor market returns such as education, arts, and humanities, compared to more lucrative majors such as economics, and engineering (Bobbitt-Zeher, 2008). Major choice has been demonstrated to have lasting consequences for an individual’s career, economic success, and peers with which a student interacts (Black et al., 2008; Bobbitt-Zeher, 2008; Leighton & Speer, 2020).
Of the multiple factors that contribute to student choice of major, pre-college academic preparation, prior course-taking experiences, perceived costs and preferences, and future expectations about career and family play the largest roles (Astorne-Figari & Speer, 2019; Xie & Shauman, 2005). Students’ pre-college course experience and performance partially inform how likely students are to expect themselves to be interested and successful in relevant fields of study. Gender differences are found in pre-college course taking and course performance. Female students are more likely to pursue high school curriculum tracks in the humanities when compared to their male counterparts (Chen, 2013), while on average male students outperform female students at the top percentiles in math and science courses (Xie & Shauman, 2005). These pre-college factors are directly related to student choice of major in university.
However, recent research has clearly demonstrated that prior ability is not the only factor in explaining gender differences in choice of major (Chen, 2013; Speer, 2017; Stearns et al., 2019; Xie & Shauman, 2005). Students’ broader perceptions of the character of academic programs is also a basis of student choice. Astorne-Figari and Speer (2019) found that female college students are more likely to switch to majors that “look like them”—i.e., majors with a higher density of female students—and England and Li (2006) documented that the trend of feminization of fields is negatively associated with male entrance. Similarly, the level of perceived gender biases against women, such as discrimination, barriers to success, and sense of belonging, is negatively correlated with the proportion of female students within a major (Ganley et al., 2018). Finally, the choice of major is affected by students’ future orientations with respect to career plans, expectancy of success, gender roles, and family responsibilities (Eccles, 1994; Jacobs, 1995; Morgan et al., 2013; Quadlin, 2019; Weeden et al., 2020).
Understanding how multiple factors contribute to gender segregation at the level of major choice helps us to establish the foundational importance of major choice in the observed variation of students’ classmates’ composition. We note, though, that there is evidence that these factors may also affect sorting by gender into classes within majors.
What Do We Know about Gender Sorting between Classes for Students Enrolled in the Same Majors?
Majors are, in some ways, simply administrative abstractions, as classes are the true location of instruction and social interaction. But they are important administrative structures, as the way a university designs its major requirements and general education requirements influences course-taking patterns even for students enrolled in the same major. These factors can exacerbate the gender and racial/ethnic segregation that comes from sorting across majors; given the higher flexibility of course choices in universities (Chaturapruek et al., 2021; McFarland, 2006), students in the same major may end up choosing very different courses. But compared to examinations of gender sorting across majors, there is relatively little work that has examined how the curricular experiences of students enrolled in the same major can vary substantially.
Both descriptive and causal evidence from K–12 and higher education show gender disparities in course-taking behaviors. Using state-wide high school data in Florida, Conger et al. (2009) found gender differences in AP course-taking even after controlling for multiple factors (e.g., pre-high school characteristics, high school fixed-effects). Drawing on nationally representative longitudinal survey data, Penner and Willer (2019) documented that female college students are less inclined to retake STEM courses after failing them, which can suggest a gender difference in course-taking patterns. The authors hypothesize that this could be due to gendered beliefs that STEM fields are male domains. Past work has also shown gender differences in course-taking based on course content. For example, Ferrare (2013), studying one United States high school, found that courses relevant to the production of meaning, art, and household skills are more associated with female students, while courses related to the transmission of technical knowledge, business preparation, and construction skills are more associated with male students. A few studies have used randomized controlled trials to provide causal evidence on the effects of various course characteristics on students’ educational choices. Female students are more likely to enroll in future STEM courses if they have female instructors as compared to having male instructors (Carrell et al., 2010). However, female students are less likely to persist and get a degree in STEM majors if they have a larger proportion of high-ability classmates. The authors hypothesize that this is potentially due to self-perception about future success (Fischer, 2017).
Apart from studies focusing on course-taking behaviors, a handful of studies use survey and interview data to explore students’ perspectives on course selection and their decision-making processes. This body of research finds that students choose courses for a variety of reasons, including both objective factors such as fulfillment of major requirements and course schedules, and more subjective factors such as perception of potential career benefits and future development, course difficulty, and the instructor-student relationship (Chambliss & Takacs, 2014; Galotti & Umscheid, 2019; Lee et al., 2021; Samara, 2015). Past work has found differences across genders in these decision process. For example, female students tend to have more criteria that they consider when making course decisions (R. Baker & Orona, 2020). Female students tend to place greater value on whether the courses fulfill certain course requirements and on obtaining good grades when choosing courses, compared to their male counterparts (Galotti & Umscheid, 2019; Lee et al., 2021). These findings provide initial evidence that, even within majors, course-taking preferences associated with demographic characteristics might lead to meaningful segregation. Examining gender segregation only between majors might miss important patterns.
Importance of Peer Gender Composition
Exposure to diverse gender compositions can be influential to student outcomes. First, classroom gender composition has itself been repeatedly found to affect students’ educational outcomes, such as academic performances and major choices (Hoxby, 2000; Lavy & Schlosser, 2011; Park et al., 2013; Zölitz & Feld, 2020). Second, female students are more likely influenced by their same-gender peers in terms of course-taking and course preference (Frank et al., 2008; Raabe et al., 2019; Riegle-Crumb et al., 2006; Rosenqvist, 2018). Given the potential influences of the gender composition of students’ classmates, it is important to better understand the dynamics of systematic gender sorting of courses within majors.
Prior literature shows that gender can play a role not only in major choices, but also in course-taking patterns for students enrolled in the same major. This study examines the extent to which within-major sorting contributes to overall gender sorting in university. This study makes a significant contribution to the literature; while previous research has focused on sorting at the major level, our data allow us to examine how student course choices are related to gender composition of classmates and how this varies by majors, course-level features, and individual student characteristics.
Data and Methods
Data
In this study, we use administrative data from the University of California-Irvine (UCI), a large public selective four-year university. UCI is a Hispanic-Serving Institution with an annual total enrollment around 22,000 from 2011 to 2015. The administrative data includes enrollment and performance data for every course taken by each student in our sample. It also contains pre-college academic and background data from student applications, including self-identified sex, race, and ethnicity, and low-income status—based on options provided by the university—along with pre-college standardized test scores, transfer and international student status, age, and first-generation college student status.
Our analytical sample includes students who entered the focal university between 2011 and 2015. We set the cohort sample restrictions because the 2011 cohort is the earliest cohort for whom we have complete data and stopping with the 2015 cohort allows students six full years to graduate based on current data availability. Transfer students, students with multiple majors, and undeclared students are all included in our sample. Students in our sample are enrolled in a total of 100 majors.
Table 1 provides summary statistics describing our sample of the 34,882 students who enrolled at the university from 2011 to 2015. Over half of the students in our sample are classified as female (54%), and over half are first-generation college students (53%). Furthermore, 35% of students are identified as low-income, and 26% are transfer students. Regarding the ethnic composition of the student sample, 26% are identified as Latino/a, 53% as Asian, 17% as White, and 3% as Black. International students make up 20% of the sample and the majority of them are from Asian countries.
Summary Statistics of Students’ Characteristics and Outcomes (Student-Level)
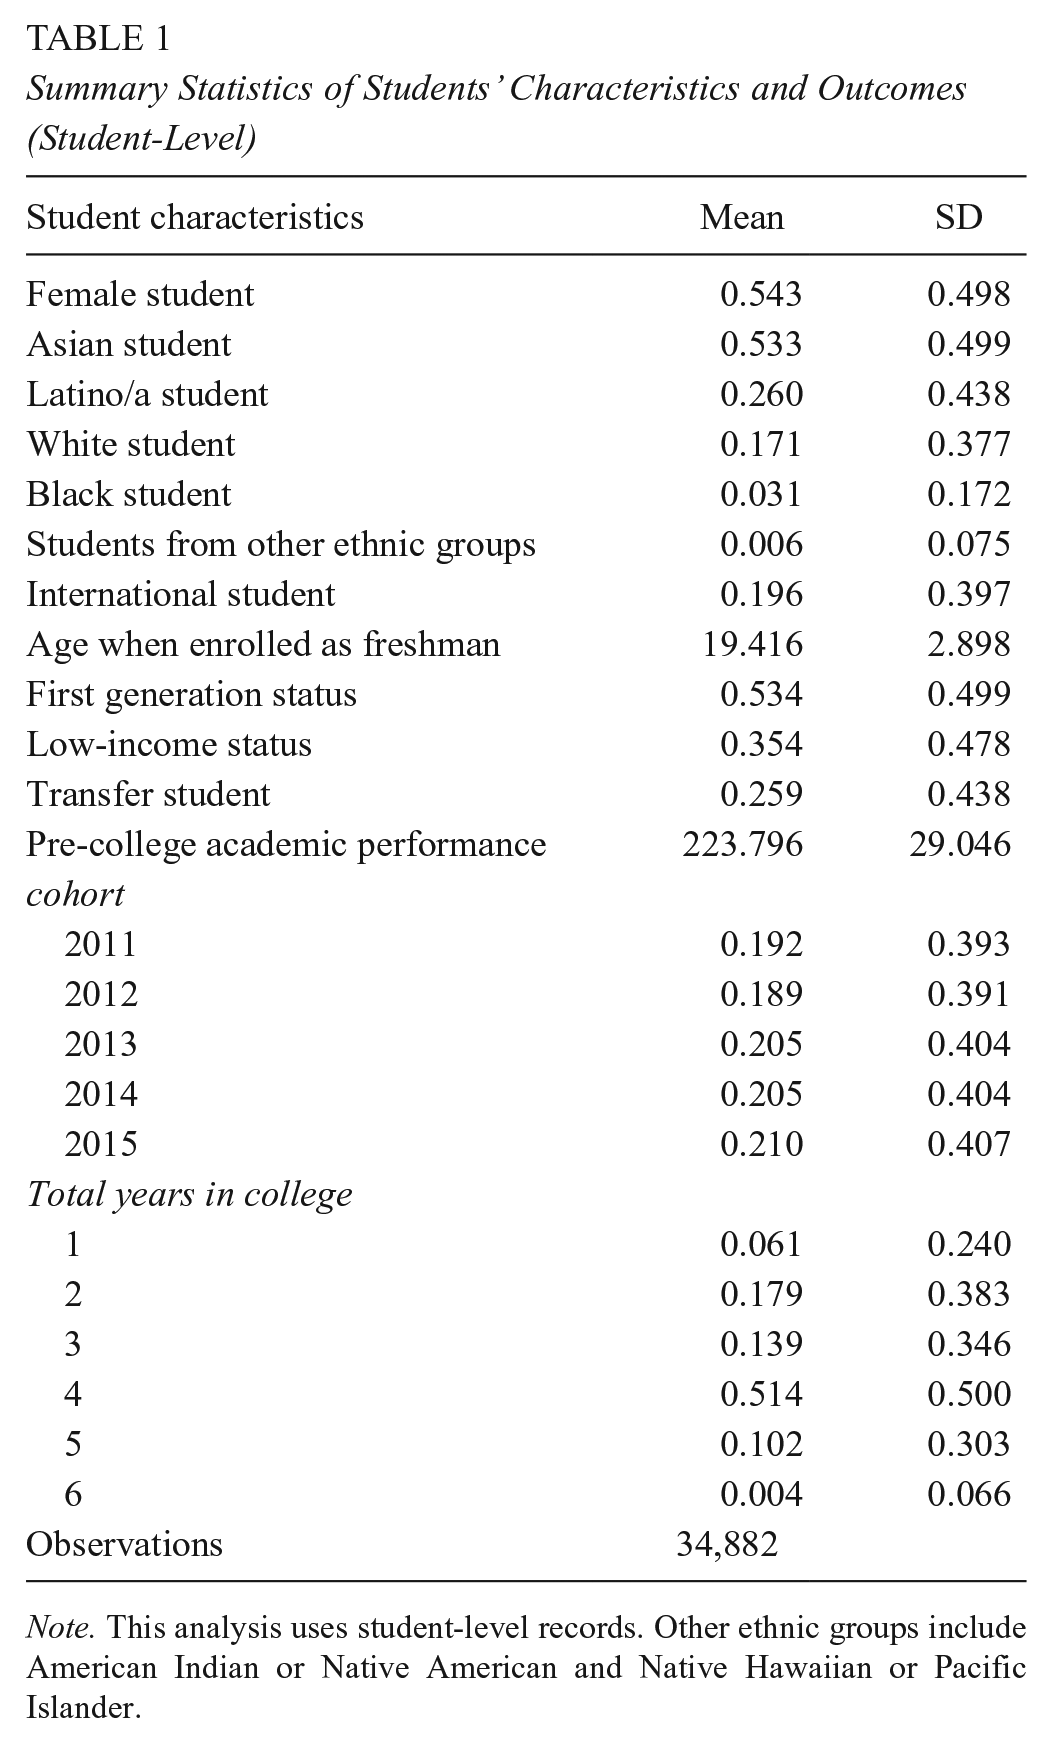
Note. This analysis uses student-level records. Other ethnic groups include American Indian or Native American and Native Hawaiian or Pacific Islander.
Outcome: Same-Gender Peer Composition
The outcome in our analysis is the proportion of a student’s classmates who are his/her same gender at the student-by-term-by-course level. Given the restrictions of how the gender data are collected, we only consider students who self-identified as female or male. 1 The focal student is excluded when calculating the total number of same-gender peers and the total number of students in a class. We also exclude specific courses, such as independent study courses, where there is limited potential for peer interaction. Furthermore, when classes include multiple sections (e.g., a lecture and a lab), we only include the main section in the calculation. Our outcome is calculated separately for three categories of courses students are enrolled in (1) all courses, (2) in-department courses, (3) out-of-department courses. In-department courses are defined as courses offered by the focal student’s major home department. For example, for a student majoring in Biological Science, courses offered by this department would be classified as in-department courses.
As shown in Table 2, on average, female students have a proportion of 0.60 (SD = 0.16) female classmates in all courses, a proportion of 0.60 (SD = 0.18) female classmates in in-department courses, and a proportion of 0.59 (SD = 0.15) female classmates in out-of-departmentcourses. Male students on average have a proportion of 0.53 (SD = 0.20) male classmates in all courses, a proportion of 0.57 (SD = 0.22) male classmates in in-department courses, and a proportion of 0.50 (SD = 0.18) male classmates in out-of-department courses.
Summary Statistics of Outcome Variables

Note. This analysis uses student-by-term-by-course records.
As we noted previously, we use in-department courses as a proxy to describe courses required by certain majors. The advantage of this approach is that it allows for simple classification of in- and out-of-department courses for all students and strengthens the generalizability of our findings and enhances the potential for replication. However, a limitation of this approach is that it may not fully capture major-required courses since many majors required courses outside of their home department. To address this concern, we manually coded courses from the general catalog that can be used to fulfill a major, specialization, or school requirement for the 18 largest majors. We then reanalyzed the data based on these manually coded courses and discussed the sample, methods, and results in online Supplemental Appendix C. The results are generally comparable between these two approaches.
Analytic Strategy
To examine our research questions, we start by using kernel density plots to separately visualize the distribution of the proportion of same-gender classmates for female and male students. These plots illustrate how much variation there is in the proportion of same-gender classmates across students in our sample. Furthermore, to show how such variation differs across and within majors, we plot the 10th percentile, median, and 90th percentile of students’ same-gender classmates’ proportion for each major for (1) all courses, (2) in-department courses, and (3) out-of-department courses.
Ordinary Least Squared Regression (OLS) Model
We use student-by-course OLS regression models to examine whether the proportion of a student’s classmates that share his/her gender is associated with certain demographic characteristics and to examine how much variation can be explained by these demographic factors. We use the following model:

In Equation [1],
In the analysis, we estimate models separately for female students and male students. Separating the analyses by gender identity allows us to have a clearer understanding of patterns of sorting. For example, if male students tend to take classes with peers who have higher pre-college academic performance, and female students with peers who have lower pre-college academic performance, the proportion of classes taken with high average pre-college academic performance will be predictive of more same-gender classmates for male students and fewer same-gender classmates for female students. A pooled model might mask both dynamics and fail to show important relationships.
Major Fixed-Effect Models for Different Courses
Given that the classmates a student encounters are largely decided by the student’s major, we next include major fixed effects in the analysis and observe the change to the percent of variation explained (i.e., the r-squared) by student sorting into majors.
Equation [2] shows the major-fixed effect model. It includes an additional term as compared to equation [1],

A major goal of this study is to document how much gender sorting there is within majors and how different types of courses explain this variation. A concern with the analyses presented in Equation [2] is that the remaining variation after major fixed-effect could be due to the classes a student is taking outside-of his/her home department; two students in the same major could have very similar peers in the in-department classes they take, but very different peers in their out-of-department courses for general education or elective courses. To explore the extent to which these out-of-department courses might be contributing to unexplained variation, we repeat the final set of analyses (those presented in Equation [2]), focusing solely on in-department courses. This allows us to examine the level of variation in the proportion of students’ same-gender classmates within their major, specifically in these in-department classes. For comparative purposes, we perform the same analysis for out-of-department courses.
Findings
Variation in the Proportion of Same-Gender Classmates
We first examine how much variation exists in the proportion of same-gender classmates across students in our sample. Figure 1 shows the kernel density distribution of the proportion of same-gender classmates for both female and male students using the student-by-course data. The theoretical range for the horizontal axis extends from zero (0% same-gender classmates) to one (100% same-gender classmates). The mean and standard deviation for the proportion of same-gender classmates (see Table 2) for female students are 0.60 and 0.16. Male students have a slightly wider distribution with a mean of 0.53 and a standard deviation of 0.20.

Kernel Density Distribution of the Proportion of Same-Gender Classmates for Female and Male Students
From the shape of the distribution, we can observe that the distribution of the proportion of same-gender classmates among male students is less concentrated around the mean, showing a bimodal distribution. The proportion of same‑gender peers concentrates around 40% and 80%. For female students, the distribution is slightly left-skewed and is concentrated around 60%. In the sample, 54% of students identify as female. If students were randomly assigned to courses, a male student would be expected to have 46% same-gender peers, while a female student would be expected to have 54% same-gender peers. According to Figure 1, female students experience course compositions that are around the mean of approximately 60% (6% higher than expected). For male students, we observe a bimodal distribution. A large proportion of male students have around 40% male classmates, while there is another peak of around 80% male classmates. These patterns indicate the existence of gender segregation in students’ course-taking patterns. Through enrolling in different courses, driven by a combination of curricular constraints and personal preferences, students are sorted into environments that are different from the overall gender composition of the campus.
This overall figure could mask the differences in the patterns across students’ year of study. We further examine these patterns by disaggregating the overall distribution by year of study (e.g., students in their second year of enrollment). Online Supplemental Appendix Figure A1 shows how the distribution differs across students’ first, second, third, fourth, and fifth years in university. These distributions show that the bimodal trends for male students become more prominent in their later college years, and that there is a relatively similar trend for female students across college years.
The bimodal distribution for male students may come from the difference between students in STEM and non-STEM majors, given the well-documented gender segregation at major-level. online Supplemental Appendix Figure A2 presents separate panels for STEM and non-STEM majors. The separate panels suggest that, for male students, the bimodal pattern is primarily driven by those in STEM majors instead of by the differences between STEM and non-STEM majors. For female students in STEM majors, there is not a bimodal distribution but there is a very thick left tail, with a significant portion of female students having a low proportion of female peers, ranging from around 10% to 40%. The following section will help us better understand how majors play a role in the proportion of students’ same-gender peers.
Do We See More Gender Segregation in Certain Demographic Groups?
In this section, we examine if the proportion of a student’s classmates who are their same gender can be explained by sociodemographic characteristics. Columns 1 and 2 in Table 3 present the results from ordinary least squared (OLS) regression models in which the outcome is a student’s proportion of same-gender classmates in a given course. The predictors include students’ demographic characteristics: race/ethnicity, age, first-generation college student status, low-income status, international student status, transfer student status, pre-college academic performance, and sets of cohort and year-of-study fixed effects. We present the results for female and male students separately.
Results of Ordinary Least Squares Models, Major Fixed-Effect Models on the Proportion of Students’ Same-Gender Classmates for All Courses

Note. This analysis uses student-by-course records; Standard errors in parentheses.
p < 0.05 **p < 0.01 ***p < 0.001.
Gender segregation differs across demographic groups. On average, both female and male international students, older students, and students with higher pre-college performance all have a lower proportion of female classmates compared to their counterparts who are non-international students, younger, or have lower pre-college performance. Specifically, female international students have 4.9 percentage points fewer female classmates than domestic female students, while male international students have 2.9 percentage points more male classmates than their non-international counterparts. Regarding differences by ethnic group, Asian female students have 2.4 percentage points fewer female classmates compared to their white counterparts. Similarly, Asian, Latino, and Black male students, all have a lower proportion of male classmates compared to their white counterparts. Furthermore, female transfer students, on average, have 1.5 percentage points fewer female classmates, while no significant difference has been observed for male transfer students.
How Does the Proportion of Same-Gender Classmates Vary across Majors?
Given that past work has demonstrated significant gender segregation across fields of study in higher education (Barone, 2011), we first descriptively examine the proportion of students’ classmates who are the same gender by major. We present the results for the largest majors in Figure 2. 3 In this figure, each bar presents three data points: proportion of students’ same-gender classmates at the 10th percentile, the median, and the 90th percentile in that major (each of these statistics is shown in the first three columns in online Supplemental Appendix B).

Bar Graph Representing the Distribution of the Proportion of Same-Gender Classmates by Gender for All Courses
Two features stand out in Figure 2. First, echoing past work, the figure shows that students in certain majors have substantially different proportions of same-gender classmates compared to other majors. For example, female students in Mechanical Engineering at the median have 19% female peers, compared to 72% for female students at the median in Psychology and Social Behavior. Major choice is indeed consequential in determining students’ classmates gender composition. Second, while there are large differences between certain pairs of majors, many majors are tightly clustered and have similar medians. For example, the medians across eight majors, from Chemistry to Biological Science, fall within a 10-percentage-point range. Differences across three-quarters of the majors listed are within a 20-percentage-point range; students from different majors could end up having a similar proportion of same-gender classmates.
We formalize these results by estimating major fixed-effect models. By comparing the percentage of variation being explained by models with only demographic predictors (R-squared values in columns 1 and 2 in Table 3) to the percentage explained by major fixed-effect models (R-squared values in columns 3 and 4 in Table 3), we can examine how much of the overall variation is explained by gendered sorting into majors.
Major choice explains much of the gender sorting we observed. From the original OLS model that controls for only student-level demographic characteristics (shown in columns 1 and 2 in Table 3) to the major fixed-effect models (shown in columns 3 and 4 in Table 3), we explain an additional 35% of the variation for female students and 48% of the variation for male students. This highlights the substantial role that a student’s major plays in predicting the gender composition of their classmates. Its explanatory power is 9 times that of all other student-level characteristics, such as race/ethnicity and pre-college performance, for female students and 13 times that of these characteristics for male students.
Within-Major Variation in the Proportion of Same-Gender Classmates
Another important finding presented in Figure 2 is that there is considerable variation within majors, and the amount of variation differs across majors. The range of distance between the 10th percentile and the 90th percentile ranges from 21% (Pharmaceutical Sciences) to 46% (Computer Science) for female students and ranges from 20% (Pharmaceutical Sciences) to 43% (Computer Science) for male students. Online Supplemental Appendix B includes detailed statistics for each major. This variation indicates that the structure of majors and the degree of freedom of curricular choice within majors can lead to quite variable experiences for students in the same major.
Significantly, the variation of same-gender classmates within each major is almost commensurate with the differences in median values observed across the majority of fields, except those exhibiting the most severe gender imbalances. This comparison suggests that the student experience regarding classmate gender composition can exhibit substantial heterogeneity, even within a single major.
The results of major fixed-effect models (columns 3 and 4 in Table 3) indicate that there exists substantial variation remaining within majors. Although the variation in students’ same-gender classmates’ proportion has been explained substantially by students’ major choices, considerable variation remains unexplained (61% variation for female students; 48% variation for male students). This indicates that even within majors, there is still variation in the proportion of same-gender classmates as discussed in the previous section of Figure 2.
The major fixed effect models in Columns 3 and 4 in Table 3 allow us to examine whether there are still differences across groups of students even after controlling for student major choices. In these models, which compare students in the same major, we still see more gender segregation in certain groups of students. Some patterns observed in the initial OLS models persist in major fixed-effect models, although with smaller coefficients.
Within majors, students with higher pre-college performance and international female students are still more likely to have a lower proportion of female classmates compared to their counterparts: those with lower pre-college performance and domestic female students, respectively. Unlike the models without major fixed effects, we no longer observe the significant differences for older students and male international students, compared to their respective counterparts. In terms of differences by ethnic group, Asian female students continue to have a lower proportion of female classmates compared to their white counterparts. Unlike the previous results, Latino/a students both have a higher proportion of female peers within majors. Another new pattern that emerges is that male students classified as low-income are more likely to have a higher proportion of female classmates.
We further apply restrictions to the major fixed-effect model, focusing solely on student in-department courses, and the corresponding results are presented in the first two columns of Table 4. For female students, 72% of the variation in the proportion of their same-gender classmates is accounted for, while this figure rises to 84% for male students. Notably, substantial unexplained variation persists even when focusing solely on in-department courses. For female students, a quarter of the total variation remains unexplained, and for male students, 16% of the total variation remains unexplained.
Results of Major Fixed-Effect Models on the Proportion of Students’ Same-Gender Classmates for In-Department Courses and Out-Of-Department Courses

Note. This analysis uses student-by-term-by-course records; Standard errors in parentheses.
p < 0.05. **p < 0.01 ***p < 0.001.
Role of Classes Students Take outside Their Major
Figure 2 and results from major fixed-effect models show that there is considerable variation within majors, the remaining variation in the proportion of same-gender classmates for students in the same majors could be explained by a combination of gender sorting in major-required courses (particularly in majors with flexible requirements), and gender sorting in courses that fulfill non-major requirements, such as general education or elective courses.
We plot, for each major, three statistics (10th percentile, median, 90th percentile) related to the proportion of same-gender peers for both in-department courses and out-of-department courses in Figure 3. By comparing the solid line (in-department courses) and the dashed line (out-of-department courses), we can see that the distribution of same-gender classmates is relatively similar across majors for the out-of-department courses. For highly gender-segregated majors, out-of-department courses serve as a balancing force, bringing the proportion of students’ same-gender classmates toward the average campus level. In online Supplemental Appendix C, we apply the same analysis to the 18 largest majors, for which we manually coded major‑required courses rather than using in‑department courses as a proxy. The results remain consistent.
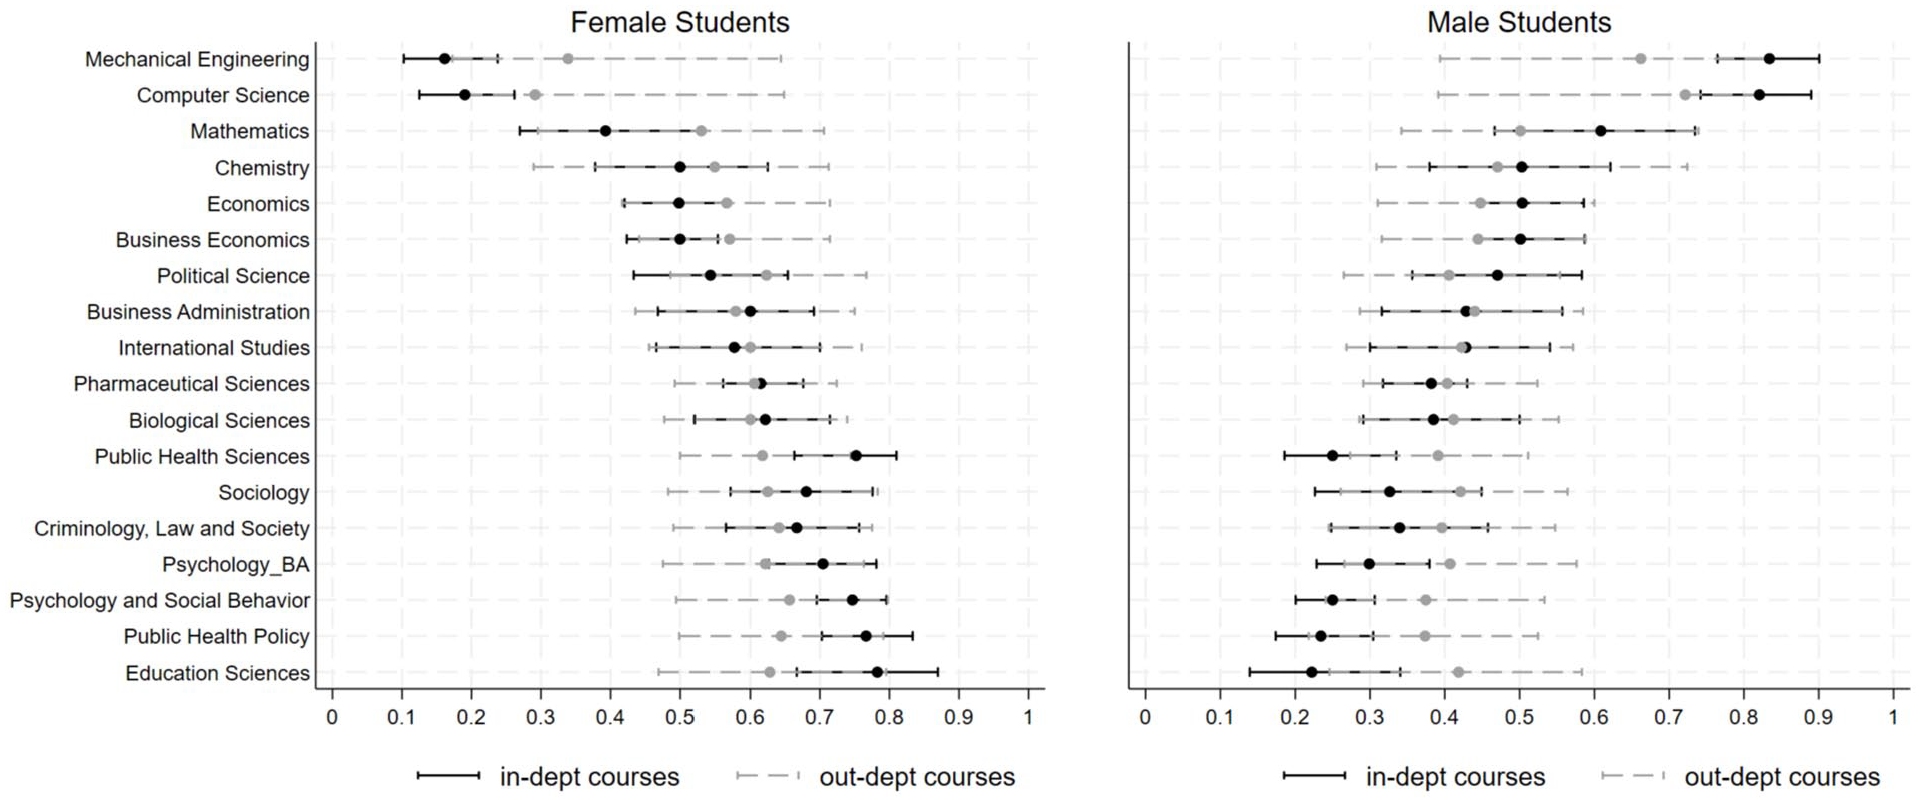
Bar Graph Representing the Distribution of the Proportion of Same-Gender Classmates by Gender for In-Department and Out-of-Department Courses
In-department courses play a more decisive role in the proportion of students’ classmates who are their same gender, as compared to out-of-department courses. However, even within in-department courses, there is substantial variation in the proportion of same-gender classmates. For example, among female students in Political Science, some students have 43% female classmates in their in-department courses while some have 65% female classmates. The large within-major variation indicates that students have some degree of choice. Even within the courses taken in their home department, students’ course choices might lead to sorting along gender lines. Considering the concern that in-department courses may display a pattern that varies significantly from that of actual major-required courses, we also replicated the bar graphs using manually coded major-required data (see online Supplemental Appendix Figure C4 and Figure C5). The patterns show some differences for majors disproportionately dominated by one gender, detailed discussion can be found in online Supplemental Appendix C.
In columns three and four of Table 4, we present another set of major fixed-effect models, focusing exclusively on students’ out-of-department courses. As expected, major fixed-effects account for a modest proportion of the variation in the proportion of same-gender classmates for both female and male students. This figure is less than 30%, a stark contrast to the over 70% of variation explained for in-department courses (see columns 1–2 in Table 4).
Conclusion
Horizontal gender segregation in higher education has garnered significant attention in recent decades (R. B. Baker et al., 2022; Charles & Bradley, 2002; Ferrare, 2013; Gerber & Schaefer, 2004; Iannelli et al., 2018). Female and male students persistently sort into different fields of study, which leads to differential access to peers, occupational segregation, and income gaps. Prior studies have concentrated on gender segregation across majors. While the role of choice of major as a determinant of segregation is very important, focusing on the major as a level of analysis masks the gender segregation within majors at the course level, the context at which actual learning and social interactions occur. This study extends the horizontal sorting literature by providing evidence about gender segregation at the course level within majors. Specifically, we use data from five cohorts of students at a selective public four-year university in the American West to examine how much variation in the proportion of students’ same-gender classmates can be explained by students’ demographic characteristics, major, as well as the remaining variation that occurs within each major.
Variation in the proportion of students’ same-gender classmates exhibits different patterns in courses from students’ home department and out-of-department courses. More differences exist in the medians of students’ proportion of same-gender classmates across majors in in-department courses. However, for students from the same major, there is more variation in the proportion of same-gender classmates for the classes students take outside their department than inside their department. This indicates that while a student’s choice of major is highly determinative of the peers to whom they are exposed, course choice within the department, and, perhaps even more, course choice outside the department (through electives and general education requirements), are additional factors associated with peer composition. The highly overlapping distributions for out-of-department courses across majors shown in Figure 3 suggest the role of out-of-department courses in balancing students’ same-gender classmates proportion in highly gender-segregated majors. For example, female students in Mathematics have a median of 39% of female classmates in their in-department courses but have a median of 53% of female classmates in their out-of-department courses, which leads to 47% of female classmates in their overall courses.
We examine how different factors account for the observed variation: students’ demographic characteristics alone explain 4% of the overall variation for female students and 4% for male students. Echoing past work, we find that major choice plays a significant role in predicting variation in peer composition: it accounts for half of the variation in the proportion of same-gender classmates for male students and one-third for female students. This significant role may take effect through the fixed required courses shared by students within the major. These courses are mandatory for students in that major and are generally difficult for students from other majors to enroll in.
However, if we simply look at the gender composition at the major level, it could mask the variation around this mean, which is jointly affected by curricular structures and course choices, etc. For example, let’s consider students in Computer Science and Mathematics. Around 21% of students in Computer Science are female. This is a statistic we’ve calculated from student-by-term records, accounting for students who have changed majors. In contrast, Mathematics has a 46% female student population. Interestingly, as shown in Figure 2, almost 40% of female students in Computer Science have a proportion of female peers comparable to that of female students in Mathematics. Major choice is predictive of the gender composition of peers but is far from determinative.
We also find that classes taken outside of students’ home department do not fully explain this variation. Focusing on only in-department courses, there is still 28% of variation unexplained for female students and 16% for male students. We demonstrate that gender sorting not only exists across majors but also exists across courses within majors.
Gender sorting shows different patterns for students from different demographic groups, even after we control students’ major choices. For example, Asian female students (compared to white female students) and international female students (compared to non-international female students) have a lower proportion of female classmates. For male students, Latino students (compared to white students) and low-income students (compared to non-low-income students), are associated with lower proportions of male classmates. Students with higher pre-college performance are associated with lower proportion of female classmates.
Discussion
Given the observed relationship between certain student demographic characteristics and gender sorting, the generalizability of our findings may be limited by UCI’s unique demographic composition. We examine how likely this pattern is to differ substantially at other institutions. Compared to other public universities, UCI has a higher proportion of Hispanic and Asian students and a lower proportion of white and Black students, as shown in Table D1 in the online Supplemental Materials. Given prior research indicating that Asian students are overrepresented in STEM majors, this demographic factor may contribute to a more pronounced bimodal distribution for male students in gender sorting across majors. For female students, the higher proportion of Asian students in STEM may increase female representation in these fields and, in turn, mitigate gender sorting across majors.
To further examine whether UCI’s demographic composition plays a distinctive role in gender sorting relative to other institutions, Table D2 compares gender composition across fields of study at UCI with national data. The comparison shows no consistent differences between UCI and the national sample in gender sorting into STEM and non-STEM. For example, in Computer and Information Sciences and Physical Sciences, UCI has approximately 7% more women among BA degree completers, yet UCI also has a higher proportion of women earning BA degrees in non-STEM majors such as Social Sciences and Business. Overall, these comparisons suggest that although the focal university’s racial and ethnic composition differs from the national sample, this difference is unlikely to play a distinctive role in the gender sorting patterns presented in this study. However, institutions with substantially different gender compositions may exhibit different gender sorting patterns. Moreover, when the method is applied to analyze racial or ethnic sorting, different racial/ethnic compositions can play a more important role. Future empirical or simulation studies should further explore how institutional composition interacts with student sorting.
We know from past research that a number of factors predict student course choices (e.g., instructor gender, reputation, and classroom climate) (Brown & Kosovich, 2015; Galotti & Umscheid, 2019). Future study should consider incorporating more nuanced course-level features to capture students’ course-choice behaviors. This study does not explicitly examine how course content might lead to sorting within majors. Within the requirements for any given major, students have the ability to select courses that might vary substantially in subject matter. Future work could explicitly examine gendered preferences for course content. In-depth interviews with students could examine this with individual students or large-scale text-mining exercises could look for patterns using course descriptions (Harrison et al., 2022).
Also, a major limitation of our study is that it does not include student voices. We are not able with administrative data alone to understand fully the mechanisms underlying students’ major and course choices. For example, it is not clear why Asian students, compared to their white peers in their same major, have fewer female classmates on average. This study provides us information about what predicts students’ same-gender classmates’ proportion and hopefully will serve as a catalyst for more nuanced qualitative work in the future.
Another interesting result which could be further studied is that in the models with major fixed-effects, more variation is explained in models for male students than in models for female students. This result echoes findings in Mann and DiPrete (2013), which indicate that even within STEM fields, female students exhibit a more diverse range of curricular choices compared to their male counterparts. A relevant explanation could be that female students are concentrated in majors with greater flexibility in major requirements, so students in the same major could take different courses to fulfill major requirements. As shown in online Supplemental Appendix Table C5, besides majors that have similar proportions of female and male students, a higher proportion of female students are in majors such as Public Health Sciences with 22% of all courses in in-department courses, while a higher proportion of male students are in majors, such as Mechanical Engineering with 58% of in-department courses. Future analysis can dig deeper into the gender differences in factors explaining student course peer gender composition.
Moreover, the methods presented in this study could be utilized to study how major choices and course choices affect the proportion of students’ classmates of other important student characteristics. We are calling for future research to focus on race/ethnicity and social class background as other potential components relevant to examining course composition and stratification. Similar analyses can also be applied to multiple universities to compare how different predictors of students’ peer composition may vary across schools with different cultures and institutional settings. Different student bodies (such as campuses with higher proportion of international or first-generation students) and varying curricular structures (such as fields of specializations and availability of honors programs across schools) may contribute to students sorting into courses in unique ways.
Implications
Demonstrating gender sorting both among and within majors deepens our understanding of horizontal sorting and gender segregation in higher education. By revealing another dimension of gender sorting within majors, this study can draw more research attention to the importance of understanding student experience at a student-by-course level. This perspective more accurately captures the real-time experiences of gender segregation that students face within their selected courses. Even within STEM majors, gender sorting still exists; certain groups of students are more likely concentrated in certain courses with different instruction, curricular content and student learning.
This study can help policymakers and university administrators recognize how the flexibility of course offerings affect student sorting. The flexibility of major requirements in higher education, elective courses, general education, and specialization, creates a broad range of curricular pathways as compared to K–12 education (Chaturapruek et al., 2021; McFarland, 2006). Online Supplemental Appendix Table C5 shows the average percentage of classes students took each term that were from their home departments separately for each of the listed majors. There is substantial variation across majors. For example, 82% of the courses students take each term in Mechanical Engineering are major-specific requirements; while for Education Sciences, only 45% of the courses students took each term are major-specific requirements. The remaining courses students took could fulfill elective requirements, general education requirements, or requirements for an additional major. The differences in the extent of structural constraints imposed by curricular requirements across majors allow different degrees of freedom for students to make their own course choices. Students’ preferences, and the role that social and psychological constraints can play, are affected by the structure of curricular requirements. More flexible structures provide students with greater options in terms of curricular choices, but may also lead to greater sorting.
In our study, we reveal that gender sorting occurs not only across majors but also within majors. This horizontal gender sorting has important implications for labor market disparities. When female students are disproportionately concentrated in specializations or courses with fewer technical skills or less training valued by the labor market, they may have lower wages and a narrower range of occupation choices. Moreover, if female students have primarily female peers, the homogeneous social capital can be more likely to channel them into female-dominated careers, further deepening labor market inequalities. Understanding the factors associated with course-level gender can help us develop potential interventions to create a more diverse and equitable academic experience.
Supplemental Material
sj-docx-1-ero-10.1177_23328584251355604 – Supplemental material for Same Major, Different Peers: Gender Sorting Across and Within Majors
Supplemental material, sj-docx-1-ero-10.1177_23328584251355604 for Same Major, Different Peers: Gender Sorting Across and Within Majors by XunFei Li, Rachel B. Baker and Richard Arum in AERA Open
Footnotes
Acknowledgements
We thank our research assistants (Jessica Cai, Christina Thao Mi Dinh, Alec Aldwin D. Santiago) for their work on the major requirement data. We are grateful for insightful feedback from Emily K. Penner, Fernando Rodriguez, Greg J. Duncan, Andrew Penner, participants at the 2022 RC28 meeting at the London School of Economics, and participants at the 2024 AEFP conference in Baltimore.
Declaration of Conflicting Interests
The author(s) declared no potential conflicts of interest with respect to the research, authorship, and/or publication of this article.
Funding
The author(s) disclosed receipt of the following financial support for the research, authorship, and/or publication of this article: We also thank the support from Andrew W. Mellon Foundation (grant numbers: 1806-05902, 2011-09741) and the Office of the Provost at UCI.
Research Ethics Statement
This study uses deidentified administrative data, which has been approved by the institutional review board.
1.
Since the non-binary gender option was not added until Fall 2019, only 0.33% of students identify as gender non-binary.
2.
Year-of-enrollment represents the accumulated years students have enrolled in the university, it captures the difference in college experience among students from different grades. Cohort indicates the year students firstly enrolled in the university; it captures the time trend across different cohorts.
3.
We indicate STEM fields with triangles, and non-STEM fields with circles.
Note:This manuscript was accepted under the editorial team of Kara S. Finnigan, Editor in Chief.
Authors
XUNFEI LI is a postdoctoral scholar at the School of Education, University of California, Irvine, Suite 3200, 401 E. Peltason Drive, Irvine, CA, 92617; email:
RACHEL B. BAKER is an associate professor at the Graduate School of Education, University of Pennsylvania, 3700 Walnut Street, Philadelphia, PA 19104; email:
RICHARD ARUM is professor of sociology and education at the University of California, Irvine, Irvine, CA 92697; email:
References
Supplementary Material
Please find the following supplemental material available below.
For Open Access articles published under a Creative Commons License, all supplemental material carries the same license as the article it is associated with.
For non-Open Access articles published, all supplemental material carries a non-exclusive license, and permission requests for re-use of supplemental material or any part of supplemental material shall be sent directly to the copyright owner as specified in the copyright notice associated with the article.