
Abstract
The COVID-19 pandemic and school closures adversely affected adolescents’ mental health and well-being, with the weight of evidence indicating worse outcomes for students attending school remotely or in a hybrid modality compared to fully in person. We leverage survey data from the Adolescent Brain Cognitive DevelopmentSM Study (ABCD Study®) collected from 6,245 adolescents (mean age = 13.2) during the 2020–2021 school year to investigate the moderating effects of race/ethnicity, household income, and neighborhood disadvantage on the relationship between 2020–2021 school modality and outcomes including perceived stress, sadness, and positive affect. For relatively advantaged students, our results corroborate prior findings that students in remote or hybrid schooling report worse mental health outcomes than students who attended fully in person. However, this pattern between schooling modality and mental health disappears or reverses for relatively disadvantaged students. Given substantial within-group variation, these findings underscore the importance of considering varied student needs in developing mental health supports.
Keywords
The COVID-19 pandemic was a multisystemic stressor that had well-documented, devastating effects on United States youth across multiple domains (Gross & Hamilton, 2023; Lewis & Kuhfeld, 2023; Masten et al., 2020). Nearly all US schools closed for in-person learning in March 2020 for the remainder of the 2019–2020 school year. The 2020–2021 school year was marked by wide variation in students’ school modality: some schools were open for fully in-person instruction, others only offered remote instruction like they had the previous spring, and others offered some mixture of the two (Centers for Disease Control and Prevention, 2023). Research suggests that preexisting achievement gaps widened (Cohodes et al., 2022; Lewis & Kuhfeld, 2023) and adolescent mental health worsened (Gross & Hamilton, 2023; Jones et al., 2022) during the 2020–2021 school year, with many experts linking remote schooling to the negative academic and mental health outcomes (Jack et al., 2023; Saulle et al., 2022). Additionally, available evidence shows that the pandemic’s physical and mental health effects were not evenly felt along lines of race/ethnicity, income, or neighborhood (Mackey et al., 2020; Xiao et al., 2022).
However, our understanding of the ways demographic and neighborhood characteristics moderated school modality effects during that period, particularly for mental health outcomes, is relatively sparse. Since schools are often critical areas of access to resources for students from under-resourced areas (Diao et al., 2016) and may protect against the most harmful pandemic mental health effects by facilitating meaningful connections among students (Jones et al., 2022), we might expect remote schooling to be especially stressful for lower-income and/or historically marginalized student groups. At the same time, the pandemic was disproportionately prevalent and deadly among lower-income and historically marginalized groups (J. Chen & Krieger, 2021), so it is similarly plausible that a return to in-person instruction could be especially stressful for less-advantaged students and families, since students might perceive being in person with their peers to increase their risk of infection.
Understanding how student and neighborhood characteristics moderated school modality effects on students’ mental health thus promises to provide a more complete picture of how the pandemic impacted students. This understanding could allow decision-makers to better support students throughout their schooling and to adapt responses to any similar multi-systemic stressors in the future to be more responsive to students’ contexts.
In this paper, we leverage longitudinal data from the Adolescent Brain Cognitive DevelopmentSM Study (ABCD Study®) to provide a novel description of adolescent mental health and emotional well-being during the 2020–2021 school year. Specifically, we address the following research question: To what extent did adolescent students’ positive affect, sadness, and perceived stress during the 2020–2021 school year differ based on access to in-person learning, and how did demographic and neighborhood characteristics moderate those differences?
The ABCD Study®, the largest longitudinal study of brain development in the United States, was already underway prior to the onset of the pandemic and had the infrastructure in place to survey adolescents repeatedly about their well-being as the pandemic unfolded. We utilize this rich dataset to describe how adolescent well-being varied by school modality. Although many have documented adolescents’ differential pandemic experiences, this paper makes a novel contribution in this space because the data were collected directly from adolescents (i.e., not their parents) in real time (i.e., not retrospectively), include measures of school modality at those same time points to allow the mapping of responses to individuals’ school modality over time, and include a rich set of characteristics that allow us to better understand how modality patterns differ across student groups. These data allow us to paint a more detailed picture of adolescent mental well-being during the pandemic than many previous studies of this topic. Additionally, much work on adolescent well-being across the pandemic has focused on individual-level and family-level variables; we also incorporate a neighborhood-level lens in our analysis, allowing for a deeper understanding of how school modality differences in adolescents’ positive affect, sadness, and perceived stress varied across multiple levels of their ecosystem.
Here, we situate this paper in the context of existing conversations around adolescent mental health during the pandemic.
Literature Review
Although there were strong public health reasons for closing schools during the pandemic, evidence suggests that remote schooling was generally lower quality than in-person schooling across multiple domains, such as interactions with teachers (Constantinou & Carroll, 2023), and was associated with worse learning outcomes (e.g., Goldhaber et al., 2022; Jack et al., 2023), behavioral outcomes (Levitt et al., 2022), and mental health outcomes (described in more detail later). We begin the literature review by discussing adolescent mental health during the pandemic, underscoring the importance of situating mental health outcomes in context. We then highlight research on unequal access to in-person learning during the 2020–2021 school year, motivating our interest in school modality as our key contextual predictor and potential driver of inequity. We then discuss how school modality is related to adolescent mental health during the pandemic and describe the critical conceptual and methodological gaps in this literature that our study fills.
Adolescents’ Perceived Stress, Positive Affect, and Sadness During the Pandemic
Existing literature generally shows that the pandemic exacerbated the preexisting, years-long trend of declining mental health for US adolescents, but these effects differed across groups (Parenteau et al., 2023). For example, a set of studies using the ABCD Study reported that negative mental health outcomes, including COVID-related stress and worry, were associated with lower socioeconomic status, experiences of racism, being female, being non-White, being from a disadvantaged neighborhood, and having pre-pandemic internalizing symptoms (Argabright et al., 2022; Kiss et al., 2022; Stinson et al., 2021; Xiao et al., 2022; Yip et al., 2022).
One 2022 systematic review of 104 studies of mental health impacts of COVID-19 on students found that all groups of students suffered increased anxiety and depression symptoms during the first years of the pandemic, with about one in five students in reviewed studies meeting clinical criteria for anxiety and between 14% and 33% meeting criteria for depression (Naff et al., 2022). Older students, female students, and LGBT+ students had higher anxiety symptoms and greater concerns for the future, as well as greater depression and anxiety symptoms compared to students from other groups. In addition, a 2023 systematic review of 25 studies of the effects of social determinants of health on adolescent mental health found that higher neighborhood violence, lower neighborhood safety ratings, and lower individual-level socioeconomic status were associated with worse youth mental health during the pandemic (Tall & Biel, 2023). These findings all point to increased mental health challenges and systematic disparities in pandemic mental health outcomes in the population, using both diagnostic and symptom-based measures, underscoring the importance of situating students’ perceived stress, positive affect, and sadness in context in our study.
Access to In-Person Learning During the Pandemic
Access to in-person schooling was neither distributed uniformly in the population nor was it directly responsive to public health realities; for example, areas with the highest transmission rates were not necessarily the likeliest to be remote (Heise, 2023). Instead, schools with above-median proportions of Black students, Hispanic/Latino students, and county-level unemployment averaged between 10 and 20 additional days of virtual instruction compared to schools with below-median proportions of the same (Jack & Oster, 2023; Oster et al., 2021). Studying a nationally representative sample of US households, Haderlein et al. (2021) found that 40% of White respondents said their children attended school remotely compared to 60% of non-White respondents in November 2020 (these proportions dropped to 20% and 40%, respectively, by April 2021) and that 55% of the lowest-income respondents had students who attended school remotely compared to 45% of the highest-income respondents in November (these decreased to 40% and 25%, respectively, by April).
Less-advantaged groups were thus disproportionately represented in remote schooling during 2020–2021, and available evidence suggests that remote schooling led to worse academic, behavioral, and mental health outcomes for students (e.g., Jack et al., 2023; Levitt et al., 2022; Saulle et al., 2022). If this trend holds across student groups, it would be reasonable to conclude that COVID school closures compounded existing inequities. Available evidence is consistent with this pattern when it comes to learning outcomes (e.g., Goldhaber et al., 2022), but there is little research examining the extent to which learning modality effects on mental health outcomes vary across student and neighborhood groups.
Adolescents’ Pandemic Mental Health by School Modality
A systematic review of 12 studies conducted during the 2020–2021 school year found that school closures were associated with increased stress, anxiety and depression symptoms, and suicidal ideation (Saulle et al., 2022). One December 2020 survey study of 2,324 caregivers found that adolescents in remote schooling scored about .2 standard deviations higher on a validated measure of emotional and behavioral difficulties than those attending school in person (Hawrilenko et al., 2021), but a different survey of 701 caregivers in the same month found no association between remote schooling and parent-reported child stress (Sawyer et al., 2023). And in a fall 2020 nationally representative survey, one in four parents of students in remote schooling reported worse overall mental and emotional health for their student, compared to one in seven parents of students attending in person (Verlenden et al., 2021).
In fall 2020, two studies that surveyed adolescents about their mental health and emotional well-being found that students in remote schooling reported more negative outcomes than those in hybrid or fully in-person schooling, including being 2.5 times more likely to report frequent depressive symptoms and 3.5 times more likely to have considered suicide in the last year (Duckworth et al., 2021; Hertz et al., 2022). Measures of school and family connectedness were found to mitigate the relationship between remote schooling and poor mental health outcomes. In the Duckworth et al. study, families could select their child’s attendance modality in the district under study, so although the authors’ interpretation that remote schooling causes mental health problems could be the case, their data do not rule out the possibility that families with greater COVID-associated difficulties disproportionately chose to keep their students at home, attending school remotely.
Although these studies provide insight into the main effects of school modality on adolescents’ mental well-being, they are limited in ways that we are able to address in the current study. First, the previous studies discussed rely on cross-sectional data, giving insight into a single time point during the pandemic. Our data include four survey administrations over the course of the 2020–2021 school year, yielding repeated within-person measures of pandemic mental well-being by school modality. Because of rapidly evolving technologies, policies, and norms around pandemic-era schooling, including data from only one time point is a serious limitation; our repeated measures allow us to include time-varying controls and comparisons in our models to describe students’ experiences during 2020–2021 more completely than previous studies. Additionally, data in this study are self-reported by adolescents themselves, which may provide insight into symptoms or experiences that are difficult for parents to observe and yield insights into the youth’s own perception of their stress and mental health.
Finally, previous studies tend to focus on main effects of modality, with some including demographic and neighborhood characteristics as controls and others presenting only unadjusted main effects. However, it is plausible to imagine that modality effects on mental health may differ by demographic and neighborhood characteristics because the pandemic itself was unevenly felt along these lines (C. Chen et al., 2021). For example, remote schooling may have been especially stressful for lower-income students since school locations often provide access to resources (e.g., school meals, preventative medical care, high-speed internet access; Connected Nation, 2023; Diao et al., 2016; Hayhoe et al., 2021) to which such students may not otherwise have ready access. On the other hand, one could imagine in-person schooling to have been especially stressful for low-income students since the virus itself was more prevalent among low-income populations than high-income populations, and lower-income students may be likelier than their higher-income peers to live with an elderly family member (J. Chen & Krieger, 2021; Taylor et al., 2011). Prior research has found that less-advantaged students and their families were more likely to report worries about COVID than their more-advantaged peers (Marshall et al., 2022). Under such conditions, it is plausible that the experience of attending school in person with peers from hundreds of other households may have been more stressful than attending remotely.
These competing hypotheses show how in-person versus remote schooling could reasonably feel very different to different groups of students, and thus effects of school modality may be moderated by income, race/ethnicity, or neighborhood characteristics. Situating modality effects in demographic and neighborhood context in this manner may allow us to better understand the conditions that lead to worse student mental health and the supports that current students may need to recover from lingering negative pandemic impacts. This contextualized understanding may even facilitate more rapid and equitable allocation of supports in the event of any future catastrophe that requires widespread school closures.
Method
Data
Data are drawn from the ABCD Study®, a longitudinal study of adolescent brain development and health into which 11,880 children aged 9–10 in 2016–2018 were recruited through their schools from 21 metropolitan regions across the United States, each centered around a research institution responsible for data collection (Volkow et al., 2018) (Release 5.0; see Table 1 for a list of ABCD study data collection sites). The study recruited students from a probability sample of public and private elementary schools within 50 miles of the data collection site, central to the catchment region, stratified on school-level sociodemographic characteristics (Garavan et al., 2018). The study also recruited a small number of twin dyads for an embedded twin study using birth registries for areas near four data collection sites (Iacono et al., 2018).
Analytic and Overall ABCD Sample

Note. “Other” race/ethnicity includes students whose caregivers responded “no” to the question “Do you consider the child Hispanic/Latino/Latina?” and responded any of: American Indian/Native American, Alaska Native, Native Hawaiian, Guamanian, Samoan, Other Pacific Islander, Other Race, or who selected multiple responses to answer the question “What race do you consider the child to be? Please check all that apply.”
Although the ABCD Study sample was not designed to be nationally representative, the 21 catchment areas comprise over 20% of the US population of this age (Garavan et al., 2018; see Table 1 for a description of the full ABCD sample). The ABCD Study also includes a set of sampling weights designed to render the full ABCD sample observably similar to national benchmarks from the American Community Survey (Heeringa & Berglund, 2020). Due to nonrandom sampling, applying these weights does not render ABCD data nationally representative in a traditional sense but may make national comparisons more plausible.
Since the sampling weights included in the ABCD data are designed to render the full ABCD sample observably similar to national benchmarks, not the subset of students who responded to rapid-release COVID surveys and comprise our analytic sample, we derived a set of sampling weights for our analytic sample using the same population benchmarks and raking method described in Heeringa and Berglund (2020). Applying these weights successfully renders our analytic sample observably similar to national benchmarks for each of the variables used in deriving the weights (see Table 2). We applied these weights for all descriptive analyses and regression models. 1
Weighted and Unweighted Analytic Sample on Variables Included in Raking Step of Weight Generation
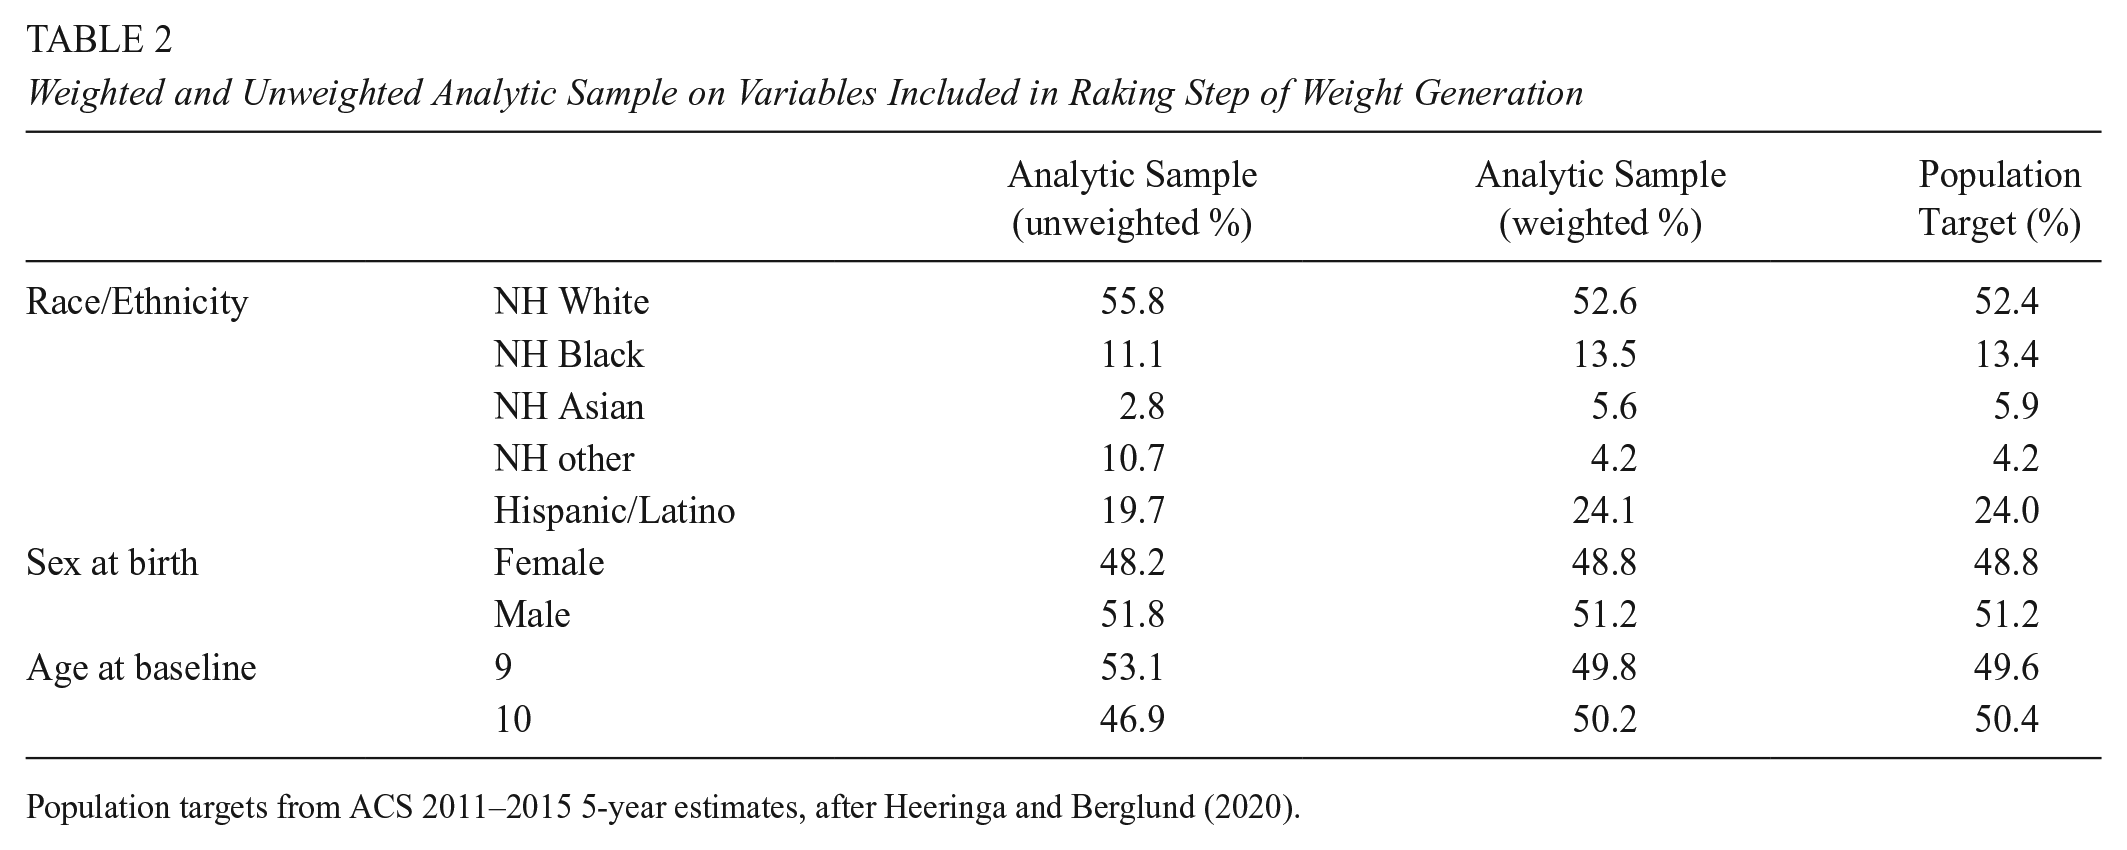
Population targets from ACS 2011–2015 5-year estimates, after Heeringa and Berglund (2020).
The study took and continues to take special steps to maximize engagement and facilitate trust between families from selected recruitment elementary schools and study staff in efforts to mitigate nonresponse bias and bias deriving from families’ choices to opt into the study in the first place (Feldstein Ewing et al., 2018; Hoffman et al., 2018). The ABCD Study obtained centralized institutional review board approval from the University of California, San Diego, and each individual study site also obtained local institutional review board approval. Parents/caregivers provided written informed consent, and children gave written assent for participation in the ABCD Study.
The core ABCD Study includes in-person annual data collection visits that include survey, behavioral, and cognitive batteries as well as biennial neuroimaging data collections. When the COVID-19 pandemic broke out in the United States in early 2020, the ABCD Study designed and administered a series of seven “rapid release” electronic surveys every 1–3 months between May 2020 and May 2021. These surveys focused on how students and their parents were experiencing and coping with the pandemic and are the focus of our analysis. They were completed remotely, which allowed for data collection despite shelter-in-place orders and variability in return to in-person research across ABCD Study sites.
Analytic Sample
The first three rapid release surveys were administered during spring and summer 2020, when essentially all students either attended school remotely or were on summer break. There was little variation in school modality until the 2020–2021 school year (Jack & Oster, 2023), so we restrict our analysis to responses from the final four surveys, distributed in October 2020, December 2020, March 2021, and May 2021. We randomly selected one member of each family into the analytic sample, given that multiple families had more than one sibling enrolled. In total, our analytic sample contained 6,245 students, of whom 2,221 responded to all four rapid release COVID surveys during the 2020–2021 school year (1,168 responded to three and the remaining 2,856 responded to one or two). See Table 3 for sample sizes and descriptions by survey wave. Because not all students in our analytic sample responded to all four rapid release COVID surveys, sample sizes for each survey administration range from 3934 (63% of the analytic sample) to 4477 (72% of analytic sample). Despite this variation in sample size over time, the stability of the sample on observable characteristics across rapid release survey administrations (see Table 3) suggests that our analytic strategy of examining varying modality across rapid release COVID survey administrations is a reasonable one.
Analytic Sample by Survey Administration Wave

Table 1 describes the 6,245 students who comprise the analytic sample for this analysis. Of those students, about 40% reported attending school remotely in each survey during the 2020–2021 school year to which they responded, 30% reported attending at least partially in person during each survey to which they responded, and the remaining 30% reported variation in their schooling modality during that year (Table 1). Our analytic sample closely resembles the overall ABCD Study sample in terms of race, ethnicity, household income, and measures of neighborhood disadvantage, after applying weights. Respondents averaged 13 years of age as they responded to the surveys and are geographically diverse, with no more than 9% of the sample coming from any one baseline data collection site, and all sites contributing 2.4% or more of the sample.
Measures
Perceived stress
The first of three outcomes under study is adolescents’ perceived stress, as measured by the four-item Perceived Stress Scale (Cohen et al., 1983). Respondents reported the frequency with which each of four statements (e.g., “How often have you felt that you were unable to control the important things in your life?”) applied to them over the last month, on a five-point scale from “never” to “very often.” We calculated a total perceived stress score (maximum score = 16) by summing responses to the four items, after accounting for reverse-coded items. Internal reliability was acceptable in our sample (Cronbach’s α = 0.66), and scores ranged from 0 to 16 (M = 5.66, SD = 3.01). The Perceived Stress Scale was included in all four rapid-release COVID surveys under study, in October 2020, December 2020, March 2021, and May 2021.
Sadness/depression
The second outcome is adolescents’ self-report of sadness, as measured by an eight-item sadness/depression scale from the NIH Toolbox emotional assessment battery (Salsman et al., 2013). Respondents reported the frequency with which each of eight feelings (e.g., “I felt alone”) applied to them over the last week, on a five-point scale from “never” to “almost always.” We calculated a total sadness score (maximum score = 32) by summing responses to the eight items. Internal reliability was high in our sample (Cronbach’s α = 0.94) and scores ranged from 0 to 32 (M = 8.15, SD = 7.44). Sadness data were included in the second and fourth rapid-release COVID surveys under study, in December 2020 and May 2021.
Positive affect
The final outcome under study is adolescents’ positive affect, as measured by a nine-item positive affect scale from the NIH Toolbox emotional assessment battery (Salsman et al., 2013). Respondents reported the extent to which each of nine feelings (e.g., “I felt calm”) applied to them over the last week, on a three-point scale from “not true” to “very true.” In accordance with ABCD coding (e.g., see https://data-dict.abcdstudy.org/) and to be more consistent with the other outcomes under study, we coded the three points of this scale as 0, 2, and 4 (not 0, 1, and 2) and calculated a total positive affect score (maximum score = 36) by summing responses to these items. Internal reliability was high in our sample (Cronbach’s α = 0.89), and scores ranged from 0 to 36 (M = 24.21, SD = 8.65). Positive affect data were included in the first and third rapid-release COVID surveys under study, in October 2020 and March 2021.
School modality
Our measure of school modality is derived from a single item included in each rapid-release COVID survey: “In the past week, was your schooling taking place: online/school at home; in person; in person some days and online some other days; other.” Over the 2020–2021 school year, remote modality decreased from 64% to 33% of the sample, and in-person modality increased from 17% to 41% of the sample, with the remainder in hybrid modalities (see Table 3 for more detail).
Race/ethnicity
We use a five-category variable to describe students’ race/ethnicity (White, Black, Hispanic/Latino, Asian, Other). This race/ethnicity categorical variable is included in core ABCD data and is derived from a set of more granular race and ethnicity items asked of each student’s parent during baseline data collection, as described by Cardenas-Iniguez and Gonzalez (2024). Our analytic sample is 53% White, 14% Black, 24% Hispanic/Latino, 6% Asian, and 4% more than one race/ethnicity or another race/ethnicity. We include student race/ethnicity in our analysis as a potential moderator of school modality effects on our mental health outcomes.
Household income
We derived a six-category variable to describe students’ household incomes from the item “What is your total combined family income for the past 12 months?” Income categories for this analysis were: under $25,000, $25,000–$49,999, $50,000–$74,999, $75,000–$99,999, $100,000–$199,999, and $200,000 and up. This question was asked of parents during each core data collection period, and we used parents’ income reports from the 2020–2021 school year. For most respondents, therefore, we used income reported during the three-year or four-year follow-up. In cases where a parent reported twice during that school year, we randomly selected one, and if they had no reported income measure during that school year, we selected the reported income measure closest to the 2020–2021 school year.
Approximately 34% of our analytic sample came from households with income between $100,000 and $200,000, with the rest of the sample evenly distributed across the other five income categories, with 12%–14% in each. We include household income during the 2020–2021 school year in our analysis as a potential moderator of mental health differences by school modality. There were 96 individuals (1.5% of the analytic sample) who either did not know or refused to report their household income, so they were excluded from models that included income.
Neighborhood disadvantage
The ABCD Data Analysis, Informatics, and Resource Center geocoded respondents’ primary address during baseline data collection and assigned a US census tract and census tract-level variables (Fan et al., 2021). Based on prior literature (Hackman et al., 2021), we derived a single neighborhood disadvantage factor by applying confirmatory factor analysis to 5 census tract-level constructs frequently used in measures of disadvantage and not dependent on real estate markets (variables linked from the American Community Survey 5-year estimates, 2011–2015; CFI = .97, RMSEA = .14, SRMR = .028). The five variables, standardized to have mean = 0 and standard deviation = 1, were percent of residents with at least a high school diploma, median family income, unemployment rate, percent of families living below the federal poverty level, and percent of single-parent households. Our derived factor is included in analysis as a potential moderator of modality effects on mental health outcomes. 2 Neighborhood disadvantage scores in our analytic sample ranged from −1.17 to 3.80 (M = −0.09; SD = 0.69), with higher values indicating greater disadvantage.
Sex assigned at birth
During baseline data collection, parents answered the question “What sex was the child assigned at birth, on the original birth certificate?” Approximately 49% of our analytic sample was assigned female at birth. Although sex assigned at birth is not a focus of this study, we include this variable as a covariate in all models given its relationship with mental health in existing literature (Naff et al., 2022).
Age
Given documented relationships between adolescent age and mental health during COVID (Naff et al., 2022), we also include students’ age on the date of each COVID survey as a covariate in all models. Depending on survey administration, students were between 12.9 and 13.5 years old, on average.
Analytic approach
We started by describing school modality in our sample over time and by each of our moderators of interest (race/ethnicity, income, neighborhood disadvantage) using two-way tabulations. We also described how our mental health outcomes (perceived stress, sadness, and positive affect) changed over time in our sample.
We then began to address our research question by examining variation in mental health by modality, with and without potential moderators. Our data come from surveys nested within respondents. 3 Therefore, we started by partitioning the variance for each outcome within and between respondents, fitting a linear mixed-effects model for each outcome with a respondent-level random intercept. The respondent-level (level 2) variance made up a significant share of total variance for all outcomes according to a likelihood-ratio test, so we retained the respondent random intercept for analysis.
We accounted for clustering of survey administrations within respondents using respondent random effects instead of respondent fixed effects for a few reasons. Including respondent fixed effects in our models limits the variation used to generate estimates to only respondents who reported changes to school modality during 2020–2021. Our research question is concerned with the relationship between school modality and various mental health outcomes for adolescent students in general, not just for those whose school modality changed during 2020–2021. Less than one-third of our analytic sample reported a change in school modality in 2020–2021 (see Table 1), and the sample of students whose modality changed during 2020–2021 is observably quite different than the sample who only reported a single modality during 2020–2021 (see Appendix C, Table 1). Given concerns that accounting for clustering within students using fixed effects does not address our research question precisely and alters the composition of our sample along key observable characteristics, we included student random effects in all models for this analysis.
Respondents in these data are also clustered within schools, with schools clustered within districts and districts within study recruitment sites, which map roughly onto United States metropolitan areas (Volkow et al., 2018). The ABCD Study data include pseudo school IDs corresponding to the school participating students attended when recruited into the study in 2016 and 2017. However, it is unlikely that school IDs map onto the schools students attended when they filled out the rapid response COVID surveys in 2020–2021, since they would have been recruited into the study at ages 9–10 (when students typically attend elementary school) but not completed the rapid response COVID surveys until age 12–14 (when students typically attend middle school). In addition, only about half of the students in our analytic sample have nonmissing school pseudo IDs. We suspect this missingness is largely due to ABCD pseudo school IDs being masked for any school with fewer than 10 students enrolled in the study for confidentiality reasons (Adolescent Brain Cognitive Development Study, 2025), but there could be other factors contributing to this high missingness. For these reasons, we were not able to account for clustering of students within schools in our models.
The ABCD Study also includes pseudo district IDs at baseline. Although subject to the same limitations as school IDs (students may have moved districts between 2016–2017 and 2020–2021; pseudo IDs for districts with fewer than 10 students are masked), using these district pseudo IDs is more reasonable since many students do stay within the same district for elementary and middle school and since districts tend to be much larger organizations than schools, so a lower proportion of ABCD Study participants have masked district pseudo IDs. Still, when we accounted for clustering of students within districts in our models, we lost approximately one-fourth of our analytic sample due to masked or missing district pseudo IDs for students in less-common districts. For this reason, our main models do not include district pseudo ID variables, but we do provide sensitivity analyses accounting for clustering of surveys within students within districts (i.e., three-level mixed effects models) for all our main results in Appendix B, Tables 1–4. Results from these three-level models were substantively similar to results from our preferred, two-level models.
Finally, ABCD Study participants are clustered within study recruitment sites, which center around 1 of 21 research institutions administering the study. These sites span the United States, so they occupy a wide array of geographies and prevailing sociopolitical climates. Because the impacts of the COVID-19 pandemic varied meaningfully by geography and because school responses to the pandemic tended to be both geographically and politically situated (Hallas et al., 2021), we accounted for clustering of participants within study sites using a set of study site fixed effects. This choice ensured that our estimates were generated using within-site variation, increasing the likelihood that students whose school modalities differed were living in otherwise comparable policy contexts.
Given all of the previous discussion, we built models as shown in Equations 1a and 1b to answer our research question about how the relationship between our outcomes and school modality (1a) and about how that relationship varies with individual-level or neighborhood-level characteristics (1b).


Here, yij represents the outcome of interest (positive affect, sadness/depression, or perceived stress) in survey administration i for respondent j, modeij indicates a respondent j’s reported school modality at survey administration i (with remote modality as the reference category), charj represents an individual- or neighborhood-level characteristic of interest for respondent j (race/ethnicity, household income, or composite neighborhood disadvantage score),
In equation 1b, the modality coefficient (β1) describes levels of the outcome for the omitted category of proposed moderators (i.e., non-Hispanic White for race/ethnicity, $100,000–$199,999 for household income) and for areas with average composite neighborhood disadvantage, β2 describes varying levels in the outcome for key subgroups of interest who attended school remotely, and β3 represents the extent to which the relationship between school modality and the outcome varies by levels of the proposed moderator.
We fit 12 models in all, examining the extent to which pandemic school modality alone and in interaction with each of our three predictors of interest (race/ethnicity, household income, and composite neighborhood disadvantage) predict each of our three outcomes (positive affect, sadness/depression, perceived stress). In addition to these main models and to the three-level model mentioned previously, we also fit a similar set of models restricted only to those respondents with no missing data to assess the extent to which our findings may have been artifacts of selective completion of ABCD rapid-release COVID surveys. We also fit a similar set of zero-inflated binomial models for the sadness/depression outcome to assess the extent to which our findings may have been driven by relatively high proportions of “healthy” respondents (e.g., those who received the lowest possible score on the sadness/depression scale). Results from these supplementary models broadly align with the main results presented in the body of the paper and are available in Appendix B.
Results
School Modality in the Analytic Sample
Of the 15,310 total surveys that respondents in our analytic sample completed during the 2020–2021 school year, 24% were completed by students attending school fully in person, 55% by students attending entirely remotely, and 21% by students attending in a hybrid modality. During all survey administrations, substantial portions of the sample attended school in each modality. Because many schools reopened during the 2020–2021 school year, the proportion remote generally decreased across the school year (64% and 71% in October and December 2020, respectively, 51% in March 2021, 33% in May 2021; Table 3), and the proportion in person generally increased (17% and 15% in October and October and December 2020, respectively; 25% in March 2021; 41% in May 2021).
A greater proportion of surveys from White students indicated that the student was attending in person compared to other racial/ethnic groups (29% vs. 15% of surveys from Black students, 21% from Hispanic/Latino students, and 10% from Asian students). Conversely, a lesser proportion of surveys from White students indicated that the student was attending remotely compared to other racial/ethnic groups (45% vs. 74% from Black students, 66% from Hispanic/Latino students, and 73% from Asian students). Nearly all proportions for non-White groups were significantly different from those White students (p < .001). See Table 4 for details. Even within data collection sites, there was substantial variation in modality by student race/ethnicity (e.g., at the Yale collection site, 39% of survey responses from White students were in person compared to 27% of survey responses from Hispanic/Latino students and 15% of survey responses from each of Black and Asian students).
Modality by Race/Ethnicity

***p < .001.
Significance levels based on a multinomial logistic model of COVID modality (omitted reference category = hybrid) on race/ethnicity (omitted reference category = White).
The proportion of surveys indicating the student was attending entirely remotely tended to decrease as income increased (about 70% of surveys from lower-income students, about 50% from higher-income students), and the proportion of surveys indicating that the student was attending fully in person increased slightly as income increased (about 20% of lower-income students, about 25% of higher-income students). Most differences by income group reached statistical significance (p < .01). See Table 5 for details.
Modality by Household Income
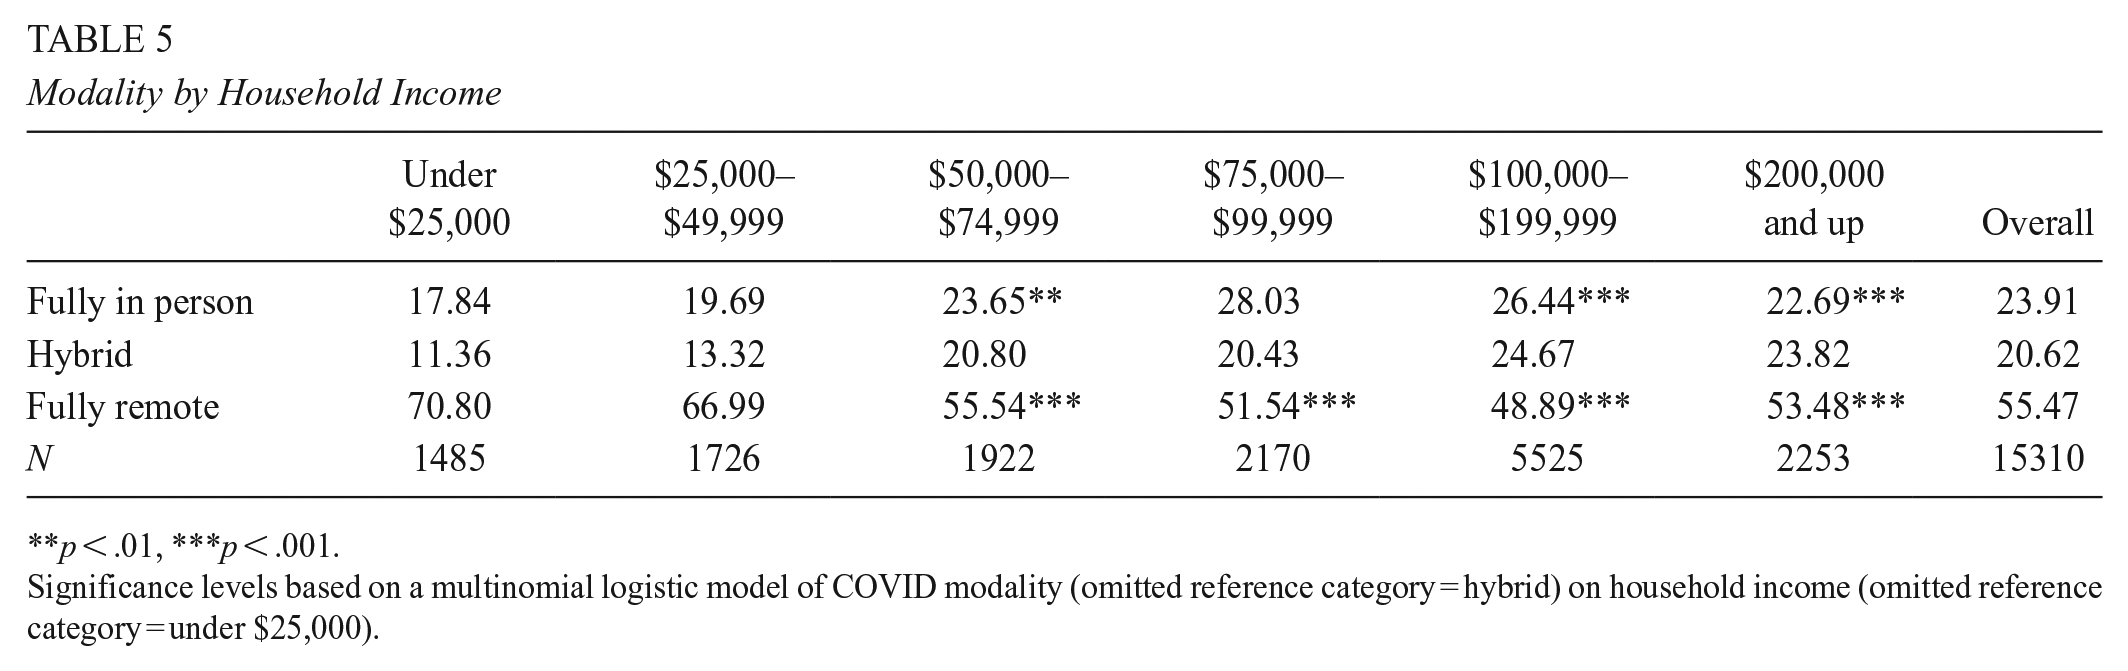
**p < .01, ***p < .001.
Significance levels based on a multinomial logistic model of COVID modality (omitted reference category = hybrid) on household income (omitted reference category = under $25,000).
Finally, the proportion of surveys indicating the student was attending remotely increased as neighborhood disadvantage increased (from just under 50% for the most-advantaged quartile to just under 70% for the least-advantaged quartile; Table 6) and the proportion indicating that the student was attending in person did the opposite (about 25% of surveys from the most-advantaged quartile of neighborhoods in person, about 20% from the least-advantaged quartile). We did not find significant modality differences between the two most-advantaged quartiles, but the two least-advantaged quartiles were significantly more likely to be remote and less likely to be in person (most p < .001). See Table 6 for details.
Modality by Neighborhood Disadvantage
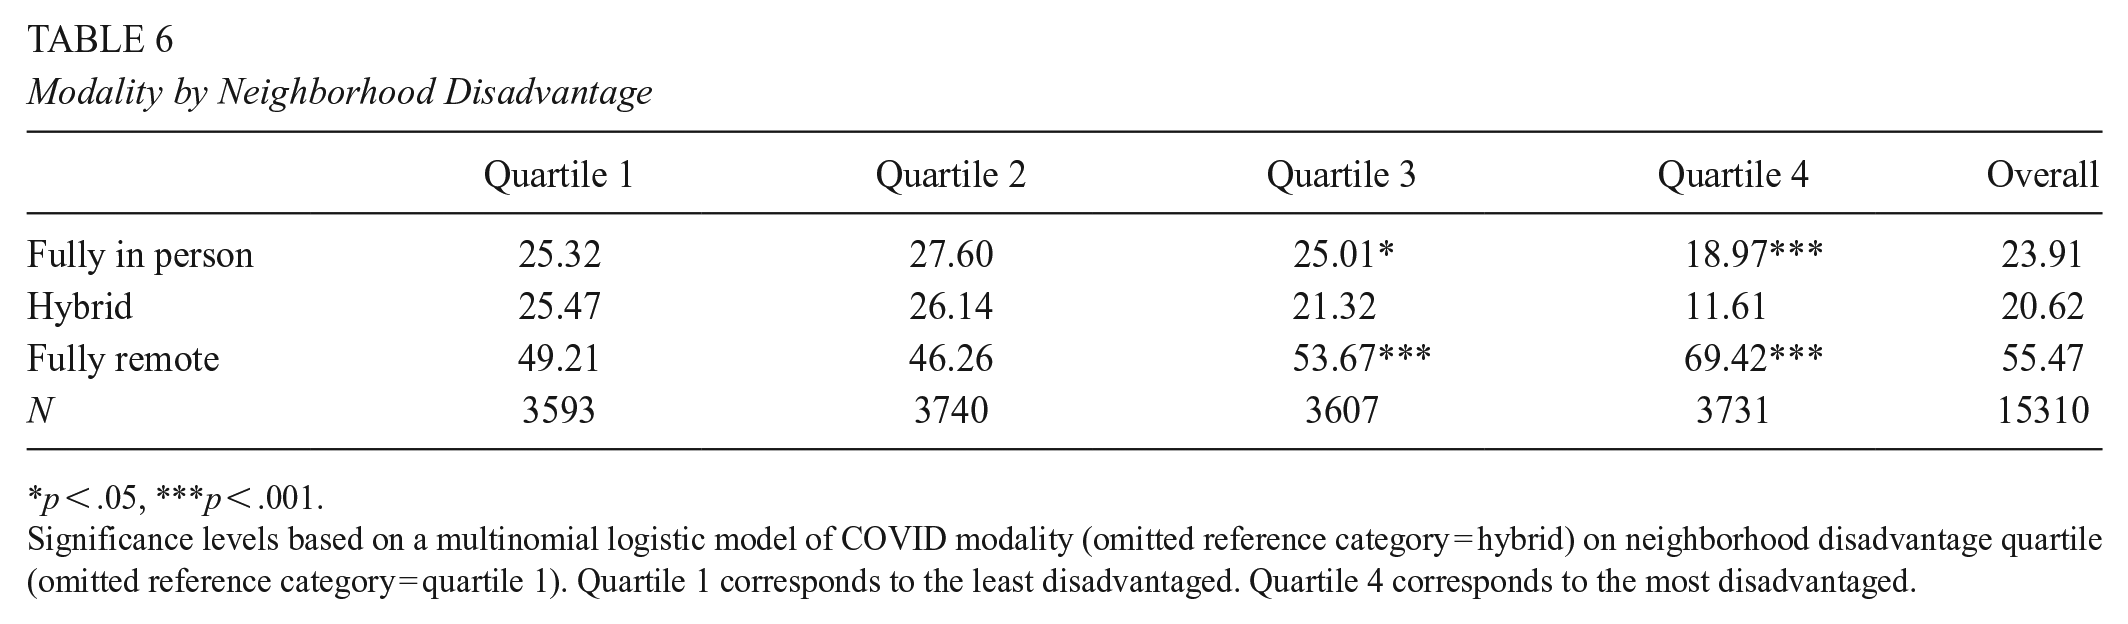
p < .05, ***p < .001.
Significance levels based on a multinomial logistic model of COVID modality (omitted reference category = hybrid) on neighborhood disadvantage quartile (omitted reference category = quartile 1). Quartile 1 corresponds to the least disadvantaged. Quartile 4 corresponds to the most disadvantaged.
Adolescent Mental Health in the Analytic Sample
Table 7 describes our mental health outcome measures over time for our analytic sample. We find little evidence that positive affect or sadness varied much over time, with means and standard deviations at each measured time point relatively stable. Perceived stress, measured at all four time points, decreased slightly but significantly in our analytic sample between December 2020 and May 2021 (Cohen’s d = .08; p < .001). As shown in Table 7, not all students who returned a rapid release COVID survey in a given administration completed the sections of the survey containing key outcome data. On average, we have key outcome data from 3747 students in each survey administration, which is 91% of the average wave-level N (see bottom row of Table 3) and 60% of our full analytic sample. The sample of students who responded to a given survey is observably similar to the sample of students for whom we are missing responses to that survey administration wave along lines of neighborhood disadvantage, sex at birth, age, and income, mitigating the likelihood that this missingness biases our results. Respondents to a given survey wave tend to be slightly more White and less Hispanic/Latino than non-respondents (Appendix C, Table 2).
Mental Health Outcomes by Survey Administration Wave

Variation in Adolescent Mental Health by School Modality
Results from models predicting outcomes from school modality with no interaction term generally showed that those who attended school in person had better mental health than those who attended remotely, with those who attended in a hybrid modality having mental health measures between those fully in person and fully remote, on average (see Figure 1, a plot of predictive margins with error bars showing 95% confidence intervals). Table 8 shows that those who attended fully in person had 2.0 points higher positive affect scores than those who attended remotely (d = 0.23; p < .001), and those who attended in a hybrid modality had 1.5 points higher positive affect scores (d = 0.18; p < .001) than those who attended school remotely. Those who attended in person had .4 points lower perceived stress scores than those who attended remotely (d = 0.12; p < .001), and hybrid attendees reported nonsignificantly lower perceived stress than those who attended remotely. Those who attended in a hybrid modality reported .2 points higher perceived stress than those who attended in person (d = 0.08; p < .001). Sadness/depression scores did not differ significantly based on school modality but followed a qualitatively similar pattern to our other outcomes, with those attending school entirely remotely having the highest scores and those attending fully in person having the lowest. 6

Visualized outcomes by school modality.
Outcomes by School Modality

Standard errors in parentheses. Omitted reference category: remote.
***p < .001.
Moderating effects of race/ethnicity
Positive affect for White students attending school in person was 2.7 points higher (d = 0.32; p < .001) than for White students attending remotely. For White students attending in a hybrid modality, positive affect was 2.3 points higher (d = 0.26; p < .001) than for White students attending remotely (Table 9). Modality effects for Asian and Other students did not differ significantly from modality effects for White students. Black students attending remotely reported .5 points higher positive affect than Black students attending in person (the moderating effect of being Black on the effect of in-person schooling on positive affect was −3.3 points, d = 0.38; p < .01). Black students attending school in person reported lower positive affect than Black students attending school in other modalities, whereas in-person schooling was associated with the highest reported positive affect across modalities for other races and ethnicities (Figure 2). The effect of hybrid modality on Hispanic/Latino students’ positive affect was 2.1 points lower (d = 0.24; p < .05) than the effect of hybrid modality on White students’ affect; Hispanic/Latino students reported similar levels of positive affect in hybrid and remote schooling, whereas White students reported significantly higher positive affect in hybrid schooling than remote.
Outcomes by School Modality and Race/Ethnicity
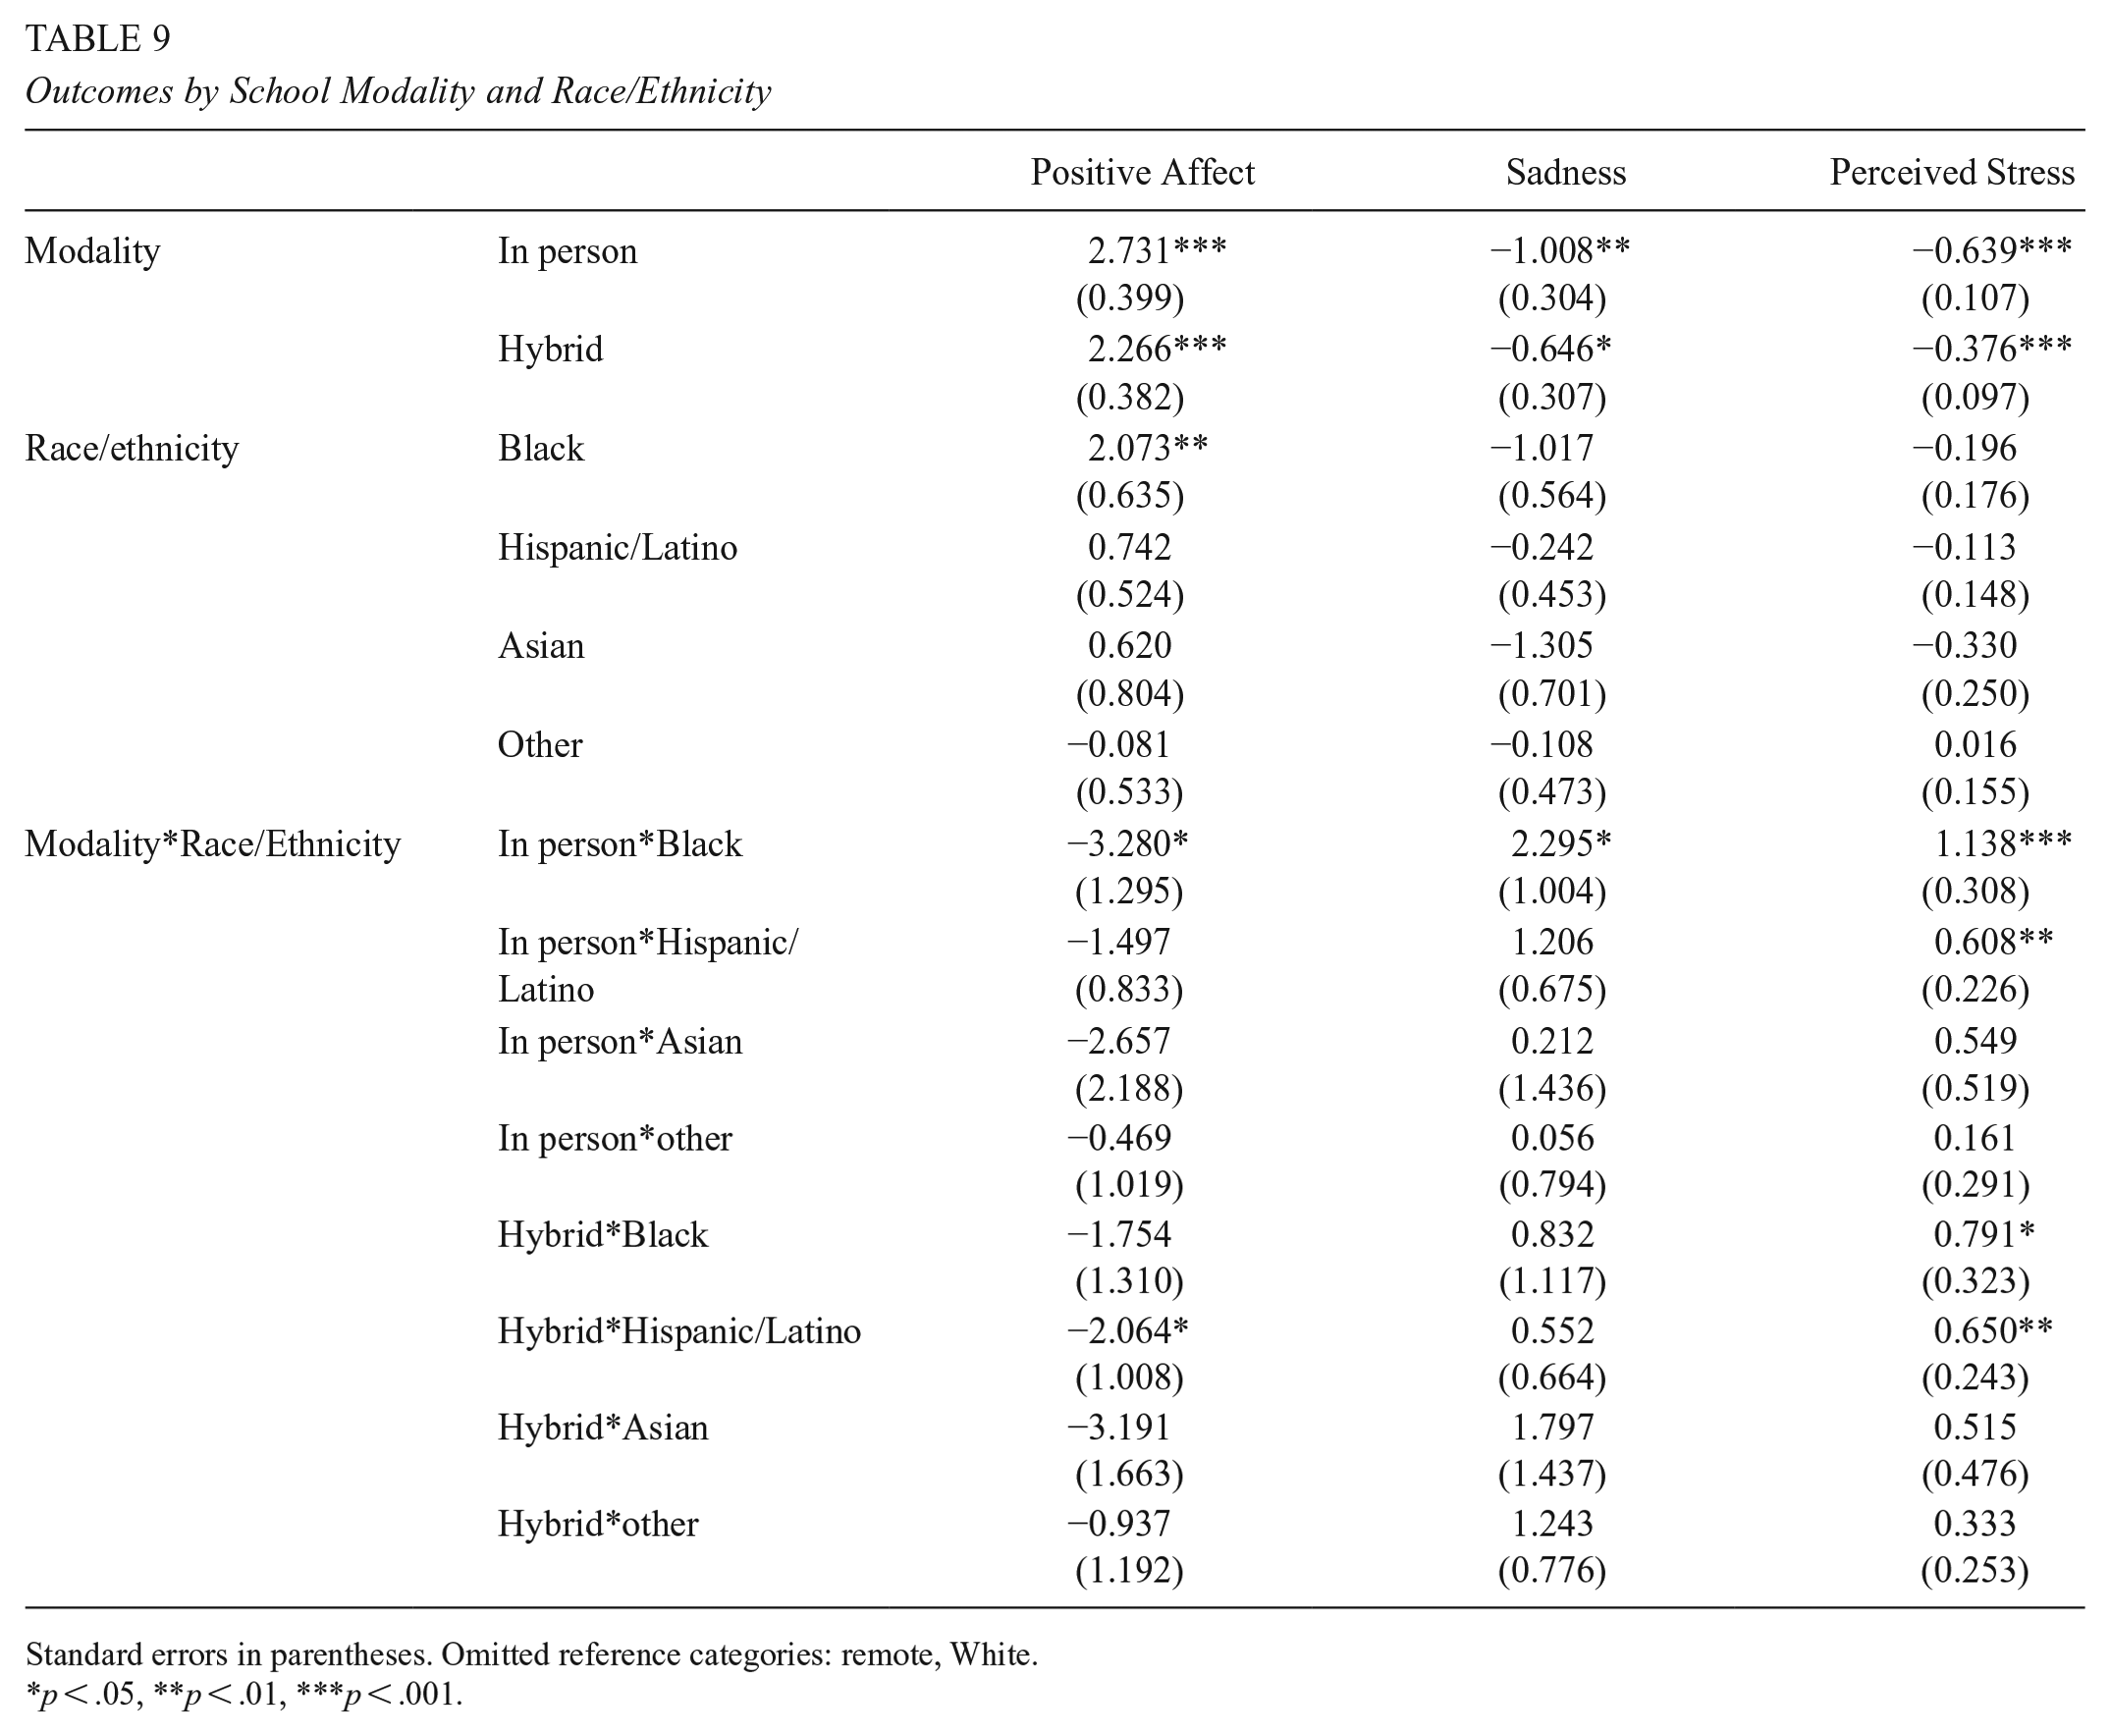
Standard errors in parentheses. Omitted reference categories: remote, White.
p < .05, **p < .01, ***p < .001.

Visualized outcomes by school modality and race/ethnicity.
Table 9’s “sadness” column mirrors findings for positive affect, with Black students attending in person reporting 1.3 points higher sadness/depression than Black students attending remotely (the moderating effect of being Black on the effect of in-person schooling on sadness/depression was 2.3 points, d = .31; p < .05). On the other hand, White, Hispanic/Latino, and Asian students reported lower sadness when attending in person compared to remotely (Figure 2).
White students attending school in person perceived approximately .6 points lower stress than White students attending school remotely (d = .21; p < .001), and White students attending with a hybrid modality perceived .4 points lower stress than White students attending remotely (d = .13; p < .001; Table 9). Modality effects for Asian and Other students did not vary significantly from those for White students. Patterns of perceived stress by school modality were significantly different for Black and Hispanic/Latino students than for White students. Black students attending remotely perceived .5 points lower stress than Black students attending in person and .4 points lower stress than Black students attending in a hybrid modality (the moderating effects of being Black on the effect of in-person and hybrid schooling on perceived stress were 1.1 points and 0.8 points, d = .38; p < .001 and d = .26; p < .05, respectively). Hispanic/Latino students attending remotely perceived similar levels of stress to Hispanic/Latino students attending in person and .3 points lower stress than Hispanic/Latino students attending in a hybrid modality (the moderating effects of being Hispanic/Latino on the effect of in-person and hybrid schooling on perceived stress were .6 points and .7 points, d = .20; p < .01 and d = .22; p < .01, respectively). While White students attending remotely reported significantly higher perceived stress than those attending school in person or in a hybrid modality, Black and Hispanic/Latino students perceived similar levels of stress across all modalities (Figure 2).
Moderating effects of household income
For respondents in the omitted reference category for household income ($100,000–$199,999), in-person and hybrid schooling were associated with 2.7 (d = .31; p < .001) and 2.4 (d = .28; p < .001) points higher positive affect scores, respectively, than remote schooling (Table 10). The effect of in-person schooling on positive affect was 3.9 points lower for students in the lowest (under $25,000) household income category (d = .45; p < .01), and the effect of hybrid schooling on positive affect was 5.0 points lower (d = .58; p < .01). As a result, fully remote modality was associated (albeit nonsignificantly) with the highest positive affect for the students from the lowest-income families but with the lowest positive affect across the rest of the income categories (statistical significance varies; p < .001 in the omitted income category; see Figure 3).
Outcomes by School Modality and Household Income

Standard errors in parentheses. Omitted reference categories: remote, $100,000–$199,999.
p < .05, **p < .01, ***p < .001.
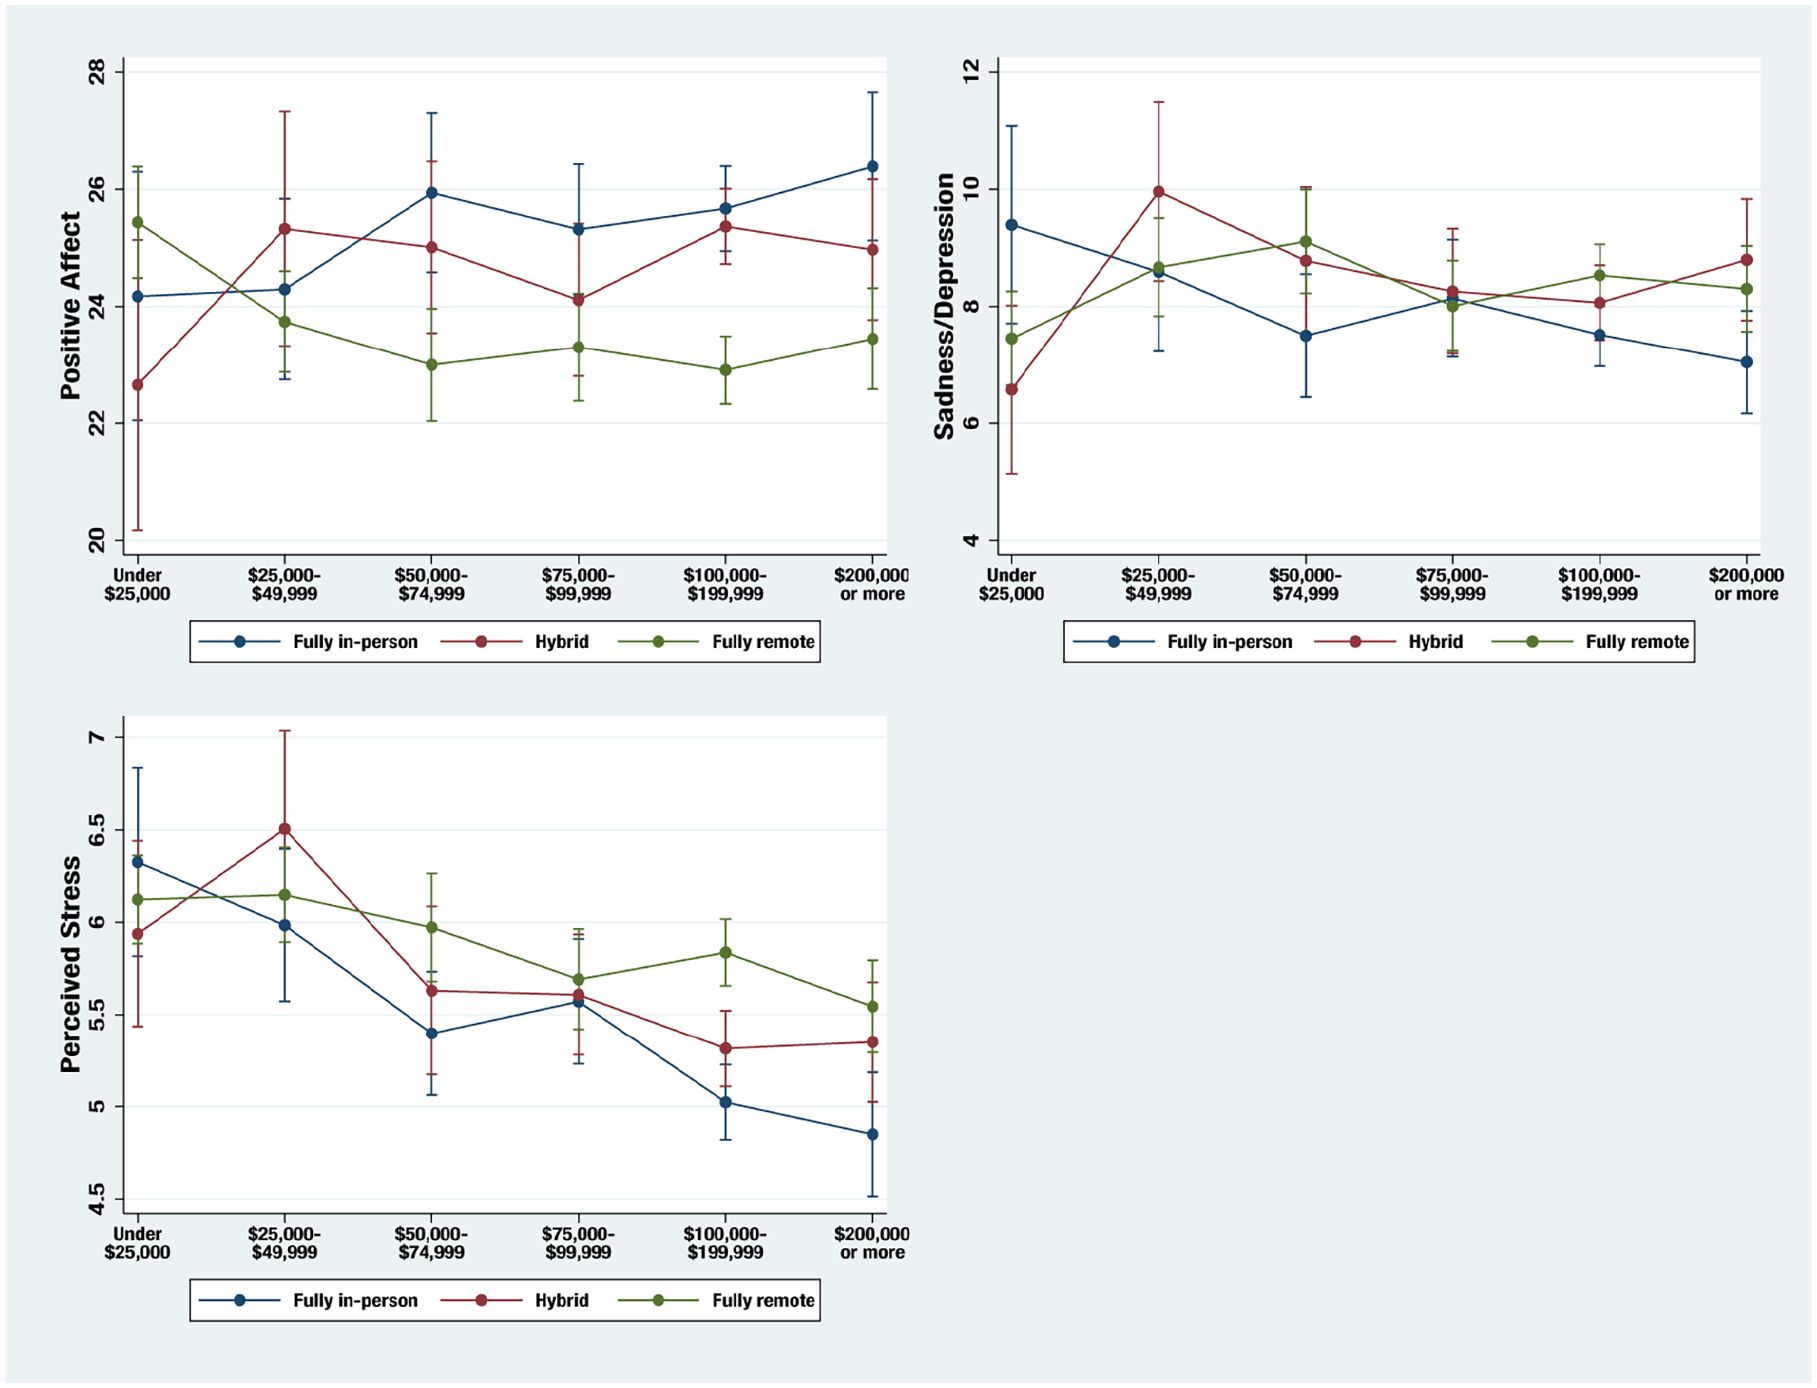
Visualized outcomes by school modality and household income.
Students in the omitted $100,000–$199,999 income category who attended in person reported 1.1 points lower sadness than students in that income category who attended remotely. However, in-person modality was associated with 1.6 points greater sadness for students in the $75,000–$99,999 income category (d = 0.21; p < .05) and 2.9 points greater sadness for students in the lowest income category (d = 0.39; p < .01) than for wealthier students from the omitted $100,000–$199,999 category (Table 10). Students from households with incomes under $25,000 reported the highest levels of sadness when attending school in person, whereas students from all other income categories reported the lowest levels of sadness when in person (Figure 3).
Students in the $100,000–$199,999 household income category perceived .8 points less stress in in-person schooling compared to remote (d = 0.26; p < .001) and .4 points less stress in hybrid schooling compared to remote (d = 0.13; p < .01; Table 10). Perceived stress decreased almost universally as household income increased (Figure 3). The finding that in-person schooling was associated with lower perceived stress (among students from the omitted $100,000–$199,999 income category) was less pronounced for students from households in the $75,000–$99,999 and $25,000–$49,999 income categories and reversed direction for students in the lowest (under $25,000) income category (relevant interaction terms 0.9; d = 0.30; p < .001 for $75,000–$99,999 category, .8; d = .27; p < .01 for $25,000–$49,999 category, and 1.1; d = 0.37; p < .001 for under $25,000 category).
Moderating effects of neighborhood disadvantage
For those from neighborhoods of average advantage, students attending school in person reported 1.8 points higher positive affect than students attending school remotely (d = .21; p < .001). Students from neighborhoods of average advantage attending with hybrid modality reported 1.5 points higher positive affect than students attending remotely (d = .17; p < .001; Table 11). This modality effect widens as students’ neighborhoods become more advantaged and attenuates to zero for students in the least-advantaged neighborhoods in our sample, although this differential effect by neighborhood advantage did not reach statistical significance (Figure 4). In our sample, remote schooling was only associated with lower positive affect for students in relatively advantaged neighborhoods. For students in less affluent neighborhoods, modality did not predict positive affect.
Outcomes by school modality and composite baseline neighborhood disadvantage

Standard errors in parentheses. Omitted reference category: remote.
p < .05, **p < .01, ***p < .001.

Visualized outcomes by school modality and composite baseline neighborhood disadvantage.
Although we found no evidence that modality predicts sadness/depression symptoms for students from neighborhoods of average affluence, we found that neighborhood disadvantage significantly moderates the relationship between modality and sadness, such that each additional standard deviation of neighborhood disadvantage predicts 1.0 more points of sadness associated with in-person modality compared to remote modality (d = 0.13; p < .05; Table 10). As shown in Figure 4, neighborhood disadvantage is positively related to reported sadness for students attending in person (students from more-disadvantaged neighborhoods attending in person report higher levels of sadness) and negatively related to reported sadness for students attending remotely (students from more-disadvantaged neighborhoods attending remotely report lower levels of sadness), although the differences by modality only reach statistical significance in relatively advantaged neighborhoods.
Students from neighborhoods of average advantage perceived .3 points lower stress when attending in person compared to remotely (d = .11; p < .01). A one standard deviation increase in neighborhood disadvantage is associated with .3 points higher perceived stress for students attending in person compared to students attending remotely (Table 11). Descriptively, perceived stress increases only slightly as a student’s neighborhood disadvantage increases for students attending remotely, whereas perceived stress increases more steeply with neighborhood disadvantage for students attending in person. As a result, students in our analytic sample from relatively advantaged neighborhoods report higher levels of perceived stress in remote modalities compared to other modalities, but differences in perceived stress by modality attenuate to zero for students from less-advantaged neighborhoods (Figure 4).
Robustness
After fitting our main models, described previously, we performed an additional two robustness checks. First, because two of our three outcomes were only measured in two survey waves, there could be concern that our findings are driven by cross-sectional changes in sample composition rather than longitudinal change over time within students. To address this concern, we restricted our analytic sample to just the students with no missing outcome data across survey administrations (N = 2,383 for positive affect, N = 2,567 for sadness, N = 2,079 for perceived stress), precluding the possibility of compositional changes over survey administrations. These students were slightly Whiter and higher-income than the full analytic sample (Appendix C, Table 3), but results from these models were substantively similar to our main results (Appendix B, Tables 5–8), suggesting that our findings are robust to variations in the sample responding by survey wave. We also fit a set of zero-inflated binomial models that paralleled our main linear mixed-effects models for the sadness/depression outcome. We considered the possibility that the trends we found with regard to that outcome might be attributable to minor fluctuations in outcomes for healthy (i.e., not sad/depressed) adolescents. However, findings from these models were also substantively similar to our main findings, suggesting that the high proportions of healthy respondents were not the sole drivers of our results (Appendix B, Table 9).
Discussion
We analyzed longitudinal, student-reported survey data from the 2020–2021 school year to investigate the moderating effects of race/ethnicity, income, and neighborhood disadvantage on the relationship between school modality and adolescent mental health outcomes. We found that, on average, students attending school in person had better mental health outcomes (i.e., lower stress, lower sadness, and higher positive affect) than students attending remotely (Figure 1). This overall finding aligns with previous work showing better academic and mental health outcomes associated with in-person schooling (Hertz et al., 2022; Jack et al., 2023) but masks important differences by race/ethnicity, income, and neighborhood disadvantage.
For example, we found that Black students and students with household incomes under $25,000 generally reported higher sadness and stress and lower positive affect in in-person schooling than in remote or hybrid schooling (Figures 2 and 3). And whereas students from relatively advantaged neighborhoods tended to report better mental health outcomes in in-person schooling than in hybrid or remote, that pattern either disappeared or reversed as neighborhood disadvantage increased (Figure 4). Our moderation findings seem to hold especially for certain student groups (e.g., Black students), but overall, they suggest that COVID school modality’s relationship with student mental health was not uniform across student groups.
Prior literature tended to treat race/ethnicity, income, and neighborhood disadvantage as factors to hold constant in deriving effects of modality on key outcomes (e.g., Saulle et al., 2022), and our analysis extends this work by pointing to a complex interplay between school modality, demographic and contextual characteristics that may predict other stressors or shape the qualities of experience in each school modality, and adolescents’ mental health.
Earlier in this paper, we presented two plausible and competing hypotheses as to the direction of moderating effects of race/ethnicity, income, and neighborhood disadvantage on the relationship between pandemic school modality and adolescents’ mental health. The first suggested that less-advantaged students’ mental health might especially benefit from in-person schooling, perhaps due to the resources and supportive experiences that schools can offer to students and families. The second suggested that less-advantaged students’ mental health might especially benefit from remote schooling, perhaps due to in-person schooling acting as a vector for viral transmission or as a potential stressor due to possible exposures (Marshall et al., 2022).
Our findings, that more-advantaged students in in-person schooling reported better mental health outcomes than their less-advantaged peers, while less-advantaged students in remote and hybrid schooling reported better mental health outcomes than their more-advantaged peers, are more consistent with the second hypothesis. Although we have surmised that worries around viral infection could make in-person schooling especially stressful for less-advantaged students, these hypotheses were intended to be illustrative, not exhaustive—there are many reasons why we might expect in-person schooling to especially benefit certain student groups. To the extent that less-advantaged students attend more-stressful schools, for example, school climate (or school quality more generally) could explain this pattern of findings as well.
Our inability to isolate causal mechanisms for our findings due to the descriptive nature of data from the ABCD Study is one limitation of this analysis. Relatedly, our data do not include usable indications of which school students attend, so we are unable to account for school-level nesting in these analyses. To the extent that these mental health outcomes differ by school, our inability to account for this clustering may bias our standard errors downward, which risks introducing Type I error into our findings. Additionally, the data we used to derive our composite neighborhood disadvantage factor are only available at baseline, so any movement between census tracts from the time a family entered the ABCD Study and the pandemic introduces error into our neighborhood disadvantage estimates.
There are also a few limitations related to this study’s scope and generalizability: first, it is important to keep in mind that while this is the largest study of adolescent cognitive development to date, it is not nationally representative. Second, the study is limited to adolescents (students in our analytic sample were between 11.0 and 15.7 [M = 13.2] years old when data under study were being collected), so it does not speak to the experiences of younger or older students. Third, it is also important to keep in mind that the magnitudes of the group differences we report on were fairly small and outside the clinical range. This is expected when averaging across a large nonclinical sample, but our findings should not be interpreted as claiming that entire student groups, for example, met clinical criteria for depression during the 2020–2021 school year while others didn’t; our evidence of group-level affective differences is at a subclinical level.
Despite potential limitations, this analysis has a number of strengths that increase the novelty of our contribution and confidence in the robustness of findings. First, the ABCD Study® provided an ongoing infrastructure with extensive data collection to integrate longitudinal measures of well-being and school modality in a large, well-characterized dataset that captured variation across the country. Second, repeated measures in real time over the 2020–2021 school year permit assessment of associations and moderation effects across the full year as both the pandemic and school modality changed over time, rather than one cross-sectional time point or with retrospective assessment. Third, we extend prior research to consider a multilevel perspective that includes neighborhoods as well as families and schools. This suggests not only that overall patterns across the population remain after accounting for neighborhood characteristics but also that the association between modality and mental health varies based on neighborhood characteristics. Finally, our findings were robust to multiple sensitivity analyses that ruled out alternative explanations.
We find evidence of systematic differences in the relationship between modality and mental health across groups, and those differences are predicted, albeit imperfectly, by privilege. More-privileged students reported more positive mental health outcomes in in-person modality whereas less-privileged students generally reported more-positive mental health outcomes in remote modality or similar mental health outcomes across modalities. These differences suggest that, although in-person schooling was often assumed to promote mental health (Saulle et al., 2022), the return to in-person schooling in the context of the pandemic may have resulted in additional risk (real or perceived) for students from more marginalized backgrounds and a need for greater resources to support them.
Understanding the mechanisms that drive these relationships could be a fruitful area for future adolescent well-being and school improvement research; teasing apart these moderation effects could contribute to theories of adolescent well-being during times of crisis, for example. Moreover, our findings offer guidance for research into lifecourse models of stress and health (Kuh et al., 2003), as they highlight that it is essential to consider how youth contexts may not be experienced uniformly as stressors or supports and that there may be systematic differences; what is supportive for some communities may be associated with stress or risk for other communities. From a practical and policy-oriented perspective, schools and other entities interested in adolescent risk reduction and mitigation could benefit from understanding why in-person schooling was associated with better mental health outcomes for more-privileged students and worse outcomes for less-privileged students during the pandemic and whether these patterns persist beyond the context of the pandemic. Accounting for these systematic differences in experience while remaining responsive to individual needs could improve the precision of adolescent screening and other mental health policies and procedures.
Results from this study might also reasonably affect the way we think about experiencing a multisystemic stressor like the pandemic. For instance, any theory or policy conceiving of a monolithic “student pandemic experience” is most likely ignoring important heterogeneity in experiences. On the other hand, our results also suggest that assuming pandemic experiences are best understood individually (e.g., advocating personalized pandemic recovery support for all students) ignores reliable group-level predictability of these experiences, so it risks inefficiencies related to over-personalization. Looking forward, this suggests that as challenges beyond the pandemic arise, it is important for schools and school districts to proactively consider the systematic heterogeneity in how students may experience interventions or policy changes in order to provide and scale supports responsive to student experiences.
Overall, we found that students in remote or hybrid schooling during the pandemic reported worse mental health outcomes than students who attended school in person, but this pattern concealed significant differences by income, race/ethnicity, and neighborhood characteristics. In particular, the overall relationship between school modality and mental health during the pandemic either disappeared or reversed for relatively disadvantaged students and students from more marginalized racial/ethnic backgrounds. This highlights both the possibility of continued mental health needs related to disparate pandemic impacts and the urgent need to understand and mitigate the differential negative effects of in-person schooling on marginalized youth in times of crisis.
Supplemental Material
sj-docx-1-ero-10.1177_23328584251349182 – Supplemental material for The Relationship of School Modality With Stress and Mental Health During the COVID-19 Pandemic: Variation Across Sociodemographic Groups
Supplemental material, sj-docx-1-ero-10.1177_23328584251349182 for The Relationship of School Modality With Stress and Mental Health During the COVID-19 Pandemic: Variation Across Sociodemographic Groups by Daniel Silver, Morgan S. Polikoff, Kiros Berhane, Annie Kwon, Megan M. Herting, Elizabeth R. Sowell, David J.M. Kraemer and Daniel A. Hackman in AERA Open
Footnotes
Data Availability Statement
Data used in the preparation of this article were obtained from the Adolescent Brain Cognitive DevelopmentSM (ABCD) Study (https://abcdstudy.org), held in the NIMH Data Archive (NDA). This is a multisite, longitudinal study designed to recruit more than 10,000 children aged 9–10 and follow them over 10 years into early adulthood. The ABCD Study® is supported by the National Institutes of Health and additional federal partners under award numbers U01DA041048, U01DA050989, U01DA051016, U01DA041022, U01DA051018, U01DA051037, U01DA050987, U01DA041174, U01DA041106, U01DA041117, U01DA041028, U01DA041134, U01DA050988, U01DA051039, U01DA041156, U01DA041025, U01DA041120, U01DA051038, U01DA041148, U01DA041093, U01DA041089, U24DA041123, U24DA041147. A full list of supporters is available at https://abcdstudy.org/federal-partners.html. A listing of participating sites and a complete listing of the study investigators can be found at ![]() . ABCD consortium investigators designed and implemented the study and/or provided data but did not necessarily participate in the analysis or writing of this report. This manuscript reflects the views of the authors and may not reflect the opinions or views of the NIH or ABCD consortium investigators. Additional support for this work was made possible from supplements to U24DA041123 and U24DA041147, the National Science Foundation (NSF 2028680), and Children and Screens: Institute of Digital Media and Child Development Inc. Additional support for this work was made possible from NIEHS R01-ES032295 and R01-ES031074.
. ABCD consortium investigators designed and implemented the study and/or provided data but did not necessarily participate in the analysis or writing of this report. This manuscript reflects the views of the authors and may not reflect the opinions or views of the NIH or ABCD consortium investigators. Additional support for this work was made possible from supplements to U24DA041123 and U24DA041147, the National Science Foundation (NSF 2028680), and Children and Screens: Institute of Digital Media and Child Development Inc. Additional support for this work was made possible from NIEHS R01-ES032295 and R01-ES031074.
The ABCD data repository grows and changes over time. The ABCD data used in this report came from DOI: 10.15154/8873-zj65.
Declaration of Conflicting Interests
The author(s) declared no potential conflicts of interest with respect to the research, authorship, and/or publication of this article.
Funding
The author(s) disclosed receipt of the following financial support for the research, authorship, and/or publication of this article: Research reported in this publication was supported by the Eunice Kennedy Shriver National Institute of Child Health & Human Development of the National Institutes of Health (NICHD R01HD108398, PI: Hackman). The content is solely the responsibility of the authors and does not represent the official views of the National Institutes of Health.
Open Practices
Analysis files and instructions on accessing data used in this article can be found at https://doi.org/10.3886/E230122V1. Data from the Adolescent Brain Cognitive DevelopmentSM (ABCD) Study (https://abcdstudy.org) are released regularly to the research community with authorization under a data use agreement. Data must be requested directly from the ABCD Study®; the authors do not have the ability to share the data themselves. Up-to-date procedures for data use agreements and data access can be found at: ![]() .
.
Note: This manuscript was accepted under the editorship of Dr. Kara Finnigan.
Notes
Authors
DANIEL SILVER is a research scientist at the Center for Applied Research in Education at the University of Southern California Dornsife Center for Economic and Social Research. His research interests include student and family well-being and curriculum policy and use.
MORGAN S. POLIKOFF is a professor of education at the University of Southern California Rossier School of Education and the co-faculty director of the USC EdPolicy Hub. He studies the design, implementation, and effects of curriculum, standards, and accountability policies.
KIROS BERHANE is the Cynthia and Robert Citronella-Roslyn and Leslie Goldstein Professor and Chair of the Department of Biostatistics at the Mailman School of Public Health, Columbia University. His interests include the development of statistical methods for environmental research, with a focus on complex and correlated data structures, as well as their application to a wide range of public health topics, including the effects of air pollution and the built environment.
ANNIE KWON is a biostatistician in the USC Suzanne Dworak-Peck School of Social Work at the University of Southern California. Her interests include statistical modeling, R programming, public health, and analytic work with large datasets.
MEGAN M. HERTING is an associate professor at the Children’s Hospital Los Angeles and the Department of Population and Public Health Sciences at the University of Southern California. Her research is focused on brain and cognitive development in healthy and at-risk populations, and she is interested in determining how hormones, lifestyle, and environmental factors influence neurodevelopment, cognition, and mental health outcomes in children and adolescents.
ELIZABETH R. SOWELL is a professor at the Children’s Hospital Los Angeles and in the Department of Pediatrics at the University of Southern California. Her research interests include how the brain changes in structure and function in typically developing children and adolescents and in populations with neurodevelopmental disorders, and how changes in the brain relate to changes in behavior and cognitive function.
DAVID J. M. KRAEMER is an associate professor in the Department of Psychological and Brain Sciences at Dartmouth College and chair of the interdisciplinary Program in Cognitive Science. His research interests focus on uncovering the neurobiological processes underlying learning and cognition, with an emphasis on individual differences and applying these findings to enhance education.
DANIEL A. HACKMAN is an associate professor in the USC Suzanne Dworak-Peck School of Social Work at the University of Southern California. His research interests include the role of neighborhoods, socioeconomic factors, and adversity in cognitive, affective, and brain development, as well as health and well-being in childhood and adolescence and the family and contextual factors that promote health and attenuate risk processes.
References
Supplementary Material
Please find the following supplemental material available below.
For Open Access articles published under a Creative Commons License, all supplemental material carries the same license as the article it is associated with.
For non-Open Access articles published, all supplemental material carries a non-exclusive license, and permission requests for re-use of supplemental material or any part of supplemental material shall be sent directly to the copyright owner as specified in the copyright notice associated with the article.