
Abstract
We analyze the most comprehensive dataset on U.S. school board elections. We find that nearly half of races go uncontested and that incumbents are reelected more than 80% of the time when they run. Because many incumbents retire instead of running for another term, however, turnover is high (with 53% of incumbents replaced in a typical election cycle). School board turnover is also only weakly related to student learning rates. These dynamics—high turnover disconnected from school performance challenges—occur across both urban and non-urban districts, regardless of student demographics and local media environments. Together, these results suggest that local democracy produces high leadership churn and minimal incentives to improve student learning, two findings that can inform debates regarding the benefits and costs of local democratic governance.
The local school board is the oldest and most common elective office in American democracy.
1
Voters directly elect an estimated 50,000 school board members who govern roughly 13,000 school districts educating nearly 50 million students.
2
Supporters of the local democratic control of public schools argue that school board elections empower communities and provide an effective way to make important collective decisions about education policy. For example, this is how the National School Boards Association summarizes their value: School board members are the unsung heroes in communities throughout the country. They establish the vision and goals for the public schools in their district, and they set standards for the performance of schools and superintendents. . . . Most school board members are elected by people in their community to represent their values, views, and desires for the public schools in their district. As selected leaders in their community, they consistently communicate with the public to keep community members abreast of challenges, ideas, and progress.
3
American voters seem to agree, with polls indicating strong support for their locally elected school boards (see Jacobsen & Saultz, 2012). 4
On the other hand, some critics of America’s education system attribute the failings of public schools—such as low achievement relative to international benchmarks, and large achievement gaps between student groups—to the incentives created by local elections. Such incentives arise from the disproportionate electoral influence of organized interest groups, including teachers unions (e.g., see Anzia, 2013; Hartney, 2022; Moe, 2006) as well as the relatively small share of political and electoral power exercised by low-income individuals, racial and ethnic minorities, and parents whose children local schools educate (e.g., see Bartanen et al., 2018; Kogan et al., 2021). In their book Politics, Markets, and America’s Schools, Chubb and Moe (1990) go as far as to argue that “the most fundamental causes [of low academic performance] are far less obvious, given the way schools are commonly understood, and far less susceptible to change” than many education reformers believe. “They are, in fact, the very institutions that are supposed to be solving the problem: the institutions of direct democratic control” (Chubb & Moe, 1990, p. 2).
Yet, despite a growing body of empirical research on school board elections, we have little comprehensive, national information about their dynamics. In particular, there is limited evidence regarding the extent to which voters actually use local elections to hold public officials accountable for school district outcomes (and thus encourage better performance), one of the primary theoretical benefits of democracy. Existing studies typically focus on individual states where data are easily available. 5 Although nationwide data on school district administration and student achievement are now plentiful, we lack commensurate school board election metrics that are comparable across states and over time. 6
In this study, we present new details about school board election contests from 16 states. Over several years, our team obtained and hand-coded election records—many available only in paper form—for more than 50,000 contests across 16 states between 2002 and 2017, providing what is to our knowledge the largest available set of descriptive data on school board elections. For each contest, we observe whether incumbents are running for reelection and (conditional on running) whether they are reelected; whether the race is contested; and the margin of victory. Our analysis focuses on the extent to which board elections are contested and competitive, as both are widely believed to be prerequisites for effective democracy (see, e.g., Przeworski, 1991).
The analysis provides new evidence on the extent to which American school board elections operate in a manner consistent with normative accounts of (local) democratic control. Achen and Bartels (2017) describe these idealized accounts as “folk theories” of democracy, falling into two general categories. The first posits that voters use elections to “select” candidates who share their political or policy agenda—candidates who, as the National School Boards Association argues, “represent their [community’s] values, views, and desires.” As Achen and Bartels (2017) describe it, “ordinary people have preferences about what their government should do . . . [and] they choose leaders who will do those things (p. 1). ” The second, alternative account argues that voters use elections for accountability, rewarding incumbents with reelection if they produce voters’ preferred outcomes, and replacing those who do not. This version of accountability through the ballot box is sometimes summarized as “retrospective voting,” and we use this term in the remainder of this article.
These normative theories break down if voters lack candidate options 7 and incumbents face minimal risk of losing the next election. Contestation and competition play a critical role in retrospective voting, as the threat of losing elected office is thought to be the primary incentive for elected officials to be faithful to the interests and preferences of their constituents (e.g., see Barro, 1973; Besley, 2007; Ferejohn, 1986). 8
If competitive races characterized by retrospective voting are indeed essential to the health of local democracy and public education, our results paint a grim picture. More than a third of the races in our sample are uncontested—increasing to more than 50% for single-member elections—and incumbents are reelected more than 80% of the time when they choose to run. On the other hand, incumbents stand for reelection only 59% of the time, lower than in state and federal contests. The relative unwillingness of incumbents to seek additional terms produces, in the aggregate, high rates of turnover (53% in a typical election cycle) in spite of the limited competition. Indeed, one of our most interesting findings is that nearly 80% of school board turnover is driven by incumbent “retirement” decisions—stepping down from office instead of seeking another term—and not electoral defeats.
While contestation and competition are necessary for effective democracy, they are not sufficient. Much also depends on the considerations that influence voters’ choices, such as how much weight they put on relevant academic outcomes, which we examine in our analysis. Linking school board election data to student achievement records, we show that reelection rates are lowest and overall school board turnover highest in districts serving low-achieving students. However, these patterns do not provide evidence of effective accountability via the ballot box. Student achievement is heavily influenced by students’ out-of-school experiences and, thus, the demographic and socioeconomic composition of district students largely drives district-wide variation in achievement. To isolate districts’ contributions to student achievement—that is, to generate a plausible measure of school quality and district performance—we instead turn to district-wide “learning rates” (see Reardon et al., 2019). 9 The results indicate that lower student learning rates do not in fact predict more electoral competition or incumbent retirement, 10 and they have only a modest association with incumbents’ reelection rates. Thus, local democracy seems to produce the worst of both worlds: high turnover without much accountability to voters. These results generally hold across districts in different types of locales and that serve different demographic mixes of students.
Our analysis is descriptive (rather than causal) and we cannot isolate the precise processes that produce these patterns (although we examine several plausible mechanisms, including differences in local media environments). However, the high rates of turnover we uncover could negatively affect students. The replacement of sitting school board members may, for example, set in motion a chain of administrative processes—such as the firing of administrators and the revision of curricula—that disrupt student learning. 11 Constant turnover may also lead to boards of elected officials who lack experience and are, therefore, less effective and more reliant on staff and interest groups, as has been found in state legislatures with term limits (e.g., Kousser, 2005). These findings also complement the large and growing body of education policy literature that examines the negative effects of turnover among superintendents (Council of the Great City Schools, 2014; Grissom & Andersen, 2012), principals (Bartanen et al., 2019), and teachers (Ronfeldt et al., 2013). The Council of the Great City Schools, a membership organization for the nation’s largest urban school districts, has long raised alarm about the short tenure of urban superintendents, for example. 12
Finally, this analysis speaks to ongoing debates about education governance reforms, including state takeovers of under-performing districts and the rapid expansion of alternative schooling options, such as homeschooling and enrollment in charter and private schools. Many critics argue that these reforms disproportionately target disadvantaged communities and deprive them of political voice by supplanting local elections. Yet, we show that such elections may not function particularly well—contributing to school board turnover without meaningfully incentivizing improvements in instructional quality—and our results provide an important empirical baseline against which to judge alternative governance arrangements.
Overview of Data Collection and Sample
Our dataset contains information on elections held from 2002 to 2017 across 16 states: Arkansas, California, Illinois, Iowa, Louisiana, Michigan, Mississippi, Missouri, Nebraska, Nevada, New York, Oklahoma, Rhode Island, Texas, Virginia, and Wisconsin. These elections vary on a number of dimensions, including whether each race produces a single or multiple winners, and whether individual board members represent geographic subdivisions or are elected at-large by the district as a whole. To make the data as comparable as possible, we aggregate to the contest level, averaging the relevant outcomes for races with multiple winners. In the statistical analyses that follow, we weight each observation by the number of winning candidates. Table 1 summarizes the data sources and Table 2 describes the elections in each state, including whether they are held concurrently with even-year federal elections (midterm or presidential elections) or held “off-cycle” on other dates.
Original Election Data Source
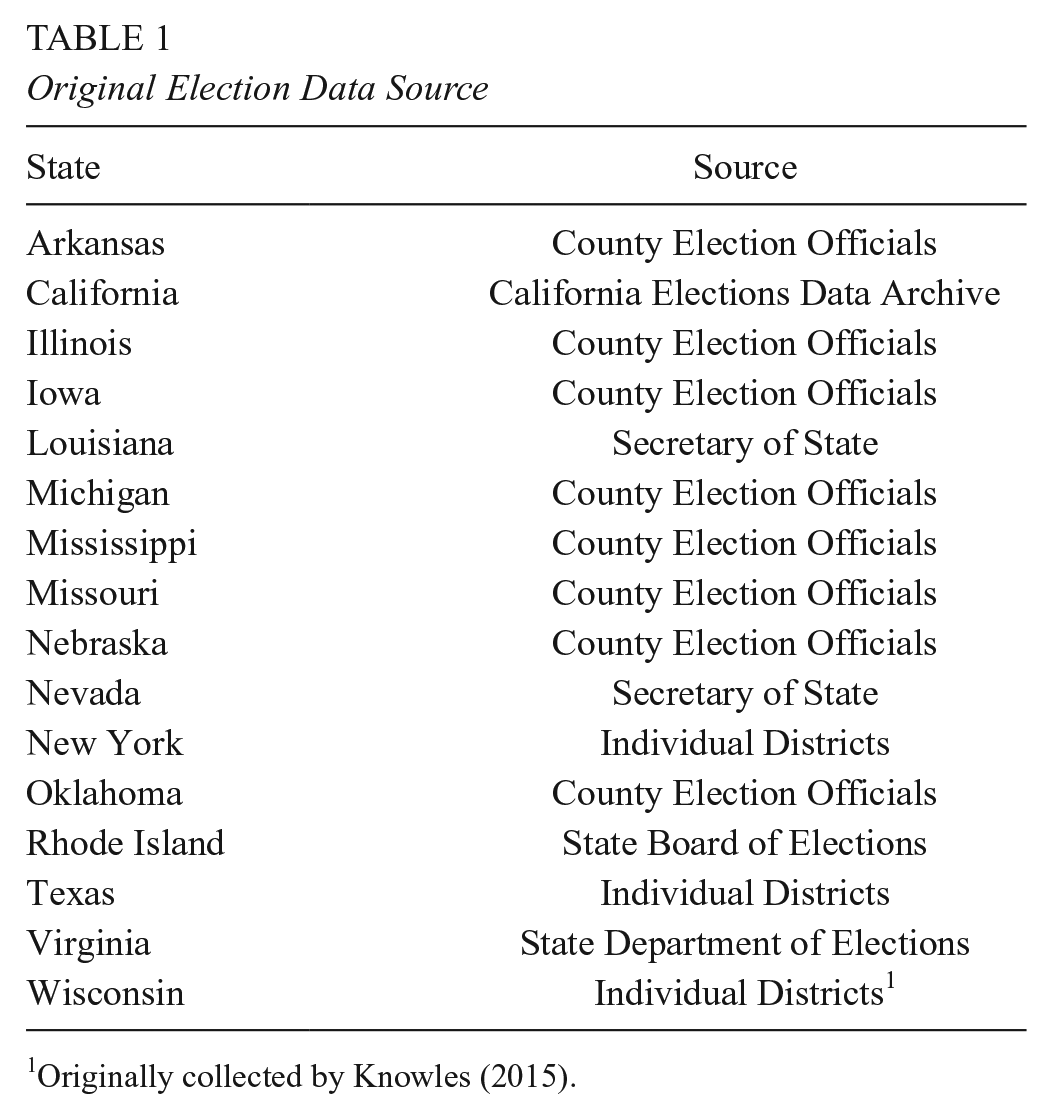
1Originally collected by Knowles (2015).
Sample Description for 2003–2017 School Board Election Dataset
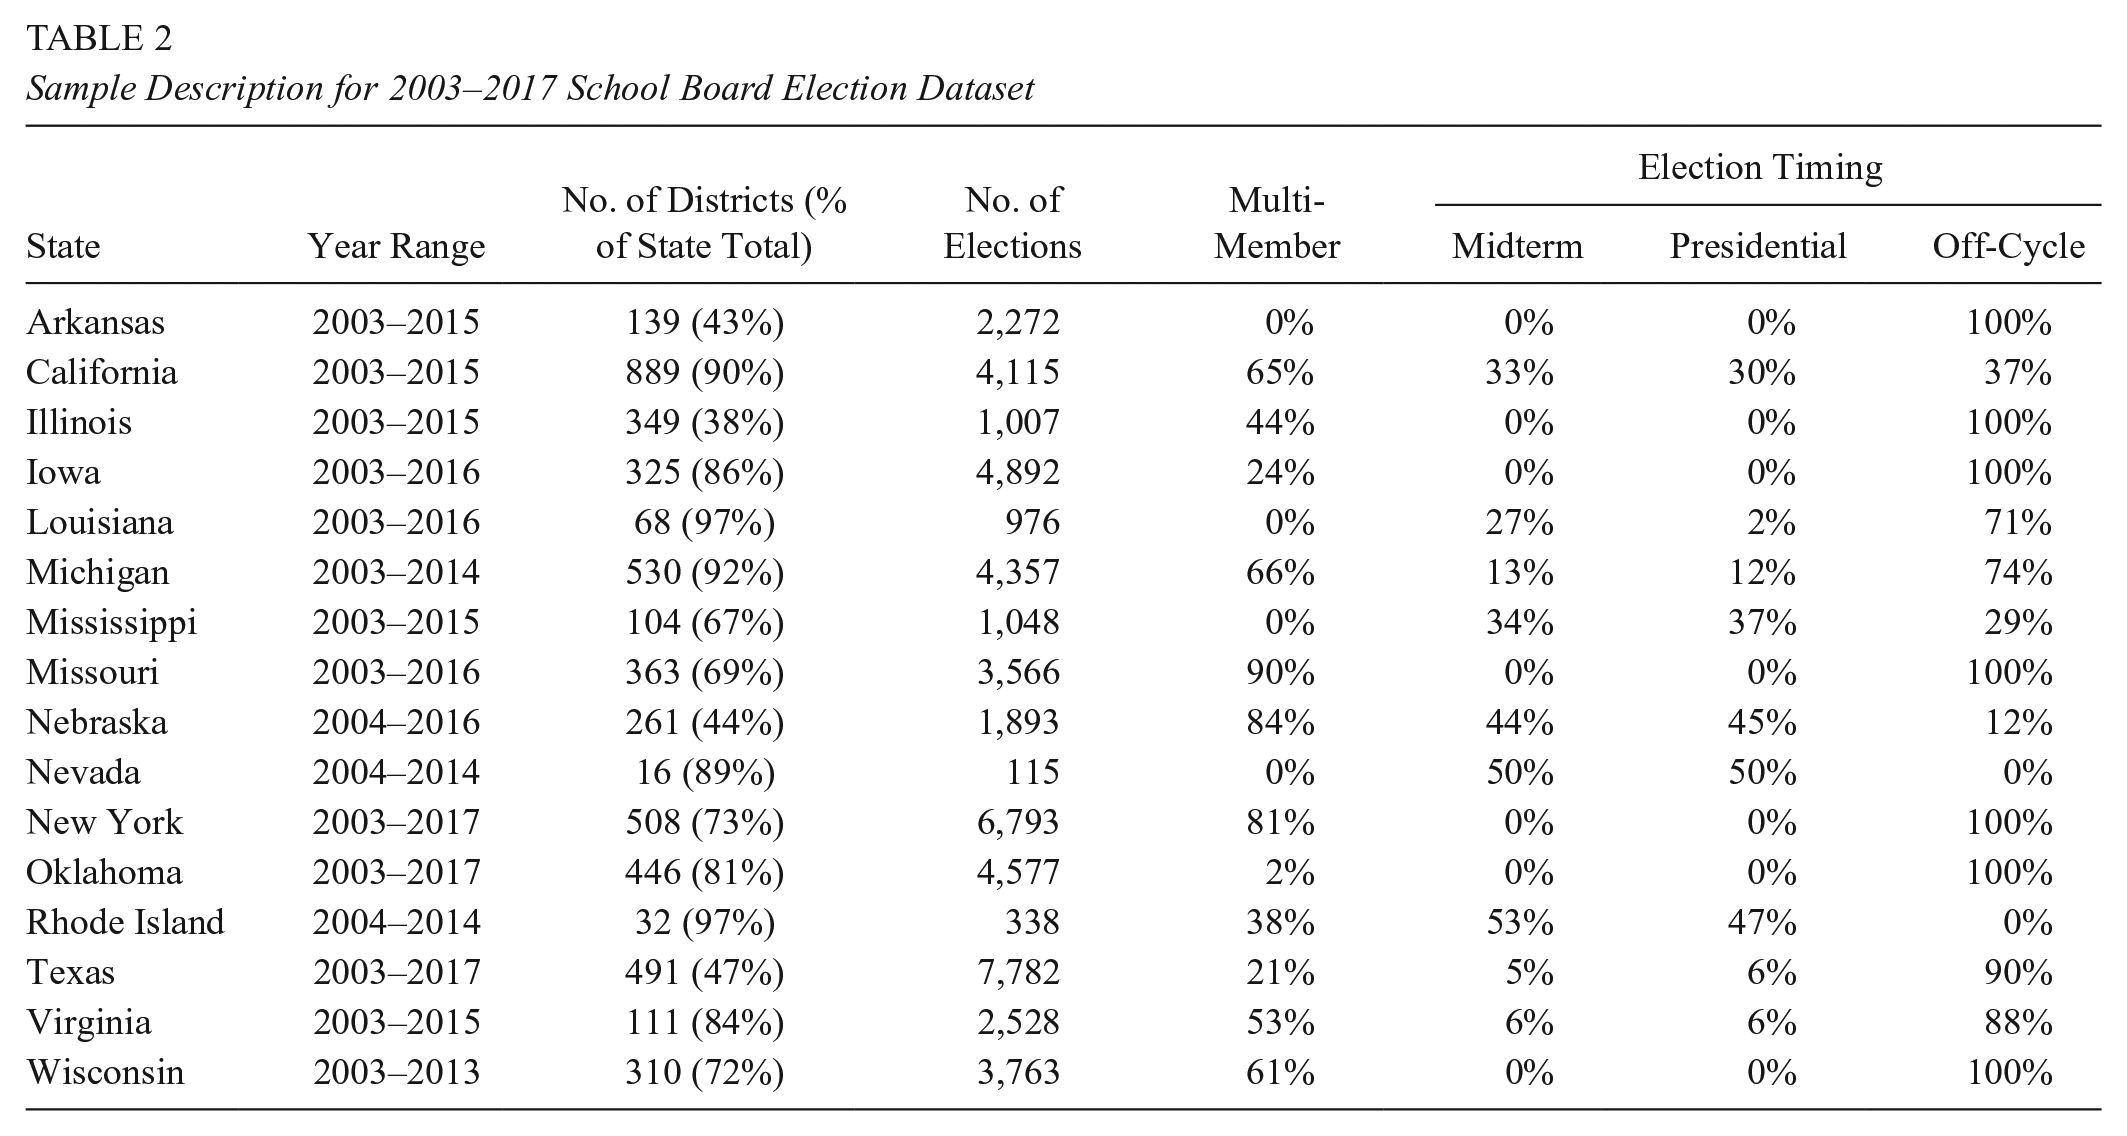
Texas and New York have the largest number of elections in the dataset, with more than 6,000 each. Nevada has the fewest number of elections with just over 100. This largely reflects differences across states in the number of school districts, rather than differences in data coverage across states. The online Supplemental Appendix describes our data collection methods, the steps we took to pre-process and harmonize the various formats used by local jurisdictions, and our automated coding of incumbent status (when such information is not included in the election records).
It is important to note that states differ considerably in the organization of their school board elections, including whether candidates must first secure nomination through a primary. Most of the states in our sample do not use primary elections for these local contests. Several states do so, however, with some (but not others) allowing candidates to win outright in the primary if they clear a certain vote threshold. To make the state results as comparable as possible, our dataset is limited to the “terminal” election in each contest, removing all primaries except races in which the winner was determined at this stage.
We obtained almost all of the data directly from official sources. 13 The data feature two potential sources of measurement error requiring some attention. First, we observe only election outcomes for races that appear on the ballot. Some states cancel elections if the number of candidates running is less than or equal to the number of open seats, and all of the candidates are deemed victors by default. When examining the proportion of races that are contested, we exclude four states (California, Louisiana, Missouri, and Nevada) because these cancellations are automatic. Uncontested elections are also canceled in Oklahoma, but we can still observe the election winners in such cases because candidates must file petitions to run. Thus, we can reconstruct the list of individuals who won by default and also calculate precisely the share of Oklahoma races that were canceled because they went uncontested (46%). Finally, state law in Wisconsin gives local districts the discretion to cancel uncontested elections. Although we do not observe the canceled elections, nearly a quarter of the races in our Wisconsin sample are uncontested, suggesting that many districts keep these contests on the ballot. We retain Wisconsin in our analysis of contestation, but the results we report below are not sensitive to this choice.
The second source of measurement error is attributable to the decentralized nature of America’s elections. Outside of New York, Texas, and Wisconsin—where school districts are allowed to administer their own elections—most of the data we collected comes from county registrars and boards of elections. Some school districts may cross county lines, and how results from different counties are aggregated and reported varies across states. Typically, the largest county is responsible for including the totals from other jurisdictions in its final election canvasses (although such numbers may not always be included in earlier, preliminary counts). We cannot always determine from county-level records whether other counties’ vote totals are included. In some cases, our coding procedure may result in partial vote counts because we do not achieve 100% coverage of counties in every state, as some counties did not respond to our records requests. In others, vote counts for districts spanning multiple counties may be duplicated.
This second source of measurement error is likely to be most impactful in Missouri and Nebraska, two states where districts are often split across multiple counties and for which we are missing results from a number of counties. 14 To ensure that this measurement error does not meaningfully affect the results, we replicate all of the analysis presented below using a dataset that excludes school districts that cross county borders. 15 These robustness checks are also in the Supplemental Appendix.
Descriptive Statistics
Table 3 provides some descriptive statistics for our sample of elections. It also provides comparable figures for state legislative and U.S. House races for the states and years in our data. For state legislative elections, we rely on the Klarner (2018) dataset, which ends in 2016. For House elections, our calculations use the Congressional Quarterly Voting and Elections Collection from 2002 to 2017. For state legislative and congressional elections, we calculate these statistics for general elections and define an election as contested if each major party fields a candidate in such an election. 16 Because nearly all of the school board elections in our sample are non-partisan, and some are filled through multi-member districts, we define contestation as the total number of candidates running exceeding the number of seats to be filled. In Table 3, the figures for contestation and margin of victory are limited to single-member elections to make the comparisons to state legislative and congressional elections as comparable as possible, although we include all observations in the regression analyses to follow. 17
Comparative Statistics on School Board Elections and Other Legislative Contests

Note. In each column, the sample is limited to the 16 states included in the school board election data and the 2002–2017 election years. When examining contestation, we exclude four states that cancel uncontested school board elections. Contestation and margin of victory calculations are based on single-member elections, which make up 54% of our sample. For multi-member election, 62% of school board races are contested and the average margin of victory is 8%. In the combined sample, 55% of races are contested and the average margin of victory is 14%. Incumbent-related outcomes and turnover rates are calculated based on elections held after 2007, when incumbency status can be accurately inferred. Results are similar if we employ district enrollment weights.
Overall, we find that 55% of school board seats are filled through contested elections, dropping to just 45% for single-member races. 18 This figure is slightly lower than reported in school board member surveys fielded by Ford and Ihrke (2020), who found that 60% of respondents indicated facing an electoral challenger. 19 This contestation rate is somewhat below the 53% for state legislative elections and far below the 85% for congressional House elections. Moreover, even when more candidates run than there are open seats, the contested elections are generally not competitive. The average margin of victory—the difference between the lowest-performing winner and the first runner-up—is 26 percentage points in single-member races.
Finally, when incumbents choose to run, they win about 82% of the time, slightly higher than the 75% found by Hess and Leal (2005, p. 246). 20 Although this figure is quite high, it is more than 10 percentage points lower than the successful reelection rates seen by incumbents running in state legislative and congressional elections.
That incumbents run for reelection only 59% of the time is possibly the most noteworthy result in Table 3. This figure is lower than for state legislators and members of Congress. The difference could be due to unique features of the local school board position—including minimal compensation, few office resources, ample opportunity to move to higher office, or frustrations about limited policy impact. The relative reluctance of many sitting school board members to stand for reelection, and the corresponding high level of member turnover, likely affects the accumulation of policy expertise and institutional knowledge as well as the influence of school board members relative to superintendents and interest groups.
The high rate of retirement among incumbents, combined with the high rate of reelection among the minority who do seek additional terms, points to another important finding: Nearly 80% of the school board turnover we observe is driven by the decision of incumbents to not run for office, rather than by active decisions of voters to replace those who seek another term.
To be sure, a high rate of retirement-driven turnover could be consistent with electoral accountability. If incumbents are strategic and choose not to run again precisely when they expect to face particularly tough races—as scholars have found to be the case in congressional elections (see Jacobson, 2009)—elections may still serve as an effective mechanism for sanctioning and rewarding officeholders based on their performance and incentivizing public officials to pursue policies that serve the interests of constituents. We interrogate this hypothesis more thoroughly below when we directly model the factors that drive incumbent retirement decisions.
(Minimal) Evidence of Electoral Accountability
To examine how electoral dynamics correspond to school district characteristics, we merge the school board election data with records from the Stanford Education Data Archive (SEDA; Fahle et al., 2021). This collection includes achievement estimates based on test scores in math and English language arts in grades 3 to 8. It also contains demographic information on students, taken from the National Center for Education Statistics Common Core of Data. As the SEDA data cover the years 2009 through 2018, we focus on school board elections that take place during these years. Given the relatively short duration of the resulting panel, we combine the data across years and focus only on cross-sectional variation to increase precision. 21 Specifically, we use the “pooled” version of the SEDA dataset, featuring a single measure per district for both the achievement level and learning rate (discussed in more detail below). 22 Both measures average across all tested grades, years, and subjects. Given the cross-sectional nature of the data, the associations we discuss below are purely descriptive, not causal.
Panel A of Table 4 presents the results of linear probability models that regress various measures of electoral contestation 23 and competition—whether the incumbent runs, whether the election is contested, whether the incumbent wins, and whether turnover occurs 24 —on average achievement. In addition, all models include state fixed-effects, which account for time invariant state-level differences such as those related to student achievement as well as electoral and ballot-access rules that likely affect candidate entry patterns. The results indicate that student achievement is positively correlated with incumbent reelection rates and negatively correlated with overall school board turnover. We find no evidence of strategic retirement decisions—incumbents are actually less likely to run for reelection in districts where achievement is higher—nor of strategic candidate entry and scare-off effects (Cox & Katz, 1996).
Student Achievement and School Board Turnover
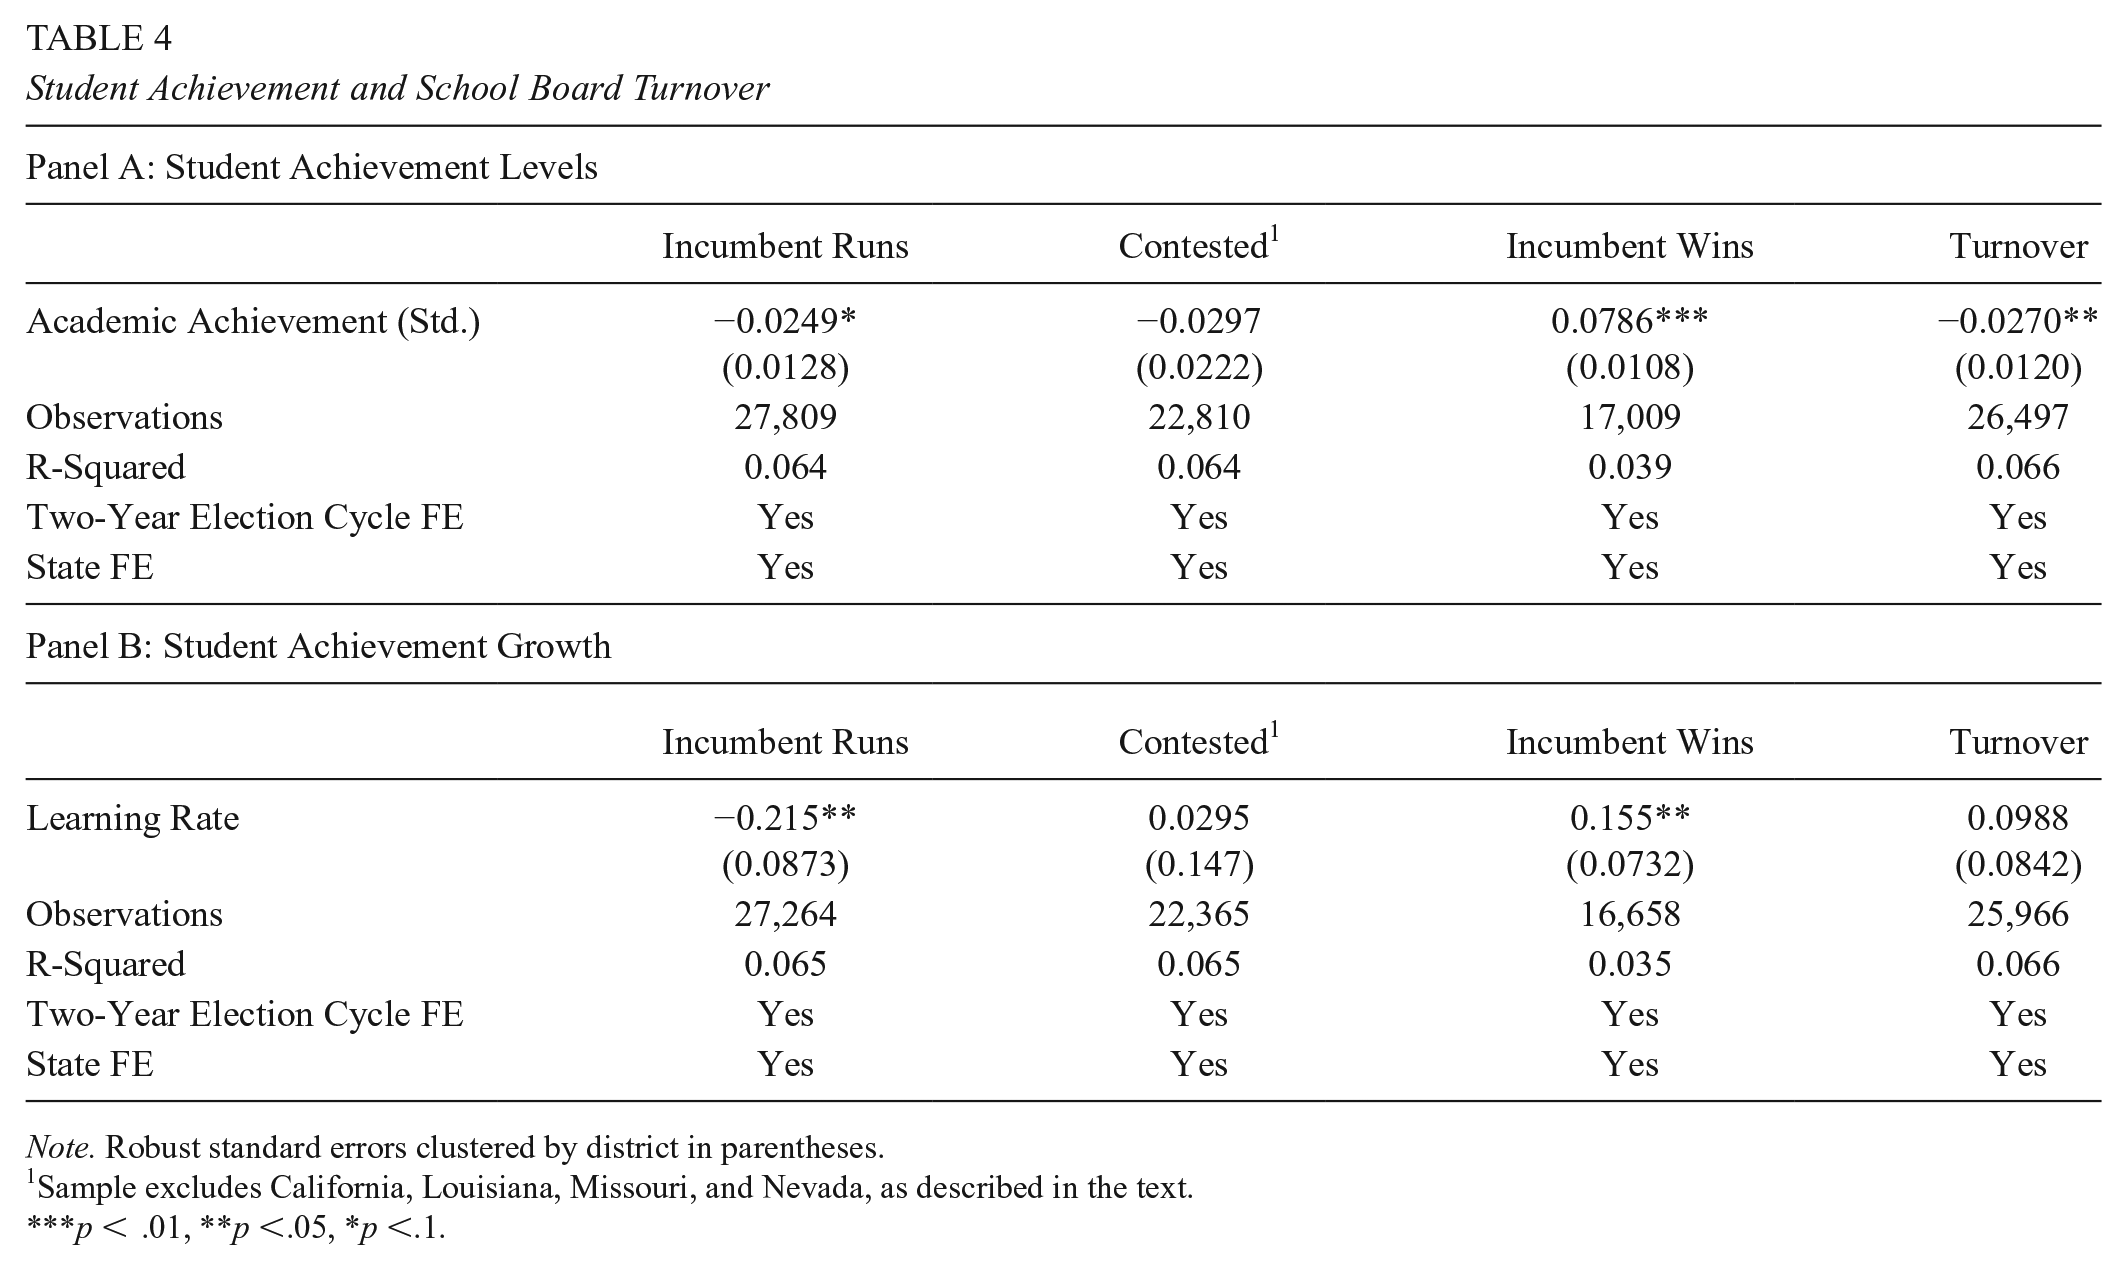
Note. Robust standard errors clustered by district in parentheses.
1Sample excludes California, Louisiana, Missouri, and Nevada, as described in the text.
p < .01, **p <.05, *p <.1.
The results thus far are consistent with models of retrospective voting in which voters hold incumbents accountable for performance realized under their watch. Whether this type of voting is normatively desirable, however, depends on the extent to which incumbents are actually responsible for differences in student academic outcomes, or whether voters are mistakenly punishing and rewarding public officials for outcomes largely beyond their control (see Achen & Bartels, 2017; Burnett & Kogan, 2017; Miller, 2013). This concern is particularly warranted in the context of education, given the well-known and quite strong relationship between student sociodemographic characteristics and test scores. 25
In the education literature, researchers typically isolate meaningful variation in educational quality from preexisting differences in academic preparation using value-added models that estimate how achievement changes at the student level over time. Research suggests that such measures come close to isolating school districts’ contributions to student learning (Angrist et al., 2023). Unfortunately, one cannot calculate student-level achievement gains using the SEDA data, given its aggregate nature. However, these data provide a proxy: Changes in how the performance of the same cohort of students changes across grades, which we call the “learning rate.” In an important validation exercise, Reardon et al. (2019) used student-level data from Massachusetts, Michigan, and Tennessee to show that this cohort-based learning rate is highly correlated with student-level value-added estimates aggregated to the school district level.
In Panel B of Table 4, we replace average achievement levels with cohort-based learning rates—our proxy for student-level value-added estimates of district performance. We find some evidence that voters are more likely to reelect incumbents in districts with higher student learning rates. However, the magnitude of this effect is quite small. The estimates suggest that a district increasing its learning rate from the bottom 10% nationally to the top 10% would experience a 2 percentage point increase in the probability that an incumbent school board member is reelected—four times smaller than comparable estimates for achievement levels. 26 For comparison, Hartney (2022) found that receiving the endorsement of the local teacher’s union increased the odds of an incumbent school board winning the next election by between 25 and 30 percentage points.
We also find that higher learning rates reduce the probability that incumbents run in the first place. 27 These two effects—on running and on voter support among those who run—cancel out, producing no net impact on school board turnover, although the point estimates are positive and suggest greater school board turnover in high-growth districts. Even the modest evidence of accountability we find is unlikely to reward actual performance, as it disappears in models that include a full suite of demographic controls (see Table A2 in the Supplemental Appendix).
Two studies focusing on California school board elections have previously found some evidence that election timing may moderate the effects of performance on incumbents’ electoral success (Payson, 2017; Scherer, 2014). Both find evidence of accountability only during high-turnout, even-year elections—when parents account for a larger share of the electorate. Although election timing does not vary in some states (and, thus, state fixed-effects account for differences in timing across those states) we can still estimate an interaction between election timing and the academic achievement and learning rate variables. These results are presented in Table A3 of the Supplemental Appendix. Unlike the earlier, California-only studies, we find no evidence that the relationship between student outcomes and school board incumbent performance or turnover depends on the timing of the election.
Collectively, the results presented so far suggest that the significant school board turnover we observe is not driven by local district performance in educating public school students.
What Explains the Link Between Achievement and School Board Turnover?
One possible explanation for why we see weaker relationships between student outcomes and school board elections when using measures of learning rates rather than achievement levels is that the latter largely capture demographic differences across districts. If true, this could imply that districts serving disadvantaged students also experience larger rates of school board turnover, a potentially worrying finding. We examine this hypothesis in two ways.
First, we estimate the bivariate correlations between achievement levels and various measures of student composition. Predictably, there is a large negative correlation (r=−0.8) between the proportion of students who qualify for free or reduced-price lunches (a proxy for poverty) and achievement levels. The relationship is still negative but much weaker (r=−0.16) for district learning rates. We also find that achievement is moderately and negatively correlated with the share of students of color enrolled in local schools as well as the percent of students who are English learners (r≈−0.3).
Next, we examine whether the relationship between achievement and student composition might explain the link between achievement and school board turnover. To do so, we regress each of the election outcomes on student demographic measures. Since the latter are correlated with each other, we carry out this analysis one variable at a time. In other words, each linear probability model estimates the bivariate relationship between school district election outcomes and a demographic measure, although all models control for time and state fixed-effects. 28 After estimating the results separately for each variable, we combine the point estimates and their associated standard errors into a single figure (Figure 1).
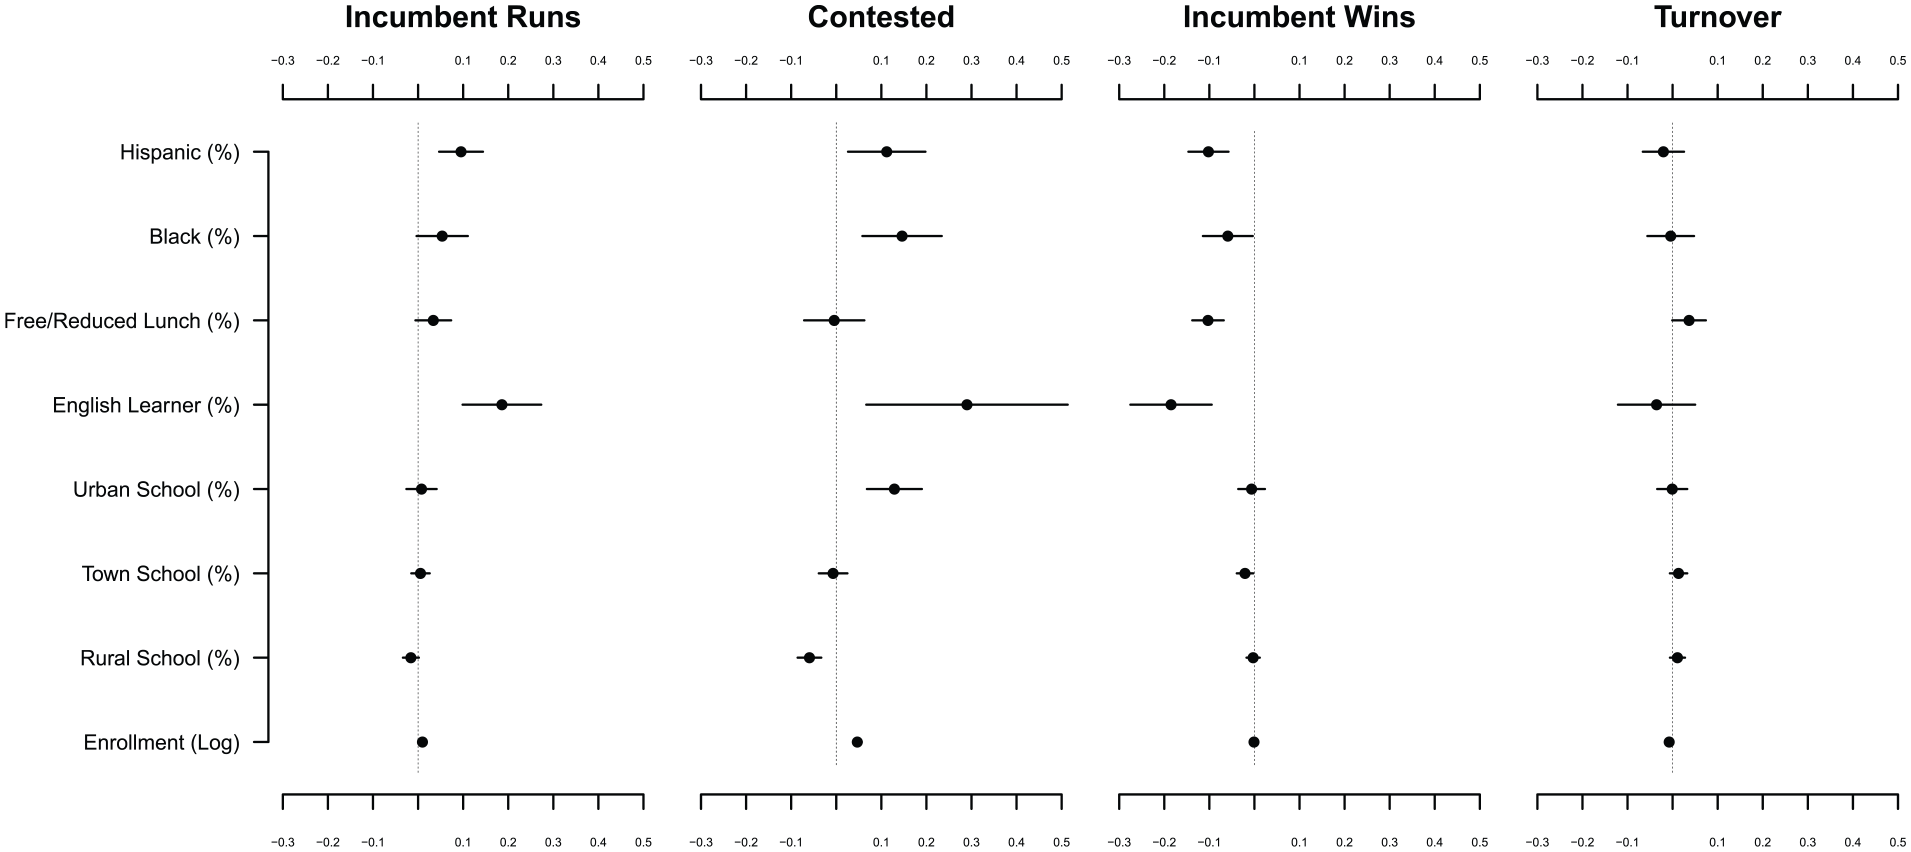
Student Demographics and Local School Board Election Dynamics
Overall, we see that school board members serving in districts that educate a larger share of non-White (especially Hispanic) students and English learners are more likely to stand for reelection. At the same time, these factors also increase the odds that an election is contested and that the incumbents who run again lose—with the latter likely a mechanical function of increased contestation. These effects—incumbents are more likely to run, but conditional on running, more likely to lose—largely cancel out, resulting in no significant difference in the probability that school board seats turn over. In addition, incumbents in high-poverty districts are somewhat more likely to run but are also significantly more likely to lose, resulting in modestly greater turnover. Indeed, the share of students qualifying for free and reduced-price lunch is the only demographic variable that is (marginally) significantly related with board turnover at conventional levels.
These results have three noteworthy implications. First, although we find statistically higher rates of board turnover in districts with lower achievement, there is limited evidence that districts educating more disadvantaged and minority students experience greater turnover, even though these demographic variables are highly correlated with achievement. Second, this null result masks some significant differences in the causes of board turnover. In higher-income communities serving whiter students, more turnover occurs because incumbents retire without seeking reelection. In lower-income communities serving more English learners and students of color, more turnover is the result of incumbents being defeated at the ballot box. We should stress, however, that these differences are substantively modest. For example, moving from the 10th to 90th percentile on any demographic variable affects the probability that an incumbent runs or that these incumbents are defeated by no more than 6 percentage points. The bottom line is that turnover is quite high across the board and due largely to incumbent retirements, regardless of the composition of students that districts educate.
Role of Media Environment
The statistically significant (but relatively small) increases in election contestation we find among urban districts serving disadvantaged students raise questions about the underlying mechanisms that might produce these differences. One natural mechanism to consider is variation in the local media environment. While the most popular media sources of political information in the modern era—cable news and social media—focus almost exclusively on national politics, local journalists do dedicate some time to covering local government issues. The extent to which they do so, however, depends on the ownership structure of media organizations (Martin & McCrain, 2019).
Local press coverage may affect school board elections through at least two mechanisms. On one hand, media attention can facilitate retrospective voting by making voters more aware of student academic performance or increasing the salience and weight of such considerations on Election Day (e.g., Hopkins & Pettingill, 2018). This is precisely what Berry and Howell (2007) find in their analysis of South Carolina school board elections, where voters seem to punish incumbents for low test scores only when the results of state assessments are covered in the newspapers. On the other hand, media tend to disproportionately cover incumbent office holders relative to challengers, which in other contexts has been found to increase the size of the incumbency advantage and reduce the competitiveness of elections (Meyers, 2023). These two effects push in opposite directions, making the net impact of media coverage theoretically ambiguous.
We explore this question by combining our school board election data with detailed information about the circulation patterns of local newspapers. We focus on newspapers because they played a particularly important role in disseminating state test score information and official academic accountability ratings during the period covered by our data, prior to widespread use of online sources such as Great Schools (Lovenheim & Walsh, 2018).
To quantify the intensity of local media coverage, we follow the empirical strategy first developed by Snyder and Strömberg (2010). Specifically, our measure captures variation in the geographic and population overlap between newspaper circulation areas and school district boundaries. The intuition is that school districts accounting for larger shares of a local newspaper’s readership are likely to be covered more intensely by its journalists. 29 The Supplemental Appendix provides additional details about the construction of our newspaper congruence measure.
These results are presented in Table 5. Overall, we find that districts more centrally located for newspaper coverage are more likely to have contested elections. We also find that incumbents are more likely to lose elections in districts likely to receive greater media scrutiny—although these districts do not experience significantly greater board turnover. Interestingly, the relationship with incumbent reelection success is the opposite of the effects found by Meyers (2023) in the context of state legislative elections, although we lack a strong identification strategy that would allow more direct comparison between the two sets of findings.
Newspaper Market Congruence and School Board Election Outcomes

Note. Robust standard errors clustered by district in parentheses.
Sample excludes California, Louisiana, Missouri, and Nevada, as described in the text.
p < .01, **p < .05, *p <.1.
Importantly, although the congruence measure is correlated with student demographic composition and district urbanity, media markets do not appear to mediate the results we found earlier. Controlling for media market congruence barely changes the coefficients on the association between the probability that a school board election is contested and the racial, ethnic, and English learner composition of students. 30 Some other mechanism, in other words, appears to explain why incumbents are more likely to face challengers and to lose in school districts that disproportionately educate a large number of racial and language minorities.
Table 6 examines whether media coverage moderates the relationship between student academic outcomes and election dynamics by interacting newspaper market congruence with academic achievement and learning rate. We find no evidence that media coverage makes student learning more salient to voters or moderates the other outcomes we examine.
Does Media Coverage Increase Salience of Academic Outcomes?

Note. Robust standard errors clustered by district in parentheses.
1Sample excludes California, Louisiana, Missouri, and Nevada, as described in the text.
p < .01, **p <.05, *p <.1.
Discussion
Our analysis of the largest collection of school board elections suggests that local democratic control produces very high turnover—a majority of incumbents with expiring terms in a given election cycle are replaced—with limited accountability. An important dimension of district performance that school boards can plausibly influence (the student learning rate) only modestly predicts whether voters reelect incumbents and whether incumbents retire. Average rates of turnover are similar regardless of a district’s urbanicity or the demographic characteristics of their students. However, Black and Hispanic students, and those living in urban areas more generally, are more likely to attend districts where more turnover is attributable to electoral contestation and, thus, is potentially more disruptive. We also find that, regardless of student composition, rates of school board turnover are higher in districts with low test scores due to factors outside these districts’ (and their leaders’) control. We briefly consider two explanations that may produce these electoral dynamics and their implications.
Public school accountability and rating systems, which tend to emphasize the differences in student achievement levels rather than achievement growth, likely encourage such perverse electoral dynamics (see, e.g., Kogan et al., 2016b). This explanation is also consistent with other research on voter behavior in local elections, which finds that voters frequently punish local elected officials for outcomes in which they played no part (Burnett & Kogan, 2017; de Benedictis-Kessner & Warshaw, 2020; Miller, 2013).
Another possibility is that the nature of political competition in lower-achieving districts is systematically different. These jurisdictions may attract a different mix of candidates and provide different opportunities for upward progression to higher office. Although we find less consistent evidence that strategic candidate behaviors—particularly incumbent retirement decisions—are systematically affected by test scores, we cannot rule out the possibility that the dynamics of candidate development and recruitment and electoral competition vary across communities in ways that correlate with student achievement. Overall, these results emphasize the importance of understanding what drives variation in the supply of candidates (see, e.g., Hall, 2019; Thomsen, 2017), particularly for these relatively low-profile local offices, since the decisions of incumbents to stand for reelection and whether they face challengers explain almost all of the aggregate turnover we observe.
Although much has been written about administrative and teacher turnover in schools and districts that disproportionately educate disadvantaged student populations, less attention has been given to similar dynamics on the school boards themselves. What happens on Election Day, however, likely has important consequences for school district operations and these downstream staffing decisions. For example, changes in school board majorities often precipitate the dismissal of superintendents and may cause broader disruptions that affect district operations and student learning (see, e.g., Akhtari et al., 2022).
Our results also have methodological implications for empirical work on school board elections. In light of our finding that most school board turnover is driven by incumbent retirements, analyses that focus only on the subset of elections where incumbents stand for reelection—the most common approach in the existing literature—potentially miss much of the important variation of interest. Although existing scholarly research (e.g., Henig et al., 2019) and popular news coverage (e.g., of Moms for Liberty and 1776 Project PAC) tend to focus on high-spending, competitive school board races, our data suggest that these represent the exception rather than the rule. In reality, a large share of school board elections go uncontested and much of the turnover on school boards is due to incumbents choosing not to stand for reelection, not their defeat at the ballot box. Thus, policy interventions or political trends that influence the willingness of sitting school board members to run for another term are likely to have far more aggregate impact on turnover and the composition of school boards than changes—even large changes—in the outcomes of contested school board elections that pit incumbents against challengers.
These findings are particularly relevant to governance reforms designed to improve student outcomes in under-performing school districts. These reforms are quite varied and wide-ranging, including state takeovers of local school districts, the establishment of charter schools, and the replacement of elected school boards with appointed bodies. Although the efficacy of these interventions appears to be quite heterogeneous and disputed (see, e.g., Raymond et al., 2023; Schueler & Bleiberg, 2022), they have proven to be highly controversial (e.g., Lay, 2022; Morel, 2018) in large part because they involve a significant loss of local democratic control.
Regardless of whether one agrees with the substance of such critiques, political appeals to local control appear to be based on a romanticized view of how local democratic control actually works. This view seems inconsistent with the empirical regularities we document in this paper, including largely uncompetitive elections and high rates of turnover driven by incumbent retirements and factors that appear to be orthogonal to student learning. Such turnover is even worse in lower-achieving school districts—precisely the locations where governance reforms have been focused. While we do not believe the evidence we present speaks dispositively in favor of (or against) any particular governance reform, it suggests that analyses of alternative governance arrangements that involve tradeoffs between improvements in student outcomes and local democratic control should be rooted in a more realistic picture of how school boards operate today.
Supplemental Material
sj-docx-1-ero-10.1177_23328584251349180 – Supplemental material for High Turnover With Low Accountability: Local School Board Elections in 16 States
Supplemental material, sj-docx-1-ero-10.1177_23328584251349180 for High Turnover With Low Accountability: Local School Board Elections in 16 States by Vladimir Kogan, Stéphane Lavertu and Zachary Peskowitz in AERA Open
Footnotes
Acknowledgements
We are grateful for helpful feedback and comments that Brian Jacob, Nat Malkus, and Paul Peterson provided on earlier drafts of this article and for research assistance from James Szewczyk and Carolyn Abott.
Funding
The authors disclosed receipt of the following financial support for the research, authorship, and/or publication of this article: The Spencer Foundation funded data collection via a Lyle Spencer Research Award (201600072).
Note: This manuscript was accepted under the editorship of Dr. Kara Finnigan.
Notes
Authors
VLADIMIR KOGAN is a professor of political science at the Ohio State University. His research focuses on the intersection of politics and public policy in areas including education and social policy. Kogan’s work has been published in top scholarly journals, including American Political Science Review, American Journal of Political Science, Journal of Policy Analysis and Management, and Journal of Public Economics.
STÉPHANE LAVERTU is a professor in the John Glenn College of Public Affairs at the Ohio State University. He primarily conducts studies on education governance and policy, including school district politics, state and federal accountability systems, charter schools, private-school vouchers, and school district finance. Lavertu holds a doctorate in political science from the University of Wisconsin–Madison, a master’s degree in education from Stanford University, and a bachelor’s degree in political science from The Ohio State University.
ZACHARY PESKOWITZ is an associate professor of political science at Emory University. Peskowitz’s primary research focus is American politics, with a particular interest in how elections affect policy outcomes. His articles have been published in American Political Science Review, American Journal of Political Science, Journal of Politics, Journal of Policy Analysis and Management, Journal of Public Administration Research and Theory, and other scholarly outlets.
References
Supplementary Material
Please find the following supplemental material available below.
For Open Access articles published under a Creative Commons License, all supplemental material carries the same license as the article it is associated with.
For non-Open Access articles published, all supplemental material carries a non-exclusive license, and permission requests for re-use of supplemental material or any part of supplemental material shall be sent directly to the copyright owner as specified in the copyright notice associated with the article.