
Abstract
The United States faces growing teacher shortages, disproportionately impacting schools serving students of color, low-income students, and those in rural or urban areas. Special education teachers (SETs) are especially in demand. Nearly half of all teaching vacancies are filled by teachers switching schools each year, yet little research explores switching, particularly by subject. Utilizing longitudinal data covering 27 years and over 1.2 million teachers in Texas, this study examines SET switching patterns relative to core subject teachers, utilizing discrete time hazard modeling, fixed-effect regressions, and geographic information system mapping. Results show that SETs switch schools at much higher rates, associated with experience, salary, and student demographics, yet generally transfer shorter distances than their peers. These findings highlight differential subject-specific labor market dynamics, suggesting targeted recruitment and retention strategies to address widespread shortages.
Keywords
Introduction
Concerns about teacher supply, demand, and shortages have intensified in recent years—and with good reason. Teacher preparation numbers have remained stagnant since the 2010s (Fuller, 2022), while teacher dissatisfaction (Kraft & Lyon, 2024) and the intention to leave the profession (Doan et al., 2023)—both strong predictors of actual attrition (Nguyen et al., 2020)—have reached record levels. In the 2024–2025 school year, approximately two-thirds of U.S. public schools reported difficulties filling vacancies with qualified teachers (National Center for Education Statistics (NCES), 2025). Teacher shortages are highly contextual, varying by geographic location (Nguyen, 2020), subject area (Mason-Williams et al., 2020), and both teacher and school characteristics (Clotfelter et al., 2007). Urban, rural, low-performing schools, and those serving high concentrations of students living in poverty have historically faced greater challenges in recruiting and retaining teachers—particularly in special education and science, technology, engineering, and math (STEM)—compared to suburban, higher-achieving, Whiter, and more socioeconomically advantaged schools (Bettini et al., 2023; Goldhaber et al., 2023), which are more likely to offer favorable working conditions (Simon & Johnson, 2015). Much of this uneven teacher sorting has long been attributed to teachers starting their careers in schools with one or more of the former set of characteristics and then moving to schools that are suburban, higher-achieving, Whiter, and/or more socioeconomically advantaged (e.g., Simon & Johnson, 2015). However, researchers have rarely tracked individual teacher career paths across multiple positions and schools to gain a comprehensive view of how switching schools impacts the labor market and shortage trends. A better understanding of these patterns could inform policies aimed at improving teacher retention and addressing shortages in high-need areas.
Research on teacher shortages has substantively and positively informed policy and practice, especially in terms of (a) novice teacher placement (e.g., Perrone & Meyers, 2023) and (b) teacher retention/turnover as a binary outcome (e.g., Nguyen et al., 2020), especially for novice teachers (e.g., Edwards & Anderson, 2023). However, research provides limited insights into the approximately half of all empty vacated teaching positions (roughly 300,000 annually) in U.S. public schools that are filled by “switchers”—teachers who switch from teaching in one school in one year to teaching in another school the following year (e.g., Taie & Lewis, 2023). In a time of potentially exacerbating and spreading teacher shortages, understanding more nuanced teacher labor market trends becomes increasingly important, especially for districts and schools struggling to recruit in-demand subject area teachers (e.g., Edwards, Kraft, et al., 2024).
Given this gap in our understanding, the present study aims to inform the field about the switching behaviors of teachers, with specific attention to one of the most critically needed subjects—special education (e.g., Goldhaber et al., 2023). We concentrate on special education teacher (SET) switching given the increasing need to address SET shortages as the proportion of students receiving special education services grows (e.g., NCES, 2024a), and as research continues to emphasize the need for further exploration of SET switching (e.g., B. Billingsley & Bettini, 2019), including understanding the characteristics of the schools to which SETs switch (Gilmour, 2024). See Bettini et al. (2023), Gilmour et al. (2023), and R. J. Theobald et al. (2021) for excellent overviews of SET supply, demand, and shortages. This study addresses the following research questions: (1) What trends define and differentiate SET within-field switching? (2) Which individual, school, and district features explain SET within-field switching? Using longitudinal administrative data in Texas from 1995 through 2022 following over 1.2 million teachers, we utilize both discrete-time hazard and fixed-effect regression modeling of within-field SET switching behaviors to answer calls for general teacher labor market research to differentiate and focus on high-needs subjects (e.g., Cowan et al., 2016) and geographic disparities (e.g., Edwards, Kraft, et al., 2024). We devote particular attention to traits that generally remain unexamined but highly important in the SET labor market, including teacher (e.g., sex, race) and school correlates (e.g., demographics, size) of SET switching along with accompanying geospatial switching trends (locale, distance between schools).
As one of the few studies in recent years to follow teachers longitudinally across schools and multiple switching events (Sun, 2018; Williams et al., 2021), we aim to provide comprehensive insight into the SET labor market that can inform local and state policy decisions to address critical SET shortage issues as well as potential district and school recruitment approaches and geographic ranges. We begin with an overview of the literature regarding teacher switching patterns, largely covering quantitative teacher and school factors per our framework, the geographic nature of teacher switching, and the SET labor market. Next, we introduce our guiding conceptual framework, followed by our analysis plan, including a description of the data used and the modeling approach. We then present and describe the results of our two main research questions, and, lastly, we discuss our results’ policy, recruitment, and theoretical implications.
Literature Review
Research addressing teacher shortages via teacher mobility patterns has substantively informed policy and practice, especially by providing clearer understandings of (a) recruitment of new teachers into schools and (b) both novice and veteran teacher turnover as a binary outcome (switching and leaving treated as the same). These areas of prioritized exploration are justified as beginning teachers (a) are a central workforce supply source and represent tremendous potential as growth in effectiveness is greatest in the early years (e.g., Podolsky et al., 2019) while also having a higher risk of turnover than their non-retirement eligible veteran peers (e.g., Nguyen et al., 2020). Focus on teacher turnover as a binary outcome (b) is also crucial because switching from a school and leaving the profession both require a school to recruit for and fill an empty position, regardless of whether the teacher remains in the profession or not. Available datasets also tend to be unable to measure switching due to geographic (e.g., district-level data cannot follow teachers who switch outside a district) and temporal limitations (e.g., cross-sectional datasets rarely contain enough observations to make certain inferences about switchers and often do not track teachers to their subsequent placements). Nonetheless, our understanding of switching patterns from school to school, including for SETs, remains relatively limited at a time in which this group of switchers may be at a greater premium.
Switchers (i.e., teachers who teach in one school one year and switch to teacher another the following year) account for half of U.S. teacher turnover each year and also naturally fill half of all vacated positions (roughly 8% of teachers switch each year; e.g., Taie & Lewis, 2023), yet we know little about their larger career patterns. We present an overview of the literature relevant to this study below, beginning with predictors of switching and the research capturing to where teachers switch. We then proceed to inform our study with the research related to the roles that geographic distance and teacher subject have with general teacher and SET hiring and turnover, as both hiring and turnover are part of switching.
Predictors of Switching
Research has firmly identified sets of teacher and school factors that predict turnover, but less is known regarding such associations with switching. The extant research has, however, generally established that certain characteristics can predict switching as a binary outcome, and these characteristics largely mirror those for turnover as a terminal outcome variable. Most relevant to the focus of this study, Nguyen and colleagues’ (2020) meta-analysis of the teacher turnover literature (1980–2018) found that SETs and STEM teachers have higher odds of switching than their peers, holding all other variables constant. Additionally, fitting one or more of the following teacher characteristics also predicts greater odds of switching than staying at the same school: being of color/not White; having an advanced degree; being National Board Certified; having a lower salary; having less teaching experience; and working in an urban (as opposed to rural) school or a school with a higher proportion of students living in poverty. B. Billingsley and Bettini’s (2019) review of the SET turnover and turnover intent literature (2002–2017) revealed an absence of turnover research disaggregating switching findings for SETs, let alone for SETs of color and male SETs. Gilmour’s (2024) recent study of SET mobility has helped begin to address this SET literature gap. Using North Carolina administrative data, Gilmour found that SETs with higher observation scores and over 30 years of experience were less likely to within-field switch than their SET peers, while novice SETs were more likely than veteran SETs to switch to teach special education in another school.
Importantly, research has found that working conditions are generally more salient predictors of teacher switching than teacher and school characteristics. Nguyen et al. (2020) found that lower levels of administrative support, classroom autonomy, effectiveness ratings, and professional development are positively associated with switching. At the same time, working conditions are often associated with several of the aforementioned characteristics that also predict switching (e.g., student poverty level and working conditions are often positively associated; Simon & Johnson, 2015). Studies accounting for working conditions in switching tend to have some limitations in that they usually use cross-sectional survey data that are not administered in subsequent schools and/or do not have sample sizes large enough to make reliable inferences about the schools to which switchers transition. It is also rare for state data to contain reliable information about school working conditions across many years (see Sun [2018] and Williams et al. [2021] for rare exceptions) and we are unaware of statewide datasets that track individual teacher perceptions of working conditions across multiple years. Similarly, very few longitudinal studies account for or make findings pertinent to the schools to which individual teachers switched in longitudinal studies.
From and to Where Switchers Switch
General teacher sorting patterns have long been inferable based on school faculty compositions as well as turnover trends. However, sparse literature has used teacher-level data to trace switches from departure (schools/districts they switched from) to arrival (schools/districts to which they switched) or how these switches occur across a career (e.g., how many times the average teacher switches, when switches tend to take place).2,3 Hanushek and colleagues’ (2005) investigation into teachers in one large urban Texas district (1989/1990–2001/2002) found that switches tended to be to schools with higher math scores and lower proportions of students who were Black, Hispanic, and living in poverty and that arrival school salaries were relatively higher for intra- than inter-district switchers. Miller (2012) found that, when holding all other variables constant, switchers in New York State (1984/1985–2003/2004) starting in metropolitan schools were more likely to transfer to suburban schools and rural switchers switched to other rural schools but were more likely out of district. Béteille et al. (2009) determined that higher-performing transfer teachers within Miami-Dade County Public Schools (2003/2004–2008/2009) had higher odds of switching to schools with higher value-added principals than other transfer teachers. Boyd et al. (2011) found that more effective New York City School District teachers (2006/2007–2007/2008) were less likely to apply for intra-district transfer but more likely to be hired when they did than their peers. Feng and Sass (2017) found that switchers in Florida (1996/1997–2002/2003) tended to switch to higher-performing schools with lower proportions of Black students, and being a higher-performing switcher predicted switching to higher-performing schools.
Overall, the research tracking teacher switches from one school to the next is relatively sparse and dated. Two more recent studies, however, have tracked teacher switches from departure to arrival school through the 2010s and did so with attention to switching differentiation by teacher race. First, Sun (2018) examined elementary and middle school switching patterns between Black and White teachers in North Carolina (2004–2015). The researcher found that Black teachers in North Carolina were more likely than White teachers to switch to schools with higher percentages of Black students. Williams et al. (2021) also investigated the switching patterns of rural Georgia K–12 teachers (2010/2011–2018/2019). The authors revealed that Black switchers in rural schools were significantly more likely than White rural switchers to transfer to another district and for that subsequent district to be suburban or urban.
Roles of Geographic Distance and Subject Area in Switching
This section provides an overview of what is known about the roles of geographic distance in teacher labor markets as well as potential differential switching patterns by subject taught. It is important to note that switching includes aspects of hiring as it encompasses both leaving a position and finding and securing (or being transferred to) a teaching position elsewhere.
Geographic distance
As noted earlier, research has found that factors of geographic locale (e.g., rural, urban) can predict to where teachers switch, and that there is a tendency to migrate towards suburban schools over time (e.g., Miller, 2012). Much of the related research understandably and usefully treats geography in switching with a categorical locale variable (urban, rural) and does not include information about the distance between arrival school and other relevant places (e.g., departure school, college attended). Yet, various geographical distance factors appear to be highly influential in teacher switching, although they have been examined substantively more in initial teacher placement than switching activities. The proximity of a teacher’s hometown, college, and student teaching site has been a salient predictor of the location of a teacher’s first placement with teachers having a high likelihood of working near one or more of those sites in a national study (Reininger, 2012) as well as in New York State (Boyd et al., 2005), Texas (Edwards, Kirksey, et al., 2024), and Washington State (e.g., Goldhaber et al., 2014, 2021; Krieg et al., 2016). Research has made similar findings regarding principal preparation students’ internship sites having close proximity to principal candidate employment before and after the practicum (Drake & Bastian, 2024).
Research has generally posited that teacher labor markets are highly localized and contextual (e.g., Edwards, Kraft, et al., 2024), but much of this is based on studies of teacher hiring at the school level rather than larger teacher career patterns with switching (e.g., Engel & Cannata, 2015; Perrone & Meyers, 2023). Little is known about how teachers switch across different points of their careers or how far from where they currently work that teachers are willing to switch. Research does show, however, that teacher applicants across career stages have been more likely to apply for positions near where they live or grew up than positions farther away (e.g., Engel et al., 2014; Killeen et al., 2015), and schools and districts have also historically tended to favor local applicants in advancement to the interview stage (e.g., Hinrichs, 2021) and eventual hiring (Jacob et al., 2018; Killeen et al., 2015). Proximity to home appears to be a key factor in teachers’ job applications. In the 2000s, Chicago Public Schools, teachers with STEM degrees were more likely to apply to schools closer to their residences, particularly those that were higher-performing and socioeconomically advantaged (Engel et al., 2014). Similarly, in Washington State, schools and districts that hosted more student teachers—or that were near districts that did—tended to hire more highly qualified candidates (Goldhaber et al., 2021). While research has found that teachers living closer to home in one large urban district was positively associated with higher retention rates, lower teacher absence rates, and higher student test scores (Santelli & Grissom, 2024), it remains generally unclear if there are similar trends in teacher switching distance. This latter dearth of knowledge has implications for teacher recruitment practice and policy, specifically in terms of the scope and span of recruitment efforts.
Teacher subject area and SETs in particular
Teacher labor markets and needs are highly place-specific and vary substantively by subject area (e.g., Edwards, Kraft, et al., 2024). As noted earlier, teachers have historically been unevenly distributed across schools based on geographic location and student demographics of race/ethnicity and socioeconomic status. Urban, rural, lower-achieving, less White, and less-resourced schools have consistently faced challenges in attracting and keeping teachers (e.g., Bettini et al., 2023), often being unable to fill some or all vacancies with credentialed teachers (e.g., NCES, 2024a). Specific to special education, where SETs are of premium demand, over half of U.S. public schools in March 2024 reported having a SET-specific vacancy to fill before the next school year (NCES, 2024b), with almost three quarters of schools with SET departures reporting challenges to filling them with certified candidates in August 2024 (National Center for Education Statistics 2025). Some research suggests considerable choice for in-demand subject area teachers as, for instance, SETs and STEM teachers were more likely to be hired directly out of their teacher preparation programs in Washington State (Goldhaber et al., 2022). Still, research on recruiting and hiring that reports by subject area is highly limited, including for SETs and SET switchers (Perrone & Meyers, 2023).
SETs deserve special attention given previously noted increasing needs for teachers in special education (e.g., Bettini et al., 2023) as rising numbers of students receive special services (e.g., NCES, 2024b). Meanwhile, 79% of SETs in 2022 were White, while the majority of special education students are not (NCES, 2024b), and there are substantive benefits for students of color to be taught by teachers of color (e.g., Joshi et al., 2018; Redding, 2019). This teacher–student incongruence warrants further investigation into SET career trajectories by race/ethnicity (e.g., B. Billingsley & Bettini, 2019). At the same time, there are also clear signs of discrimination against teacher applicants of color that must be considered in any investigation of teacher hiring (e.g., Bailes & Guthery, 2023; D’Amico et al., 2017). Similarly, the SET field is overwhelmingly female (86%; NCES, 2024b), but research has yet to quantitatively examine mobility trends among male SETs (e.g., B. Billingsley & Bettini, 2019).
Conceptual Framework
Research-based frameworks enable researchers to situate their studies of teacher turnover within the larger body of literature and facilitate their findings’ use by other researchers, policymakers, and practitioners (e.g., B. Billingsley & Bettini, 2019; Grissom et al., 2016). However, B. Billingsley and Bettini’s (2019) review of the SET turnover and turnover intent research found that just one-third of the relevant studies from 2002 to 2017 utilized a guiding framework or theory, and those that did vary in framework choice. Our study follows Billingsley and Bettini’s call for SET-centered turnover research to employ research frameworks and theories to better inform the field and practice. Given the limited research on teacher switching (e.g., Nguyen et al., 2020), particularly in terms of tracking switchers of any subject area from one school to the next (e.g., Williams et al., 2021) and SET switching in general (e.g., none of the studies covered in B. Billingsley and Bettini’s [2019] review examined predictors of actual SET switching), we ground our study in the broader teacher turnover literature.
Nguyen and colleagues’ (2020) updated quantitative conceptual framework for teacher turnover helps to frame our quantitative study. Based on a meta-analysis of 120 studies (1980–2018), the framework categorizes turnover predictors—factors potentially influencing teacher career patterns—into three sets of factors: (a) teacher, (b) school, and (c) external/policy. Teacher factors include teacher characteristics (e.g., age, sex, race/ethnicity, family status) and qualifications (e.g., experience, subject specialty, graduate degree). 1 School factors encompass organizational characteristics (e.g., size, locale, administrative support, professional development), resources (e.g., class size, expenditures), student demographics (e.g., achievement, race/ethnicity, socioeconomic status), and relational demography (i.e., teacher-student or teacher-principal racial/ethnic congruence). Personal and school factors may interact with each other, jointly shaping turnover outcomes. External/policy factors include accountability policies (e.g., teacher evaluation, merit pay) and workforce conditions (e.g., salary, local employment rates), which may also be posited as influencing the effects of personal and school factors and/or directly influencing turnover independent of other factors.
We adapt Nguyen and colleagues’ framework by replacing their turnover outcome with a switching outcome. Switching entails both leaving a teaching position at a school and being hired at another school or transferring within a district (voluntarily or involuntarily). Therefore, we examine both Nguyen and colleagues’ turnover outcome in a binary switching variable and a continuous measure of distance between schools and relationships that policy/external factors may have with differences between the schools switchers leave and the schools to which they migrate. As noted earlier, only a small set of studies has investigated switching from one position to the next (e.g., Boyd et al., 2011; Williams et al., 2021). Still, these few studies suggest that teacher factors (race, effectiveness) and the school factor of urbanicity/locale predict switching as a binary outcome and switching across contexts defined by differential school-related factors (student achievement, student race, principal value-added) and external/policy factors (salary). Despite the lack of switching research capturing arrival schools, many of the core predictors of turnover and switching as a terminal form of turnover (not capturing the school to which a teacher switches) may be similar (e.g., Nguyen et al., 2020). Thus, we situate our investigation within Nguyen and colleagues’ broader conceptual framework of turnover. In doing so, we account for various teacher (e.g., subject taught, sex, race), school (e.g., level, urbanicity), relational demography (teacher–student race congruence), and external/policy (salary) factors established as influential in the turnover literature to provide insights into switching as a form of turnover, both binary and encompassing of the differences between departure and arrival schools. A visual representation of our adapted conceptual framework with the variables we were able to account for in our administrative data can be seen in Figure 1.

Conceptual Framework for Within-Field Switching Across Schools
It is important to note that we focus our investigation on within-field switchers (originally termed “teaching position transfers” by Boe [1991]), which are teachers who switch schools from one year to the next but remain teaching in the same subject. We do not include out-of-field switchers—teachers who teach in one subject one year and change to another the next year (Boe, 1991). Focusing on within-field switching aligns with our objectives to inform policy, recruitment strategies, and SET labor market research for veteran SETs. SETs who switch out of field translate into losses for the SET workforce (e.g., B. S. Billingsley, 1993) and represent attrition from the SET pool in our framework. Thus, out-of-field switches, which are important for the STEM workforce (e.g., Bettini et al., 2023), fall outside the scope of our conceptual framework, appearing to account for just one-fifth of SET within- and out-of-field switches combined (e.g., Gilmour, 2024). Uniquely, our large longitudinal administrative Texas teacher dataset allows us to make valuable and meaningful inferences about within-field switchers and the roles of subject area and geographic mobility, which have been understudied in the extant research.
Methods
We ask two research questions to better understand the dynamics of SET switching: (1) Which trends define and differentiate SET switching? (2) Which individual, school, and district features explain SET switching? Below, we detail our data and methodological approach.
Data and Measures
We utilize roughly 30 years of longitudinal data collected by the Texas Education Agency’s Public Education Information Management System (PEIMS) and the National Center for Educational Statistics (NCES) Common Core of Data from the 1989/1990 to 2021/2022 school years. The PEIMS system collects data on every certified individual in the Texas education system, including individual, school, and district-level data. This set contains records of 113,109 SETs in total, along with covariates aligning with our conceptual framework (Figure 1) including teacher factors (sex, race, age, experience), school factors (standardized student academic proficiency rate, enrollment, student racial composition, percentages of students identified for free and/or reduced meals [FARM] and/or identified for special education services [SE], school level [e.g., elementary, high, all/other grades] and locale [e.g., urban, rural]), and teacher salary as an external/policy factor. Notably, some covariates, such as the percentage of students achieving proficiency on the state exam, were first collected in 1995, so statistics and models utilizing these variables were restricted to the period of 1994/1995 to 2021/2022. (For ease of reporting, we refer to each school year as the year in which it ends from this point forward. For instance, the 1994/1995 school year is referred to as 1995.)
We identify SETs as those individuals who are designated with subject area “special education” as their highest full-time-employment (FTE) category in the dataset for a given year. We do not include any other types of subject area definitions (e.g., speech pathologist) in this group. To provide a comparison to our SET teacher observations, we also include teachers from the “core” subjects of elementary, mathematics, reading/English language arts, science, and social studies. We combine these into the category of core subject teacher (CST). For both SETs and CSTs, we restricted observations to teachers who were above 0.5 full-time employment (FTE) in a given subject area at a single site. Teachers with multiple campus-subject designations were counted by their highest FTE appointment greater than 0.5; those who did not have a subject FTE > 0.5 were censored. Part-time teachers, with a total FTE less than 0.5 were also not included.
From this set, we identified each time an SET or CST switched schools from one year to the next. We operationalize teacher switches as horizontal transfers within the certified subject area within a traditional public school in Texas (SET or CST). Switches from or to specialized types of schools (e.g., “alternative”; “vocational”; “special education”) were not included in the analysis, given that these positions and school types are likely to be under different mobility constraints, incentives, and policy environments. To maintain focus on the research questions at hand and adhere to our conceptual framework, we do not consider switches to a different content area assignment or from a teaching position to a non-teaching position (e.g., from teaching to instructional support). Research has shown such out-of-field switches to be differential processes involving changes in career rather than movements of setting (Atteberry et al., 2017).
Analytic Approach
Given the general scarcity of research on within-field mobility—particularly for SETs—we take a broadly exploratory approach. We look to identify major trends and patterns but do, per calls in the field (e.g., B. Billingsley & Bettini, 2019), focus on SET race/ethnicity and sex in our findings. Below, we detail the approach for each research question.
RQ1: What trends define and differentiate SET switching?
To gain a general understanding of the characteristics defining of the SET switching market, we examine SET and CST market trends compositionally, longitudinally, and geographically. First, we examine the composition of the SET teacher market, comparing individual and school-level descriptive statistics for both SETs and CSTs in Texas from 1995 to 2022. This examination includes comparisons between SET and CST switching frequencies as well as select teacher (race, sex, age, experience), school level and locale (urban, suburban, town, rural), and external/policy (salary) factors. We also include within-SET teacher group comparisons by teacher factors of sex and race, given previous literature. Second, we examine these patterns longitudinally to illustrate how differences in switching rates have changed over the 27-year period. Third, we look at the geographical characteristics of the SET and CST switching market, using ArcGIS Pro with NCES district boundaries to plot switching locations, density, and frequency across the state of Texas.
RQ2: Which individual, school, and district features explain SET switching?
Upon examining the major trends of the SET switching market, we next explore underlying features that are associated with (1) switching events and (2) switching distance. Beginning with switching events, we employ discrete time hazard (DTH) modeling to estimate the relative risk of a switching event in a given time period while including teacher (sex, race, age, experience [< 4, 4–12, > 12 to be consistent with other SET studies, e.g., Gilmour, 2024], salary) and school characteristics (enrollment, student demographics, racial congruence with > 50% of school, school level, locale) in our estimations. These models allow us to compare the overall difference between SET and CST switching risk based on the current school conditions. We run models containing both SETs and CSTs to capture between group differences, as well as models restricted to just SETs and CSTs to distinguish within-group trends. Models take the basic form below, whereby ν represents the baseline hazard and γ represents school fixed effects:

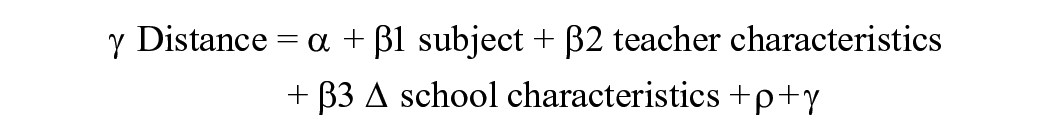
For our estimates of SET switching distance, we employ the same basic structure with ordinary least squares (OLS) regressions estimating switch distance with ρ year and γ school fixed effects. Given that models estimating distance switched only include teachers that did move from one school to another (and not those that remained), we use the difference score (Δ) between the departure school and arrival school, for example, Δ salary = (arrival) salary t1 – (departure) salary t0. We do this noting that differences in school conditions reveal relative positional preferences (Perrone et al., 2022), which allows us to observe which conditions teachers are willing to move towards (e.g., switching for a larger salary bump). Here, we use the general model form:
Our initial dependent variable, within-career switching, is a binary event indicating whether a teacher changed schools but remained in the same content area (i.e., special education, core subject). We censor events where a teacher moved to another content area, another position (e.g., assistant principal), or out of public schools. Our second main dependent variable—switching distance—is calculated using Vincenty’s (1975) Euclidian distance method as the distance in miles between the departure and arrival school. Covariates are all time-variant and within-year standardized when applicable, with salary being adjusted to 2022 dollars, adjusted for regional cost of living differences (NCES, 2021), and standardized.
The models presented here were selected to balance fit and explanation, with robustness checks for multiple alternative specifications, including various fixed effects (e.g., district, county) and hierarchical linear model combinations. These models showed the best balance of goodness-of-fit across McFadden’s adjusted and Craig & Uhler’s r-squared (Singer & Willett, 2003), as well as lower Bayesian information criterion (BIC) scores (Raftery, 1995). Alternative specifications were nearly identical substantively. Multicollinearity checks demonstrated an average variance inflation score of < 3, suggesting that while some covariates are correlated (e.g., % FARM and % Proficient), they did not substantively bias results (O’Brien, 2007). 4
Limitations
Before proceeding, it is important to point out a few limitations. First, teacher switching does not necessarily reflect individual preferences to leave a particular position or move to a specific place. Teachers can be transferred involuntarily for a multitude of reasons, and those who voluntarily transfer must have the opportunity of a position to transfer to. Switches can be based on personal factors, such as dissatisfaction with leadership or a spousal relocation, which are not captured in TEA data, although switching does confer a certain level of willingness to take a position. As such, we caution the reader that in line with many studies of teacher labor markets, interpretations are correlational rather than causal, and we cannot differentiate between leaving voluntarily or being moved. Second, we use administrative data across many years and, thus, do not have data about school working conditions and are unable to connect teachers to student outcomes, similar to many prior studies of teacher and SET mobility (e.g., DeAngelis & Presley, 2011; R. Theobald et al., 2023; see Gilmour et al. (2024) and Gilmour and Stiefel (2024) for excellent overviews of how administrative data has and can inform research and policy on and for the SET workforce.) However, as the central aim of this study is to better understand large-scale observable patterns of teacher switching, we hope that more specific research regarding conditions and dispositions that help explain these major patterns can follow. In a similar vein, our data also do not capture other important variables that several studies have used, such as where an educator grew up or attended college (e.g., Edwards, Kraft, et al., 2024; Reininger, 2012) or the relationship between an educator’s current address and place of application or job offer (i.e., Killeen et al., 2015). Most often, this was due to inconsistent reporting over the time period and/or data availability. We attempted to address unobserved heterogeneity with school fixed effects (and other specification checks), but specific features like those mentioned above cannot be observed with our data.
Third, teacher designations are based on TEA role codes which assign an indicator for “specific teaching subject” for each teacher–year observation. Some teachers cover more than one subject, and our data has been coded to the main teacher subject. We censored teachers that had inconsistent role assignments (≥ 50% subject changes; ~1% of our sample) across years to account for some of this, but this is a coarse measure, and does not capture the nuances of teacher assignments. Fourth, there is undoubtedly a certain amount of endogeneity between geography and school switching patterns. For example, rural switches are likely to be farther, given rural districts’ lower density of schools. Fifth, Texas has geographical, social, economic, historical, and policy features that may not generalize to other areas. For example, Texas has a comparatively high (and growing) presence of alternative and for-profit SET preparation programs (Nguyen et al., 2024), does not allow for collective bargaining (Han & Keefe, 2022), and has a storied history of policy actions regarding special education—including a cap on special education caseloads that was later deemed illegal by the U.S. Department of Education (Ballis & Heath, 2021; DeMatthews & Knight, 2019). As a high-growth state, as well as one with both large cities and considerable land mass, we ask readers to draw comparisons and inferences to other state environments with caution.
Results
RQ1: What Trends Define and Differentiate SET Switching?
We begin examining the composition of within career switches for SETs with Table 1, which presents the mean characteristics of SETs from 1995–2022 with those of CSTs to provide a comparison. Given the amount of information here, we only focus on the main trends regarding switching. Most notably, we see that SETs, on average, have a strikingly higher annual rate of switching than CSTs by roughly 6.8 percentage points. Similarly, SETs had a greater mean frequency of within-career switches, at 3.15, compared to CSTs at 2.12 per teacher; the average SET taught in one more school than the average CST. However, the average distance between switches was roughly 13 miles shorter for SETs than CSTs. Additionally, we see that SETs tend to switch to different districts much less frequently (29%) compared to CSTs (47%). In subsequent columns, we disaggregate by sex and race. Here, we see that male SETs and Black SETs have a higher annual switch rate, male and Hispanic SETs have a higher mean frequency of switches, and White SET switches tend to be longer distances.
Characteristics of Special Education Teachers (SETs) and Core Subject Teachers (CSTs) in Texas, 1995–2022

We now turn to within-career trends in teacher switching. Table 2 presents similar descriptive statistics broken down by switch number, with 1 being a teacher’s first school switch, 2 their second switch, and so on, up to the fifth switch. In general, there is little variation regarding the average characteristics of teachers who switch more than others. However, a few slight trends bear out: SETs with more switches tend to move to schools with larger student populations and greater proportions of Hispanic students; fewer of these higher-frequency switchers teach in urban schools, and more are in rural schools.
Characteristics of Special Education Teacher (SET) and Core Subject Teacher (CST) School Switches

Note. Salary is adjusted to 2022 dollars. FARM stands for the % of students elligible for free and/or reduced price meals. SE stands for the % of students identified for special eduaction services. Groups of American Indian /Alaska Native (AIAN) and Other not included due to low observations.
We now turn to longitudinal trends. Figure 2, Panel A displays SET and CST within-career-switching. Given that we are not using covariates that were only available from 1995 onward, we display a full 30 years of teacher switching patterns, enough to encompass some longer-term teachers’ entire career durations. Here, we see that while close in overall trends, SETs have had a considerably higher annual switching rate than CSTs. Notably, whereas in around 2014 CST switching rates roughly stabilized, SET switching rates have continued to increase, although both SET and CST rates began to decline around 2020, likely a condition of the pandemic. However, moving to Figure 2, Panel B, we see that these switching rates differ considerably by locale. Here, we see that rural SET teacher switching is generally higher than suburban and urban rates, and the period between roughly 2002 and 2011 held vast differences by locale. From Panels C and D, we see that male SETs have higher switching rates and that in recent years, Black SETs have had considerably higher switching rates than other SETs.
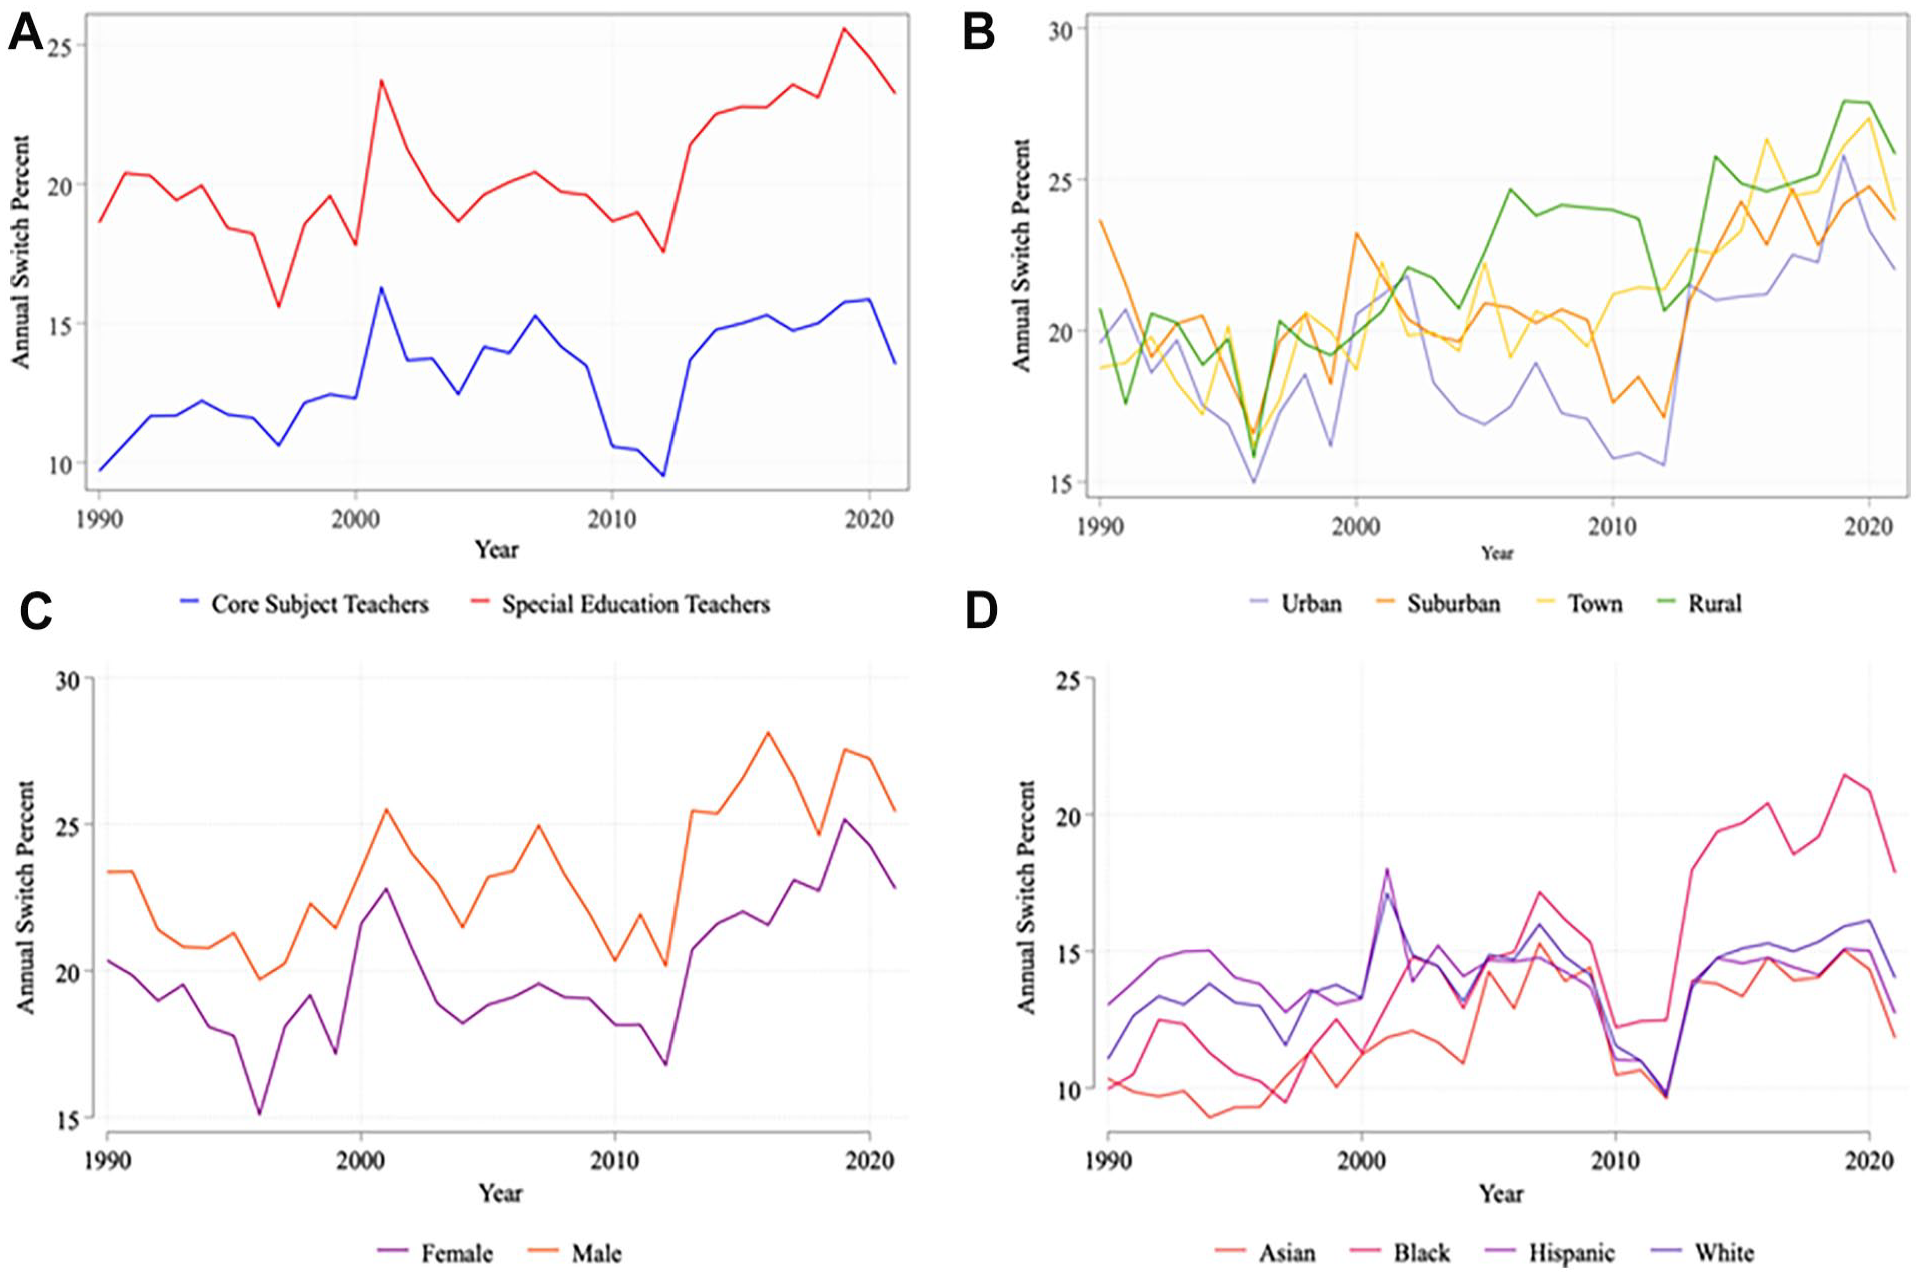
Special Education Teacher Switching Rates, 1990–2022: (A) SET Versus CST switching rates, (B) SET Switching by Locale, (C) SET Switching by Sex, and (D) SET Switching by Race
Considering the above longitudinal trends, we now turn to geospatial trends of SET and CST switching. First, we look at the rates of teacher switching by school district. Figure 3 presents the switching rates for SET and CSTs, operationalized as the number of SETs or CSTs that switched divided by the total number of SETs or CSTs in the district. Notably, we see a wide range of variability across the state and over time. For example, West Texas and the Texas Panhandle tend to have lower rates of SET switching, with higher rates in the major urban cores. However, for CSTs, the urban areas tend to have mid-level switching rates, while some areas, such as West Texas, have had higher rates as well as some sporadic high-switch districts in rural areas.

School District Special Education Teacher (SET) and Core Subject Teacher (CST) Switch Rate by Decade
Next, we examine SET and CST switching with attention to the distance between switchers’ departure and arrival schools. Figure 4 presents the activity spaces of SET and CST switches, broken down into decades and by race. In Panel A, we see that there has been an intensification amongst major metropolitan areas, such as Dallas, Houston, and San Antonio. However, simultaneously, there has been a slow but consistent reduction in the average distance between within-career switches, from an average of 33.99 miles in 1990 to 26.23 in 2021. Panel B shows unique trends in SET and CST within-career switches by race. Restricting just to 2020, we see that race significantly differentiates the switching spaces of SET and CSTs, with (1) Black SET and CSTs moving primarily between the central corridor of major urban cores of Dallas, Houston, and San Antonio; (2) Hispanic teachers more intensely along southern tracts including El Paso, Corpus Christi, and Laredo; and (3) White teachers switching around more northern regions around Amarillo, Lubbock, and Midland/Odessa. Notably, we also see a greater dispersion of Hispanic and White teachers around the state.

Special Education Teacher and Core Subject Teacher Switching Patterns by Decade and Teacher Race: (A) Movement by Decade, and (B) Movement by Race, 2015–2020
Overall, for Research Question 1, we can see that SETs have a much higher rate of within-career switching than CSTs but tend to switch more often and within shorter distances within their current district. Notably, male, Black, and rural SETs tend to have higher switching rates. The switching patterns of SETs tend to have intensified amongst core urban areas and are differentiated by race, with Black teachers switching amongst the core urban areas, Hispanic switchers moving more intensely along border regions, and White teachers switching between urban and northern rural regions.
RQ2: Which Individual, School, and District Features Explain SET Switching?
We now seek to understand which factors explain the above trends in within-career switching. To do so, we first focus on the risk of a school switch event. Table 3 presents the results of our discrete time hazard models, estimating the risk of a switch event based on teacher and departure school characteristics. Model 1 includes both SETs and CSTs and is used to test if the risk of a switch is significantly different between SETs and CSTs. Model 2 is restricted to SETs, and Model 3 is restricted to CSTs for comparison. Given the large amount of information presented here, we generally focus on main differences amongst SETs to maintain scope.
Risk of Special Education Teacher (SET) Within-Field Switching, 1995–2022

Note. Coefficients in Odds Ratios. Standard errors in parentheses. Reference categories set as Male, White, Elementary, Suburban. White run in separate models due to interdependency of school demographic proportions, with reference categories changed to Hispanic Urban. FARM stands for the % of students elligible for free and/or reduced price meals. SE stands for the % of students identified for special eduaction services. Groups of AIAN or Other not included due to low observations. Racial congruence means teacher race matches > 50% of school racial composition. School Level (Elementary, Middle, High, Other/All) also run in separate models due to invariance with school fixed effects.
p < .01, *p < .05.
From Model 1, we see that from 1995–2021, SETs have indeed been more likely to have a within-career school switch at a given time interval, with a nearly 50 percentage point increase in the odds ratio of a turnover event as compared to CSTs in a given year. Focusing on SETs in Model 2, we see that a school switch was less likely to occur for female, Asian, or Black SETs than male or White SETs. SETs with more experience were more likely to switch schools. Looking at salary, we see that SETs with higher salaries were less likely to switch schools, which runs counter to their CST counterparts. We also see that SETs who were racially congruent with their current school (i.e., the teacher’s race was the same as > 50% of the school’s racial composition) were less likely to switch from their current school. Moving to school characteristics, only a few differences bear out. SETs were less likely to switch from larger schools, those with more Black students, higher performing schools, elementary schools, and those in urban locales. Notably, SET switches were not statistically sensitive to the proportion of special education students in their school, nor were they sensitive to the % FARM, Asian, Hispanic, or White students as their CST counterparts were.
We next explore the distance moved by SET and CST switchers as a means to assess if there are particular amenities that teachers tend to switch farther distances towards. Table 4 presents the results of OLS regression models including teacher characteristics, the change in school characteristics between departure and arrival schools, and year and school fixed effects. The dependent variable is the distance traveled between positions, with coefficients in units of miles. From Model 1, which has both SET and CSTs included, we see that SETs move roughly 11 fewer miles than CSTs in a switch, suggesting that SETs stay more localized than CSTs in terms of switching behavior. Focusing on SETs in Model 2, we see there are no significant differences in SET teacher movement distance by sex, but that Asian and Hispanic SETs move a bit farther, while White SETs do not move as far. Interestingly, SETs switch greater distances for higher salary increases, which is not a feature mirrored by CSTs. SETs also move a considerable distance (on average 22 miles farther) towards racially congruent schools. Turning to differences in school characteristics, SETs appear to be less sensitive to conditional changes in school composition than CSTs. SETs do move farther for secondary schools, increased proportions of FARM, Asian, and Black students, and move shorter distances for increased proportions of Hispanic students. Similar to Table 2, differences in the proportion of special education students do not have any bearing on SET switch distance.
Distance of Special Education Teacher (SET) and Core Subject Teacher (CST) Switching in Texas, 1995–2022
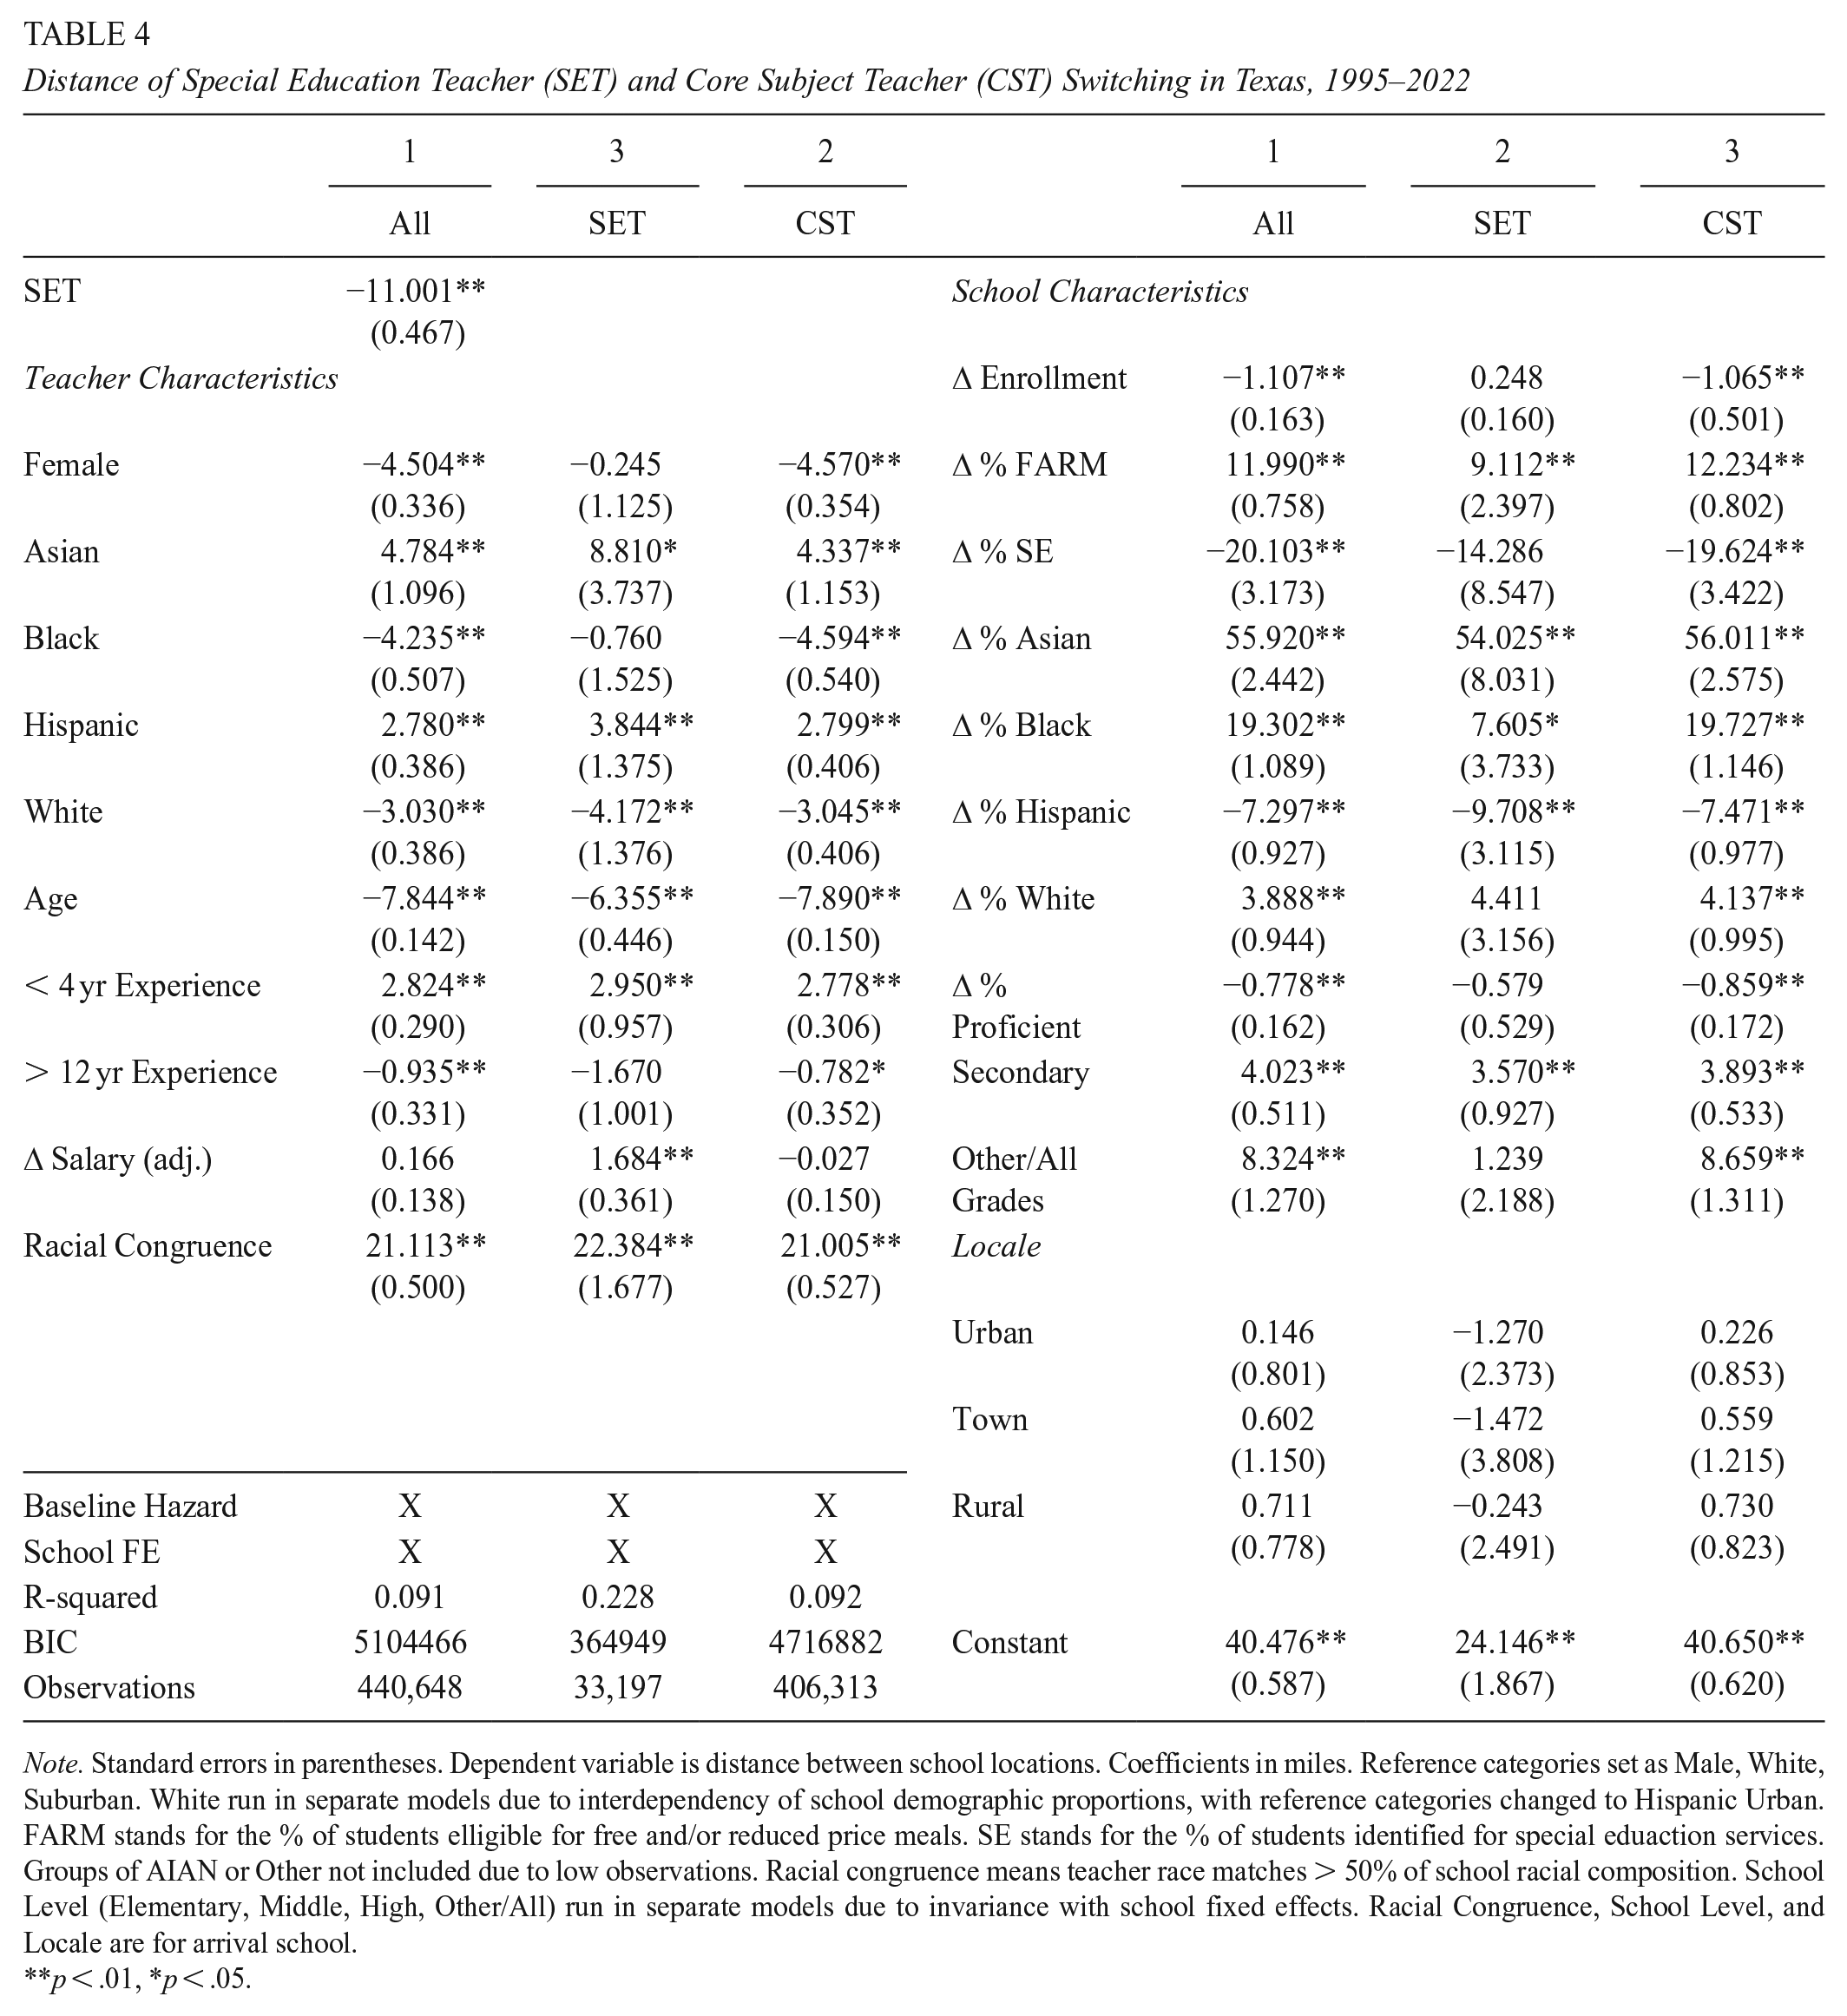
Note. Standard errors in parentheses. Dependent variable is distance between school locations. Coefficients in miles. Reference categories set as Male, White, Suburban. White run in separate models due to interdependency of school demographic proportions, with reference categories changed to Hispanic Urban. FARM stands for the % of students elligible for free and/or reduced price meals. SE stands for the % of students identified for special eduaction services. Groups of AIAN or Other not included due to low observations. Racial congruence means teacher race matches > 50% of school racial composition. School Level (Elementary, Middle, High, Other/All) run in separate models due to invariance with school fixed effects. Racial Congruence, School Level, and Locale are for arrival school.
p < .01, *p < .05.
In terms of Research Question 2, results from DTH and OLS regression models further support the earlier results that SETs have a higher risk of switching schools, but that SETs also tend to switch to schools that are much closer. These patterns also hold across sex, race, and locale. Additionally, these trends are generally consistent in our robustness check restricting the sample to just the last 5 years of data (2017–2022). See the Appendix for models comparing SETs and CSTs by sex, race, and locale, as well as models restricted to the last 5 years: 2017–2022. Notably, the risk of SET switching is not particularly well explained by individual and school characteristics, as noted by a low pseudo R2 (~9%) and higher BIC, which is generally consistent with turnover models (e.g., Grissom & Bartanen, 2019; Pendola & Fuller, 2021). However, distance models explain considerably more variance (R2 = 23%), suggesting that the conditions of a given switch have more bearing on SET movement.
Discussion
This study has examined the patterns of within-field switching to gain further insight into SET mobility and define areas where policy and recruitment practices may help address SET shortages. In the interest of building upon prior SET turnover research (e.g., B. Billingsley & Bettini, 2019) and Nguyen and colleagues’ (2020) conceptual framework of turnover, this study has broadly sought to address the call to isolate subject area differences in teacher switching patterns, particularly in areas of the most need (e.g., Bettini et al., 2023; Goldhaber et al., 2023), and extend investigations to understand to where teachers switch (e.g., Gilmour, 2024). We find considerable differences between SETs and CSTs in terms of the frequency, distance, and geography of switching, underscoring the need for specialized and localized strategies for recruitment and retention of SETs, particularly in areas of shortage. More specifically, we find that (1) SETs exhibit a pattern of locally-bounded churn, with higher rates, shorter distances, and more in-district instances of switching than CSTs; (2) SET within-field switching patterns exhibit variation by sex, race, and school characteristics that may reflect unique commitment and/or opportunity structures compared to CSTs; (3) SETs are much less likely to switch out of schools with higher salaries and that are racially congruent, but will also switch much farther to find them; (4) SET switching patterns vary considerably between state districts and regions, and demonstrate differential switch spaces by race.
To situate this study’s contributions to the research, we updated our adapted framework for within-field switching to reflect the specific factors that our study found to be associated with within-field switching (see Figure 5). Below, we use this framework to position our key findings, along with their implications for future research, policy, and educational practice.

Contributions to Conceptual Framework for Within-Field Switching Across Schools
Broadly, our results indicate that the geographic context—an external/policy factor—together with subject taught—a teacher factor—may play a key role in within-field switching. More specifically, the general pattern of SET mobility is characterized by higher, more locally-bound churn than that of CSTs. SETs more often stay in-district when switching, and switch across considerably shorter distances than their CST peers. This switching tendency builds upon Edwards, Kraft, and colleagues' (2024) findings that teacher shortages in Tennessee were often disproportionately experienced across schools within the same districts. This may signal several intertwined trends. It may denote that out-of-district SETs are less likely to be hired and therefore less mobile, echoing findings that nearby teacher applicants are more likely to be favored in hiring (e.g., Jacob et al., 2018; Killeen et al., 2015); it may be that many teachers prefer to move towards more “familiar” settings in their own district (e.g., Boyd et al., 2005; Cannata, 2010); or it may reflect central district decisions to relocate individuals to areas of need (e.g., Chingos & West, 2011), as just over half of within-district SET switches in the 1980–1990s workforce were involuntary (Boe et al., 1999). Likely, it is a combination of all three. In some sense, this localized churn may serve to offset some of the negative disruptions of higher turnover rates, if teachers are shuffling within a district and community context they are familiar with. However, even with such switches, there can be small disruptions in student outcomes (Atteberry et al., 2017). More research is needed to determine the extent to which SET switching, given its higher propensity, is driven by involuntary within-district transfers as the slight majority were in the previous century (Boe et al., 1999).
Underneath the overall trend of localized churn also lay nuanced differences across teacher factors, school factors, and external/policy factors that differentiate the SET within-field switching market (see Table 4). To maintain scope, we focus on major external/policy factors of salary and geographic context, teacher factors of sex and race, and the school factor of teacher–student racial congruence, but note that many other trends warrant exploration. To start, in line with prior research on individual teacher factors, we find that male SETs are more likely to switch schools compared to female SETs (Conley & You, 2017). This may expand upon research suggesting that male SETs may be more sensitive to school fit given they are a minority of SETs (14% in our sample; Rice & Goessling, 2005), but also the broader research that male teachers tend to switch more often (e.g., Nguyen et al., 2020). This, notably, does not translate into differences in distance traveled according to sex, which suggests that—unlike CSTs—the localized switching pattern is consistent for both male and female SETs. Here, efforts to help retain male SETs will be important, including facilitating preservice cohorts of male SETs and matching male SETs with cooperating male teachers (Rice & Goessling, 2005). While research on SET turnover by race is sparse and mixed (B. Billingsley & Bettini, 2019), we found that Asian and Black SETs are less likely to switch schools. This contrasts with CSTs, who saw decreased switching behaviors amongst Hispanic teachers and increased switching behavior for White teachers. Our findings partially align with prior research suggesting that SETs of color exhibit higher intentions to remain in their positions, particularly in urban schools where they feel more supported (L. A. Scott, Bell, et al., 2023). However, this may just as easily reflect limited options—or the perception of limited options—of job opportunities amongst these groups of teachers (Allensworth et al., 2009; Vagi & Pivovarova, 2017).
We also saw considerable regional differences according to the teacher factor of teacher race and the school factor of student race. Notably, there were clear distinctions in switching corridors among Black, Hispanic, and White SETs that follow the general racial geography of Texas. Our results on distance traveled suggest that when SETs do switch schools, there is a tendency to move farther towards schools with more Asian or Black students. Part of these tendencies may again reflect the racial geography of Texas, whereby Asian and Black students tend to be more distinctly concentrated in the major urban areas, which themselves are some distance apart. Hispanic and White populations tend to be more uniformly diffuse throughout broad regions across the state. What this emphasizes is that efforts to diversify the SET pool may require extra targeted efforts to attract candidates from different movement regions of the state, as well as to provide additional support to retain minority teachers in areas where they are less represented (Carver-Thomas, 2018). This may entail strategic recruiting and targeted position advertising in other switching corridors (Perrone et al., 2022), and, if possible, identifying racially and/or culturally matched mentors that can help support underrepresented SETs in both professional and pastoral transitions (Khalifa, 2016).
Next, we turn to school factors that impact within-field switching. Unlike the general trend found in the turnover literature where teachers tend to exit from higher poverty, historically minoritized environments (e.g., Nguyen et al., 2020), we see that such a pattern does not hold for within-field switching. At the school level, SETs were less likely to switch out of urban schools and those with more highly performing and Black students. This stands in contrast to CSTs who tended to switch out of schools with high proportions of students eligible for FARM, students with disabilities, and White students in suburban areas. The explanation behind this may either be on the side of hiring practices that narrow available opportunities (e.g., Bailes & Guthery, 2023), the perception of self-efficacy for movement (Vagi & Pivovarova, 2017), or may be influenced by district-level reassignment decisions that—although fairly infrequent (e.g., Grissom et al., 2014)—tend to be reactive to fluctuations in need and changes in student composition (Atteberry et al., 2017; Chingos & West, 2011). 5 Once again, it is likely some combination of each. More specific investigation into how SETs view mobility potential, as well as what constitutes desirable conditions, may help shed light on the trends observed, but certainly underscores calls for research to investigate how subject area labor markets are unique (e.g., L. A. Scott, Bell, et al., 2023).
In line with prior research on teacher satisfaction (e.g., Redding, 2019), our results also add to the emerging literature on the school factor of racial congruence in switching (e.g., Nguyen et al., 2020). Our findings demonstrate that both SETs and CSTs are less likely to switch out of racially congruent schools. 6 Moreover, both SETs and CSTs switch across considerably greater distances towards a racially congruent school. To date, research on teacher–student race congruence reveals positive implications for student learning, socialization, and other important outcomes (e.g., L. L. Scott, Kearney, et al., 2023; Shirrell et al., 2024). This may be even more crucial in special education, given the highly researched issues of discrepancies in identification and discipline by race (e.g., Ahram et al., 2021). Not only is there a phenomenon of misidentification of racially isolated students (Fish, 2019a), but also improved calibration of services in schools with racially congruent SETs (Fish, 2019b). While it is again unclear if this is due to teacher preferences or limitations of the labor market, the overall finding here that racially congruent SETs are less likely to switch adds to the argument for supporting efforts to attract and retain SETs that help represent the student body.
In terms of specific external/policy factors that impacted within-field switching, we see that SETs are less inclined to switch out of positions with higher salaries. While this has been a regular finding in the literature on teacher turnover (e.g., Nguyen et al., 2020), we also found that SETs will move greater distances for a greater salary bump. These results underscore research suggesting that SETs may be more sensitive to salary differentials in terms of turnover (Stock & Carriere, 2021), while the addition of switching distance contributes a new geographic dimension to our understanding of how this may matter. Calibrating SET salary offerings to be higher than neighboring schools may be an important tool for schools looking to recruit SETs. However, noting that higher salaries for CSTs both induce more switching behaviors and do not appear to attract local candidates, across-the-board salary increases may not necessarily address recruitment and retention in other subject areas.
Conclusion
Most broadly, these results echo concerns about the difficulties of addressing teacher shortages. The rate of within-SET switching is not only significantly higher than that for CSTs, but the SET switching rate is also slowly increasing. This is generally alarming given that high teacher churn is detrimental to student learning and well-being, specifically due to the disruption in connections, consistency, and integration of teaching practices within a school and community (e.g., Carver-Thomas & Darling-Hammond, 2019). However, following Nguyen and colleagues’ (2020) meta-analysis, heterogeneity in switching rates between schools can be largely influenced by school differences in administrative support, classroom, autonomy, effectiveness ratings, and professional development opportunities, which may be artifacts of larger district economic and policy environments. These, too, are couched in the socioeconomic context of an area—including housing opportunities, community amenities, and social climate—that impact teacher mobility decisions (e.g., Bacolod, 2007; Feng & Sass, 2017). While the heterogeneity across Texas regarding teacher switching is not surprising (e.g., Edwards, Kraft, et al., 2024), the finding that geographic switching patterns are different between SETs and CSTs does add emphasis to the notion that there are specific policy and socioeconomic conditions that may impact and incentivize teachers differentially by content specialty. This suggests that district-level supports, such as induction, professional development, and coaching specific to special education, can have a considerable impact (e.g., Gersten et al., 2001). In addition, locally competitive salaries, administrative support for navigating and advancing licensure requirements, and clear legal support can also help improve district attractiveness and facilitate improved SET retention (e.g., B. Billingsley & Bettini, 2019; Ondrasek et al., 2020).
As noted above, our data can only take us so far in understanding trends, opening a call for further investigation into why we observe such patterns, as well as to help identify preferences affecting teacher mobility by subject area. From a policy standpoint, however, our results underscore the importance of targeted retention strategies. School leaders concerned about SET shortages may want to look at the conditional and structural factors that differentiate SETs from CSTs as leverage points for retention. This may include the number of caseloads and workload, the amount of collaboration, social support, and integration between general and special education teachers, the climate of collective responsibility for student success, and clarity of role definitions (e.g., Mason-Williams et al., 2023; Ondrasek et al., 2020; Peyton et al., 2020). Importantly, given that SETs are more often moving within a local area, it will be important for school leaders to pay attention to neighboring school and district conditions to gain insight into where they may foster a comparative advantage. Overall, by highlighting how SET mobility and switching patterns are unique, we hope to underscore the importance of surpassing one-size-fits-all teacher recruitment and retention approaches and emphasize school, district, and policy strategies that are highly sensitive to the local environment.
Footnotes
Appendix
Distance of Special Education Teacher (SET) and Core Subject Teacher (CST) Switch in Texas, 2017–2022

| 1 | 2 | 3 | 1 | 3 | 2 | ||
|---|---|---|---|---|---|---|---|
| All | SET | CST | All | SET | CST | ||
| SET | −11.001**
(0.467) |
School Characteristics | |||||
| Teacher Characteristics | ∆ Enrollment | −1.107**
|
0.248 |
−1.065**
|
|||
| Female | −4.504**
|
−0.245 |
−4.570**
|
∆ % FARM | 11.990**
|
9.112**
|
12.234**
|
| Asian | 4.784**
|
8.810*
|
4.337**
|
∆ %SE | −20.103**
|
−14.286 |
−19.624**
|
| Black | −4.235**
|
−0.760 |
−4.594**
|
∆ %Asian | 55.920**
|
54.025**
|
56.011**
|
| Hispanic | 2.780**
|
3.844**
|
2.799**
|
∆ %Black | 19.302**
|
7.605*
|
19.727**
|
| White | −3.030**
|
−4.172**
|
−3.045**
|
∆ %Hispanic | −7.297**
|
−9.708**
|
−7.471**
|
| Age | −7.844**
|
−6.355**
|
−7.890**
|
∆ %White | 3.888**
|
4.411 |
4.137**
|
| < 4 yr Experience | 2.824**
|
2.950**
|
2.778**
|
∆ % Proficient | −0.778**
|
−0.579 |
−0.859**
|
| > 12 yr Experience | −0.935**
|
−1.670 |
−0.782*
|
Secondary | 5.509**
|
4.964 |
5.381**
|
| ∆ Salary (2022 adj.) | 0.166 |
1.684**
|
−0.027 |
Other/All Grades | 13.072**
|
8.577 |
13.025**
|
| Racial Congruence | 21.113**
|
22.384**
|
21.005**
|
||||
| Urban | 0.146 |
−1.270 |
0.226 |
||||
| Town | 0.602 |
−1.472 |
0.559 |
||||
| Rural | 0.711 |
−0.243 |
0.730 |
||||
| Constant | 40.476**
|
24.146**
|
40.650**
|
||||
| Baseline Hazard | X | X | X | ||||
| School Fixed Effects | X | X | X | R2 | 0.091 | 0.228 | 0.092 |
| Observations | 440,648 | 33,197 | 406,313 | BIC | 5104466 | 364949 | 4716839 |
Note. Standard errors in parentheses. Dependent variable is distance between school locations. Coefficients in miles. Reference categories set as Male, White, Suburban. White run in separate models due to interdependency of school demographic proportions, with reference categories changed to Hispanic Urban. School Level (Elementary, Middle, High, Other/All) also run in separate models due to invariance with school fixed effects.
p < .01, *p < .05.
Acknowledgements
The authors would like to thank Brandon Ryan for his support with this project.
Declaration of Conflicting Interests
The authors declared no potential conflicts of interest with respect to the research, authorship, and/or publication of this article.
Funding
The authors received no financial support for the research, authorship, and/or publication of this article.
Open Practices
Note. This manuscript was accepted under the editorship of Dr. Kara Finnigan.
Notes
Authors
ANDREW PENDOLA is an associate professor of Educational Leadership at Auburn University. His research interests include educator labor markets, educational policy, and school funding.
FRANK PERRONE is an associate professor of Educational Leadership at Indiana University Bloomington. His research interests include principal preparation, education policy, and the principal’s role in teacher career trajectories, including teacher recruitment, fit, growth, and retention.