
Abstract
The labor-market payoff to workers with associate degrees in healthcare and STEM occupations is very high in Massachusetts. We examine whether this induced a growing proportion of students in MA community colleges (MACCs) to earn an associate degree (AD) in one of these fields. We do this by using multinomial logit analysis to compare trends across 12 cohorts of MACC entrants in the proportion of students who earned an AD in a healthcare or STEM program within six years of entry.
We find a substantial increase across cohorts in the proportion of students who earned an AD in a STEM program, but not in the proportion who earned an AD in a healthcare program. We found differences in degree attainment by student gender, race/ethnicity, family income, and 10th-Grade mathematics score. Interviews with MACC program leaders revealed that supply constraints hinder expansion of many healthcare AD programs, but not STEM programs.
Keywords
Introduction
In recent years, building a skilled workforce in the healthcare and in the science, technology, engineering, and mathematics (STEM) fields has become a critical challenge for many states in the nation. In Massachusetts, the site of our current investigation, analysts predict that by 2030 the field of healthcare will constitute “the largest source of employment growth in Massachusetts [with] an estimated 210,000–230,000 [additional] jobs” and that careers in STEM will “account for 40% of the increase in total employment in the Commonwealth” (MA Executive Office of Education, 2022). These fields also tend to be highly-compensated. The state reports that entry-level earnings in STEM are approximately double those of all entry-level Massachusetts workers.
Community colleges play a critical role in preparing students for the STEM and healthcare workforce by offering a variety of associate-degree (AD) programs in these fields. Graduates of these programs have fared well in the Massachusetts labor market (Modestino & Forman, 2021). Of course, community colleges have several missions, including offering short-term workforce training and academic-enrichment opportunities and preparing students to transfer to four-year colleges and universities, as well as providing associate-degree programs that prepare students to thrive in local labor markets. We focus on an aspect of this last mission, providing associate-degree programs in the STEM and healthcare fields. AD programs in the STEM field offered by Massachusetts community colleges (MACCs) include information technology, engineering, cybersecurity, and electronics. Those in healthcare include nursing, medical imaging, laboratory technology, and dental hygiene.
This paper arises from a continuing partnership between our research team and the Massachusetts State Departments of Elementary and Secondary Education (DESE) and Higher Education (DHE). DHE staff members were concerned about questions of equity, including whether the probability of AD completion in high-paying fields was increasing for Black and Hispanic students and students from low-income families, groups that historically have not fared well in post-secondary education in the state (Papay et al., 2020). DHE staff members also wanted to know about the obstacles students face in earning ADs and the initiatives community colleges have introduced to help students overcome challenges.
To address these objectives, we used both quantitative and qualitative approaches. First, we used multinomial logit analysis to examine cross-cohort trends in the probability of associate-degree receipt in high-paying fields. Specifically, we use the term “cross-cohort trends” to refer to comparisons of completion rates in AD healthcare and STEM programs among groups of students who graduated from a MA public high school in a year between 2005 and 2016 and enrolled in a MACC soon thereafter. Second, to learn about the obstacles students faced in completing AD programs in healthcare and STEM, we interviewed MACC program leaders.
We addressed two broad descriptive research questions:
How do cross-cohort trends in the probability of earning an associate degree in a STEM or healthcare program within six years of entry into a MACC differ by student gender, race/ethnicity, family income, and Grade-10 mathematics achievement?
What obstacles hinder students’ completion of STEM and healthcare AD programs?
Our analyses revealed several patterns. First, male students had a much higher probability of earning an associate degree in a STEM program within six years of their entry into a MACC than did females. Second, female students had a much higher six-year probability of earning an AD in a healthcare program than did males. Third, White, and especially Asian, students in every entry cohort had higher probabilities of AD attainment in both healthcare and STEM programs than did their Hispanic and Black peers. Fourth, students raised in higher-income families had higher probabilities of AD receipt than students from low-income families. Fifth, students with relatively high Grade-10 mathematics achievement were much more likely to earn an AD within six years of MACC entry, especially in STEM specialties, than students with lower math scores. Sixth, the estimated six-year probabilities of degree attainment in healthcare, and especially in STEM, increased across the MACC entry cohorts from 2005 through 2016 for students in almost every racial/ethnic group. Seventh, supply constraints hinder expansion of many healthcare programs, but not STEM programs. Finally, academic and financial challenges pose obstacles to students’ progress toward an AD. We describe these patterns in greater detail in our Findings section.
Note that our research is entirely descriptive and does not provide causal evidence about the effectiveness of any particular policy initiative. 1 Nevertheless, we believe that the paper contributes in important ways to existing research on community-college associate-degree attainment and educational inequality. First, to our knowledge, it is the first paper to examine long-term trends in the attainment of associate degrees in high-demand fields for community-college students with specific demographic, educational, and economic characteristics. Second, the rich descriptive evidence of cross-cohort trends coupled with program-leaders’ insights about the challenges students face in pursuing ADs in high-demand fields provides a basis for generating informed hypotheses about the types of programs and activities that might reduce inequalities in post-secondary educational attainments.
In the next section, we summarize prior research that informed our study. Then, we outline our research design. In the subsequent section, we present our principal findings and offer explanations for them. Finally, we discuss implications of our research and findings.
Background
One reason our research should be of interest beyond Massachusetts is that labor-market returns to associate degrees in healthcare and STEM are high in other states as well, including California, Kentucky, North Carolina, Ohio, and Washington. 2 It is also the case that another characteristic of the community-college experience in Massachusetts, that more than half of entrants do not earn any credential within six years of entry, is also common to other states, as research from the National Student Clearinghouse (NSC) has documented (Lee & Shapiro, 2023).
A considerable body of evidence has documented racial/ethnic disparities in educational attainments in the United States and has identified factors that contribute to these inequalities. For example, analyses of NSC data have documented gaps by race/ethnicity in six-year degree completion rates among students who first enrolled in a public community college in 2014. Only 28% of Black students and 36% of Hispanic students in this entry cohort had completed a degree program within six years, while comparable figures for White and Asian-American students are 49% and 51% respectively (Causey et al., 2022, Appendix Table 41A).
A critical determinant of these racial/ethnic gaps in educational attainments is long-standing discrimination in labor markets, housing, healthcare, and schooling. Black and Hispanic parents in our society have fewer financial resources, on average, than White parents (Darity & Mullen, 2022; Rothstein, 2017; Shrider et al., 2021). One consequence is that, on average, Black and Hispanic parents are less able than White parents to pay for high-quality child-care, enrichment activities, tutoring, and the many other goods and services known to promote the development of children’s knowledge and skills (Duncan & Murnane, 2011). A second consequence is that Black and Hispanic parents are less likely than White parents to possess the financial resources to pay for their children’s college education.
A striking pattern in the educational attainments of Americans is the key role of student gender and its interactions with student race/ethnicity. National data from 2020 show that a greater proportion of 25–29-year-old females in every major racial/ethnic group had earned at least a two-year college degree than had their male counterparts; however, the magnitude of this gender gap differed among racial/ethnic groups. Among White students and Hispanic students, for instance, the gap was approximately 12 percentage points; among Black students, it was 9 percentage points; and among students of Asian descent, it was less than 4 percentage points (De Brey et al., 2021, Table 104.20).
Many studies have also documented that students from low-income families fare less well, on average, in post-secondary education in the United States than students from higher-income families (Belley & Lochner, 2007; Bleemer & Quincy, 2024; Haider & McGarry, 2018; Papay et al., 2020). Bailey and Dynarski (2011) show that the gap in college-completion rates at age 25 between students from high- and low-income families was considerably larger among students who were teenagers in the 1990s than among those who were teenagers in the 1970s. Cameron and Heckman (2001) show that differences in family income play an important role in explaining why young Black and Hispanic adults have lower college-graduation rates than their White peers.
Finally, many studies have shown that basic academic skills, as measured by students’ scores on standardized tests of mathematics and English-language arts (ELA) administered during the high-school years, are strongly associated with post-secondary educational attainments (Bailey & Dynarski, 2011; Belley & Lochner, 2007; Murnane et al., 1995, 2000; Papay et al., 2020).
Research Design
Site
Massachusetts provides an interesting site for our research for two reasons. First, the State’s economy is focused on information technology and healthcare, resulting in strong demands for workers with skills in these fields. 3 Second, the State is rated as having one of the strongest K–12 education systems in the country (Morse & Brooks, 2023). Consequently, young adults in Massachusetts may be better prepared, on average, to take advantage of post-secondary educational opportunities than their peers in many other states. At the same time, as is the case in other states, Black and Hispanic students and students from low-income families in Massachusetts exhibit lower academic achievement in high school and complete fewer years of schooling, on average, than do their peers (Papay et al., 2020).
In Massachusetts, students from historically marginalized groups who go to college after graduating from high school are especially likely to enroll in a community college. For instance, 37% of Black youths and 51% of Hispanic youths who entered college within two years of graduating from a Massachusetts public high school in 2016 enrolled in one of the State’s public community colleges. Forty-six percent of graduates from low-income families did so. The comparable figures are 19% of White high-school graduates, 16% of Asian graduates, and 19% of graduates from higher-income families. These statistics illustrate why community colleges have an important role to play in the State’s efforts to reduce existing racial/ethnic and family-income-based inequalities in educational attainments.
Dataset
In partnership with the Massachusetts DESE and DHE, we assembled a large longitudinal data repository containing detailed information on the demographic, socio-economic, and educational backgrounds of all students enrolled in a Massachusetts public high school in the 2002/03 (henceforth, 2003) through the 2022 school years. Our repository also contains these students’ scores on the Massachusetts Comprehensive Assessment System (MCAS) tests, which have been administered since 1998 to virtually all 10th-Grade public-school students in Massachusetts. Our repository also contains extensive individual longitudinal data, drawn from DHE administrative records, on all students who subsequently enrolled in the state’s public colleges and universities over the same period. Finally, it contains information from the NSC on the enrollment histories and academic credentials of all students who enrolled in virtually all colleges or universities in the U.S. during the corresponding time periods.
Analytic Sample
From the data repository, we drew an analytic sample of 81,911 students who satisfied three conditions. First, each student had taken the 10th-Grade MCAS achievement tests for the first time in a school year between 2003 and 2014 and had then graduated from a Massachusetts public high school within three years of taking the test. 4 Second, each student had then enrolled in an associate-degree program in a MACC in the fall term immediately following their high-school graduation, or in the subsequent fall term. Third, each student had enrolled full-time in their first fall term or at least half-time in both the fall and spring terms of their community-college entry year. 5 Henceforth, we refer to these students as the 2005 through 2016 MACC-entry cohorts. To investigate trends across these 12 cohorts in students’ receipt of an AD in a healthcare or STEM program, we tracked these students for up to six years following their entry into a MACC. Our analytic sample contains 72% of all Massachusetts public high-school graduates between 2005 and 2016 whose first post-secondary enrollment was in a MACC and who enrolled upon entry in an associate-degree program. 6 In interpreting our findings concerning cross-cohort trends in students’ associate-degree attainment, it is important to recognize that the composition of our analytic sample differed from cohort to cohort. Also, within each successive cohort, our analytic sample differed increasingly from the composition of both the population of all MA high-school graduates and also from the population of graduates who enrolled in a four-year college or university soon after high-school graduation. We illustrate these patterns in Figures 1–3.
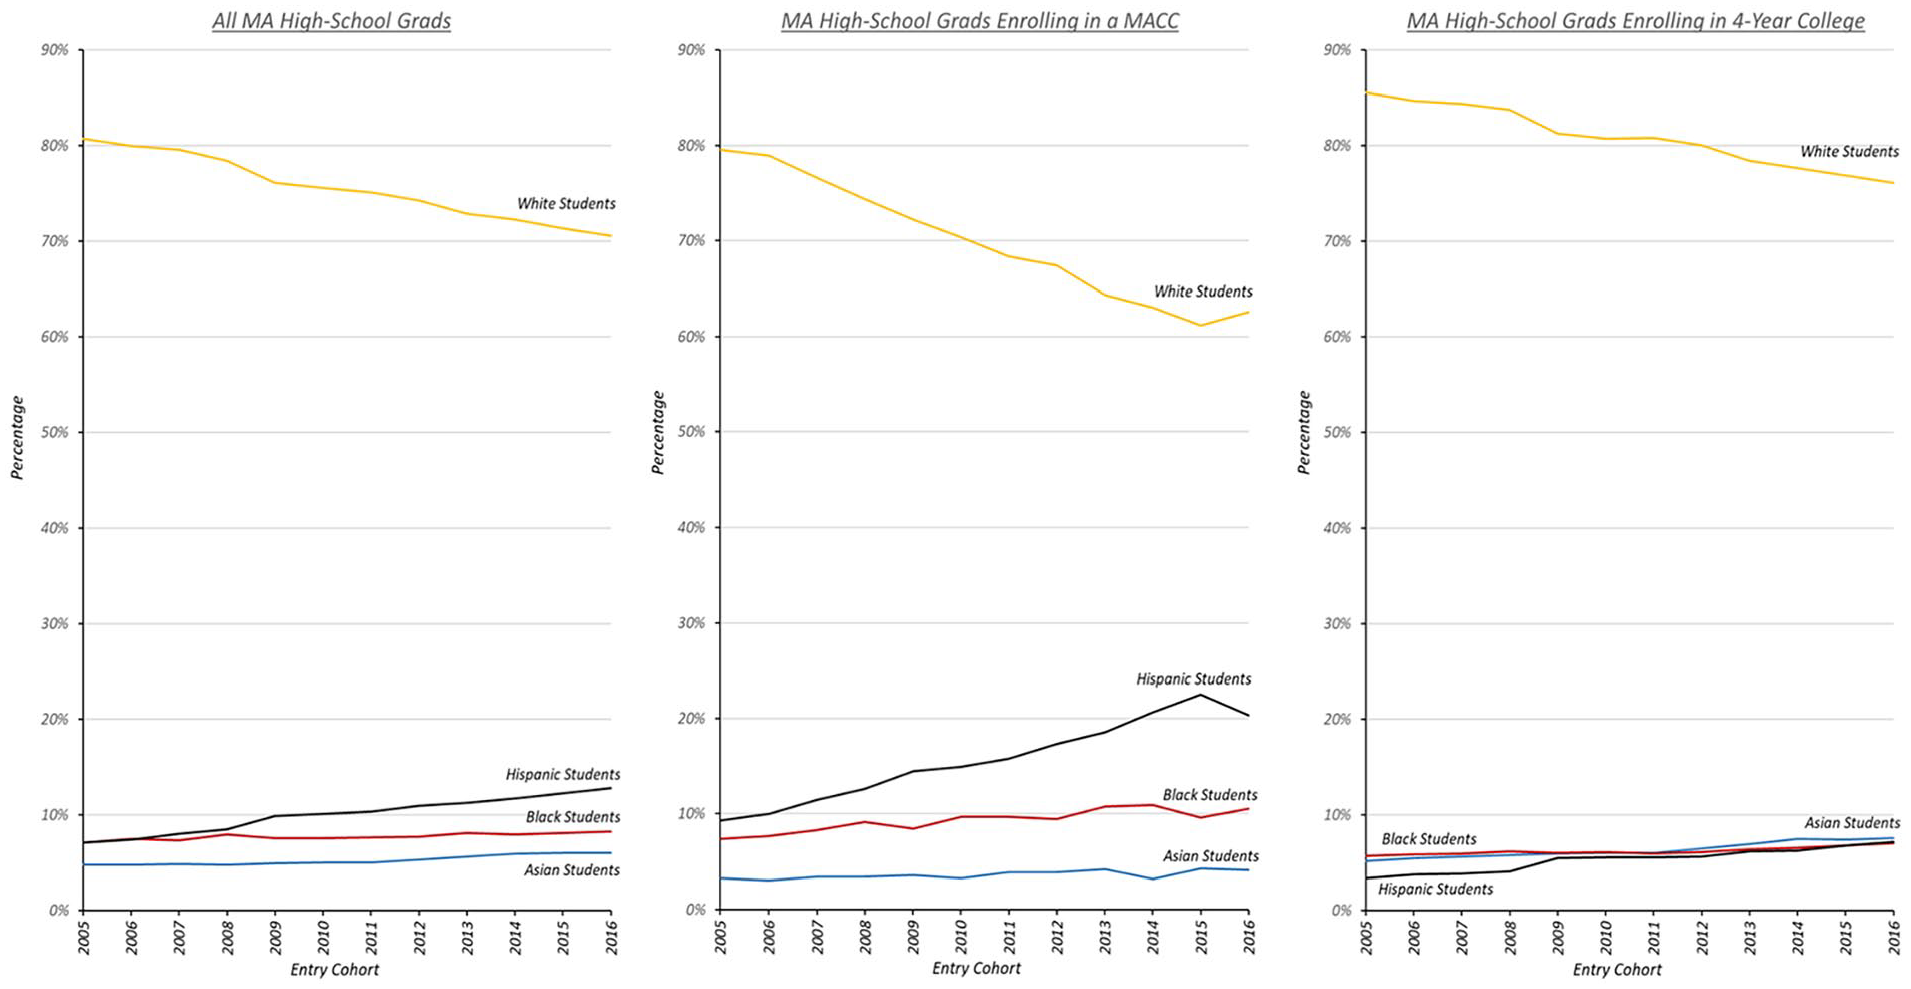
Estimated percentages of all Massachusetts high-school graduates who self-declared that they were of Asian, Black, Hispanic or White heritage plotted annually across the 2005 through 2016 MACC entry cohorts, within three groups: (a) all graduates (left panel), (b) all graduates who enrolled subsequently in a MACC (middle panel), and (c) all graduates who enrolled subsequently in a four-year college or university (right panel).

Estimated percentage of Massachusetts high-school graduates eligible for a free or reduced-price lunch (FRPL) in 10th Grade, plotted annually across the 2005 through 2016 MACC entry cohorts for three groups of high-school graduates: all graduates, all graduates who enrolled subsequently in a MACC and all graduates who enrolled subsequently in a four-year college or university.

Estimated percentage of Massachusetts high-school graduates who were ranked above the state average on the Grade-10 MCAS math test, plotted annually across the 2005 through 2016 MACC entry cohorts, for three groups of high-school graduates: all graduates, all graduates who enrolled subsequently in a MACC, and all graduates who enrolled subsequently in a four-year college or university.
First, in the three panels of Figure 1, we display cross-cohort trends in the racial-ethnic composition of these three groups. In the left-hand panel, notice that the percentage of all MA high-school graduates in our sample who were Hispanic increased by six percentage points (from 7% to 13%) between the 2005 and 2016 cohorts while the percentage of HS graduates who were white declined by 10 percentage points (from 81% to 71%). Across these same entry cohorts, there were similar trends in the composition of the group of MA high-school graduates who enrolled in a four-year college (Figure 1, right panel): the percentage of Hispanic students in this group increased by four percentage points (from 3% to 7%) and the percentage of White declined by 10 points (from 86% to 76%). Finally, in contrast (Figure 1, middle panel), among MA high-school graduates who enrolled in a MACC soon after their HS graduation, the percentage of students who were Hispanic increased by 11 percentage points (from 9% to 20%) over the 2005 through 2016 entry cohorts while the percentage of White students declined by 17 percentage points (from 80% to 63%).
The cross-cohort trends in the percentage of HS graduates who had been raised in low-income families also differed considerably by group. This is illustrated in Figure 2, where we display the cross-cohort trends for three groups in the percentage of students who were raised in a low-income family (as indicated by their eligibility for a free-or reduced-price lunch, FRPL, as a 10th grader). Notice that, among all MA HS graduates, the percentage of students in each cohort who had been raised in a low-income family increased by more than 15 percentage points, to 32.5% in the 2016 graduation cohort from 17.2% in the 2005 cohort. Among those HS graduates who enrolled in a four-year college or university, the percentage who were raised in a low-income family was lower in each cohort and rose less rapidly (from 10% in the 2005 cohort to 21% in the 2016 cohort). In comparison, among the subset of HS graduates who enrolled in a MACC, the percentage who were raised in a low-income family was higher in every cohort than that of the population of all MA public high-school graduates and rose by a remarkable 27 percentage points, from 21% in the 2005 cohort to 48% in the 2016 cohort.
Finally, in Figure 3, we display cross-cohort trends of the percentage of students in each of the three groups whose Grade-10 MCAS mathematics score was above the average score for all students in the state who took the exam for the first time in that year. Importantly, at the recommendation of the MA DESE, our “top half” classification is defined on the basis of each student’s standardized raw score. 7 A consequence is that this figure only provides information on the relative average performance of our three groups within each cohort. It does not provide insight into changes in average math skill that may have occurred across cohorts within each group. This explains why the three trajectories plotted in Figure 3 are approximately horizontal. However, even with this limitation, interesting differences across groups in “top-half placement” are evident.
Notice that approximately 60% of MA high-school graduates in each cohort had Grade-10 math scores that were above the average score for all 10th Grade students who took the MCAS test in that year. This number suggests that students with relatively low (below-average) math scores were especially likely to leave MA high schools before graduation, either by dropping out or moving to a high school outside the MA public system. Not surprisingly, MA high-school graduates who went on to enroll in a four-year college or university were more likely than all HS graduates to have above-average math scores. Notice that the percentage of such students hovered just around 80%. In contrast, MA public high-school graduates who enrolled in a MACC soon after graduation tended to have relatively low scores on the Grade-10 MCAS math test. Only slightly more than one-third had scores above the average score of all MA 10th-Grade students who took the test in the corresponding year.
As the patterns in Figures 1–3 illustrate, the young adults who enrolled in one of the state’s community colleges between 2005 and 2016 soon after graduating from a MA public high school were increasingly from historically marginalized groups, students of color and students raised in low-income households. In an important sense, these trends are praiseworthy. They indicate that—over the period of our research—Massachusetts community colleges increasingly enrolled students from groups that have long been underrepresented in post-secondary education in the USA. However, these same trends also illustrate the challenges MACCs face as they seek to serve growing numbers of students from groups that historically have not been served well in American public elementary and secondary schools.
Analytic Strategy
Our first research question focuses on cross-cohort trends in the probability that students earned an AD in either a healthcare or a STEM program within six years of their entry into a MACC. To address this question, we fitted a taxonomy of multinomial logistic-regression models in which a categorical variable, AD, served as the outcome. This outcome indicates whether within the first six years after entry into a MACC each student had earned an associate degree (AD) in either:
a STEM program (AD = 1), or
a healthcare program (AD = 2), or
had not earned an AD in either field (AD = 0).
Notice that, in defining our dependent variable, AD, we adopted a specific temporal window within which the student could earn an AD in a healthcare or a STEM specialty. There is an important tradeoff in pre-specifying the size of this window: the more years it includes, the fewer the number of complete entry cohorts that are available for us for analysis. Since the last year in which we observed students’ academic progress was the 2021–22 school year, selecting a six-year window for AD-attainment allowed us to include in our analysis students who first enrolled in a MACC in Fall 2005 (the first year that students’ entry into a MACC was recorded in our data repository) through those who first enrolled in Fall 2016. Exploratory analyses of students in early entry cohorts revealed that relatively few students took more than six years to earn an AD in healthcare or STEM, although many took that long to earn an AD in a healthcare specialty.
In our statistical models, we specified categorical outcome AD as a multinomial logistic function of a vector of dichotomous predictors representing the fixed effects of the twelve MACC-entry cohorts (2005 through 2016) that were the center of our research attention. To these covariates, we added the main effects of predictors that represented the student attributes hypothesized to be important, including (a) student gender, (b) student race/ethnicity, (c) a dichotomous indicator of family income, and (c) and a dichotomous indicator of whether the student’s score on the State’s Grade-10 MCAS mathematics examination fell in the “top half” of the distribution of scores among all MA 10th graders who took the examination in the same year as the respondent. In our final model, we retained all statistically significant main effects of these predictors and any two-way and higher-order interactions among them that were needed, along with a vector of dichotomous predictors identifying which of the State’s 15 MACCs the student initially enrolled in. A more detailed description of our analytic strategy, along with parameter estimates, standard errors and accompanying fit statistics for our final fitted multinomial logistic-regression model, are presented in our methodological appendix.
Finally, to help interpret the results of our quantitative analyses and address our second research question, we conducted semi-structured interviews with eight leaders of healthcare and STEM programs in MACCs. Respondents in this convenience sample of interviewees were identified by DHE staff and community-college presidents. We conducted all interviews via zoom and each lasted between 25 and 50 minutes.
Findings
Inspection of our final fitted multinomial logit model (see Appendix ) revealed that the probability of AD attainment was a complex nonlinear function of the main effects of our hypothesized predictors and selected statistical interactions among them. This complexity renders estimated parameters difficult to interpret individually. For that reason, we present our principal findings holistically, in three multi-panel figures, each obtained from the same final fitted model. In describing the fitted trends among prototypical students, we often drop the phrase “within six years of entry” to improve readability.
RQ1: AD-Attainment by Student Gender and Race/Ethnicity
In Figure 4, we display cross-cohort probability profiles for AD-attainment in the healthcare and STEM specialties for male and female students of the several race/ethnicities present in the sample. The pair of panels in the left column of the figure contrast cross-cohort AD-attainment profiles in the healthcare specialty for female (top) versus male (bottom) students. The panels in the right column present analogous comparisons of cross-cohort AD-attainment in a STEM program. In all four panels, the estimated cross-cohort profiles are plotted for Asian, Black, Hispanic, and White students. Notice that these cross-cohort profiles are segmented, rather than smooth, across the twelve MACC-entry cohorts. The reason is that, in our fitted multinomial model, these trends were parameterized using a vector of fixed-effects rather than assuming a smoother curvilinear specification.
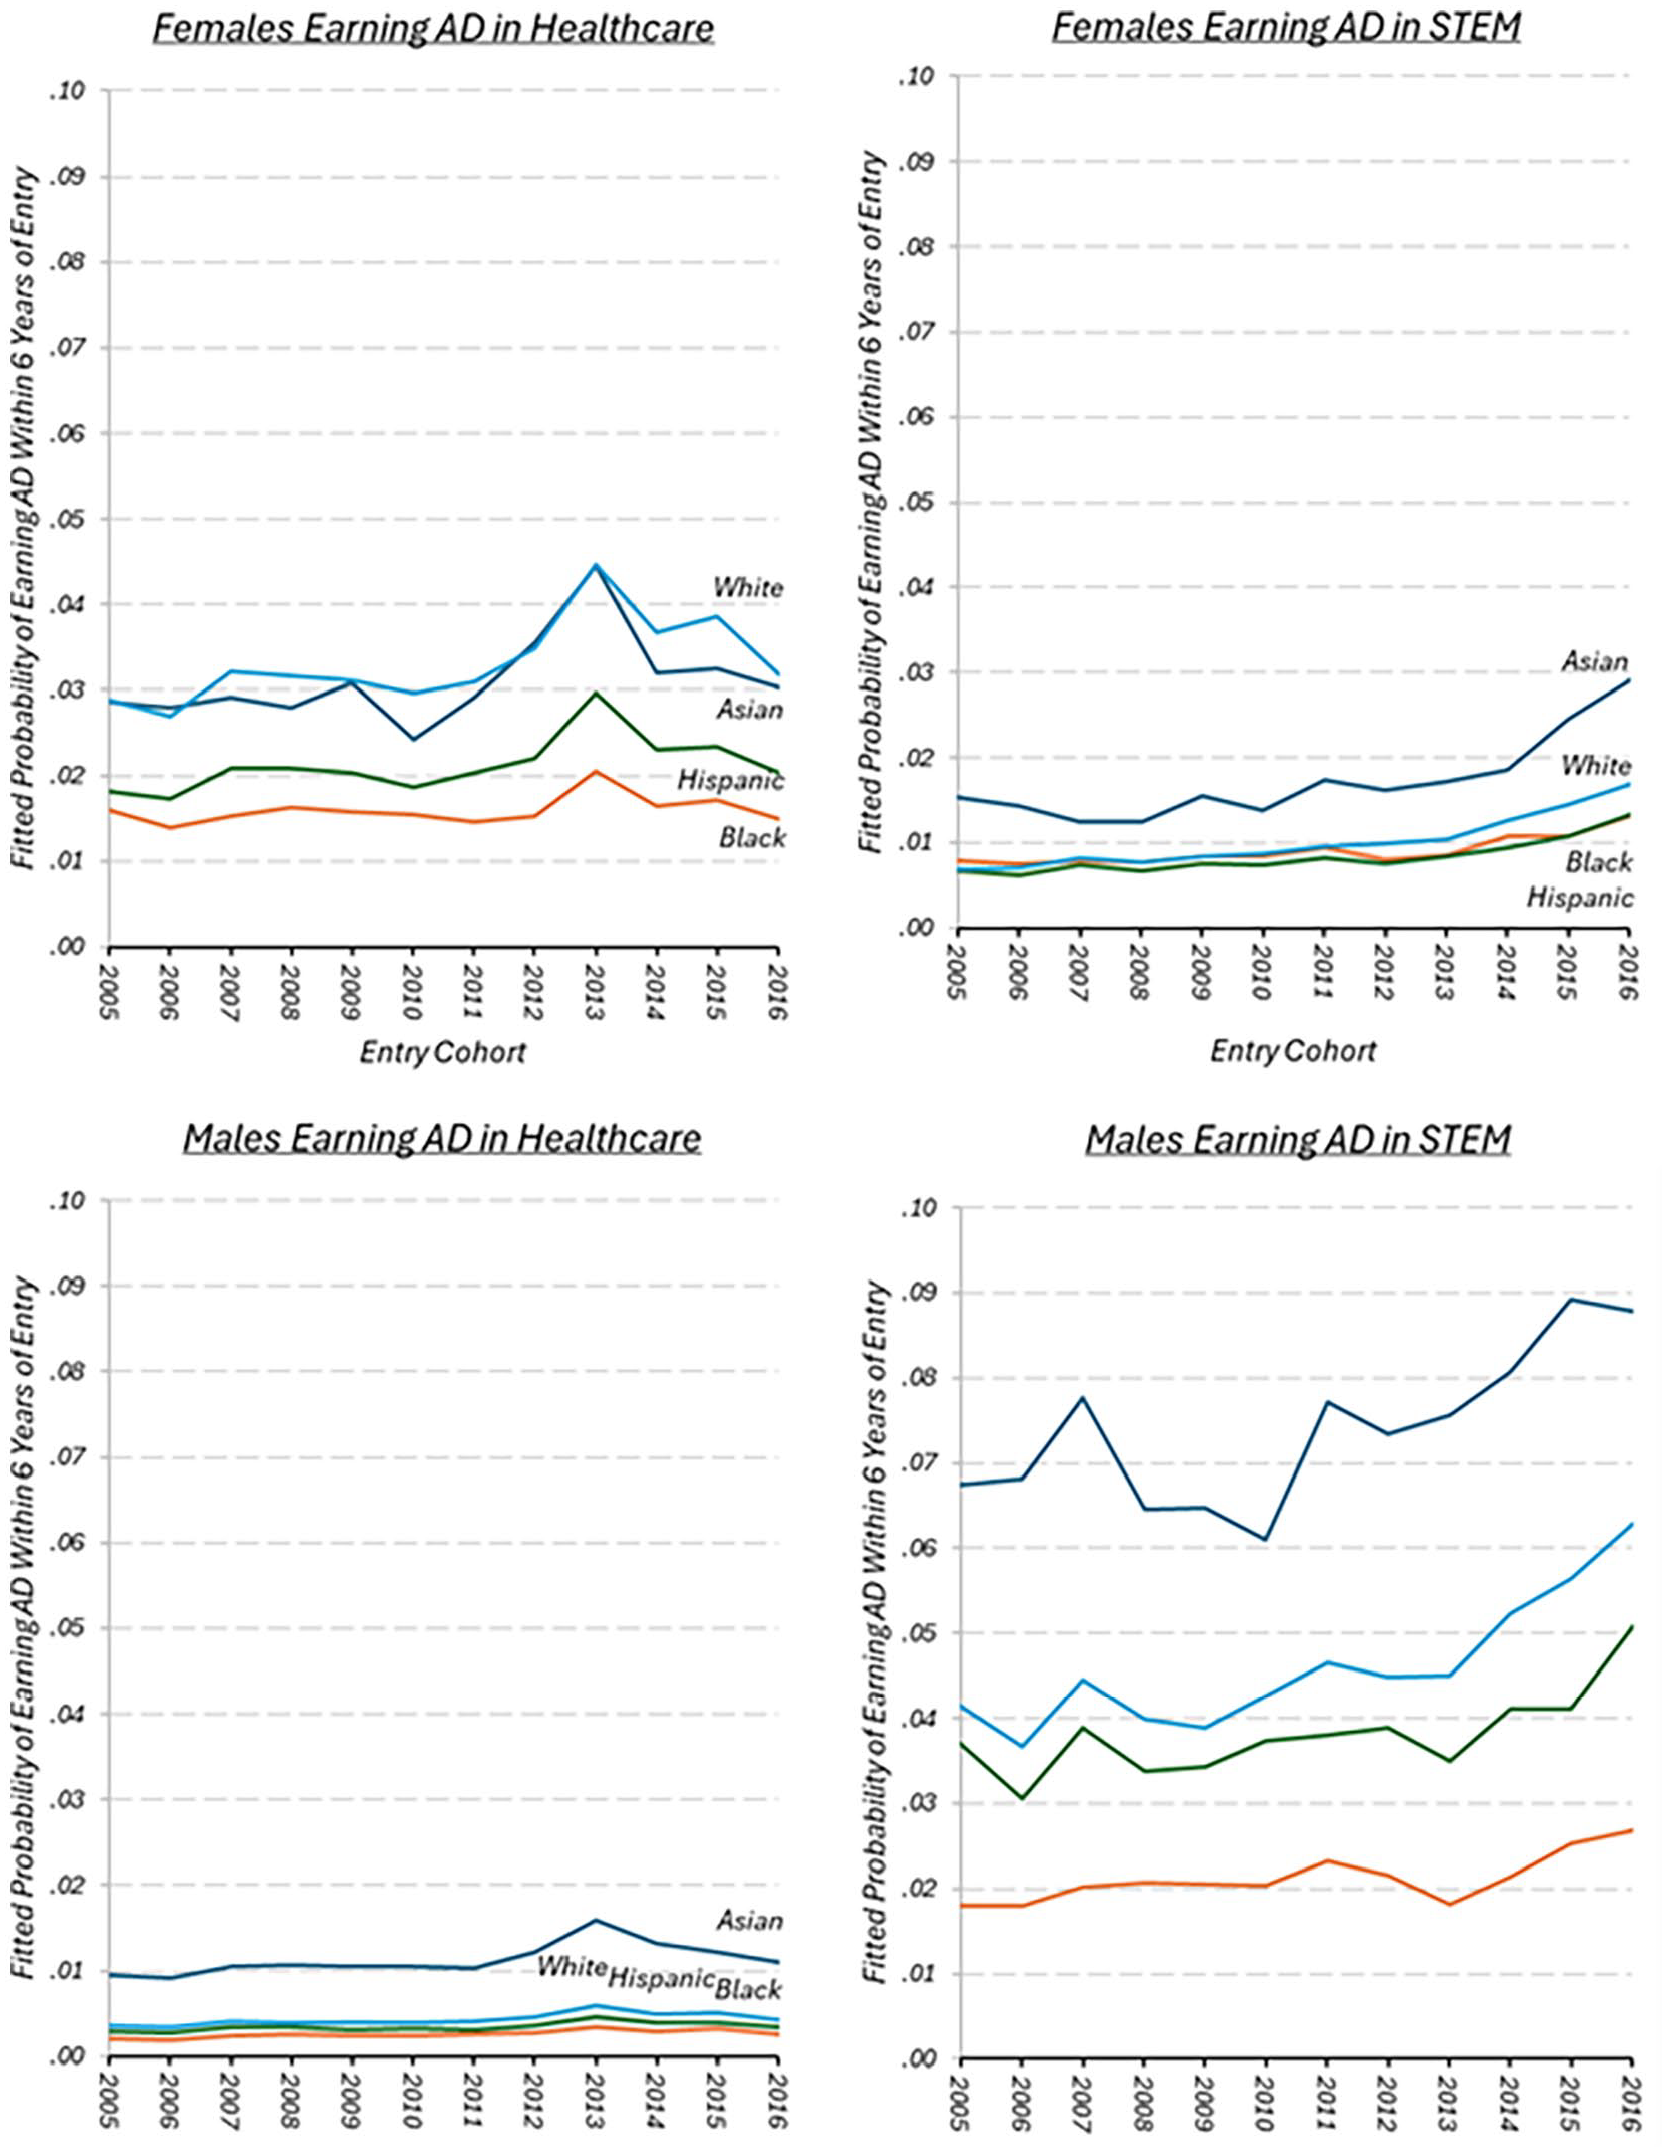
Predicted probabilities of earning an associate degree within six years of MACC entry, plotted annually across the 2005 through 2016 MACC entry cohorts by student gender and race/ethnicity, for the healthcare (left panels) and STEM (right panels) fields.
Comparison of the four panels reveals four important patterns. First, note that the estimated probabilities that any of the displayed group of students earned an AD in either specialty within six years of MACC entry are low. For instance, the probability that students earned an AD in a healthcare program was lower than .05 for every group in every cohort, and lower than .10 for those earning an AD in a STEM program.
Second, there is evidence of strong segregation by gender. In every cohort, the probability that a female student would earn an AD in a healthcare program is at least three times the probability that a male of the same ethnicity would do so. A contrasting pattern is evident for recipients of an AD in a STEM specialty, where male students dominate. In supplementary analyses, we found that females had a lower probability of earning an AD in STEM primarily because they chose not to enroll in a STEM program on entry, although the proportion who did so increased across cohorts. Only 2.1% of females in the 2005 entry cohort initially enrolled in a STEM AD program, while 6.7% of females in the 2016 cohort did so. In contrast, 15.4% of males in the 2005 entry cohort initially enrolled in a STEM AD program, and 24.6% of males in the 2016 entry cohort did so. There was only a modest difference by gender in STEM AD completion rates among students who initially enrolled in a STEM program (20% of males; 17% of females). 8
Third, there are notable differences in AD-attainment by race/ethnicity. Lower percentages of Hispanic and Black students earned ADs in healthcare and STEM than did White and Asian students. The racial/ethnic differences in the proportions of males who earned an AD in a STEM program are especially large. For example, 8.8% of males of Asian descent in the 2016 entry cohort earned an AD in a STEM program while only 2.7% of Black males in that cohort did so. 9
Fourth, notice that cross-cohort trends in the proportions of students earning ADs in the healthcare and STEM fields are quite different. The proportion of each gender and racial group that earned an AD in a healthcare specialty remained relatively stable across cohorts, albeit with somewhat higher values in the 2012 through 2014 cohorts. Notice that among males and females in every racial group, the proportion of 2016 MACC entrants who earned an AD in healthcare was almost the same as the proportion of 2005 entrants who did so. In contrast, the proportion of male and female students of every racial/ethnic group who earned an AD in a STEM program increased over the observed cohorts. Interestingly, most of the increase began around the 2013 entry cohort. This timing is consistent with evidence on the effectiveness of the Stem Starter Academy (SSA), a program launched by the Massachusetts DHE in January 2014 and intended to increase the number of MACC students who earn credentials in a STEM specialty. The most recent evaluation of SSA found that participants, including females and students of color, were more likely to earn STEM credentials than demographically similar non-participants (Johnson et al., 2022).
RQ1: AD-Attainment by Family Income
In Figure 5, we present cross-cohort trends in the proportion of males and females who earned an AD in a healthcare or STEM specialty by family income. Note, as mentioned above, our measure of family income is a dichotomous indicator of whether a student was eligible for a free- or reduced-price lunch (FRPL) as a 10th grader. We use the term “higher-income” in referring to students who were not FRPL-eligible because the family incomes of many of these students were quite modest. 10 The panels in Figure 5 are laid out with a similar orientation to those in Figure 4.

Predicted probabilities of earning an associate degree within six years of MACC entry, plotted annually across the 2005 through 2016 MACC entry cohorts by family income, for the healthcare (left panels) and STEM (right panels) specialties.
Inspecting and comparing the panels of Figure 5 reveals some striking patterns. First, in every cohort, the probability that a female student from a higher-income family earned an AD in a healthcare specialty was about 50% higher than the probability that a female student from a low-income family did the same. For example, in the 2016 entry cohort, 3.3% of female students from higher-income families earned an AD in a healthcare specialty versus 2% of those from low-income families. On the other hand, the proportion of male students who earned an AD in a healthcare program remained extremely small (less than half a percent) for both those from higher- and low-income families. Second, family income also played a role in predicting the probability of earning an AD in a STEM field, with the role particularly evident for male students. For example, in the 2016 entry cohort, 6.7% of male students from higher-income families earned an AD in a STEM specialty versus 4.6% of those from low-income families.
Finally, notice that the role that family income played in predicting the probability that students earned an AD in a STEM specialty became larger with passing cohorts. This is the case for both male and female students, although the pattern is more distinct for males (bottom right panel). Among males in the 2005 entry cohort, for instance, 3.9% of those from a low-income family earned an AD in a STEM program versus 4% among those from a higher-income family, a difference of only 0.1 percentage points in favor of students from higher-income homes. Among males in the 2016 entry cohort, the corresponding family-income-related difference is 2.1 percentage points, with 6.7% of males from higher-income families earning an AD in a STEM program while only 4.6% of males from low-income families did so.
The patterns revealed in Figure 5 are consistent with the findings of a recent paper by Bleemer and Quincy (2024), who reported that, in recent decades, the labor-market benefits of attaining a college degree have been lower for students from low-income families than for those from higher-income families. These researchers show that a part of the explanation is that students from low-income families are less likely to enroll in a four-year college than students from higher-income families. Another part is that students from low-income families are less likely to graduate with degrees in high-paying fields of study than are students from higher-income families. These patterns are clearly present in our data on Massachusetts public high-school graduates.
RQ1: AD-Attainment by Grade-10 Mathematics Achievement
Finally, in the panels of Figure 6, we display cross-cohort trends in the probability that males and females with low and higher scores on the State’s 10th-Grade mathematics examination earned an AD in healthcare or in STEM. For this comparison, as noted earlier, we defined students with higher (vs. lower) mathematics scores as those who had earned above-average (vs. below-average) MCAS mathematics scores in the distribution of all 10th Grade MA high-school students who took the test in the relevant year.
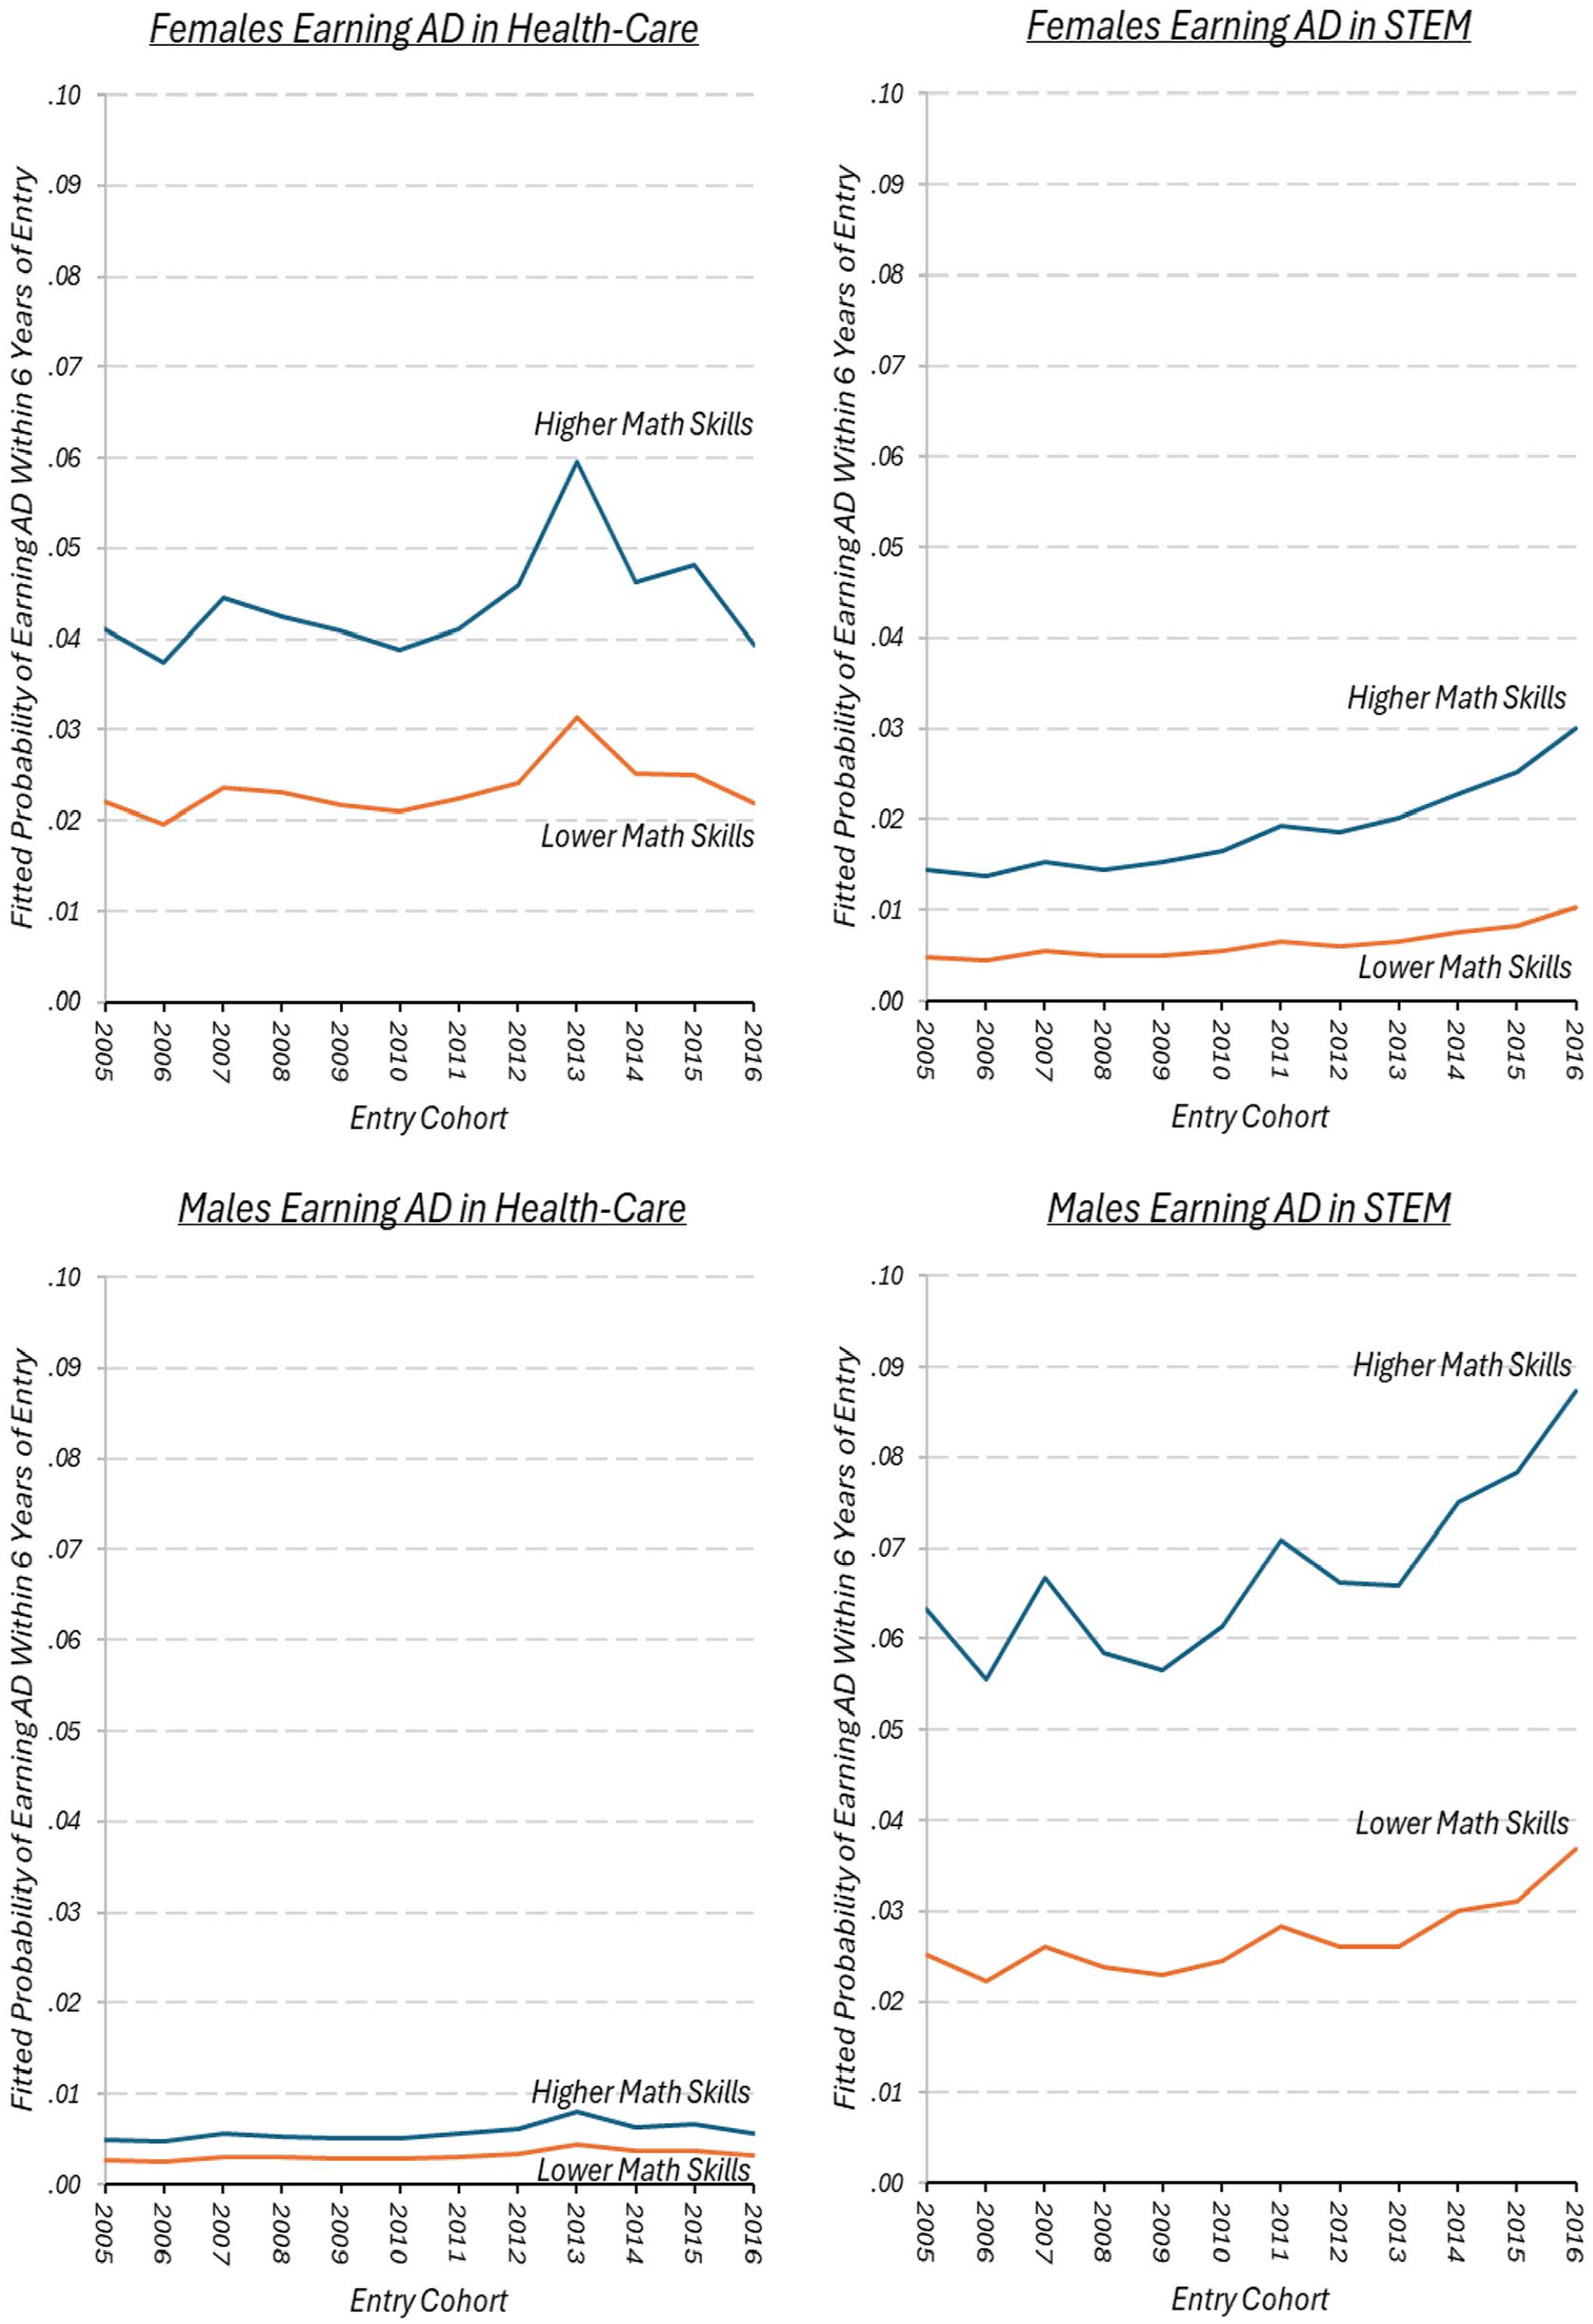
Predicted probabilities of earning an associate degree within six years of MACC entry, plotted annually across the 2005 through 2016 MACC entry cohorts by student 10th-Grade mathematics score, for the healthcare (left panels) and STEM (right panels) specialties.
Inspection of the panels in Figure 6 reveals two important patterns. The first is that the probability of earning an AD in a healthcare program for students with higher mathematics scores was almost twice that of students with lower scores. For instance, among females in the 2016 entry cohort, 3.9% of those with higher mathematics scores earned an AD in a healthcare specialty compared to only 2.2% of those with lower mathematics scores, for a differential of 1.7 percentage points. In addition, this differential had remained relatively stable across prior cohorts; in the 2005 cohort: for instance, the values of the comparable probabilities (4.1% and 2.2%) were very close to those in the 2016 entry cohort. For males, the respective probabilities of earning an AD in a healthcare program were much lower, but still favored those with the higher mathematics skills.
A second important pattern is that the probability of earning an AD in a STEM program was higher for both male and female students with higher mathematics scores than for their counterparts with lower scores, and that the magnitude of the math-score-related differential was larger in the later cohorts, for both males and females. For example, among males in the 2005 cohort, 6.3% of those with higher math skills earned an AD in a STEM specialty, while only 2.5% of those with lower math scores did so, for a differential of 3.8 percentage points. By the 2016 cohort, the comparable figures for males earning an AD in STEM had risen to 8.7% and 3.7%, for a larger differential of 5 percentage points. The percentages of females who earned an AD in a STEM specialty were lower than for males, but again favored those with higher mathematics skills and rose perceptibly across the entry cohorts. For example, among females in the 2005 cohort, 1.4% of those with higher math skills earned an AD in a STEM specialty, while only 0.5% of those with lower math scores did so, for a differential of 0.9 percentage points. By the 2016 cohort, however, the comparable figures for females earning an AD in STEM had risen to 3% and 1%, for a higher math-related differential of 2 percentage points.
RQ2: Obstacles that Hinder Completion of STEM and Healthcare AD Programs
Initially, we found it puzzling that the probability that MACC students who earned an AD in a healthcare specialty did not increase very much across cohorts while the probability that they earned an AD in a STEM program increased substantially. Employer-demand for AD recipients in both fields was high in Massachusetts over the years of our study. To learn about the explanation for these patterns, we asked leaders of MACC programs for their insights. They pointed to two main factors. First, supply constraints had limited the number of places in most healthcare programs. Second, AD programs in the healthcare field tended to take students longer to complete than did AD programs in other fields.
One constraint healthcare-program leaders described is that AD programs that prepare students for occupations such as nursing, medical imaging, and dental hygienics require the completion of clinical practicums. The supply of practicum places is very limited in Massachusetts and there are regulations regarding the qualifications of supervisors and the number of students with whom they may work. A second constraint is difficulty in attracting and retaining clinical instructors, both because they can earn more by practicing their specialty than by teaching it at a MACC and because state regulations require that clinical instructors in nursing must possess master’s degrees. A third constraint on program size is that healthcare training programs are more expensive to operate than programs that do not require practicums or the use of specialized equipment. While MACCs receive more funds from the State for each graduate with a healthcare or STEM degree than for each graduate with a liberal-arts AD (Salomon-Fernandez, 2014), leaders of healthcare programs reported that the higher level of state funding does not cover the costs of operating a high-quality healthcare program requiring practicums. As one leader commented, “The more faculty we add, the greater the loss we operate under.” The net effect of these supply constraints is that many students who meet the qualifications for selective healthcare occupations are placed on waiting lists. The director of healthcare programs at one of the largest MACCs reported that there were 95 qualified applicants for surgical technology at her college, but only 32 seats.
A second factor that limits the number of community-college students who earn ADs in many healthcare specialties is the length of the road students must travel to earn these credentials. Students cannot enroll in AD programs such as nursing and medical imaging on entry into a MACC. Instead, they must enroll first in a non-selective program (typically a liberal-arts AD program), complete prerequisite courses such as anatomy/physiology and statistics, and achieve at least the minimum passing score on the national Test of Essential Academic Skills (TEAS). It takes most students at least one year of study to gain admission to selective AD programs in healthcare. One indication of the length of the road is that almost half of the MACC students in our sample who earned an AD in a healthcare program within six years of MACC entry took more than 4 years to do so. In contrast, only one-quarter of the students who earned an AD in a STEM program within six years took more than four years to do so. These figures are remarkably stable across cohorts.
Associate-degree programs in STEM specialties are not limited by the same factors that constrain selective healthcare AD programs. Leaders of MACC STEM programs told us that students may enroll in almost all STEM associate-degree programs immediately upon entry into a MACC. There are no entry requirements, and programs expand to meet increased demand. While internships are recommended for some AD programs in STEM, almost no programs require them. Consequently, the road to an AD in STEM programs is shorter than the road to an AD in most healthcare specialties.
When we asked program leaders about factors that limit the number of MACC students who earn an AD in a STEM program, they offered three responses. First, they told us that some students enroll initially in a STEM program because they have heard that salaries for graduates are high, but they have no conception of what is involved in STEM work. Once students learn that most STEM jobs require great attention to detail, many switch their field of study. Second, success in STEM programs requires strong mathematical skills. Many students enter community college with weak academic preparation in mathematics. Program leaders and Deans emphasized to us that their faculties are committed to teaching students the mathematics they need to succeed in STEM programs. However, community-college leaders also reported that personal challenges hinder many students from taking advantage of learning opportunities. In the words of one Dean, “Students are one incident away from withdrawing from all of their courses.” The Dean mentioned that such incidents include loss of a child-care provider or the breakdown of a car.
The third reason program leaders provided for why students do not complete an AD in a STEM specialty is quite different—some transfer to a four-year school. We found that 14% of the students in our analytic sample who initially enrolled in a STEM program transferred to a four-year school and did not earn an AD either before or after transferring. Approximately half of these students transferred after only one or two terms in a MACC. 11 Slightly less than half of the students who initially enrolled in a STEM AD program and then transferred to a four-year school earned a four-year degree within six years of initial MACC-entry. This illustrates the important role community colleges play in providing a relatively low-cost starting point for students aspiring to a four-year degree.
Discussion
Community-college programs that enable students to earn associate degrees in healthcare and STEM are especially important for Massachusetts, a state in which healthcare and STEM are particularly important sectors of the economy. They also are potential avenues of upward socio-economic mobility for members of historically marginalized groups. One indicator of the robust demand for healthcare and STEM workers in Massachusetts is the rate at which MACC enrollments in these fields bounced back after the Covid years. MACC enrollments in both healthcare and STEM programs in the 2023–24 academic year were 29% higher than they were in the previous year. Within the nation as a whole, the increases in community-college enrollments in these fields were much more modest. Nationally, enrollments in healthcare programs were 4.4% higher in the 2023–24 academic year than in the previous year and enrollments in STEM program were 6.6% higher (NSC Research Center, 2024).
Our analyses show that Massachusetts community colleges face difficult challenges in producing AD graduates in healthcare and STEM specialties. Moreover, a substantial increase across cohorts in the proportion of MACC students who come from low-income families and enroll with relatively weak mathematical skills has exacerbated these challenges.
The percentage of MACC students in every racial/ethnic group who earned an AD in a STEM specialty increased markedly across the cohorts we studied, especially among the most recent cohorts. This is evidence of important progress. However, much more needs to be done. Less than 25% of students from any cohort who enrolled in a STEM program upon entry to a MACC earned an AD in STEM. Black students and Hispanic students were much less likely to earn an AD in a STEM program than White and Asian-American students. Also, relatively few female students enroll in STEM AD programs even though labor-market opportunities in STEM specialties are especially great.
The proportion of MACC entrants who earned an AD in a healthcare specialty did not increase markedly across cohorts. Supply constraints on the number of places in many healthcare AD programs including nursing provide part of the explanation. Another part is the length of the road to earning an AD in many, high-paying healthcare specialties including nursing and medical imaging. A third part of the explanation is that Massachusetts community colleges increasingly serve students who face many structural barriers to completion. As is true of STEM programs, healthcare programs tend to attract students of only one gender. Relatively few males earn an AD in healthcare programs, despite the attractive labor-market opportunities for graduates of these programs.
As we learned from interviews with leaders of MACC healthcare and STEM programs, Massachusetts community colleges have taken several steps to increase the success of students in their healthcare and STEM programs. Many have purchased robotic simulators that respond medically much like the human body. State regulations allow the use of such simulators for up to 25% of the required hours of clinical practicums in nursing programs, thereby reducing the demand for hospital sites. MACCs have also begun to make use of neighborhood health centers instead of hospitals as sites for their clinical practicums. The Dean of one community college told us that her college covers the substantial fee that graduates of its nursing program must pay to take the mandatory licensing examination. This creates an incentive for students to complete the licensing requirements soon after receiving their AD, when their knowledge is freshest. Finally, to support students with weak skills in mathematics, many MACCs have replaced developmental mathematics classes that do not provide credits toward degrees with “co-requisite” courses that combine mathematics courses that do provide credit toward an AD with courses that provide extra support for students who need it.
We conclude with a few words about our on-going partnership with the Massachusetts Department of Elementary and Secondary Education and Department of Higher Education. One benefit of the partnership has been an increasing understanding of the agencies’ priorities and the kinds of questions they would like answered. A second benefit has been access to detailed information on the backgrounds and educational trajectories of every student who attended a Massachusetts public high school between 2005 and 2016. A third benefit has been frequent feedback as the research progressed. We have briefed DESE and DHE staff on a regular basis and received comments on their understanding and interpretation of our findings and their advice about further questions to address. A fourth benefit has been introductions to key informants—in our case, the directors of healthcare and STEM programs in the MACCs. Interviewing these leaders has increased our understanding of program structures, the challenges that MACC students face, and the actions that DHE and the community colleges have taken to support their students.
We hope that our partnership will provide opportunities in the future to conduct compelling causal evaluations of future initiatives by the state legislature and DHE to increase AD-receipt in the high-demand STEM and healthcare fields, especially for students of color and students from low-income families. A key to conducting convincing causal evaluations is to work closely with program designers to roll out any new initiatives in a manner that provides credible comparison groups. Successful research-policy partnerships can help build the trust that makes such evaluations possible.
Supplemental Material
sj-docx-1-ero-10.1177_23328584241304696 – Supplemental material for Are Community-College Students Increasingly Choosing High-Paying Fields of Study? Evidence from Massachusetts
Supplemental material, sj-docx-1-ero-10.1177_23328584241304696 for Are Community-College Students Increasingly Choosing High-Paying Fields of Study? Evidence from Massachusetts by Richard J. Murnane, John B. Willett, Aubrey McDonough, John P. Papay and Ann Mantil in AERA Open
Footnotes
Acknowledgements
This research has grown out of a long-standing research-practice partnership with the Massachusetts Departments of Elementary and Secondary Education (DESE) and Higher Education (DHE). We appreciate the support of the DHE staff and the staffs of Massachusetts community colleges who took the time to answer our many questions. We also thank DESE and DHE for providing access to data. We thank Preeya Mbekeani, Lindsay Page, and Emma Zorfuss for helpful comments on earlier drafts.
Declaration of Conflicting Interests
The author(s) declared no potential conflicts of interest with respect to the research, authorship, and/or publication of this article.
Funding
The author(s) disclosed receipt of the following financial support for the research, authorship, and/or publication of this article: The research reported here was supported by the Institute of Education Sciences, U.S. Department of Education, through Grant R305H190035 to Brown University. The opinions expressed are those of the authors and do not represent views of the Institute or the U.S. Department of Education.
1.
Massachusetts introduced several initiatives over the past decade to increase the success of students in the state’s community colleges, especially students of color and those from low-income families. They include the Success Fund Initiative (Clapp, 2023) and the Stem Starter Academy (Johnson et al., 2022; MA Department of Higher Education, 2024a, ![]() ). These initiatives evolved over time. Students were not assigned randomly to program eligibility. There were no equivalent “treatment” and “control” groups nor any distinct pre- and post-program time-periods that could support unbiased causal inference. In addition, events that occurred in the broader society over the same period may have influenced students’ academic trajectories. These include the Great Recession and the Covid-19 pandemic, both of which may have disrupted students’ academic trajectories. For these reasons, our research does not provide causal evidence on the impact of any of these government initiatives.
). These initiatives evolved over time. Students were not assigned randomly to program eligibility. There were no equivalent “treatment” and “control” groups nor any distinct pre- and post-program time-periods that could support unbiased causal inference. In addition, events that occurred in the broader society over the same period may have influenced students’ academic trajectories. These include the Great Recession and the Covid-19 pandemic, both of which may have disrupted students’ academic trajectories. For these reasons, our research does not provide causal evidence on the impact of any of these government initiatives.
2.
Evidence of high labor-market returns to an AD in a healthcare specialty comes from California (Bahr, 2016; Grosz, 2020; Stevens et al., 2019), Kentucky (Jepsen et al., 2014), North Carolina (Liu et al., 2015), Ohio (Minaya & Scott-Clayton, 2020), and Washington (Dadgar & Trimble,2015). ![]() reported high returns to ADs in STEM specialties.
reported high returns to ADs in STEM specialties.
3.
For reports documenting the critical roles of healthcare and STEM in the Massachusetts economy, see: https://commcorp.org/wp-content/uploads/2021/10/STEM-BRIEF-2021-uploaded.pdf https://www.mass.edu/strategic/work_healthcare.asp https://www.mass.gov/info-details/stem-dashboard ![]()
4.
We restricted our analytic sample to students who had attended a Massachusetts’ public high school in order to use data available from DESE on the academic backgrounds and family income of sampled students. To be able to track all students in our analytic sample for six years after their enrollment in a MACC, we included only those 2014 test-takers who graduated within two years.
5.
To facilitate comparisons of our results with those of the many studies conducted by researchers at the NSC Research Center, we adopted the NSC’s practice of restricting our sample to students who initially enrolled in a Fall term and either enrolled full-time during that term or part-time for the first two terms immediately following entry.
6.
Nineteen percent of MA high-school graduates who enrolled in an AD program in a MACC were excluded from our analytic sample because they did not satisfy the NSC criterion of either enrolling full-time in their first fall term or at least half-time for the first two-terms after initial enrollment. An additional 5% were excluded because they did not satisfy the NSC criterion of initially enrolling in a fall term. Four percent of the MA public high-school graduates who satisfied the NSC definition for inclusion in the analytical sample first enrolled in a MACC more than two years after graduating from high school, most of them enrolling two three, four, or five years after graduation. Had we included these students in our analytic sample, we would have had to limit our MACC entry-year cohorts to 2005–2012. This would have been necessary in order to be able to follow each student for six years after MACC entry. As a robustness check, we redefined our analytic sample to include students who first enrolled in a MACC within the first six fall terms after high-school graduation and did so in years 2005–2012. We then added to our final model a predictor indicating the number of months that had elapsed between a student’s MA high-school graduation and the student’s initial enrollment in a MACC. The coefficient on this predictor was consistently negative, indicating that the more time that had elapsed between a student’s high-school graduation and MACC entry, the lower the probability that the student earned an AD in a healthcare or STEM program. (The vast majority of students who enrolled initially in a MACC several years after graduating from high school did not graduate from a MA public high school. Many were recent immigrants.)
7.
The reason we do not report trends in math-achievement scale scores, which are designed to provide equatable cross-cohort information on differences in mathematics skills across cohorts, is that the MA Department of Elementary and Secondary Education (DESE) advises researchers not to report these scores due to a technical problem in their construction known as scale drift (MA Department of Higher Education, 2023). Instead, following advice provided by DESE, we standardized MCAS raw scores so that they had a mean of zero and a standard deviation of one in the population of all 10th Grade students who took the MCAS in a particular year. Of course, standardizing raw scores by cohort eliminates evidence of differences in average mathematical skills across cohorts. We provide more information in our methodological ![]() on the problem with scale drift and the reason we chose a dichotomous indicator of each student’s mathematics skills.
on the problem with scale drift and the reason we chose a dichotomous indicator of each student’s mathematics skills.
8.
As we explain later in the text, students are not permitted to enroll in most healthcare programs upon entry into a MACC. For that reason, it was not appropriate to examine the extent to which the gender-based difference in the probability of earning an AD in a healthcare specialty stemmed from initial choice of field of study or success in a healthcare program.
9.
We included in our analytic sample the 1.45% of students who reported their race/ethnicity as something other than one of the four main categories of Asian, Black, Hispanic, and White. However, we do not present results for this small, very heterogenous group of students.
10.
For a subset of the cohorts of MACC students in our analytic sample, we have data on the expected financial contribution (EFC) for students who applied for a federal Pell grant. We know that the family incomes of many of the students in our sample who were not eligible for a FRPL were modest because their EFCs were very small.
11.
As reported earlier in the text, students may not choose selective healthcare programs when they first enroll in a MACC. For that reason, we cannot provide figures for transfer rates and four-year degree completion rates for students who enroll in a MACC with an interest in acquiring a healthcare credential.
Authors
RICHARD J. MURNANE is the Thompson research professor at the Harvard Graduate School of Education and a research associate at the National Bureau of Economic Research. His research interests focus on relationships between education and the economy.
JOHN B. WILLETT is an emeritus professor at the Harvard Graduate School of Education. His research focuses on the development and use of statistical methods.
AUBREY MCDONOUGH is a research project manager at the Annenberg Institute for School Reform at Brown University. Her research interests focus on educational policies.
JOHN P. PAPAY is an associate professor of education at Brown University and the executive director of the Annenberg Institute for School Reform. His research interests focus on teacher labor markets and the impacts of educational policies.
ANN MANTIL is a senior research associate at the Annenberg Institute for School Reform at Brown University. Her research interests focus on the equity consequences of educational policies.
References
Supplementary Material
Please find the following supplemental material available below.
For Open Access articles published under a Creative Commons License, all supplemental material carries the same license as the article it is associated with.
For non-Open Access articles published, all supplemental material carries a non-exclusive license, and permission requests for re-use of supplemental material or any part of supplemental material shall be sent directly to the copyright owner as specified in the copyright notice associated with the article.