
Abstract
For schools and teachers to help students develop knowledge and skills, students need to show up to class. Yet absenteeism is prevalent, especially in secondary schools. This study uses a rich data set tracking class attendance by day for over 50,000 middle and high school students from an urban district in academic years 2007–2008 through 2012–2013. Our results extend and modify the extant findings on absenteeism that have been based almost exclusively on full-day absenteeism, missing class-by-class absences. Notably, part-day absenteeism is responsible for as many classes missed as full-day absenteeism, raising chronic absenteeism from 9% to 24% of secondary-grades students. Incorporating part-day absences sharply increases the chronic absenteeism gap between underrepresented minority students and their peers. Both full- and part-day absenteeism show a discrete jump at the point of transition from middle school to high school, but full-day absenteeism then declines whereas part-day absenteeism remains high in Grades 10 and 11 and increases again in Grade 12. Whereas 55% of full-day absences are unexcused, 92% of part-day absences are unexcused. Absenteeism from individual classes varies considerably by time of day but less by class subject matter.
Keywords
Specifically, we address the following research questions:
How prevalent is part-day compared to full-day absenteeism?
To what extent do characteristics of the class predict part-day absence, where class characteristics include period, core versus noncore subject, and class subject area?
Does prevalence of part-day absences differ across students by grade level, family income and race-ethnicity, and do patterns across class periods vary by income and race-ethnicity?
This study is inherently descriptive instead of causal, aiming to identify patterns of absenteeism that are either causes of concern or indicators of possible avenues for improvement. This descriptive study makes two substantive contributions. First, we provide evidence that part-day absenteeism is as prevalent as full-day absenteeism, highlighting the importance of focusing future research and practice on addressing part-day absences. Second, by identifying the characteristics of students who are absent and the classes that they miss, our study informs possible efforts to better target approaches to reduce absences. As one example, because students miss the first class of the day more than any other, scheduling planning periods for core-subject teachers during first period could potentially increase attendance in these key classes. It may also be important to target part-day absence reduction efforts to meet the needs of underrepresented minority students.
Background
Student absenteeism, usually measured by full-day absences, predicts as well as causes a number of key student outcomes. Quasiexperimental research suggests that fewer days of attendance leads to less learning (Goodman, 2014; Hansen, 2011; Marcotte & Hemelt, 2008). 2 Absences can cause lower achievement even among nonabsent students because the teacher has a “coordination problem,” such that when an absent student returns to school, the teacher likely needs to allocate instructional time to catching the student up on what he or she missed (Goodman, 2014). Less rigorous studies that are vulnerable to omitted-variable bias, such as comparing absences across siblings, still make a case for absence as an important indicator of student risk. Students are more likely to participate in risky behaviors, like drug use and crime, when they have unexcused absences (Henry, 2007; Henry & Thornberry, 2010; Lochner & Moretti, 2004; Pérez, Ariza, Sánchez-Martínez, & Nebot, 2010; Vaughn, Maynard, Salas-Wright, Perron, & Abdon, 2013). 3 Chronic absenteeism strongly predicts school dropout net of other important factors, such as academic achievement (Allensworth & Easton, 2007; Balfanz & Byrnes, 2012; Balfanz, Herzog, & Mac Iver, 2007; Gottfried, 2011). 4
Although scholars and practitioners agree that absence in secondary school is a problem, the empirical literature on the prevalence and potential reasons for absence is relatively weak, largely due to the lack of detailed class-level attendance data. In fact, the total amount of absence from secondary school classes is likely higher than the national 8% average daily attendance (ADA) rate (Snyder & Dillow, 2013), which does not fully take part-day absences into account. 5 However, no study we are aware of documents the extent of part-day absence. The underestimation of school absence is problematic, especially if part-day absence has similar detrimental effects on student learning and development to full-day absence. The only published study we know of that uses class-level absences data leverages the fact that students are de facto randomly assigned to whether they take a given class subject during first period versus later in the day, and it finds that having a first-period class reduces grades in that subject by 0.09 to 0.17 points but has little spillover effects on other subjects (Cortes, Bricker, & Rohlfs, 2012). 6 Unfortunately, the authors could not determine whether this negative effect is due to higher absences or more grogginess in first period than in other periods.
Little theory and empirical work has been conducted on reasons why attendance might vary across classes. In the full-day absence literature, scholars have identified a large number of reasons for absences (see Balfanz & Byrnes, 2012, for a review). Some authors have categorized the reasons for absences as “pull” or “push” factors, where pull factors “are located outside the school and pull students away from attending” and push factors “are located within the school and push students out of school” (Youth Justice Board, 2013, p. 7). Although some of those factors discussed would likely affect student attendance in all classes relatively equally, some of them can play a much bigger role in some classes than others. For example, one hypothesis is that some teachers might be more effective than others in fostering student attendance. Although we fully recognize the potentially important role of teachers, because modeling teacher effects on attendance is methodologically challenging, it deserves a separate study (see Liu & Loeb, 2017).
In this paper, building on the extant literature, we focus on how absences might vary across the types of class and student characteristics. Specifically, we first hypothesize that class periods might influence class absences. Students might miss the first period of the day due to fatigue, illness, or logistical issues with transportation. For similar reasons, students might miss classes at the end of the day; plus they would conceivably be more likely to leave school along with friends at the end of the school day versus earlier. 7 Cortes et al. (2012) show graphically that absences in four core subjects in Chicago Public Schools are U shaped across periods for Black and non-Black students, with the highest amount in Period 1, the lowest amount in Periods 3 and 4, and then a gradual rise from Periods 5 through 7. However, they do not show whether the same trend holds across all class subjects, nor do they present summary statistics on the number of class absences for each period across subjects and student race. A student’s decision to attend class could also depend in part on how interesting he or she finds that class content as well as on how important he or she thinks the class content will be for his or her future, so we test how part-day absence varies between class subjects and whether the class is in a core academic subject.
Last, we hypothesize that part-day absence rates will vary by students’ background characteristics, including grade level, race-ethnicity, and socioeconomic status. 8 Full-day absences according to ADA are higher among older than among younger students (Snyder & Dillow, 2013), and unexcused absences increase at the transition to high school in Chicago (Rosenkranz, De La Torre, Stevens, & Allensworth, 2014). Students from historically disadvantaged backgrounds might face more challenges to attendance than other students (e.g., poorer health, less safe and longer commutes to school, less qualified teachers). High school chronic absence rates using daily attendance are higher among Black (22%) and Latino/a students (20%) than students overall (18%) (Office for Civil Rights, 2016). Lower-income students tend to have more full-day absences than their higher-income peers (Goodman, 2014; Vaughn et al., 2013). Reasons such as difficult commutes to school might especially cause higher absence rates in first period, suggesting a possible heterogeneous influence of first period on students from disadvantaged backgrounds.
To our knowledge, the current paper is the first that provides a complete picture on the extent of part-day absence across all secondary grades. Our highly detailed data allow us to disentangle not only part-day and full-day absence but also excused and unexcused absence reasons. In addition, we examine how the distribution of part-day absence varies on some key class and student characteristics and how these factors interact with each other to shape student absence patterns.
Data
We utilize a rich data set for our study from a large urban school district in California. The data set includes longitudinal administrative records for school years 2007–2008 through 2012–2013, with student attendance records from each class on each school day. 9 During the school years we examine, teachers in this district used a paper Scantron to mark a student as absent or present in each class. A clerk in the school office would mark the absence excused if he or she received a phone call or a note from the student’s parent or guardian providing reasons for the absence. Otherwise the student was identified as unexcused absent for that class. Teachers also use different attendance marks if a class does not meet on that day (alternative schedule), if students conduct independent study, or if a student has dropped the class. These extremely detailed data allow us to precisely measure student class absences.
We also have information about classes, including subject and period of the day, and background information about students and schools. We create student neighborhood and median income of the neighborhood based on the U.S. Census tract where the student lives using student address data. Having longitudinal, student-level data on absences from every class along with numerous background characteristics allows us to quantify the prevalence and predictors of part-day absences in much greater detail across characteristics of the classes and students. It also allows us to incorporate stronger controls for student background characteristics than in past studies in order to better identify the relative importance of different predictors of part-day class absences.
Table 1 presents descriptive information. The first column describes all students in the district dataset in Grades 6 to 12 during school years 2007–2008 through 2012–2013, with 184,089 student-year observations and 61,928 students. The second column describes the analytic sample with 151,512 student-year observations and 51,514 students. The analytic sample includes the 82% of student-year observations and 83% of students who are in the full district sample. We dropped student-class-semester observations if they had missing data on key variables (gender, race-ethnicity, grade, special education status, class period), if they occurred during summer school, if students dropped the class, if they had fewer than 10 days that have valid attendance marks (i.e., excused or unexcused absent, present, or tardy), or if students at the school were enrolled in only one period per day. 10
Descriptive Data From Full District Data Set Compared to Final Analytic Sample

Note. Full district data set refers to all student-year observations in Grades 6 through 12 in years 2007–2008 to 2012–1013 present in the district’s administrative data set. Analytic sample refers to the observations used in analysis in this paper. N/A = not available.
Analytic sample statistic differs significantly from full district data statistic at p < .05 level.
District provides this calculation of percentage of the time the student is present across all of the student’s classes in fall and spring plus summer terms. We do not use these district-provided rates in our main analyses but provide them here for comparison. They are calculated as the number of times a student was marked present or tardy divided by total present, tardy, and excused or unexcused attendance marks across all the student’s classes that year.
Author’s calculations based on attendance data at the student-class-day level. Includes only fall and spring terms—that is, excludes summer term.
The students in the analytic sample come from diverse backgrounds, which allows us to compare absences across background characteristics. Specifically, the sample includes 8.1% White non-Hispanic, 9.8% Black, 21.8% Hispanic, and 52.3% Asian students as well as 20.0% students classified as English learners, 10.9% in special education, and 32.4% gifted. The analytic sample differs somewhat from the full data set, most notably, underrepresenting Black students and overrepresenting Asian students as well as gifted students. The students in the analytic sample have slightly higher standardized math achievement scores by 0.01 standard deviations.
In their yearly data on students, the district includes a statistic for the percentage of all a student’s classes in the year in which he or she was marked present or tardy. The rates are not significantly different from each other across the full district data and the analytic sample. However, these district-calculated rates include summer school and do not restrict to classes in which the student had at least 10 valid attendance marks. Using the attendance data for our study, with the sample restrictions, the present rate is higher by about 1.1 percentage points (91.6% compared to 90.5%). On average, students had about 1.7 excused absences and 3.8 unexcused absences per class per semester. 11 Students do not always take every class every day because some schools have alternative or block schedules (a class meeting is included in the data set only if the student is marked excused or unexcused absent, present, or tardy). After we drop cases in which a student had 10 or fewer valid attendance marks, students have 72.8 attendance marks per class per semester on average, with a fairly large standard deviation of 14.5.
Methodology
Research Question 1: How Prevalent Is Part-Day Class Absenteeism Compared to Full-Day Absenteeism?
We address the first question by reporting on rates of full-day versus part-day absences. Students are considered full-day absent if they were marked as either excused or unexcused absent in each class that day that had a valid attendance mark; they are considered part-day absent if they were excused or unexcused absent from at least one class but marked present or tardy to another class during the same day. We report overall rates (excused plus unexcused) and rates for unexcused absences only. To address potential misclassification, we calculate the part-day absence rate three alternative ways: First, we discard the 1st month of data in each school year. According to our interview with district officials, the attendance records in the 1st month of a school year might be less precise due to students frequently changing classes. Second, we count days that students attend a single class as full-day absences. Compared with multiple-class attendance, singleton-class attendance is more likely to be an error in the data. Third, we count tardiness as absence. Teachers might have an incentive to label an absence as tardiness in an attempt to maintain a higher ADA rate and thus higher school funding or because it can be time-consuming when students try to get their absences classified as excused.
We also describe part-day class absences in terms of how they are clustered within school days: what proportion of the class absences is singular (i.e., the only class that students missed during the day), what percentage of classes students miss on average when they are part-day absent, and what percentage of the time a class absence follows an absence from the period immediately prior on the same day. We report the chronic absence rate (i.e., the proportion of students with a higher-than-10% absence rate) when we count only full-day absences, compared to counting part-day absences from class as well. Finally, we examine the extent to which students who accrue more full-day absences also miss more part days by plotting the correlation of these two types of absences.
Research Question 2: To What Extent Do Characteristics of the Class Predict Part-Day Class Absence, as Defined by Period, Core Versus Noncore Subject, and Class Subject?
To examine how characteristics of the class predict part-day class absences, we regress the part-day class absence rate on each of the following class characteristics, entered in separate regressions: (a) class period, (b) whether the class is taught in a core subject (i.e., math, English, social studies, science, and foreign language), and (c) class subject. 12 For example, to examine the role of class subject, we run the following regression where English language arts (ELA) class is the reference group:

The dependent variable is the part-day class absence rate for student i in course c and semester–school year t. Each subject has an indicator variable, such as Math, which is equal to 1 for math classes and equal to 0 otherwise. The reference group is ELA. Such a specification uses variation from all student-class-semester-year combinations. The estimates might be biased, for example, if more-motivated students take more years of foreign language than other students or if students who are struggling take extra ELA or math courses. To alleviate such bias, we include alternative specifications with a period fixed effect as well as a student-by-year fixed effect so that we compare absences across classes within the same student and year, controlling for period; and thus any associations should not be driven by some omitted variable having to do with student sorting into classes in a specific year or timing of class. We also run another model with controls for student background characteristics (gender, race, special education, English language learner), the student’s number of classes in the semester, and number of valid attendance marks in the class (instead of a student-by-year fixed effect) as well as a school fixed effect to account for differences across schools, like their class schedules, course offerings, and how they assign classes across different types of students.
Research Question 3: Do Prevalence and Patterns in Part-Day Class Absences Differ Across Different Types of Students in Hypothesized Ways?
Differences in prevalence across grades
We examine how prevalence of part-day class absences varies by grade. We show rates of excused and unexcused part-day and full-day absences, as well as chronic absence (i.e., missing over 10% of total class meetings in a school year), graphically across grades. In regression analysis, we include a student fixed effect in order to examine how part-day class absences change within students as they progress through grades. We then run the same regressions using the total absence rate (including part- and full-day absences) as the dependent variable.
Differences in prevalence across race-ethnicity and income
We examine how prevalence of part-day class absence varies by race and income by running regressions similar to those described in previous sections. The income variables are based on the income of the student’s neighborhood, defined as his or her census tract. Because income is measured at the tract level and not the student level, it might not be a precise measure of students’ resources at home. To mitigate measurement error and ease interpretation, we divide census tracts into four quartiles according to median income in that tract, with low income meaning the student lives in a tract in the lowest income quartile and middle income meaning the student lives in a neighborhood in the second or third quartile. 13 We run similar models that include race-ethnicity and income simultaneously as well as year, grade, and period fixed effects and controls for the student’s number of classes in the semester and number of valid attendance marks in the class. In separate models for each, we include school, neighborhood, and classroom fixed effects to account for student sorting into schools and classes according to their background characteristics. We also examine how chronic absence rates vary across school grades by racial-ethnic group.
Differential effects of class characteristics across subgroups of students
We examine differential effects of having a class in Period 1 compared to other periods on Black and Hispanic students compared to other students, and on low- and middle-income compared to higher-income students. We run similar regressions to those shown above and add interaction terms to identify differential effects. We add subject, grade, and year fixed effects. Additional models control for other student characteristics (neighborhood median income, gender, special education, English language learner) as well as the student’s total number of valid attendance marks and the student’s number of classes in the semester; a third model adds school fixed effects.
Results
Research Question 1: How Prevalent Is Part-Day Class Absenteeism Compared to Full-Day Absenteeism?
On a given day, part-day absence is much more prevalent than full-day absence. A much larger proportion of students have zero or near-zero full-day absences than part-day absences, as shown in Figure 1. On average, students are part-day absent 12.2% of their school days, which is 3 times as common as full-day absenteeism (4.2%), as shown in Panel A of Table 2. The median rate of part-day absence (6.7%) is about 4 times higher than the median rate of full-day absences (1.7%). The part-day absence rate is 10.7% (full-day rate 6.1%) if we consider attending only one class as missing a full day and 11.8% (full-day rate 6.3%) if we discard the 1st month of data in each school year, very close to what the data show above. If we consider tardiness as absence, the part-day absence rate jumps to 21.1%, suggesting that a part-day absence rate of 12.2% is probably a lower bound.

Distributions of full- and part-day absence rates. Density means the percentage of observations at that rate, out of 151,512 student-year observations from Grades 6 through 12, years 2007–2008 to 2012–2013. Full-day absence rate = number of days that year on which student was marked excused or unexcused absent in every class, divided by number of days of school that year for the student (meaning days on which student received an absent, present, or tardy mark in at least one class). Part-day absence rate = number of days that year on which student was marked excused or unexcused absent in at least one class but not all classes, divided by number of days of school that year for the student.
Rates of Full-Day, Part-Day, and Class Absences

Note. Total absence rate includes any absences from class, whether they occurred on a day the student was part-day or full-day absent. Students in Grades 6 through 12. Years 2007–2008 to 2012–2013.
Among classes for which it is possible to miss the prior class that day, that is, excluding the first class of the day.
We further differentiate those absences by unexcused or excused reasons. Specifically, if the student was marked unexcused absent in every class on a given day, then we count that day as an unexcused full-day absence. Similarly, if the student missed only part of the day and all class absences during that day were unexcused, that is an unexcused part-day absence. Slightly more than half (55%) of full-day absences are unexcused. However, 92% of part-day absences are unexcused rather than excused. In sum, when students are absent from middle or high school on a given day, they are most often accruing unexcused absences from some but not all of their classes. Mean rates of full-day and part-day absences are higher than median rates because the distribution is right skewed, but the median rates of part-day absences are still sizeable.
Panel B of Table 2 provides details on absences from classes. In total, students are absent from a given class 7.9% of the time on average (counting absences on days they are part-day and full-day absent), with a median rate of 3.3%. Students are absent from class on part days 4.1% of the time, meaning that over half (52%) of all absences from class are on part days rather than full days. 14 Class absences on part days are unexcused rather than excused 88.6% of the time. Slightly more than a third (36.9%) of part-day absences are on days that students miss only that single class during the day and attend all their other classes. Nearly all (96.7%) of those single-class absences are unexcused. When students are part-day absent, they miss about a quarter of their classes that day on average (24.6%), which would be about two classes for the typical class schedule. The classes missed on the same day are often contiguous periods: When a student has a class absence in Period 2 or later in a given day, a majority of the time (63.2%) he or she also missed the prior class that day.
In keeping with these average trends, we examine how the chronic absence rate changes when we factor in part-day absence. A student is chronically absent if he or she misses more than 10% of his or her total class meetings in a year across all his or her classes. If we consider class absences only on days the student is full-day absent, the average chronic absence rate is 9.2% over all grades and years. After incorporating part-day absence, this rate jumps to 23.6%, more than doubling the previous number. 15
The last part of this question is whether the students who experience full-day absences are also more likely to experience part-day absences. Figure 2 provides a binned scatter plot of these two types of absences. The relationship is quite linear, meaning that students with higher full-day absences are likely to have higher part-day absences as well. This correlation implies that there could be some common risk factors driving both types of absences. In addition, the part-day absence rate is nearly 4 times as high as the full-day rate for a given bin. Thus, schools tracking only full-day absences data might choose to intervene with students at a lower threshold than their current benchmarks for chronic absence, because those students likely have accrued a much larger amount of total absences than their full-day absences reveal.

Binned scatter plot of part-day and full-day absence rate.
Research Question 2: To What Extent Do Characteristics of the Class Predict Part-Day Class Absence, as Defined by Period, Core Versus Noncore, and Class Subject?
Students have part-day class absences from their first-period classes more often than from classes in Periods 2 through 7, and across the day the trend is U shaped, as shown in Figure 3. Table 3 examines differences between periods in more detail. Students have a roughly 5% absence rate in Period 1 and are second-most absent from their seventh-period class, with a rate of about 4.7%. Rates are about 1 to 2 percentage points lower for Periods 2 through 6 compared to the beginning and end of the day, with the lowest rate of absences in Period 3, at about 3.1%. The differences between periods remain qualitatively similar with the addition of various controls and fixed effects in Models 2 through 4. 16

Class absence rate by period. Includes only students in schools that have six to eight total periods per day. Rates represent the percentage of class meetings on which student was marked absent that period on days that student was marked tardy or present in at least one other class (i.e., part days).
Differences in Class Absence Rate by Class Period (reference category is Period 1)

Note. F test of joint significance examines whether all of the period variables are jointly significantly different from zero. Most pairwise differences between periods are significant at the p < .05 level; pairwise significance test results available on request. All models include only classes taught during Periods 1 to 7 and schools that have six to eight periods per day. Dependent variable is percentage of class meetings on which student was marked absent on days that student was marked tardy or present in at least one other class. Model 2 includes subject, grade, and year fixed effects. Model 3 includes subject and student-year fixed effects. Model 4 includes controls for individual characteristics (gender, race, special education, English language learner), the student’s total number of valid attendance marks, the student’s number of classes in the semester, and whether the student takes homeroom, as well as grade, subject, school, and year fixed effects.
p < .10. *p < .05. **p < .01. ***p < .001.
Unlike these relatively large differences across class periods, there are smaller differences across classes in core academic subjects compared to those not covering core subjects. As shown in Table 4, students are only slightly less likely to have an unexcused class absence from a core class (math, ELA, science, social studies, and foreign language) than from a noncore class (physical education [PE] and elective). Model 3, which includes a student-year fixed effect to account for student selection into courses, finds that absences from noncore classes are only 0.36 percentage points higher than those from core classes. Similarly, differences in attendance across specific class subjects are small. Our most conservative estimates, Model 3 in Table 5, show that students are more likely to be absent from their PE class than from any other class (0.78 percentage points more than from their ELA class), followed by their foreign language class, their math class and elective class, their science class, and their ELA class and are least likely to be absent from their social studies class.
Differences in Class Absence Rate by Core Subject Versus Noncore Subject (reference category is noncore subject)

Note. Core classes are English language arts, math, social studies, science, foreign language, and English as a Second Language. Noncore classes include physical education and electives; special education classes are excluded. Dependent variable is percentage of class meetings on which student was marked absent on days that student was marked tardy or present in at least one other class. Model 2 includes grade, year, and period fixed effects. Model 3 includes period and student-year fixed effects. Model 4 includes controls for individual characteristics (gender, race, special education, English language learner), the student’s total number of valid attendance marks, and the student’s number of classes in the semester plus grade, period, year, and school fixed effects.
p < .10. *p < .05. **p < .01. ***p < .001.
Differences in Part-Day Class Absence Rate by Class Subject (reference category is English language arts)

Note. F test of joint significance examines whether all of the subject variables are jointly significantly different from zero. Most pairwise differences between subjects are significant at the p < .05 level; pairwise significance test results available on request. Excludes classes designated for special education or English language learners. Dependent variable is percentage of class meetings on which student was marked absent on days that student was marked tardy or present in at least one other class. Model 2 includes grade, year, and period fixed effects. Model 3 includes period and student-year fixed effects. Model 4 includes controls for individual characteristics (gender, race, special education, English language learner); the student’s total number of valid attendance marks; the student’s number of classes in the semester; whether the student has one, two, or more than two classes in the subject that semester; plus grade, period, year, and school fixed effects.
p < .10. *p < .05. **p < .01. ***p < .001.
Research Question 3: Do Prevalence and Patterns in Part-Day Class Absences Differ Across Different Types of Students in Hypothesized Ways?
As both Table 6 and Figure 4 show, the rate of unexcused part-day class absences is higher in high school than in middle school and highest in 12th grade (6.1%), with a sharp increase between eighth and ninth grades and another large increase between Grades 11 and 12. Overall, in high school, unexcused part-day class absences are far more common than excused part-day class absences and both excused and unexcused absences on full days. Unexcused class absences on part days show a slight decline in 11th grade relative to 10th grade across students, probably because many students with high rates of absence drop out or leave the district schools during those grades. 17 Unexcused absences on full days also increase quite dramatically between eighth and ninth grades but then decline in 10th and 11th grades relative to ninth grade and level out between 11th and 12th grades. On the other hand, excused part-day class absences are extremely rare across all grades. Excused absences on full days stay relatively steady across grades, with a slight decline between eighth and ninth grades.
Differences in Class Absence Rates by Grade Level (reference category = Grade 6)

Note. In Models 1 and 2, the dependent variable is percentage of class meetings on which student was marked absent on days that student was marked tardy or present in at least one other class. In Models 3 and 4, the dependent variable is percentage of class meetings on which student was marked absent regardless of whether he or she was absent for a full day that day. All pairwise differences in absences across grades are significant except in Model 3: The difference between absences in Grade 9 and Grade 10 is not significant at the p < .05 level.
p < .10. *p < .05. **p < .01. ***p < .001.

Mean absence rates by grade. Years 2007–2008 to 2012–2013. Rates average across all student-year-semester-class observations in a given grade and thus represent the average percentage of class meetings on which students have that type of absence. Unexcused or excused classes on part-day absence means the student was part-day absent and was marked unexcused or excused from that class, respectively. Unexcused or excused classes on full-day absence means the student was full-day absent and was marked unexcused or excused from that class, respectively.
Columns (3) and (4) in Table 6 present results using total class absences on both part days and full days. The overall trend is quite similar to those only using part-day class absences, with or without student fixed effects. When we compare the results of all the columns, it is clear that part-day class absence is a major driving force behind the increase of total absences, and its importance seems to grow when students progress through grades. For example, column (3) shows that the increase of total absences from eighth to ninth grade is about 3.4 percentage points, where the growth of part-day absences accounts for 50% of that increase. In contrast, part-day absences contribute nearly 69% of the total increase in absences from 11th to 12th grade. Similar results hold when we compare within students.
Figure 5 shows how chronic absences, considering both full- and part-day absences, increase by grade among each racial-ethnic group, to reach a rate of 47.7% in 12th grade across all students. Black and Hispanic students have a much larger share of chronically absent students than other racial and ethnic groups and also experience a more dramatic increase when they enter high school. In 12th grade, 69.9% of Black students are chronically absent, compared to only 23.4% of Asian students. 18
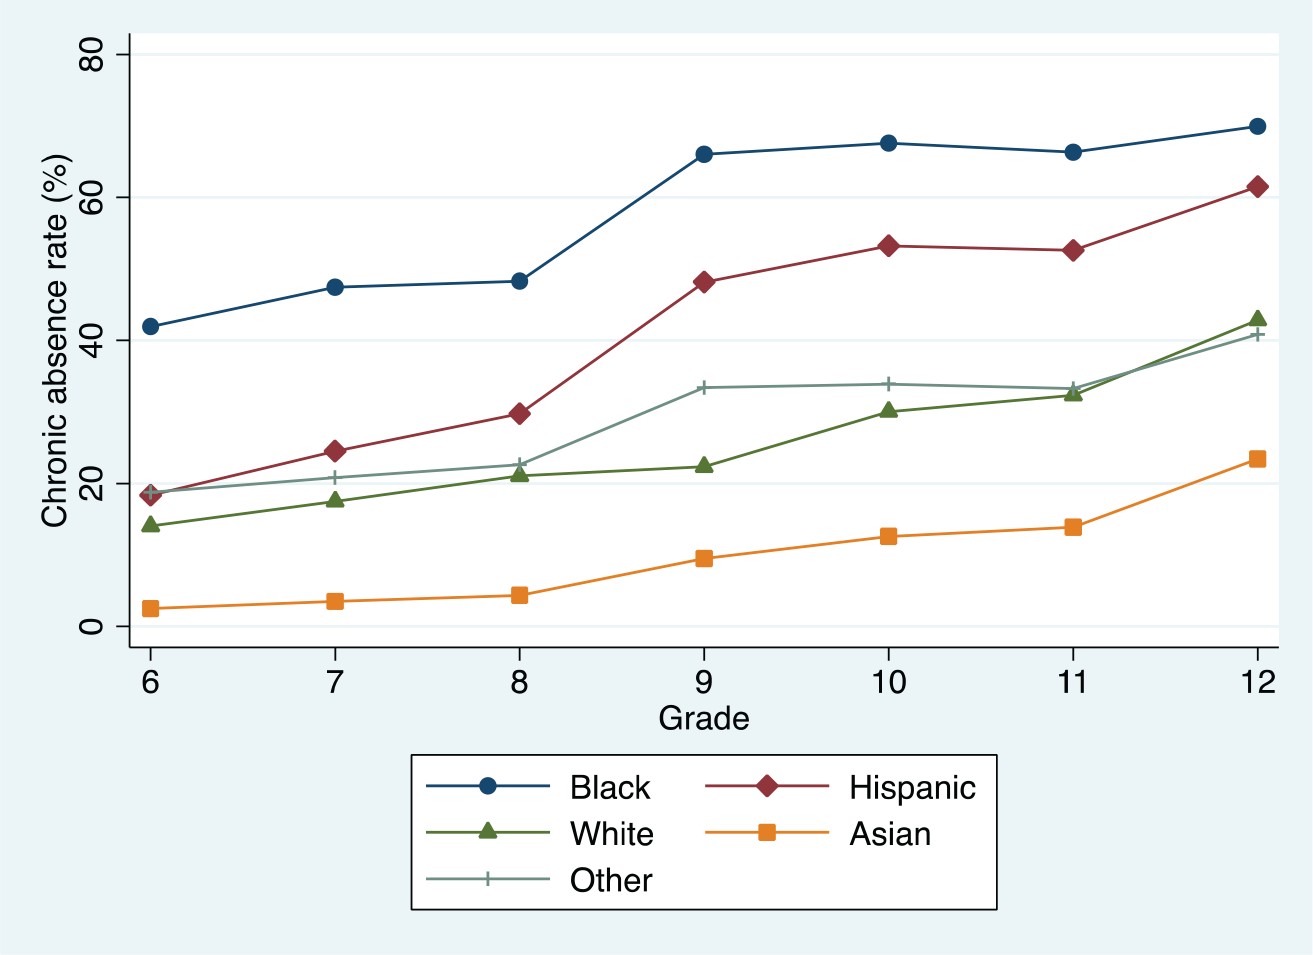
Chronic absence by grade and race-ethnicity: Absence rate > 10%. Years 2007–2008 to 2012–2013. Rates represent the proportion of student-year observations in a given grade/race-ethnicity combination with more than 10% of class absences (class absence rate calculated by taking the total number of absences divided by the total number of class meetings in a given semester for each student).
Unsurprisingly, given these striking findings for chronic absence rates, we also find substantial differences in part-day class absence rates by students’ race-ethnicity, as shown in Table 7. We find that Black students are absent from class significantly and substantially more than students of any other race in the district. In the unconditional Model 1, Asian students have the lowest part-day class absence rate (2.6%), whereas Black students have part-day class absence rates 5.7 percentage points higher than Asian students, a rate that is also much higher than Hispanic students and White students. Table 7 also shows that low-income students have more absences than other students, although differences are smaller than those defined by race-ethnicity, particularly when we include controls for race-ethnicity, school fixed effects (Model 4), and classroom fixed effects (Model 6).
Differences in Class Absence Rate by Race-Ethnicity and Median Neighborhood Income Quartile
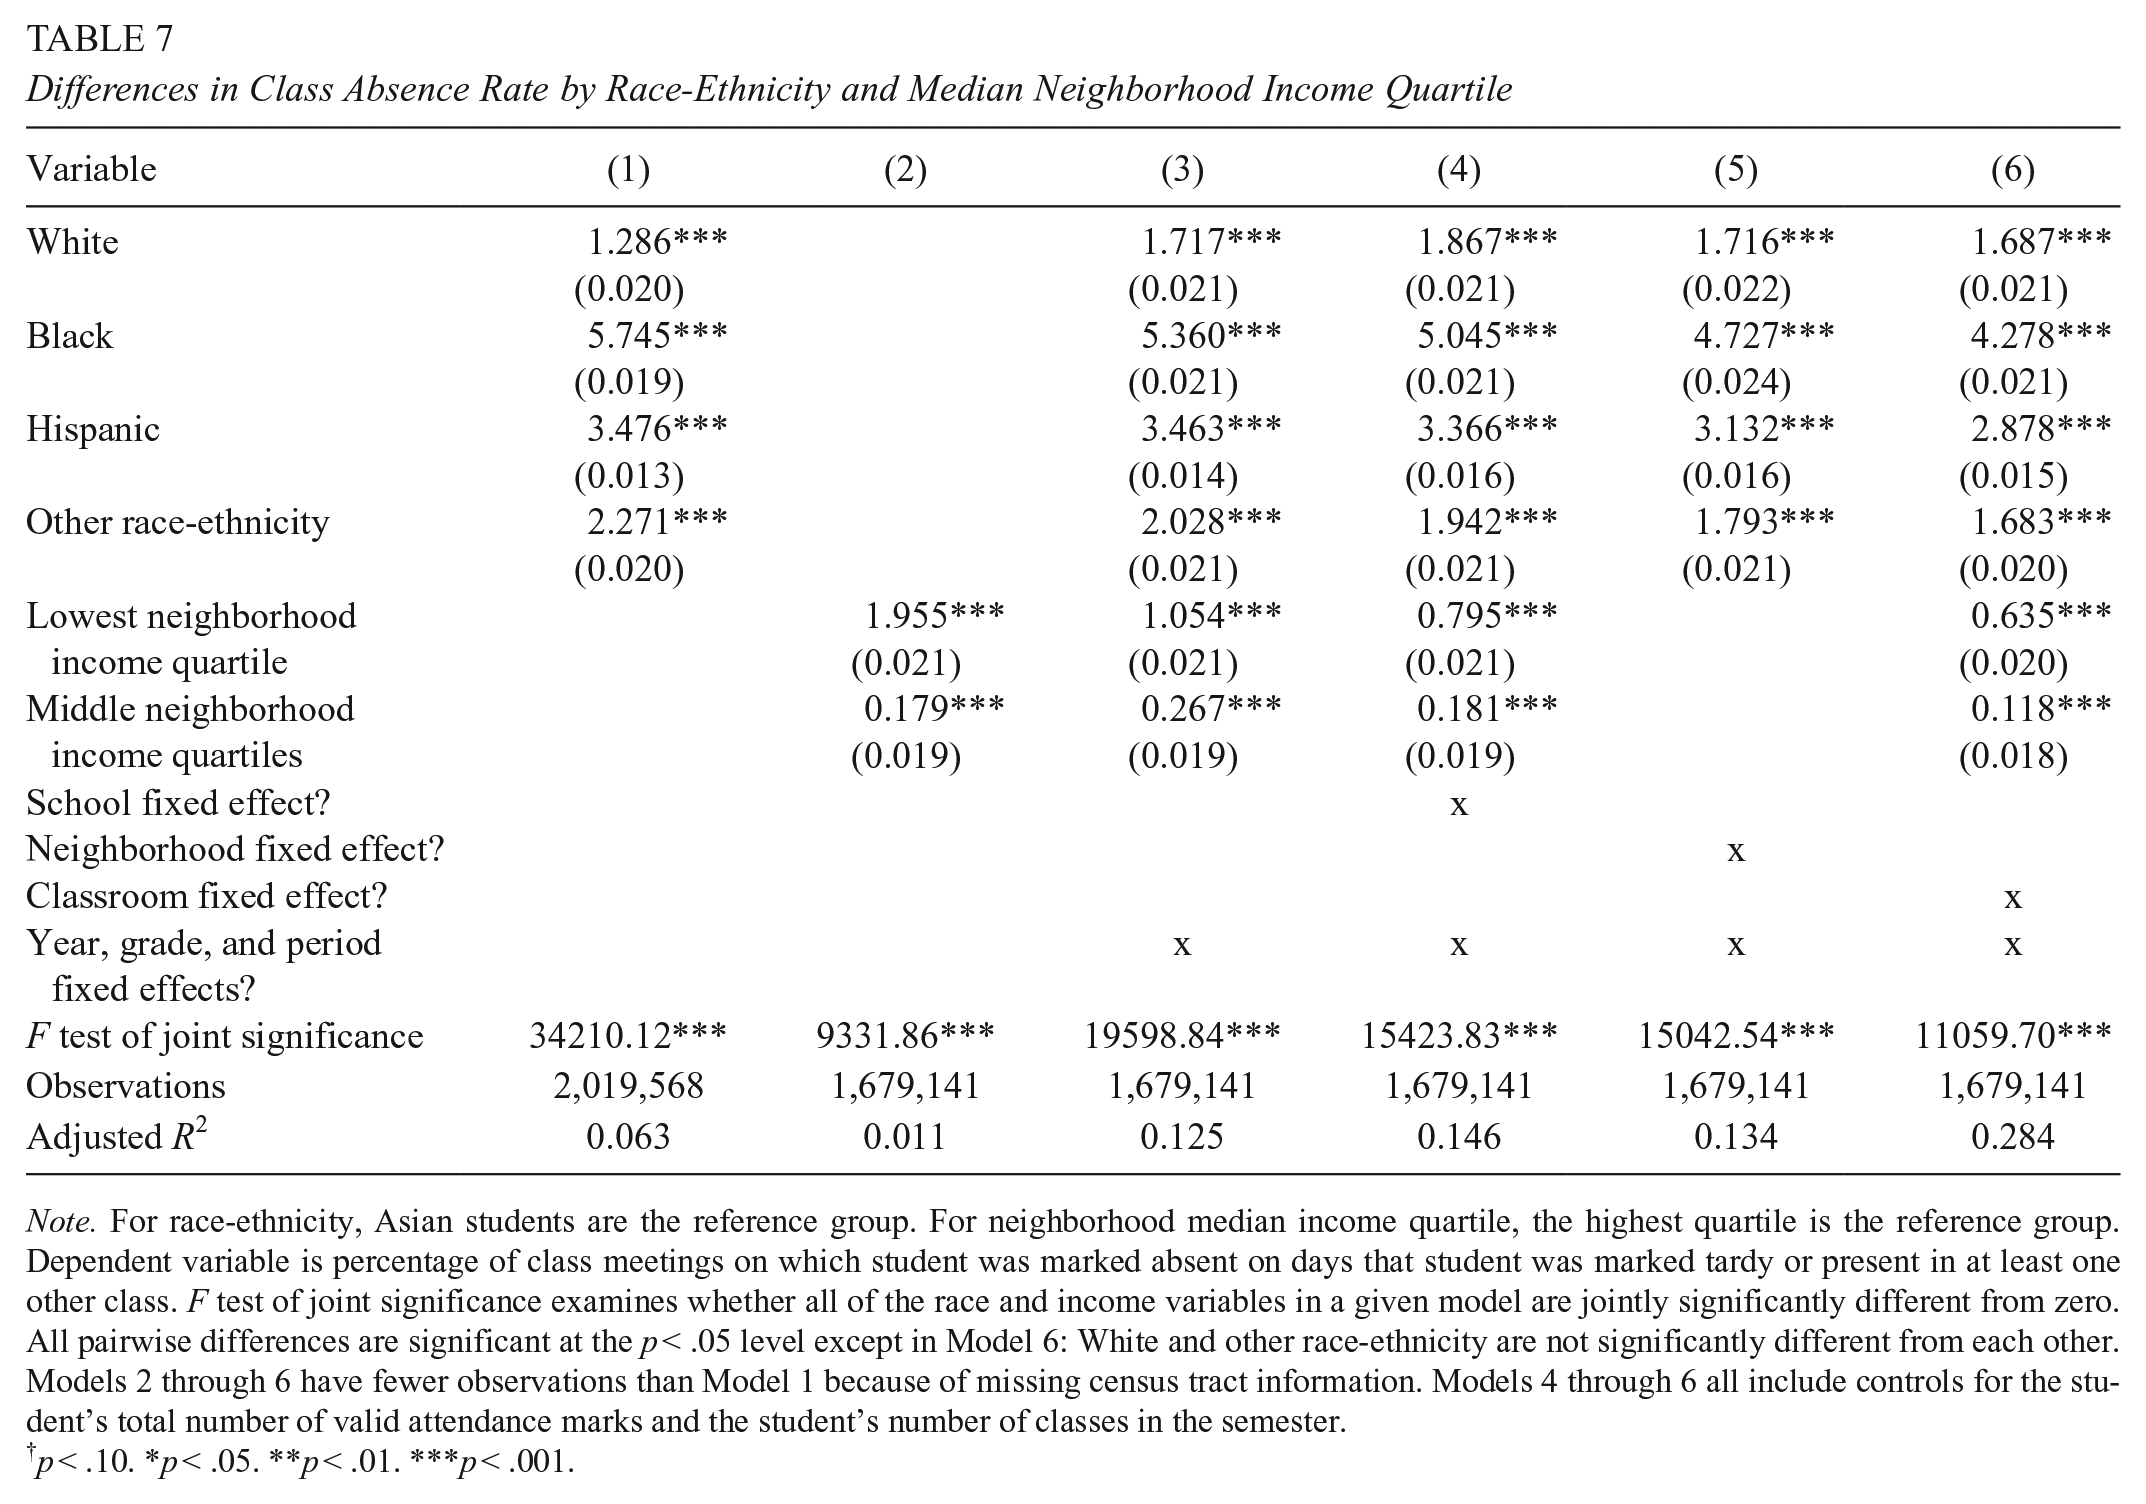
Note. For race-ethnicity, Asian students are the reference group. For neighborhood median income quartile, the highest quartile is the reference group. Dependent variable is percentage of class meetings on which student was marked absent on days that student was marked tardy or present in at least one other class. F test of joint significance examines whether all of the race and income variables in a given model are jointly significantly different from zero. All pairwise differences are significant at the p < .05 level except in Model 6: White and other race-ethnicity are not significantly different from each other. Models 2 through 6 have fewer observations than Model 1 because of missing census tract information. Models 4 through 6 all include controls for the student’s total number of valid attendance marks and the student’s number of classes in the semester.
p < .10. *p < .05. **p < .01. ***p < .001.
Black and Hispanic students are differentially more strongly affected by Period 1 than are their peers (Table 8). Specifically, Black and Hispanic students are about 1.3 percentage points more likely to be absent from Period 1 than their peers. Similarly, lower-income students are more affected by Period 1 than higher-income students. Those living in neighborhoods with the lowest-quartile median income were more likely to be absent from Period 1 than those from the highest quartile by about 1.1 percentage points in each model, whereas middle quartiles were more likely to be absent from Period 1 than the highest quartile by about 0.42 to 0.46 percentage points, again controlling for main effects of Period 1 and race-ethnicity.
Differences in the Relationship Between Class Absence Rate and Period 1 by Student Race-Ethnicity and Income
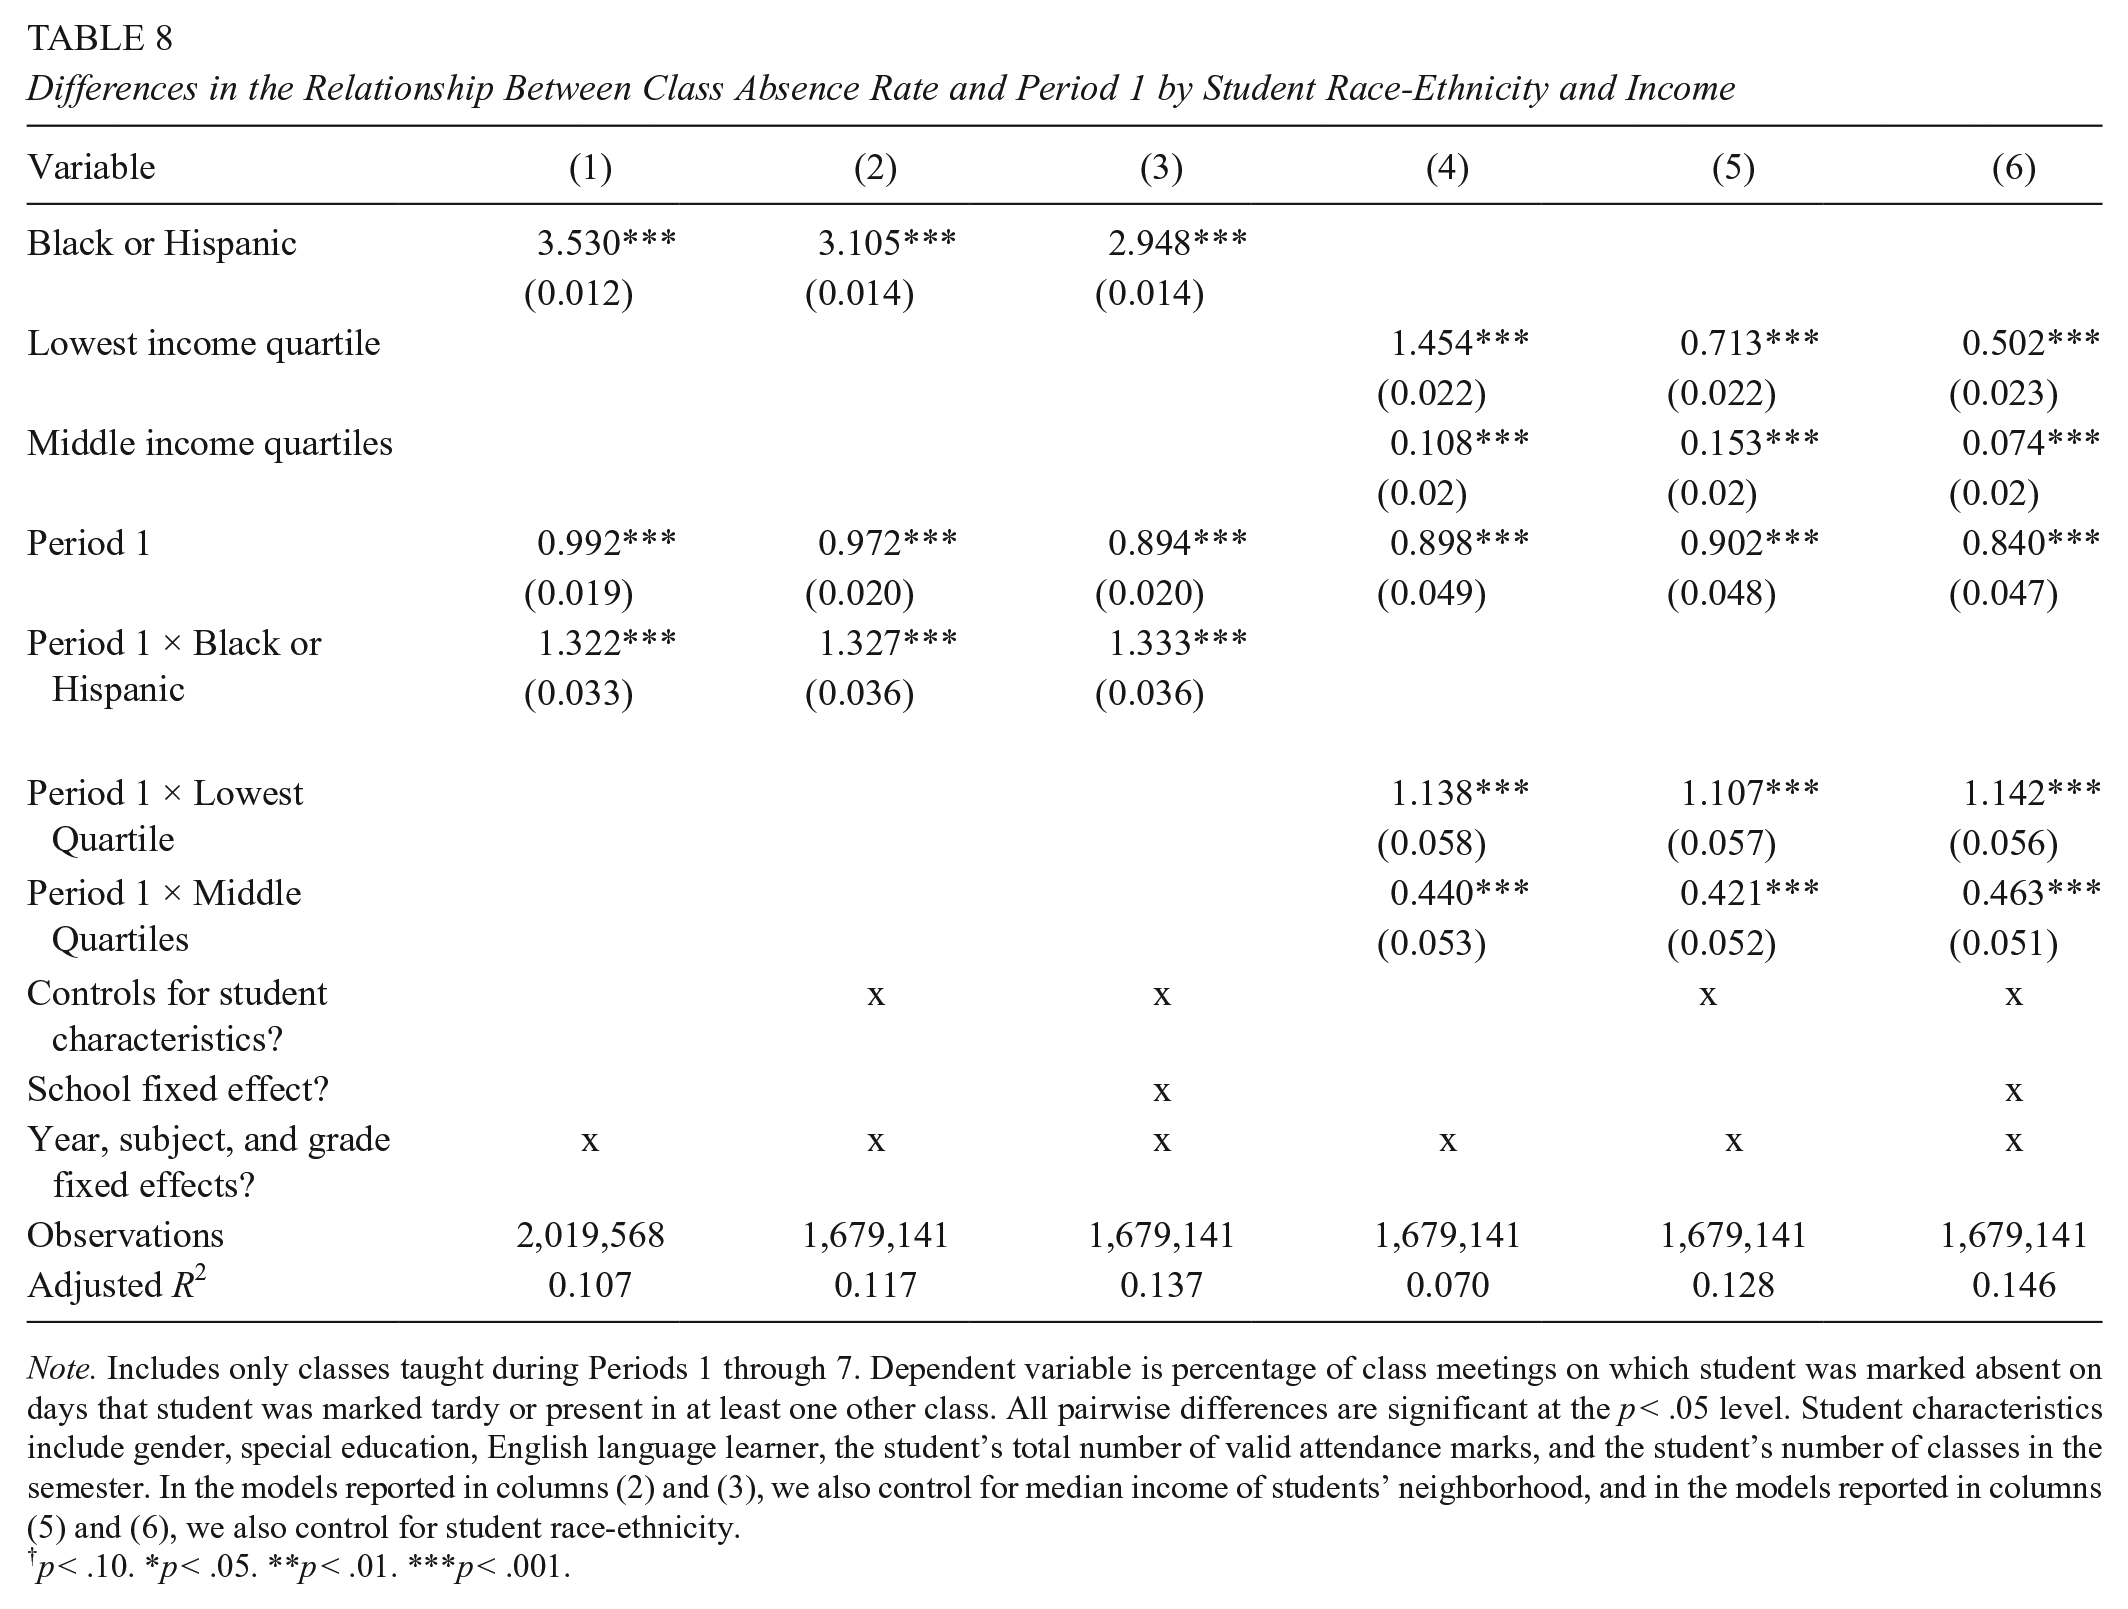
Note. Includes only classes taught during Periods 1 through 7. Dependent variable is percentage of class meetings on which student was marked absent on days that student was marked tardy or present in at least one other class. All pairwise differences are significant at the p < .05 level. Student characteristics include gender, special education, English language learner, the student’s total number of valid attendance marks, and the student’s number of classes in the semester. In the models reported in columns (2) and (3), we also control for median income of students’ neighborhood, and in the models reported in columns (5) and (6), we also control for student race-ethnicity.
p < .10. *p < .05. **p < .01. ***p < .001.
Discussion
We find that part-day absenteeism in secondary school is extremely prevalent and, in fact, explains more classes missed by students than does full-day absenteeism. The vast majority of these part-day absences are unexcused, and they increase with each middle school grade and then increase dramatically at the transition to high school, particularly among Black and Latino/a students. A shockingly high 48% of students are chronically absent in Grade 12 when part-day absences are taken into account, exceeding previous estimates using ADA (for example, Oregon has a chronic absence rate of 38% in Grade 12; Buehler, Taponga, & Chang, 2012).
Class period plays an important role in absences. The absence rate by period is U shaped, with the greatest percentage of absences from first period, followed by seventh period, and lower rates of absence from classes in the middle of the day by up to 2 percentage points, similar to the trend for four core classes in Chicago Public Schools reported by Cortes et al. (2012).
In qualitative interviews, several school and district staff members offered a variety of hypotheses for why students are missing first period more than other periods. Echoing some of the factors identified in the literature review, they mentioned that taking care of younger siblings, difficulties with transportation to school, or feeling unsafe traveling to school plays an important role in driving high rates of absence from first period, particularly for more disadvantaged students. Staff members also said that students from all backgrounds often stay up late at night using technology, causing them to oversleep the next morning and miss first period. For example, one staff member said that “a lot of students stay up late on their phones . . . they don’t go to bed until around 1 or 2 a.m.,” and another said that “kids are more addicted to technology than alcohol and cigarettes combined . . . they’re up all night, their parents tell me that.”
To our knowledge, this is the first study to quantify differences in attendance across subjects. 19 We find small differences: Students have higher rates of absence from math classes than from other core subjects, with the exception of foreign language, and have the lowest rates of absence from social studies. These trends are in keeping with national survey reports of higher engagement in social studies and lower engagement in math than in other subjects (Shernoff, Csikszentmihalyi, Shneider, & Shernoff, 2003). However, that study found that students report higher engagement in elective subjects (art, computer science, vocational) than in most core academic subjects, whereas we find that students are slightly more likely to attend their core subject than noncore subject classes. Future research and practice might determine whether differences in student interest, enjoyment, and expected future value are driving the differences in attendance across class subjects and, if so, how to improve engagement in lower-attendance subjects, such as math. Overall, though, differences by subject are small relative to differences across time of day and across student characteristics, meaning that districts may need to address attendance improvement efforts to all subjects rather than particular subjects.
These results suggest directions for future research. Policymakers and practitioners could benefit from knowledge about why absence rates are particularly high among Black and Hispanic students in order to reduce differentially high rates of part-day absences among these students. Future research might also examine how part-day and total absences vary by other student characteristics. For example, although not a focus of our study, chronic absence rates (missing over 10% of all classes in a year) among students with special education status were found to be shockingly high, at 46%, compared to 24% among those who are not designated for special education. We also found higher chronic absence rates among English learner students (29%) than among non–English learners (23%).
Rigorous research is needed on the effectiveness of interventions to reduce absences (Sutphen, Ford, & Flaherty, 2010). Staff members we interviewed suggested making teaching more engaging and employing more school and district staff dedicated to supporting student attendance. Evidence from developing countries suggests that incentives, such as cash transfers to families conditional on school attendance and school food programs (Murnane & Ganimian, 2014), as well as systems of accountability and parental communication (Guio, 2006) can improve student attendance. In addition, our findings suggest a need for policies and practices that reduce absences at the beginning and end of the day and that target students at the transition to high school. Although much future research is needed to help address absences in secondary schools, this paper contributes to these efforts by taking the initial steps of describing the prevalence and predictors of part-day absences.
Footnotes
Appendix
Acknowledgements
Camille R. Whitney’s work on this study was funded in part by the Institute of Education Sciences Grant No. R305B090016, the Stanford Graduate Fellowship, and the Graduate School of Education Dissertation Support Grant. Jing Liu’s work was funded in part by the Karr Family Fellowship at the Center for Education Policy Analysis and Freeman Spogli Institute. The authors are also grateful to the following individuals for their time and effort in providing thoughtful feedback: Susanna Loeb, Kenji Hakuta, Deborah Stipek, Ann Porteus, Kalena Cortes, Emily Penner, Jane Rochmes, Demetra Kalogrides, Min Sun, and Helen Ladd. Many thanks to the following individuals at CEPA for their logistical and technical help: Michelle Reininger, Jim Shen, Krishna Murali, Nadia Ahmed, and Hiep Ho. In addition, the authors extend deep gratitude to several individuals at the school district examined in this paper. They are not mentioned by name in order to protect district anonymity, but these individuals provided extensive feedback on the design of the study and facilitated data collection as well as interpretation of results. Any remaining errors are those of the authors alone. Both authors contributed equally to this article. Questions should be addressed to Jing Liu at
1.
Average daily attendance (ADA) of 92% among secondary students was reported for the 2010–2011 school year in the Digest of Education Statistics, Table 203.90 (Snyder & Dillow, 2013), and the average school year is 179 days.
2.
Quasiexperimental evidence better identifies the effects of attendance on achievement than correlations, given the risk of omitted variable bias; that is, students who are more likely to have low achievement are also less likely to attend.
3.
Unexcused absences are sometimes also called truancies. Students are usually marked unexcused absent initially. In order to get their absence excused, students need to take several steps. Although procedures vary somewhat across schools, in general, students younger than 18 need to bring a note from their parent stating an excused reason for an absence, such as illness or a family emergency (those older than 18 can sign the note themselves), ask their teacher to sign the note, and return the note to the school office in order to have an absence designated as excused.
4.
In a recent report, the U.S. Department of Education defines chronic absence as missing 15 or more days of school per year (Office for Civil Rights, 2016), but definitions vary. Many reports use 10% of school days, whereas others use 18 or a different number of school days.
5.
It is difficult to guess how much larger the total proportion of school time missed might be than the ADA statistic, because ADA rules differ widely from state to state, and states generally do not report the amount of part-day absence that is not counted in ADA. In California, where the district in our study is located, a student needs only to show up for a single class in order to be counted present for ADA (Attendance Works, 2014).
6.
The Cortes, Bricker, and Rohlfs (2012) study does not aim to describe class absences comprehensively, as does this paper. Instead, that paper uses absences from first period as an instrumental variable to examine the effect of absence on achievement.
7.
Although we expect a substantial number of students to have unexcused absences from the classes just before or after lunch, we do not have historical records of lunch schedules, but current bell schedules suggest that lunch most commonly occurs after third or fourth period (complicating the picture, in many cases, students are assigned different lunch times within the same school).
8.
Surprisingly, given higher rates of high school dropout and risky and delinquent behavior and lower achievement among males compared to females, studies do not generally find differences in attendance by gender (Goodman, 2014; Vaughn, Maynard, Salas-Wright, Perron, & Abdon, 2013).
9.
During the years of this study, the district offered students choice of where to attend middle and high school. Thus, some students did not attend their neighborhood school, and some had relatively long commutes to school. Such conditions might make it more likely for students to miss first period than in districts without school choice.
10.
We drop relatively few student-year observations (4,984 out of 184,089, or less than 3% of observations in the data set) due to missing background variables. When we include these observations in our main analyses (in supplementary analyses not shown in this paper), we find qualitatively similar results to those reported in the paper that exclude them. Valid attendance marks are defined as present, tardy, excused absent, or unexcused absent. Nonvalid attendance marks include alternative schedule and no record of attendance. Overall, 98% of all attendance marks are valid.
11.
We calculate number of absences for a given class per semester rather than per year, because students have different classes each semester.
12.
Only classes in Periods 1 through 7 are included in these regressions examining class period, not Period 0 (which is homeroom in 99%) or Period 8 or later (less than 4% of classes). Observations are not distributed equally across period, ranging from 9.2% of observations in Period 7 to 13.9% of classes in Period 2. Students take classes in Periods 2, 3, and 6 at slightly higher rates than in Period 1 (which may be a home study class in some cases), followed by Periods 4 and 5 (which are lunch periods for some students), and are least likely to take class in Period 7, because that period is not offered in some schools.
13.
Income varies substantially across low, middle, and high income quartiles. The median income in the lowest quartile is $41,476. The median income across Quartiles 2 and 3 is $74,500. The median income in the highest quartile is $115,574.
14.
If we add up all the fractions of days on which students have part-day absences from class, these part-day absences are equivalent to about 5 full days of school missed per year on average.
15.
The Department of Education recently used 15 days of school absences per year or more as its definition of chronic absence (Office for Civil Rights, 2016). When we use this definition, we find a chronic absence rate of 10.8% when counting absences only on days the student was full-day absent. The rate more than doubles to 22.9% when we include absences from class on part days as well. Thus, our findings are quite similar under this alternative definition of chronic absence.
16.
For ease of comparison, these period analyses include only schools in which students take six to eight periods per day (83% of all observations in this data set). In auxiliary analyses that include all observations, available on request, we examine absence patterns depending on class orders within each student and find qualitatively similar patterns to those shown here.
17.
The overall dropout rate by Grade 12 of ninth-grade students in the sample is 15.4%, and the correlation between ninth-grade unexcused class absence rate and dropout is relatively high at 0.43. However, when limiting just to students who persisted to 12th grade in the 2013 senior cohort in order to compare the same sample of students across Grades 7 through 12 and thus account for any influence of high school dropout, trends are relatively similar to the trends across all students (![]() ).
).
18.
We also change the definition of chronic absence to missing over 10% of total school days, as shown in Appendix Figure A2. Consistent with ![]() , Black and Hispanic students still compose a much larger portion of chronically absent students, but overall the rates are much smaller. In addition, chronic absence rates for Black and Hispanic students gradually drop after ninth grade, with a small increase in 12th grade, which is very different from what we find in Figure 4. This finding further confirms the importance of considering part-day class absences.
, Black and Hispanic students still compose a much larger portion of chronically absent students, but overall the rates are much smaller. In addition, chronic absence rates for Black and Hispanic students gradually drop after ninth grade, with a small increase in 12th grade, which is very different from what we find in Figure 4. This finding further confirms the importance of considering part-day class absences.
19.
Authors
CAMILLE R. WHITNEY is head of research at Mindful Schools in Emeryville, California. Her research focuses on mindfulness for educators and students as well as student social and emotional outcomes and attendance.
JING LIU is a PhD candidate at the Graduate School of Education, Stanford. His research focuses on economics of education, with particular interests in online higher education, teacher and teaching effectiveness in K–12 education, and more broadly using computational social science methods to study education processes.