
Abstract
The roles of technology and education were at the forefront throughout the COVID-19 pandemic. This mixed-methods study examines the role of the three levels of the digital divide (i.e., access, capability, and outcomes) during the COVID-19 pandemic in Kentucky. We create and analyze a new multifaceted measure of district-level digital capacity to examine the role of prior investments in technological infrastructure and the relationship with student scores in reading, math, and the ACT exam. Increased investment in digital preparedness leading up to the pandemic was protective against decreases in test scores. However, nonmetropolitan and Appalachian areas did not experience the same benefits from their digital capacity investments compared with their metropolitan counterparts. Using interview data from the summer of 2021 with 16 educators predominantly from Appalachian school districts, we discuss why these efforts to bridge the digital divide were hindered by larger, systematic challenges faced by their students.
Keywords
Introduction
Throughout the COVID-19 pandemic, schools were centers of policy debate. Although 15% of students in the United States attend rural schools (Showalter et al., 2019), there has been little national discourse around COVID-19 policies focused on these districts (Anderson, 2020; Schwartz et al., 2021). Rural schools face issues similar to their urban counterparts, including disadvantaged student bodies and teacher shortages (Schwartz et al., 2021), struggles with communication, and lack of preparation for remote teaching (Huck & Zhang, 2021), while also having distinct challenges such as transportation, broadband access, and declining enrollment. Despite this, there has been limited research on rural schools and rural–urban comparisons during COVID-19.
In this paper we use a mixed-methods approach to examine a novel measure of school district digital capacity and readiness prior to the COVID-19 pandemic. Then we examine how preparedness is associated with changes in test scores. This paper provides insight into the decision-making process to go remote, challenges with implementing policy, and the limitations to digital preparedness in Appalachian Kentucky. Taken together, our findings suggest that although having more preparedness is beneficial, there are limits to what district digital capacity can alleviate in nonmetropolitan and Appalachian areas. We end with suggestions to bolster future district and teacher preparedness.
Literature Review
Education research around the world has focused on the digital divide, frequently defined as inequality of access to information and information and communication technology (ICT) (Liu, 2021). In the 1990s, the terms digital divide or digital inequality referred to access to computers and the internet (Cheshmehzangi et al., 2023). However, as technology evolved, so did the conceptualizations of the digital divide. Scholars thought of technology access as formative, which is the lack of access to ICT in devices, connectivity, or infrastructure, and substantive, which is a gap in interaction and engagement with ICT. Put another way, others have extended this idea of formative and substantive access to classifying levels of digital inequality. The first level is access to information technology; the second level is the capability or skills needed to take advantage of technology; and the third level is the gap in benefits and outcomes (Dewan & Riggins, 2005; Wei et al., 2011). Since the pandemic, scholars have further added new levels and factors, such as gaps in algorithmic awareness and data inequalities (Liu, 2021; Lythreatis et al., 2022).
Much of education research on the digital divide focuses on the access to technology or formative elements (Liu, 2021). Increasingly, there is more emphasis on understanding how the digital divide enfolds and can be addressed at the school level as well as at the household and individual levels, with research showing how despite efforts being made to invest in hardware, the support does not extend to improving other parts of the digital divide that address instruction or learning (Ertmer & Ottenbreit-Leftwich, 2010; Warschauer et al., 2004).
Our project extends the idea of the digital divide to focus on the three levels outlined earlier (i.e., access, capabilities, and outcomes) in Kentucky’s rural areas and Appalachia. Kentucky is an interesting case study for rural America with a diverse mix of rural and urban communities. In particular, in addition to the western rural counties, the state has 54 rural Appalachian counties with historically underfunded school systems out of a statewide total of 120 (Appalachian Regional Commission, 2021; Bickel et al., 2003). These areas face challenges along all levels of the digital divide. For the first level, access, there have been long-standing challenges with broadband and high poverty in rural areas. From 2017 to 2021, 66% of households in the Kentuckian Appalachian region had access to a computer and 76% had smartphone access compared with the national rates of 79% and 87%, respectively (Pollard et al., 2023). For gaps in the second level, capabilities, rural and Appalachian areas face challenges such as teacher shortages, high turnover, and underinvestment (Cowen et al., 2012; Jimerson, 2003; Nguyen, 2020; Oyen & Schweinle, 2020). Finally, we look at test scores to examine the third level of the digital divide, outcomes.
Considering these challenges, the Kentucky Department of Education (KDE) took numerous steps to address the different levels of the digital divide. To combat divides in access, districts have implemented initiatives to buy a device for every student and teacher, colloquially known as 1:1 programs, and increased internet speeds inside schools (Leadingham, 2021). At the capability level, numerous staff positions, such as school technology coordinators and digital learning coaches, have been created to help schools and districts improve their use of technology and train staff (Kentucky Department of Education, 2017). Furthermore, Kentucky has a had a long-standing statewide strategy to promote remote learning for nontraditional students (Nelson et al., 2021). The efficacy of statewide policies is complicated by variation within the state’s rural areas; for example, the Appalachian region’s mountainous geography makes providing broadband access a greater challenge than in the plains in the west. The significant impact of region on school strategy makes Kentucky a good case study to understand the role of digital infrastructure and the digital divide on learning during the COVID-19 pandemic.
These regional access disparities are also exacerbated by income disparities. In survey data from the pandemic, lower-income parents were less likely to report that their students had access to online instruction (69%) than upper-income (87%) and middle-income parents (82%) (Horowitz, 2020). Furthermore, 59% of lower-income parents with children reported that their child was very or somewhat likely to face digital obstacles in completing schoolwork (Vogels, 2020). A national survey from fall 2020 found that 10% of children did not have access to the internet and a computer for virtual learning, with large racial and socioeconomic disparities (Friedman et al., 2021). Real-time login data suggested that only 60% of low-income students were able to regularly log on for online instruction compared with 90% of high-income students (Huck & Zhang, 2021). Rural areas and Appalachia have higher poverty rates than the national average, indicating socioeconomic status–based challenges of access could be intensified (Cohen, 2014).
Rural and low-income-area schools had less access to the internet throughout the pandemic (S. K. Patrick et al., 2021). Rural parents reported specific technological challenges, with 39% reporting that it was very or somewhat difficult to help their child with technology for online school compared with 33% of urban parents and 23% of suburban parents (Auxier & Anderson, 2020). In Tennessee, 67% of teachers in rural areas reported needing better internet access compared with 44% in suburbs, and >20% of rural/town districts reported plans to distribute devices compared with 52% of city and suburban school districts (S. K. Patrick et al., 2021) .
School districts were forced to balance real health concerns and unknowns with concerns about student learning and socialization (Goldhaber et al., 2022). Since then, evidence has shown that remote learning is associated with worsened standardized testing outcomes, even in countries such as the Netherlands that have high coverage of broadband and equitable school funding (Engzell et al., 2021; Lachlan et al., 2020; Oster et al., 2021). Evidence from the National Assessment of Educational Progress shows that there were large declines in math and reading scores for 9-year-olds and large disparities for low-performing students, low-income students, and Black and Hispanic students (Mervosh, 2022). Remote instruction was associated with student declines in achievement for reading and math, and declines were especially prevalent in high-poverty schools, which were also more likely to be remote (Goldhaber et al., 2022). These quantitative results only scratch the surface of the disparate impact of remote learning during the pandemic by analyzing test scores, which are only one piece of schools’ fostering of student social, emotional, and intellectual development (Zhao, 2022).
Early research and news coverage described the efforts rural school districts undertook to provide digital access, such as setting internet hotspots and addressing the obstacles posed by mountains, inadequate transportation, a lack of facilities, limited student supervision, and training and staff challenges, which tempered the effectiveness of these strategies (Buffington, 2020; Marshall, 2022; Opalka et al., 2020). Additionally, teachers in rural public schools reported differing opinions about the effectiveness of digital tools as well as challenges with student internet access and limitations to training (Kormos & Wisdom, 2021).
Rural schools experienced distinct challenges before the pandemic that could exacerbate educational inequality. Rural schools, frequently geographically remote, often provide wrap-around services and are important hubs for social service delivery in the absence of nonprofit organizations (Cohen, 2014; Walters, 2020). Shifts to online learning might put extra pressure on staff due to added duties and logistics to provide social services. Furthermore, rural areas already face challenges with teacher recruitment and retention (Jimerson, 2003; Nguyen, 2020; Oyen & Schweinle, 2020). These challenges are especially salient in historically underserved Appalachian regions (Cowen et al., 2012). The digital divide and remote learning may have amplified these preexisting hardships by forcing rural schools to push their staff and resources beyond their already-thin limits.
This project used a mixed-method approach to examine how school district digital capacity and infrastructure differed between metropolitan and nonmetropolitan and Appalachian and non-Appalachian districts, how earlier investment in both access and capability was related to student achievement, and how local officials implemented these programs and addressed the setbacks that occurred. Focusing on understudied geographic areas, our study combines state-level data and outcomes with qualitative insights into how these policies were implemented on the ground and challenges with education during the 2020–2021 school year and the COVID-19 pandemic.
Methods
This project began as an interview project to understand differences in rural and urban responses to the COVID-19 pandemic. The qualitative interviews, conducted over the summer of 2021, took place via phone/video calls. We use the Office of Management and Budget’s definitions for metropolitan and nonmetropolitan. For the Appalachian counties, we use the Appalachian Regional Commission’s definitions. Figure 1 provides a map of Kentucky counties by metropolitan and nonmetropolitan status as well as Appalachian or not.

Map of Kentucky divided by metropolitan and appalachian status.
As we were conducting interviews and writing up field notes, we noticed themes around technological capacity and access among educators. In addition to the lack of internet access, our interviewees mentioned several policies, such as the 1:1 device program and tools and trainings that either helped or hindered the transition to and continuation of virtual learning. This inspired us to examine whether there was a way to quantify district preparedness for the transition to virtual learning.
Our primary independent variable was a novel district digital capacity (DDC) measure from the 2018–2019 school year, the last full school year before the COVID-19 pandemic. This is a variable comprised of 10 elements that measure a school district’s preexisting digital infrastructure. Taken together, the elements of this variable capture the district’s investment in digital access and capability prior to the pandemic. Data came from the KDE’s Kentucky Digital Readiness Survey. This state-level survey, part of a state regulation, is completed by district staff, checked by the district’s chief information office, and reviewed by statewide data stewards. Although, to our knowledge, the survey has not been formally validated, the survey instrument has been rigorously evaluated, and staff have been thoroughly trained on the constructs and variables addressed in the survey (Maynard, 2014). This process, in combination with the data-review process, gave us confidence in using this survey as a unique dataset to examine district digital capacity.
We adapted elements from the “Instructional Devices and Ease of Access” and “Technology Leadership, Service, Support and Training Resources” sections of the Kentucky Digital Readiness Survey for our measures of district capacity. We focused on these two sections because they are related to the investment school districts made in personal technology use as well as in staff training, capacity building, and strategic planning. From this, we selected the following elements and divided them into two subgroups: infrastructure and staff.
The first five elements represent the digital infrastructure component, such as investment in technology and online classes prior to COVID-19. These elements are related to access to technology, the first level of the digital divide.
District purchased devices. This is a binary variable if the district purchased devices for a 1:1 implementation, which means that every student had a digital device, laptop, or tablet.
Complete device coverage. This is a binary variable if the school district had more devices for students than average district attendance.
Had learning management system. This is coded as “yes” if the district had a districtwide or schoolwide approach for a learning management system. Examples of such systems include Canvas, Blackboard, and Google Classroom.
Offered online or blended courses. This is a binary variable if the district offered online or blended courses for student credit.
Offered all online courses. This is a binary variable if the district offered all online or virtual courses to students.
The five staff elements measure the district-level staff positions and roles. These elements are aligned with the digital capabilities of districts, the second level of the digital divide.
Full-time education technology leader. This is coded as “yes” if there is a district position that is a full-time (>90% of the work year) educational technology leader.
Strategic planning education technology leader. This is a binary variable if the educational technology leaders spend most of their day working on broad strategy about using technology for learning and specific educational needs and challenges.
Has full-time equivalent digital learning coach. This is a binary variable if the district has a full-time digital learning coach. The holder of this position is responsible for providing coaching and professional learning for teachers in the use of digital tools.
High district coverage of school technology coordinators. This is a binary variable if the school district had a school technology coordinator in 75% of its schools. These coordinators represent school staff charged with school-level technical assistance.
High district coverage of in-house technical assistance. This is coded as “yes” if >50% of schools in the district have a position for a technician to focus on daily operations and maintenance.
We use three measures of student achievement for our dependent variables: the ACT and State Assessment (K-PREP) math and reading scores, which are found in the KDE datasets (Kentucky Department of Education, 2022a). The K-PREP tests are administered annually for grades 3 through 8, 10, and 11.
We used the percent change in test scores from 2019 to 2021 as our dependent variable. To calculate our outcomes for math and reading, we used the state K-PREP scores. We looked at the percentage of students who were proficient or distinguished in the 2020–2021 school year and calculated percent change from the percentage of students who were proficient or distinguished in 2018–2019. By calculating percent change, we incorporated the relative starting point of schools’ test scores, which factors in variation in school context and testing environments. By using percent change, we were measuring relative change at each school instead of assuming that the same percentage point decrease operated the same in all schools. For example, a 5 percentage point decrease in test scores from 65 to 60 is a smaller percent change (−7.6) than a decrease from 30 to 25, which is a percent change of (−16.6). Similarly, we use percent change in the composite ACT score. All Kentucky public high school students are required to take the ACT exam in the spring of their junior year (Kentucky Department of Education, 2022b). Average ACT scores measure student achievement against a national benchmark and are important indicators of college readiness.
The combination of these variables captures both state and national benchmarks across different subjects. We used these outcomes because of data availability, standardization, and variation. Scholars have pointed out that relying on test scores is often a narrow definition of education. Education occurs both inside and outside the classroom, and test scores do not reflect this (Zhao, 2022). Furthermore, focusing solely on test scores and “learning loss” might encourage suboptimal education practices such as teaching to the test or shortchanging other subjects (Zhao, 2022). We used the composite ACT score to avoid relying solely on state tests. The ACT exam incorporates four subjects (i.e., reading, writing, math, and science). While the ACT is still a test with its own shortcomings, its focus is college readiness and is further removed from the idea of teaching to the test. Furthermore, we employed interviews with education officials to illustrate challenges beyond test scores. The interviews drew attention to other strengths and weakness of digital capabilities to illustrate the importance of holistic education and response.
Finally, we controlled a set of school and county characteristics from the 2015–2019 American Community Survey:
School enrollment. We used raw aggregate enrollment numbers displayed in hundreds for all districts from the 2020–2021 school year from the KDE (2022a). Bigger schools and school districts might have more resources due to economies of scale and fewer transportation challenges.
Full-time equivalent (FTE). We used the reported aggregate FTE numbers for each district from the 2020–2021 school year from the KDE (2022a). FTE is equivalent to one employee with a 40-hour workweek, and it scales proportionally (such as a 20-hour workweek corresponding to 0.5 FTE). In our analysis, we used FTE per 100 students because it is a better indication of whether these districts have adequate staff in comparison with the size of their student body.
Free and reduced-price lunch (FRPL). For schools with predominantly low-income populations, the Community Eligibility Provision (CEP) program has allowed districts to offer free meals to all students (M. Patrick, 2016). The KDE has data on the number of students in each district who are eligible for FRPL. These numbers reflect students whose household incomes are at or below 185% of the poverty line.
Percent unemployed. We used this as a proxy for economic conditions at the county level.
Household size. Household size may influence student outcomes in a couple of ways. Households with more adults may be better prepared for online schooling because one adult may be able to stay at home with and supervise children. Larger households, however, may reflect crowded homes where students might not have a suitable studying environment.
Although we did our best to address different prepandemic contexts, look at relative measures, and control for school-level characteristics, due to data limitations, we were unable to fully account for cumulative inputs, such as teacher quality and prior student achievement, that capture instructional quality better than proficiency scores, Thus, our results are based on a narrow outcome and incomplete measure of instruction quality. However, our results are indicative of how DDC shaped teaching and instruction in schools and how educators adapted to the pandemic with teaching material on state tests and the ACT exam. Future research can further extend the idea of DDC to more holistic measures of instruction quality and other outcomes.
Results
Sample Descriptives
Using our novel measure, we examined a number of school district policies that shaped digital access across geographies. Table 1 shows DDC and other covariates overall and for geographic subgroups: metropolitan and nonmetropolitan and Appalachian and non-Appalachian. We did two-tailed t tests to see whether there were significant differences in the group means of the metropolitan and nonmetropolitan and the Appalachian and non-Appalachian areas.
Average district digital capacity and controls

p < .05; **p < .01; ***p < .001.
Table 1 presents the statistics for school DDC and our control variables. Metropolitan districts have one more DDC element than nonmetropolitan districts (6.5 vs 5.6), and this is a statistically significant difference. There is also a statistically significant difference between metropolitan and nonmetropolitan counties for each subset of DDC elements. This gap mirrors prior work showing differences in digital capacity measured by broadband access (Auxier & Anderson, 2020; Golden et al., 2023; Kormos & Wisdom, 2021; Lake & Makori, 2020). Nonmetropolitan areas had statistically different higher percentages of students eligible for FRPL (60.4%), more unemployment (7.1%), and slightly smaller family sizes compared with their metropolitan counterparts. The number of FTEs per 100 students is similar. Appalachian and non-Appalachian districts are similar for DDC, but Appalachian areas have statistically significant higher FRPL eligibility (Appalachian counties have an average of 63.9% vs 51.8%) and more unemployment.
Table 2 shows the dependent variables by rurality, the dependent variables of change, and tests scores by geographic subgroups. In 2019, there was no statistical difference in math or ACT results between metropolitan and nonmetropolitan and Appalachian and non-Appalachian districts for math and the ACT exam. In reading, nonmetropolitan and Appalachian counties had a statistically significant higher percentage of proficient scores. These results suggest that prior to the pandemic, nonmetropolitan and Appalachian school districts were in some cases outperforming their metropolitan and non-Appalachian counterparts. However, when it comes to percent change between 2019 and 2021 scores and percentage point differences, nonmetropolitan and Appalachian districts experienced statistically significant larger declines than metropolitan and non-Appalachian districts. This divergence in test scores in all three measures in Appalachia suggests that the region was especially impacted by the COVID-19 pandemic.
Test scores and change from 2019 to 2021 by geographic subgroup

p < .05; **p < .01; ***p < .001.
Finally, we present the percentage of school districts that have each element of the DDC. Table 3 provides the full results and differences between geographic subgroups. The least common elements are having an in-house technician (26%) and having a position focused on educational technology strategy (41%). The offering of blended courses is the most common, with 92% of districts having offered a course. This is an important element of preexisting digital infrastructure, so we included it in our primary analysis. However, because there is limited variation, we also performed a sensitivity check where we excluded this element from analysis. There are few differences in the prevalence of elements between metropolitan and nonmetropolitan areas, but nonmetropolitan districts were less likely to have bought devices or have a school technology coordinator. Appalachian school districts were more likely to have a learning management system.
Percent of school districts that have specific elements of district digital capacity

p < .05; **p < .10.
Multivariate Results
Next, we turn to the multivariate results. We used ordinary-least-squares (OLS) regressions. We used OLS because of the efficiency of the modeling technique given our sample size and because descriptive data (scatterplots of the independent and dependent variables) suggested a linear trend such that the assumptions of OLS are reasonable. The dependent variable was the percent change in average school scores between 2019 and 2021. The independent variable was the DDC. Table 4 describes the relationship between each additional element in the DDC and the change in academic outcomes. For both the percent proficient in math and ACT scores, each additional element of the DDC was positively associated with test scores, indicating that the percentage point change from 2019 to 2021 was shrinking, not expanding. For math, an additional element was associated with a substantive and significant 0.77% increase in students being proficient in math at the p < .05 level. For ACT scores, an additional element of DDC was associated with a 0.56% increase in aggregate ACT score at the p < .01 level. There was no association with reading. These results indicate that school districts that had prior experience with staff to assist with education technology and investments in infrastructure did not see as much of a decrease in test scores as school districts without this infrastructure, suggesting that DDC potentially can alleviate these challenges in virtual education. Similar to prior research, we found that for schools with more students eligible for FRPL, there were negative associations with math and reading scores (Golden et al., 2023; Goldhaber et al., 2022; Mervosh, 2022).
Full regression table of district digital capacity on test scores
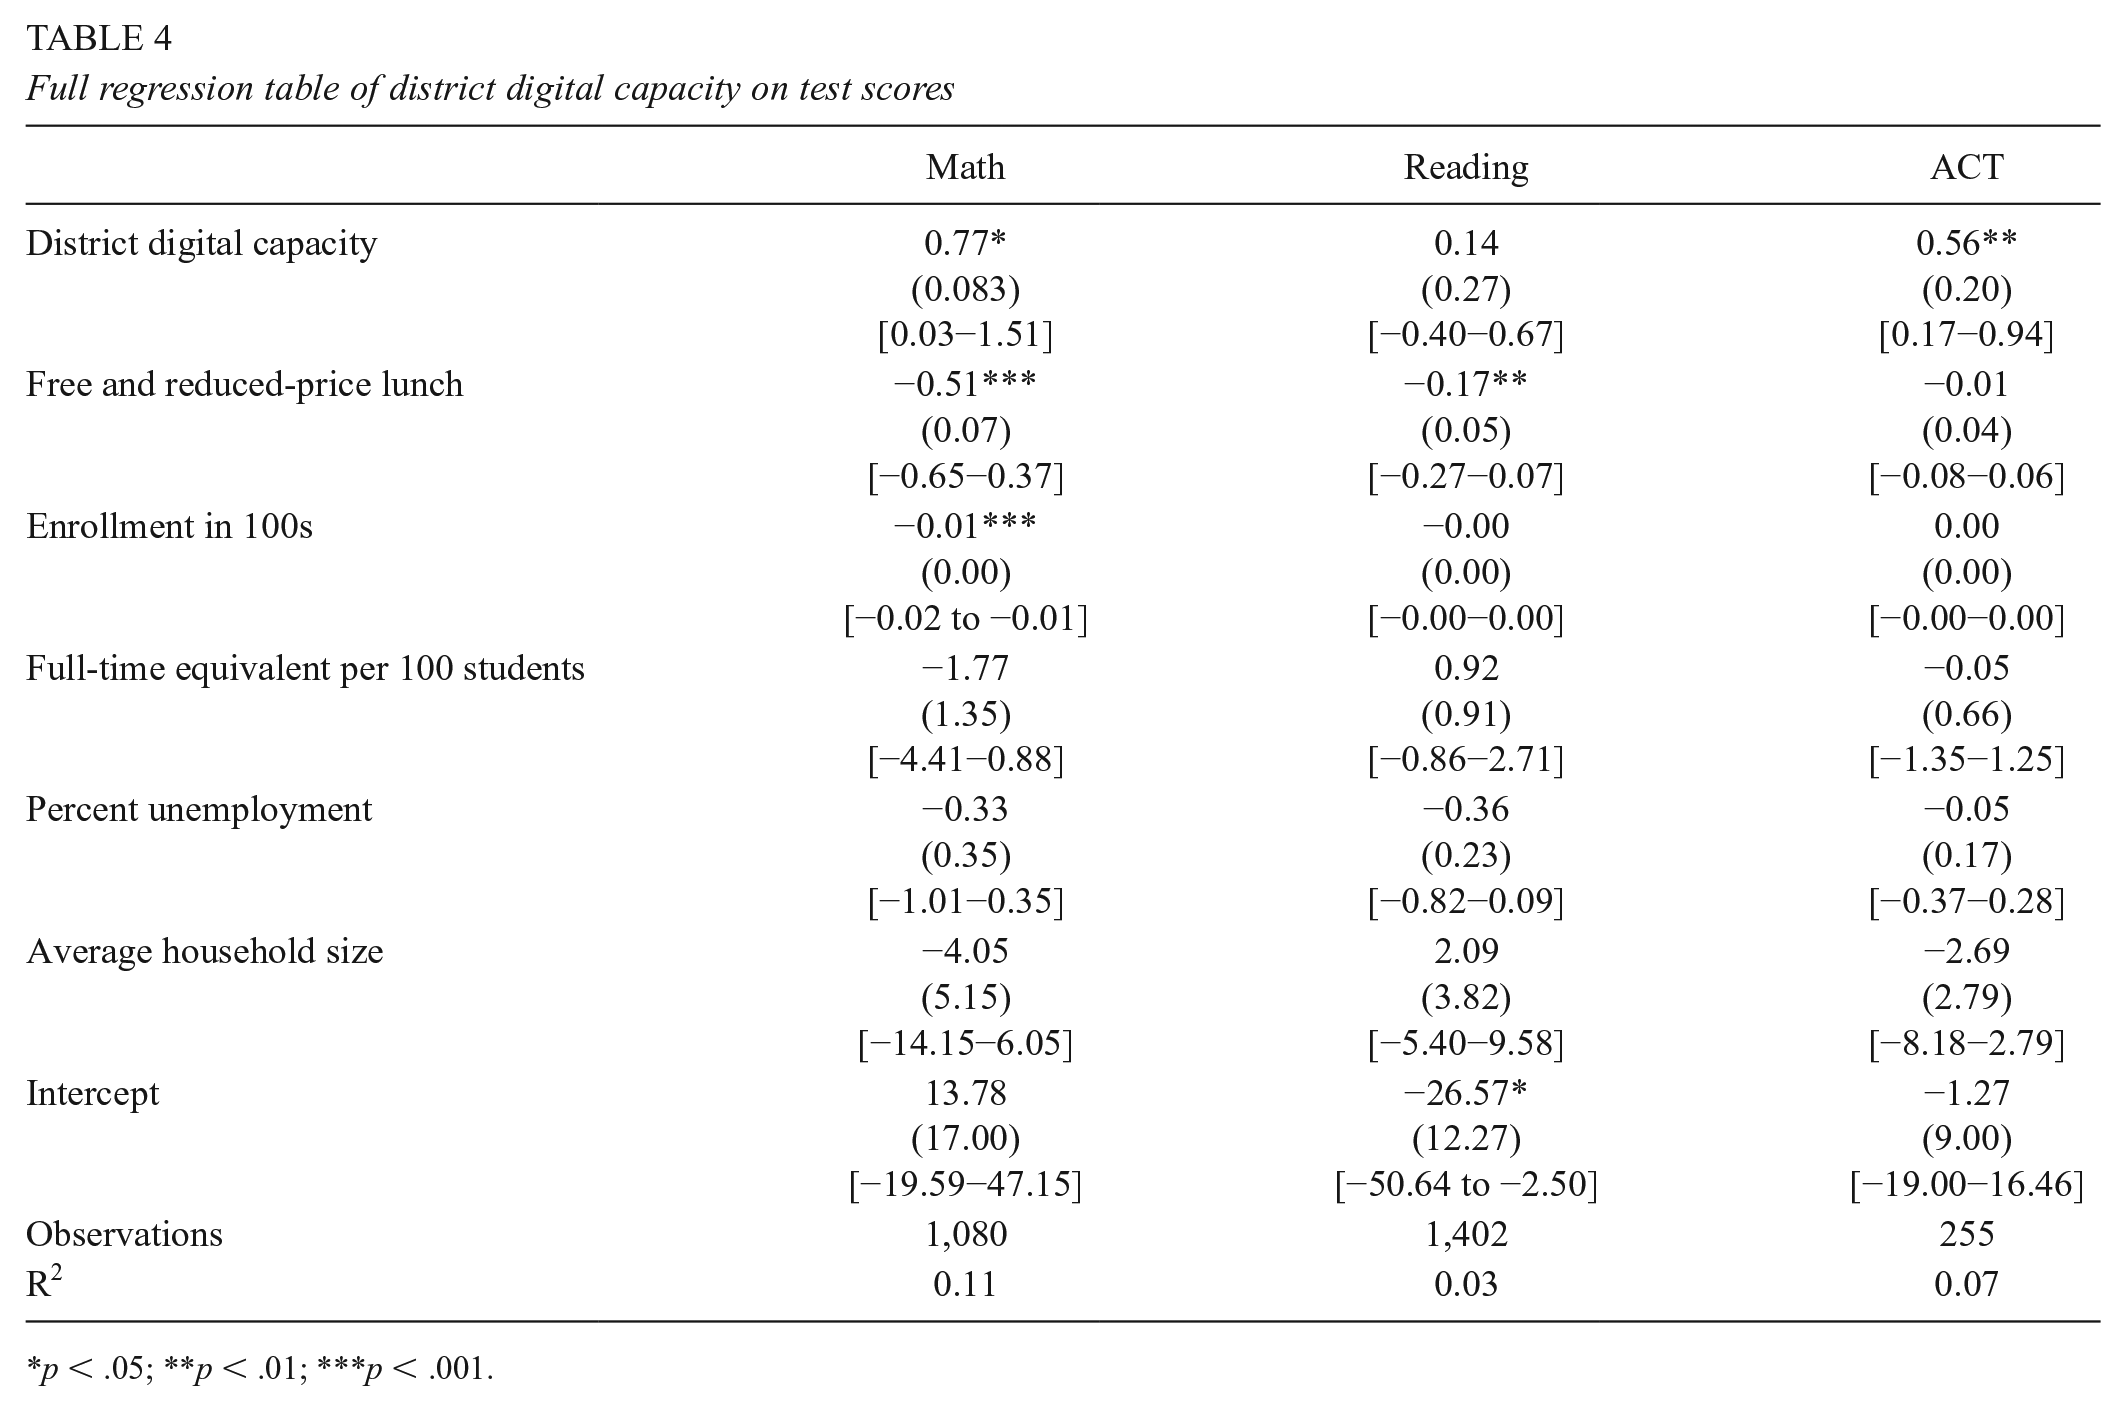
p < .05; **p < .01; ***p < .001.
Next, we separated the DDC measures into the subcomponents of staff and training (full-time staff for education technology, education technology staff focused on strategy, full-time digital learning coordinator, in-house technology support, high district coverage of school technology coordinators) and digital infrastructure (district-purchased devices, district complete coverage of devices, learning management system, offered online blended courses, offered online courses). The infrastructure elements captured district access to digital tools, the first level of the digital divide. The staff elements addressed the use of said resources, the second level of the digital divide. By using these different measures and ways of imaging digital infrastructure, we got a more in-depth understanding of digital infrastructure compared with just measuring broadband access.
For the staff and training subcomponents of the DDC, there was a significant association of a 1.31% increase for math proficiency at the p < .05 level and a 0.76% increase coefficient for ACT score at the p < .05 level. There were no associations for the infrastructure subcomponents. The results for the association between the DDC and percent change in test scores are summarized in Figure 2. The coefficient plots show the direction and the 90% and 95% confidence intervals of the DDC regression coefficient by subgroups. The full table is available in the Supplementary Material in the online version of this journal.
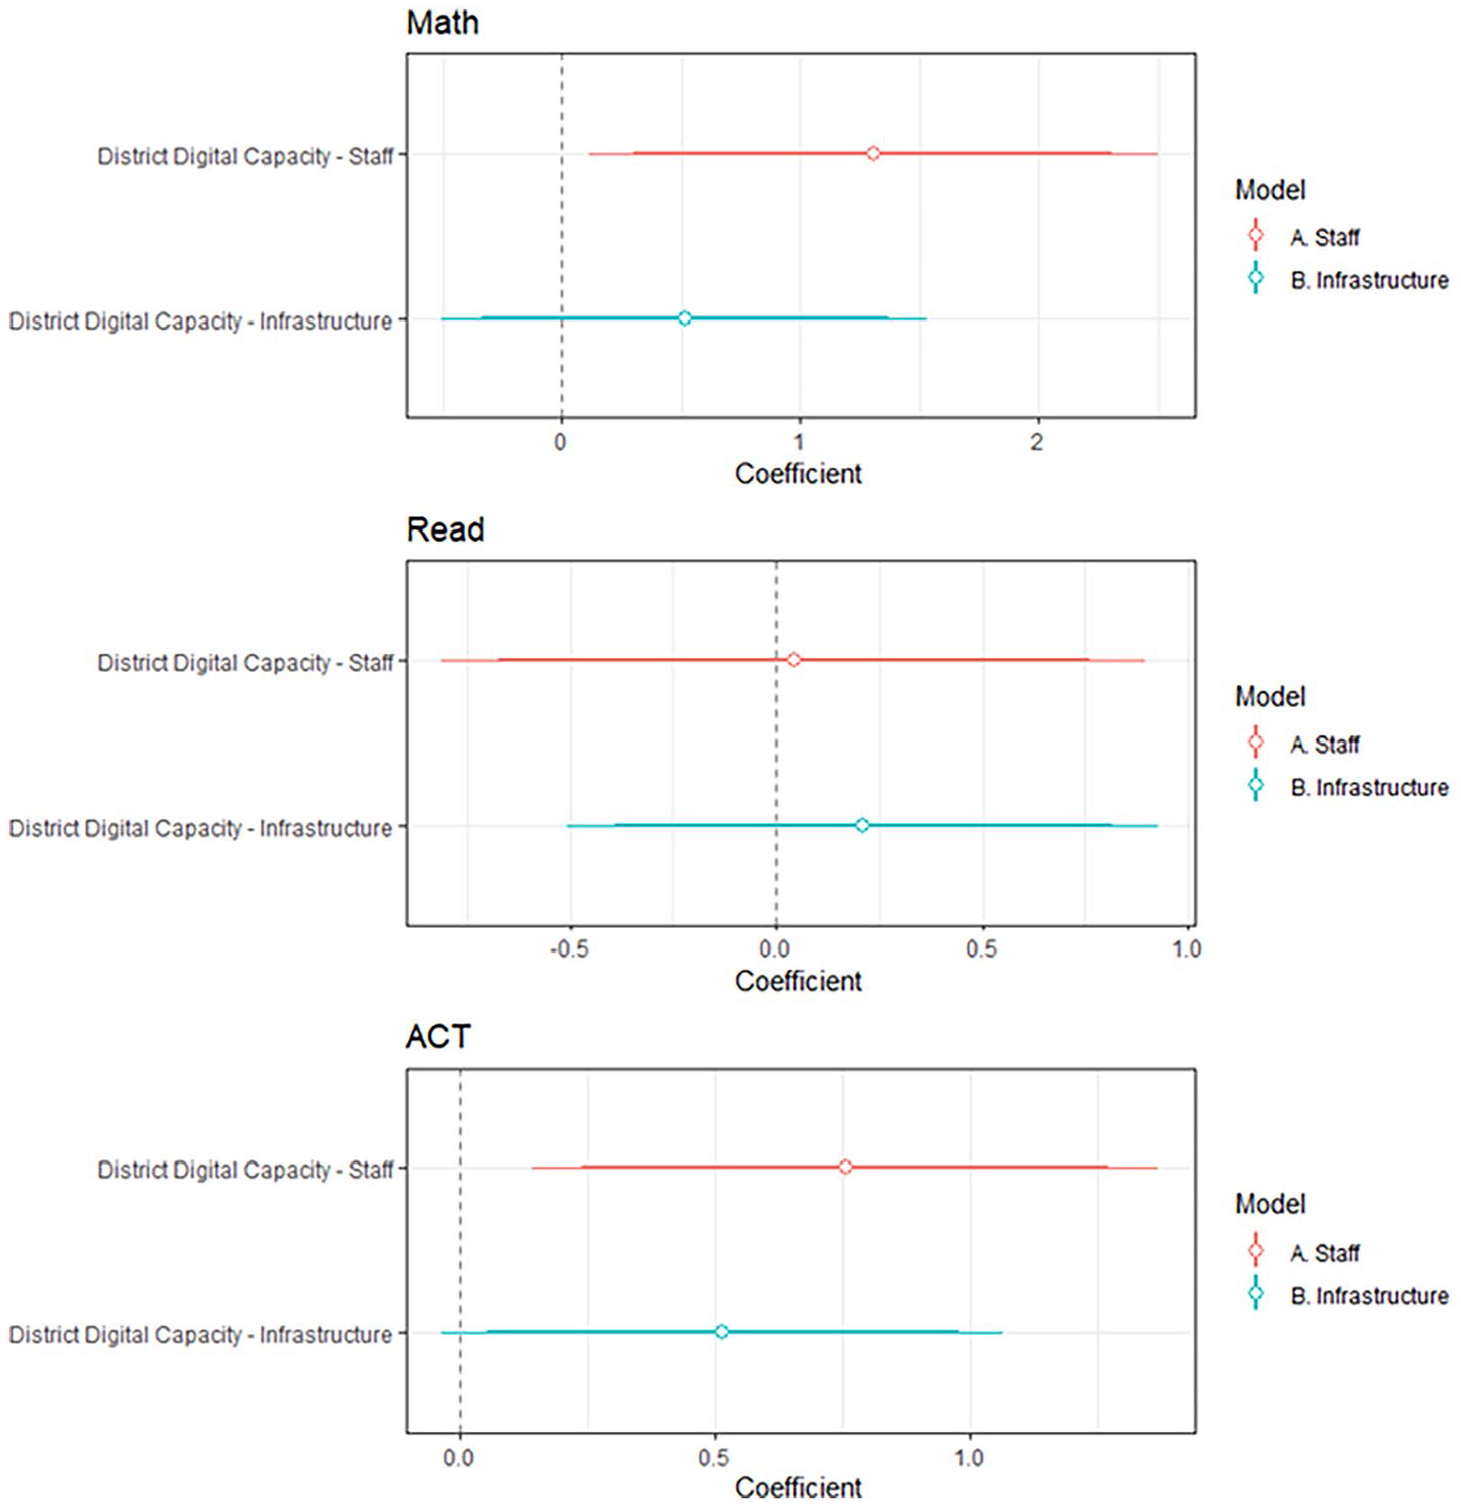
Subcomponents of district digital capacity on percent change in test scores.
Because prior literature focused on the digital divide in rural areas, the descriptive tables indicate diverging paths in test scores, and our interviews were with predominately rural educators, we stratified the sample by both nonmetropolitan areas and counties that are in Appalachia. Figure 3 shows the association between the DDC and the various test scores for metropolitan and nonmetropolitan areas and Appalachian and non-Appalachian districts. For metropolitan areas, the full DDC measure was positively associated with math (1.60) and the ACT scores (0.65) at the p < .05 level. For nonmetropolitan areas, the DDC was not associated with any test score outcomes. Similarly, in non-Appalachian districts, the DDC was associated with a percent increase in math (0.95) and ACT scores (0.46) at the p < .05 level, but there were no associations in the Appalachian districts.
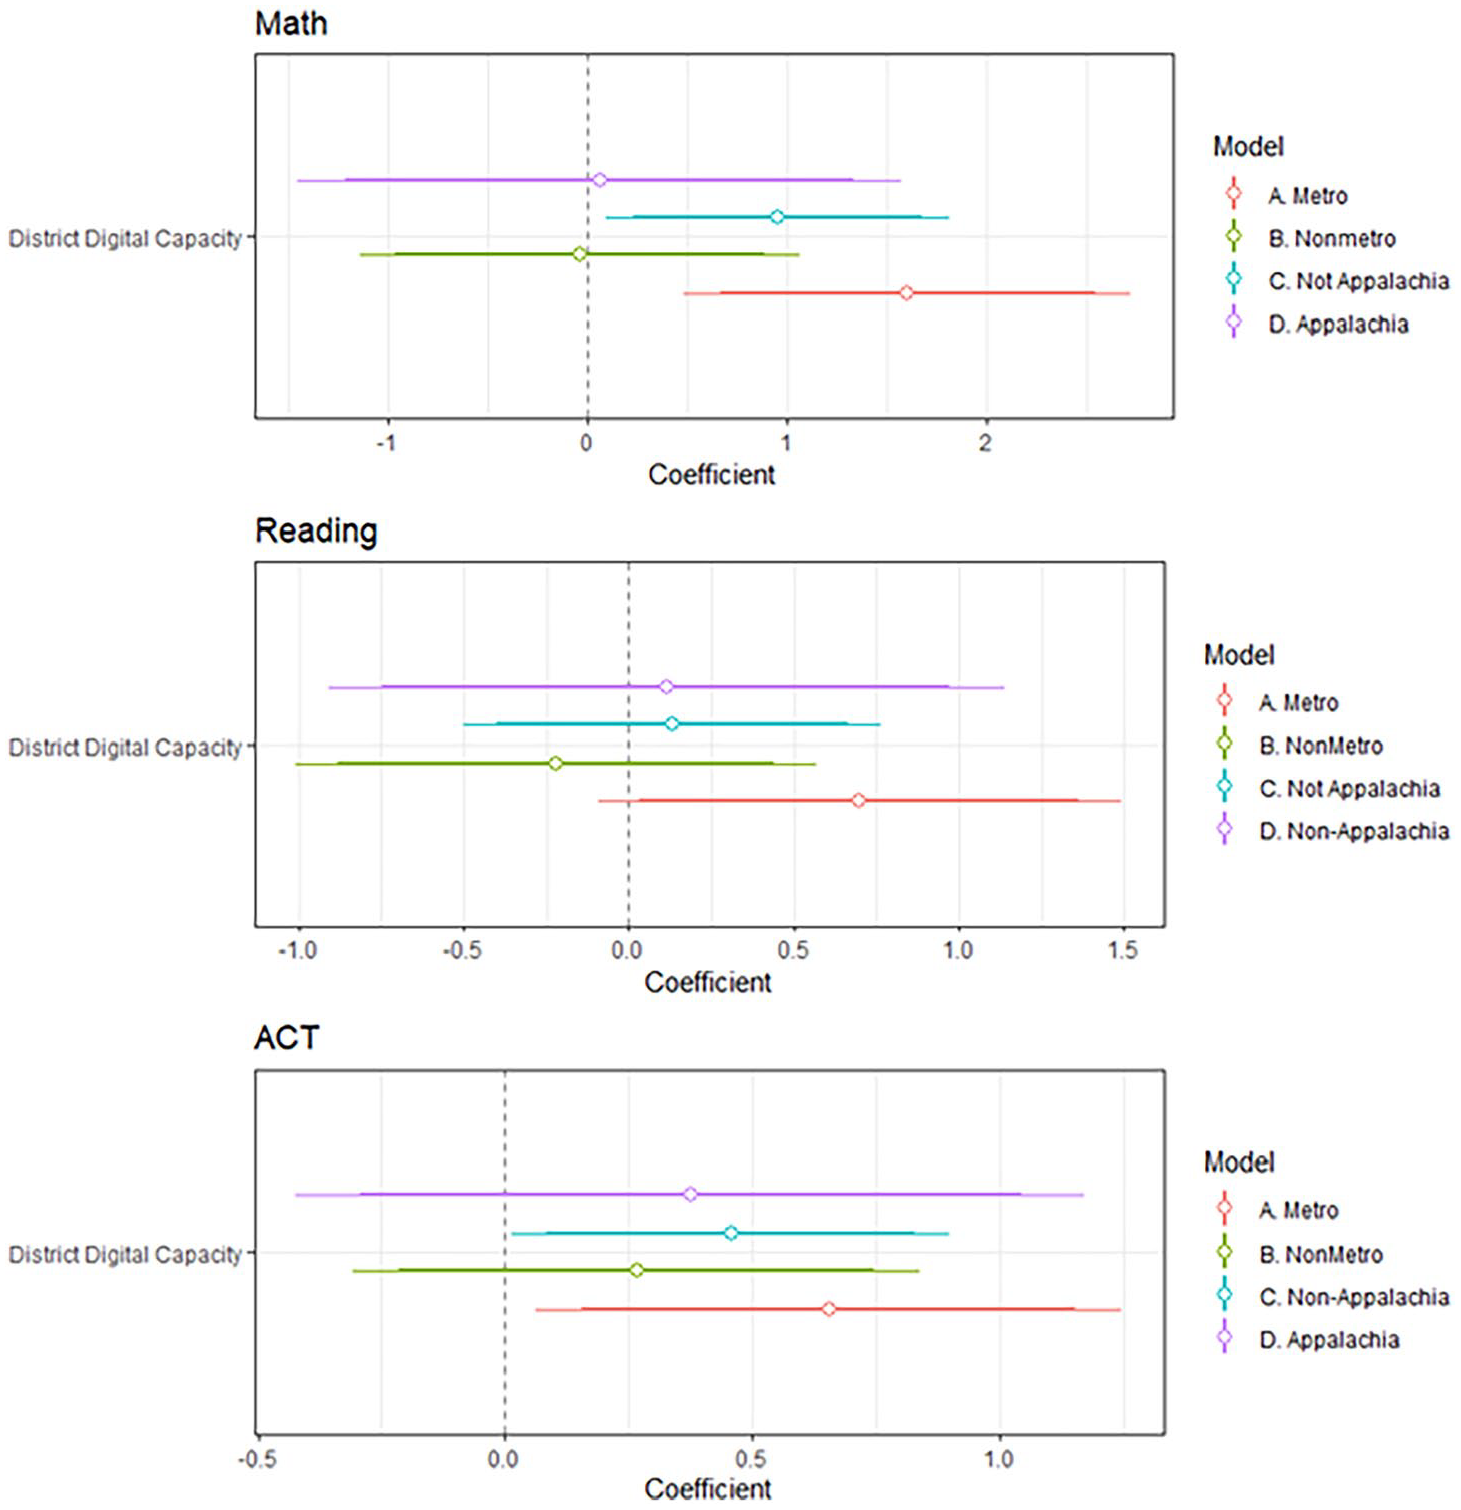
District digital capacity on percent change in test scores by geographic subgroup.
Next, we examined whether there was a consistent element that was associated with percent change in the outcome variables. Overall, there was no one element that was associated with percent change for all test scores. The results for element associations are summarized in Figure 4 for the staff elements and Figure 5 for the infrastructure elements. For the staff elements, having education technology staff focused on strategy was associated with a percent increase in math (4.54; p < .001), and in-house technical support was associated with percent increases in ACT scores (1.80; p < .05). However, having high school technology coordinator coverage was associated with a decrease in reading scores (−2.48; p < .05). Shifting to the infrastructure elements, purchasing devices for a 1:1 policy was associated with a percent increase in math scores (2.69; p < .05), and offering online courses (4.0; p < .01) and blended online courses (3.93; p < .05) was associated with a percent increase for reading scores. Offering online courses also was associated with a percent increase in the ACT scores (3.04; p < .01).

Effect of each staff element of district digital capacity on percent change in test scores.
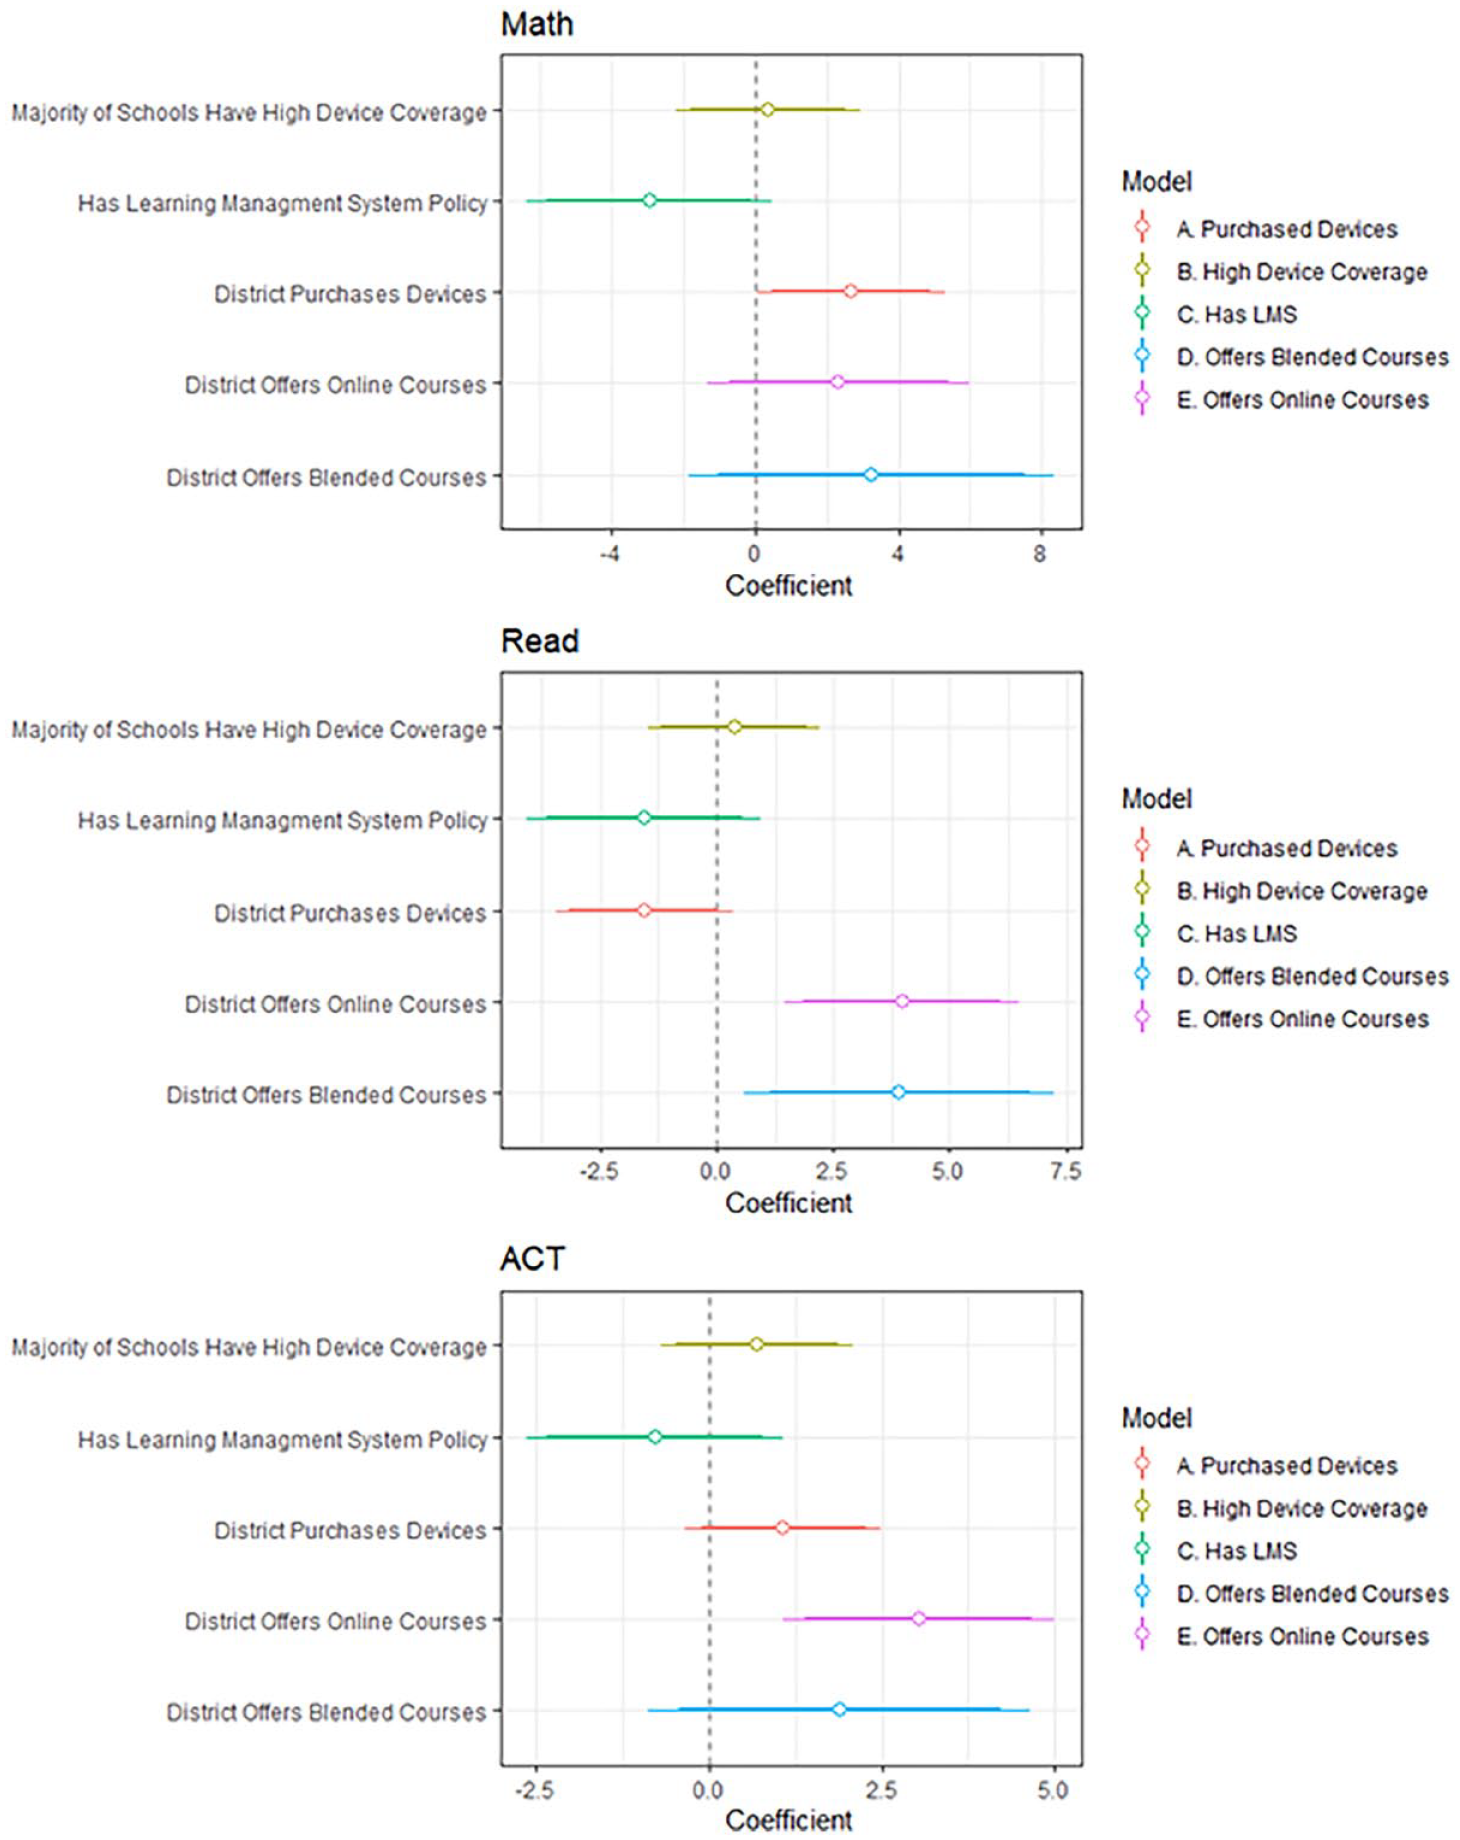
Effect of each infrastructure element of district digital capacity on percent change in test scores.
We did a series of sensitivity analyses. First, we examined whether the relationship between the DDC and test score differentials was concentrated in schools with the prepandemic lowest test scores or the schools with the highest test scores. It is possible that schools that already had low percentages of proficiency might be hit especially hard during the pandemic because they were already underresourced and understaffed. Likewise, well-performing schools might experience the least percent change because of an already established system that was able to produce students who do well on standardized tests. Thus, we stratified the sample into quartiles of test scores in 2019 for each of the three outcomes. However, despite the coefficients being of similar magnitude and direction as the primary results, there were no significant associations at any quartile level, suggesting that the associations with the DDC were not limited to schools with a specific range of test scores either lower or higher. Next, because Table 3 showed a high prevalence of the offered blended courses element of the DDC, we removed this element from the DDC construct. When we removed this element, the primary results were confirmed. Finally, we looked at the percentage point change in test scores as opposed to percent change. Results confirmed the same pattern of results as the primary analyses overall and both geographic subgroups when we used this transformation of test scores.
Qualitative Interviews
Our quantitative statewide analyses of change in test scores showed that having robust district digital infrastructure was positively associated with test scores, acting as a safety net for the large decreases that occurred from 2019 to 2021. However, these associations were only present for metropolitan and non-Appalachian areas of the state. Furthermore, test scores only describe a small sliver of the education system, outcomes, and processes. Thus, we used the qualitative interviews to understand the why behind our quantitative findings, especially why nonmetropolitan and Appalachian areas might not have experienced the benefits of DDC in educational outcomes.
First, we examined how teachers and administrators approached long-standing broadband issues for their students and staff. We looked at how not only the internet but also a district’s access to other resources and digital literacy training/staff influenced remote learning policies. We conclude this section by diving into the toll these responsibilities took on educators as well as how they understood the impact of remote instruction on their students throughout the 2020 and 2021 school years.
The project initially set out to examine differences in COVID-19 response in rural and urban communities. Participants were prompted with questions about challenges they and their families faced in 2020 and 2021 as well as safety behaviors such as mask wearing and vaccinations. Due to safety concerns, in-person recruiting was limited, so we sought to spread awareness of the study through media, listservs, and word of mouth. A call for participants was published in print in the local newspaper and online across eight regional news publications and distributed to three different school grade systems in Appalachia. Due to these strong contacts with school networks, half our first 10 interviewees were involved in the education system and discussed not only their students’ responses to remote learning but also their own preparedness for it. Thus, we pivoted the project to focus on education and school response.
After this shift, interviews with school staff about their day-to-day lives during COVID-19 brought attention to concerns about remote learning, district technological capacity, and uneven outcomes among students. We interviewed 16 Kentucky educators from June to August. Of these 16 educators, 14 worked in Appalachian counties. The interviews averaged 33 minutes in length. All interviewees identified as non-Hispanic White; more than two thirds (69%) were female; and their ages ranged from 34 to 61 years with an average age of 48 years. All interviewees had at least a bachelor’s degree and had an average household income of $110,000. All except one worked in public school or university systems. The diversity of roles within school districts (i.e., teachers, coordinators, administrators, and superintendents) and levels of education (i.e., elementary through university) within the qualitative data allowed for the analysis of how the impact of the COVID-19 pandemic varied across Kentucky school districts.
The qualitative data were analyzed initially through a flexible approach that did not use a priori codes and was appropriate to a mixed-methods project (Deterding & Waters, 2021). SP took field notes immediately following each interview. SP initially reviewed transcripts with an open-coding process; this is when we noticed that challenges teachers and administrators faced with instruction were amplified by technological and digital capacity. The quantitative analysis and prior research on the digital divide and broadband challenges pointed our attention toward the concept of DDC in interviews. Next, motivated by a narrower research question and theory, we switched to a formal templating coding process (Blair, 2015; King, 2012). We revisited the transcripts and searched for the following themes: (1) fully remote versus hybrid teaching experiences, (2) previous teaching experience with technology and internet access, (3) logistical challenges of delivering resources to students, (4) communication between school districts and communities, and (5) socioeconomic gaps and inequality divides among students. Using this targeted approach allowed us to better understand our respondents’ ideas on how DDC had differential impacts in nonmetropolitan and Appalachian areas.
The time frame of our analysis allowed for retrospection because data collection occurred 1 year into the COVID-19 pandemic. This contrasts with previous studies, which focused on the strategies at the start of the pandemic and frequently asked for hypotheticals or predictions of behavior (Horowitz, 2020; S. K. Patrick et al., 2021; Vogels, 2020). Furthermore, early pandemic studies discussing challenges to remote education and the digital divide relied on immediate responses and speculation (Lai & Widmar, 2021; Opalka et al., 2020). The interviews we collected provided more timely and expansive responses of the first full year of schooling amid the COVID-19 pandemic. Our study focused on the implementation challenges for remote learning, how these policies rolled out throughout the school year, and how they impacted students, teachers, and districts.
Digital Access: Long-standing Broadband Challenges and Bringing the Internet to Students
Education professionals in Appalachia expected regional broadband access to be a challenge as COVID-19 closures began, which resulted in the prioritization of fast/accessible internet for students as a core priority across districts in the switch to remote learning. Early responses focused on the aspects of DDC that are related to infrastructure and access, such as broadband and device availability. However, depending on the size and resources of the respective district, efforts to ensure high-speed broadband access came in many different forms that often went above and beyond prior investments in digital infrastructure captured in the quantitative measures.
One strategy included bringing internet access directly to students. A high school teacher described how her school partnered with local utility companies to provide traveling internet boxes that students and even some teachers could use. Another high school teacher said that his district was able to lend cellular data sticks to some families with multiple students. However, these teachers both taught at rural independent school districts, which were run by local municipalities; had smaller student bodies, and were mostly made up of students who lived within town/city limits—meaning that they were more likely to have internet already. This made it more feasible to target individual students and families who may have had the most trouble connecting.
Therefore, for school districts responsible for serving geographically expansive rural counties, providing internet to students on an individualized basis was nearly impossible. Instead, a common effort undertaken to mediate challenges was the creation of Wi-Fi hotspots in various locations throughout the county. This was enabled by collaboration with community institutions. One school district administrator described working with volunteer fire departments to offer these hotspots at fire stations throughout their county. Similarly, a rural district superintendent described how his district set up hotspots at the county’s libraries, several churches, and even a local private university’s computer labs. Nevertheless, he found that these spots were underutilized, due in part to a lack of transportation: We just didn’t have many people take advantage of that, and I think that was lack of transportation. We are a very, very large rural district—we are a big county—so even our bus routes, they are very long bus routes every day. So I think just the geographic distribution of where our students are is a challenge.
When these efforts failed, schools resorted to manual delivery of course work. The superintendent mentioned that they coped with the geographic challenges by delivering assignments on flash drives but that “it took a lot of manpower to try to level the playing field for those students who [were] in difficult situations.” Similarly, an elementary school teacher from eastern Kentucky tried to hold class online when her school first went remote but resorted to paper packets after hearing complaints from parents. Even after this change, she still encountered challenges with parents who had difficulty traveling to the school on packet pickup days. These experiences highlight the pitfalls of DDC elements in large Appalachian districts. To take advantage of school-provided devices, students must have had access to the internet; to reach a Wi-Fi hotspot, students must have had access to transportation. Even if a district offered programs to address each potential barrier, they required effective communication channels between district personnel and families. This demonstrates how schools with the capacity to bring internet or other resources to students still could not always overcome overarching challenges of geography or transportation, especially all at once.
Digital Capacity and the Decision to Stay Remote
The interviewees stressed that their district’s ability to effectively teach students remotely depended on a multitude of factors beyond at-home internet access. Even if schools were able to anticipate and mitigate broadband issues, they quickly found that there were other factors limiting the efficacy of online learning. Two such factors that were repeated by educators were related to levels of the digital divide: (1) access because of lack of devices that students could bring home and (2) capabilities due to inexperience with online platforms such as Google Classroom.
Our quantitative results found that if districts had purchased devices in 2019 for a 1:1 policy, there was an associated increase in math scores. However, when COVID-19 shut down the schools, many rural districts had not yet invested in having complete device coverage; nonmetropolitan and Appalachian districts were less likely to have purchased devices in 2019, and nonmetropolitan districts were less likely to have complete coverage. This reality was reflected on the ground throughout our interviews. For example, a superintendent noted this was a main reason why they used paper packets for the 2019–2020 school year and prioritized handing out devices to students that August. For schools who had activated their 1:1 policy, device distribution was a barrier. A high school teacher from southeastern Kentucky mentioned that although the school offered devices, it still struggled with issues of communication and parental involvement: We had parents calling the school saying, “Why are my kids failing,” and they’re like, “Well, they’re supposed to be doing their work online.” And they [the parents] were like, “Wait, they’re supposed to be working on that this whole time?”
This highlights how the infrastructure for these programs goes beyond the technology itself used for remote learning. The presence of a program and devices was not sufficient to ensure uptake and use. Getting the devices to the students required robust remote communication systems between schools and families. In this district, miscommunication resulted in mismatched parental and school expectations for remote learning.
Furthermore, having previously offered online or blended courses was beneficial for school outcomes, showing the importance of prior experience with these tools. Educators reflected these findings. Teachers described varying levels of preparedness and confidence when shifting to technology and online learning tools—particularly Google Classroom. One high school teacher described getting individually trained with technology through a program called the ITeacher Fellowship and how she wished that other teachers had experienced the same professional development prior to the pandemic: “I can remember being so resistant to Google—like I was an 80-year-old woman, like ‘I don’t want to use Google Slides, I don’t want to use Google Docs, I’ll just use my same old PowerPoint for forever.’ I can remember feeling that way, but I wanted to learn.” This teacher said that she was “so thankful” she got her certification, wishing that her district had invested in professional development on asynchronous learning prior to the pandemic. Likewise, a high school science teacher felt that the move to online learning was easier for him than his peers who taught in other districts because his school had already been using Google Classroom for a few years before the pandemic.
However, the interviewees also discussed the limitations of training and digital infrastructure. Because teachers found the transition to Google Classroom difficult for themselves, they especially empathized with the experiences of families and young students. A second grade teacher from eastern Kentucky described working parents and grandparents who struggled to help their children adjust to online classes: A lot of our parents and grandparents (because I have a lot of students who are being raised by grandparents), they struggled with using it with the little student Chromebooks. So I think after about a month of trying to struggle through them doing the lessons on the Chromebooks, I just went to a situation where it was video lessons because I also had issues with kids logging on with me when I was on, [saying] “Mom’s at work; she can’t help me get on.”
Perspectives such as this emphasize how access is only one part of the story to make online learning accessible to all; previous investment in and experience with online education play an important role in shaping remote learning outcomes for both students and teachers.
Limitations for DDC
On top of overcoming the obstacles described earlier to even enable remote learning, educators still had to find time to perform their traditional responsibilities while taking care of themselves and their families during the pandemic. This constant stress had a noticeable toll. The superintendent we interviewed ultimately made the decision to retire that summer, in part due to the intensity of his job throughout COVID-19: The job was 24/7, you know, because it was so many different avenues of instruction and transportation and food service and sports. . . . And then just trying to respond to the parents and trying to reassure them and trying to keep staff morale up as much as you can, it did have its toll. I joke with people; a lot of these gray hairs came over the last year.
As administrators recognized the pedagogic differences between in-person and remote lesson planning, districts took concrete steps to try to reduce some of the load on teachers who were teaching in both in-person and virtual classrooms. A middle school principal explained his district’s decision to make every Friday virtual to give “teachers the chance to get their lessons loaded in Google Classroom, record videos, and be available for virtual students with office hours.” Another district had an alternate solution for hybrid education where it designated one teacher as fully virtual for each subject to ensure that teachers did not have to manage in-person and virtual classrooms simultaneously.
With systems like these, teachers were able to focus their attention less on classroom management and more on how best to fit the needs of their students in each setting. One high school chemistry teacher described how she and her students’ early unfamiliarity with Zoom screen sharing meant that she had to alter her traditional teaching style. In cases where she would typically point out students’ mathematics mistakes, she struggled to provide individual feedback because she could not examine their work over Zoom: “There’s a lot to be said for being in person with your students and seeing what they can do and what they cannot do. . . . It would have fixed things in mere seconds versus what took me weeks to uncover and dig through and find with them [remotely].”
While prior experience with online education may have improved digital capacity for remote learning on a district level, the teachers indicated that it may not always help individual families. The second grade teacher felt that her district’s efforts had disparate impact based on a student’s socioeconomic status. She stated, “I could see children from homes with parents who were educated and had good jobs and the money to have good babysitters and help their kids, and there were certain children in my room that I never saw for in-person [teaching] at all.”
From witnessing it in their own classrooms, the educators were acutely aware of the negative developmental impact of remote learning on their students by summer 2021. One rural educator whose job was to support and guide teachers said, “Students who always got their work done were F students; they were just not even turning in anything. . . . Even when they came in to take the ACT, the students that did come in to take it; it’s almost like they almost didn’t have any stamina to take a test because of the isolation.” This quote stresses the variety of factors limiting student performance, such as mental health and energy struggles, which cannot be uncovered by looking solely at the quantitative data.
Discussion and Implications
A substantial body of literature has focused on the effects of remote learning amid the COVID-19 pandemic (Engzell et al., 2021; Goldhaber et al., 2022; Lachlan et al., 2020; Oster et al., 2021). Our contribution highlights how existing inequalities facing nonmetropolitan and Appalachian school districts in Kentucky impacted their ability to confront the digital divide, worsening educational outcomes despite similar starting points. In line with other early work on digital access efforts in 2020 and 2021 (S. K. Patrick et al., 2021), we found that DDC was associated with increases in state mathematics test scores and ACT scores between 2019 and 2021. However, our results showed that this technological “boost” was not universal. Despite metropolitan districts seeing significant associated increases between DDC and math and reading scores, nonmetropolitan and Appalachian districts saw no association between DDC and test scores.
Furthermore, we expanded the idea of the digital divide to go beyond broadband access and look at policies about staff and infrastructure development. Our research can help shape policy ideas that are relevant to digital teaching more generally, not just confined to the extreme case of a pandemic. Beyond the pandemic, online learning is a reality of the 21st century and, at its best, has great potential to expand learning beyond the classroom and bring new opportunities to nontraditional students as well as those in remote, low-income communities. At the conclusion of our interview, a rural superintendent said that he expected “the virtual option” to be the “biggest change that will come to public education” because of the pandemic. The 2020 and 2021 school years, therefore, can be retrospectively analyzed and imagined as a stress test revealing how school districts can better direct resources to support digital learning and underserved populations going forward.
Our work suggests that metropolitan areas are more likely to reap benefits from investing in DDC directly. Taking broadband hotspots as an example, in Tennessee, Patrick et al. (2021) found that teacher-reported engagement in virtual instruction was higher in suburban/urban districts with fewer economically disadvantaged students if they supplied hotspot access throughout COVID-19. Our quantitative results build on this finding to demonstrate that while this may work in metropolitan locales, it does not have a direct mapping onto the nonmetropolitan and Appalachian settings. The qualitative interviews explained why by revealing how community-access hotspots in large Appalachian districts were underused due to transportation concerns and that only wealthier, smaller districts could provide individualized broadband boxes to homes. This shows us that just investing in digital infrastructure is not enough; school districts can provide lots of flexibility (e.g., device distribution and digital hotspots), but long-standing barriers of transportation, communication, and socioeconomic status limit the benefits of these measures, mirroring other work on the additional challenges facing rural areas (Auxier & Anderson, 2020; Golden et al., 2023; Goldhaber et al., 2022; Schwartz et al., 2021)
What can rural and Appalachian districts do to overcome this gap? The staff subcomponents of DDC taken together are associated with increases in test scores. However, in nonmetropolitan areas, there were fewer elements of staff DDC than in metropolitan areas. Using what we learned from interviews, future policies can capitalize on both recognizing the importance of these staff positions and tailoring solutions to nonmetropolitan and Appalachian contexts.
One idea is to hire staff dedicated to a “big strategy” and deliberate, school-specific coordination efforts related to technology. For example, the Appalachian district leader who described targeted strategies such as designating teachers for remote versus in-person education felt that it benefited issues of hybrid classroom management and staff burnout; this may help address not only issues related to digital capacity but also underlying problems of teacher retention and changing labor forces in these areas. Having a designated position for these responsibilities could alleviate some of the pressure facing individual teachers on how best to communicate information about device distribution and digital assignments (such as how to use Chromebooks) to parents, guardians, and grandparents. Educational technology staff also could do outreach to parents and other community members on how to best use technology.
In addition to hiring technology-specific staff positions, we also believe that investment in digital professional development is worthwhile. Teachers in Appalachia felt that their district’s financial and capacity-building investments in infrastructure and digital literacy training helped them transition to online learning. Teachers who had used Google Classroom before the pandemic, for example, expressed feeling more prepared to teach remotely. Our quantitative results indicate that these actions would help enhance the investments in DDC that these schools have already made, possibly providing the boost the nonmetropolitan districts are not seeing for virtual instruction, as well as help school districts integrate technology and digital tools to supplement their in-person learning.
Every school district, especially those in nonmetropolitan and Appalachian regions, faces its own distinct challenges, and maintaining infrastructure and improving digital teaching cannot be accomplished without ground support that addresses the barriers to its implementation. The staff components, such as a shift to a districtwide education strategy and investing in training for staff and teachers, can provide individualized attention to meet students where they are with remote learning not just in the context of COVID-19 but also for nontraditional students or those from difficult home backgrounds (McFayden et al., 2021).
Our study has limitations. We focus specifically on Kentucky, so our findings are state specific in terms of school district composition and funding as well as reflective of the state’s COVID-19 measures for school closures. However, we believe that our insights from educators can illuminate similar challenges that other rural and underserved districts face. Furthermore, we examine test score differentials using the 2020–2021 school year; whether DDC may be associated with scores over a longer time scale remains to be seen. Districts are important agenda setters, but these policies may be implemented differently at the school level based on school needs and capabilities. To address this, we controlled for school-level factors in student body and teacher characteristics.
The COVID-19 pandemic revealed how the specific challenges facing nonmetropolitan and Appalachian districts limited their ability to overcome the digital divide, even when they sought to provide technological support with measures like those of their metropolitan counterparts. Findings from our paper provide important insight into how school district preparation and policy have implications in remote learning. Lessons learned from this case can be extended by reducing inequality through addressing the digital divide at the first, second, and third levels. Future work should further examine the impact of targeted staff positions and professional development related to digital readiness as well as whether these districts have continued to invest in their digital capacity (and if so, how) to support remote instruction in the years following the pandemic.
Supplemental Material
sj-docx-1-ero-10.1177_23328584241303875 – Supplemental material for Promises and Limitations in District Digital Capacity for Education During COVID-19
Supplemental material, sj-docx-1-ero-10.1177_23328584241303875 for Promises and Limitations in District Digital Capacity for Education During COVID-19 by Emily E.N. Miller and Sarah Pedersen in AERA Open
Footnotes
Acknowledgements
The authors thank Sarah Pachman and Elizabeth Armstrong for their ongoing feedback during this project.
Author Contributions
EENM and SP contributed equally to this paper.
Funding
The authors disclosed receipt of the following financial support for the research, authorship, and/or publication of this article: Research reported in this publication was in part supported by The Eunice Kennedy Shriver National Institute of Child Health & Human Development of the National Institutes of Health under Award Number P2CHD047879 and Award Number T32HD007163. The content is solely the responsibility of the author and does not necessarily represent the official views of the National Institutes of Health. The authors thank the Princeton Office of Undergraduate Research for its financial support.
Authors
EMILY E.N. MILLER is a postdoctoral researcher at the Poverty and Inequality Research Lab at Johns Hopkins University. She is interested in how place, especially the rural and suburban United States, shapes education outcomes and economic mobility.
SARAH PEDERSEN is a software engineer at Microsoft Corporation. She is interested in Appalachia and the intersection of gender and race in the technology sphere.
References
Supplementary Material
Please find the following supplemental material available below.
For Open Access articles published under a Creative Commons License, all supplemental material carries the same license as the article it is associated with.
For non-Open Access articles published, all supplemental material carries a non-exclusive license, and permission requests for re-use of supplemental material or any part of supplemental material shall be sent directly to the copyright owner as specified in the copyright notice associated with the article.