
Abstract
Using structural equation modeling, a previous study investigated the longitudinal relationships of role-related mathematics identity, efficacy, and interest to grade 12 mathematics performance. The results indicated that both mathematics identity and educational expectations at grade 11 were statistically and substantively significant predictors of grade 12 mathematics achievement in the presence of other factors such as grade 9 mathematics achievement, high school mathematics coursetaking, educational expectations at grades 9 and 11, as well as student and school background socio-demographic factors. The current study uses multiple group structural equation modeling and shows that the model derived in the previous study holds for males and females equally well. The study also found that females’ levels of motivation (except for interest) were lower than males’ at both points in time and that the males’ and females’ means on the motivation variables declined equally from grade 9 to grade 11. Implications of the findings are discussed.
Keywords
Among the science, technology, engineering, and mathematics (STEM) subject areas, mathematics is often seen as the most important. Without a strong mathematics background, making progress toward a STEM degree and occupation can be nearly impossible (Chen & Weko, 2009; Cribbs et al., 2015; X. Wang, 2013). Given the continued demand for STEM majors in the nation and the central role that mathematics proficiency plays in attaining a STEM degree, an important question is: How well do female students do in mathematics compared to male students?
Studies based on nationally representative datasets, such as the Early Childhood Longitudinal Study, Kindergarten Class of 1998−99 (ECLS-K), indicated that while young male and young female students scored similarly on measures of mathematics proficiency in kindergarten, substantial disparities favoring male students began to develop by third grade (Ganley & Lubienski, 2016; Robinson & Lubienski, 2011). A replication of the ECLS-K study 12 years later, in the Early Childhood Longitudinal Study, Kindergarten Class of 2010−11 (ECLS-K:2011), showed a similar pattern. By grade 2, there was a disparity of nearly .2 standard deviations between boys and girls (Cimpian et al., 2016). However, an examination of differences by sex using the National Assessment of Educational Progress (NAEP) at grade 4 found smaller differences than those found using the ECLS-K studies—1 point on a 500-point scale in 2013, 2 points in both 2015 and 2017, and 3 points in 2019. 1 In grade 12, the disparity was 3 points each in 2013, 2015, and 2019. 1 Importantly, even these 3-point differences are less than a tenth of a standard deviation on the NAEP scale, considering the median standard deviation of about 35 across the 3 years in grade 12.
A study of 10 states’ mathematical assessment scores, encompassing over seven million students, found virtually no evidence of a difference in the mathematics performance of male and female students when data were aggregated across grades levels ranging from 2 to 11 (Hyde et al., 2008). 2 A meta-analysis by a subset of the same authors (Hyde & Linn, 2006) found a huge overlap in the distributions of mathematics performance for boys and girls—92.3% when using an effect size of .1. The general conclusion was this: If there are disparities between females and males in mathematics proficiencies across the elementary and secondary school years, they are small to negligible.
The current study builds on a study by Bohrnstedt et al. (2020) that examined the role of mathematics motivation in grade 12 mathematics performance. The conceptual model guiding their research is shown in Figure 1. Note that the model is longitudinal, with grade 12 mathematics performance as the key outcome variable. Using longitudinal data from the High School Longitudinal Study of 2009 (HSLS:09), the study addressed the roles played by three constructs in mathematics motivation: mathematics identity, mathematics self-efficacy, and mathematics interest. As depicted in Figure 1, all three motivational constructs were measured in grades 9 and 11. Additionally, the model incorporates other variables that might be important in conditioning the relationship of the three motivational variables. These variables include not only sociodemographic background variables, but previous mathematics achievement, a measure of general educational expectations, and a measure of the highest mathematics course taken at the time of the HSLS:09 first follow-up, during the junior year of high school for nearly all respondents.
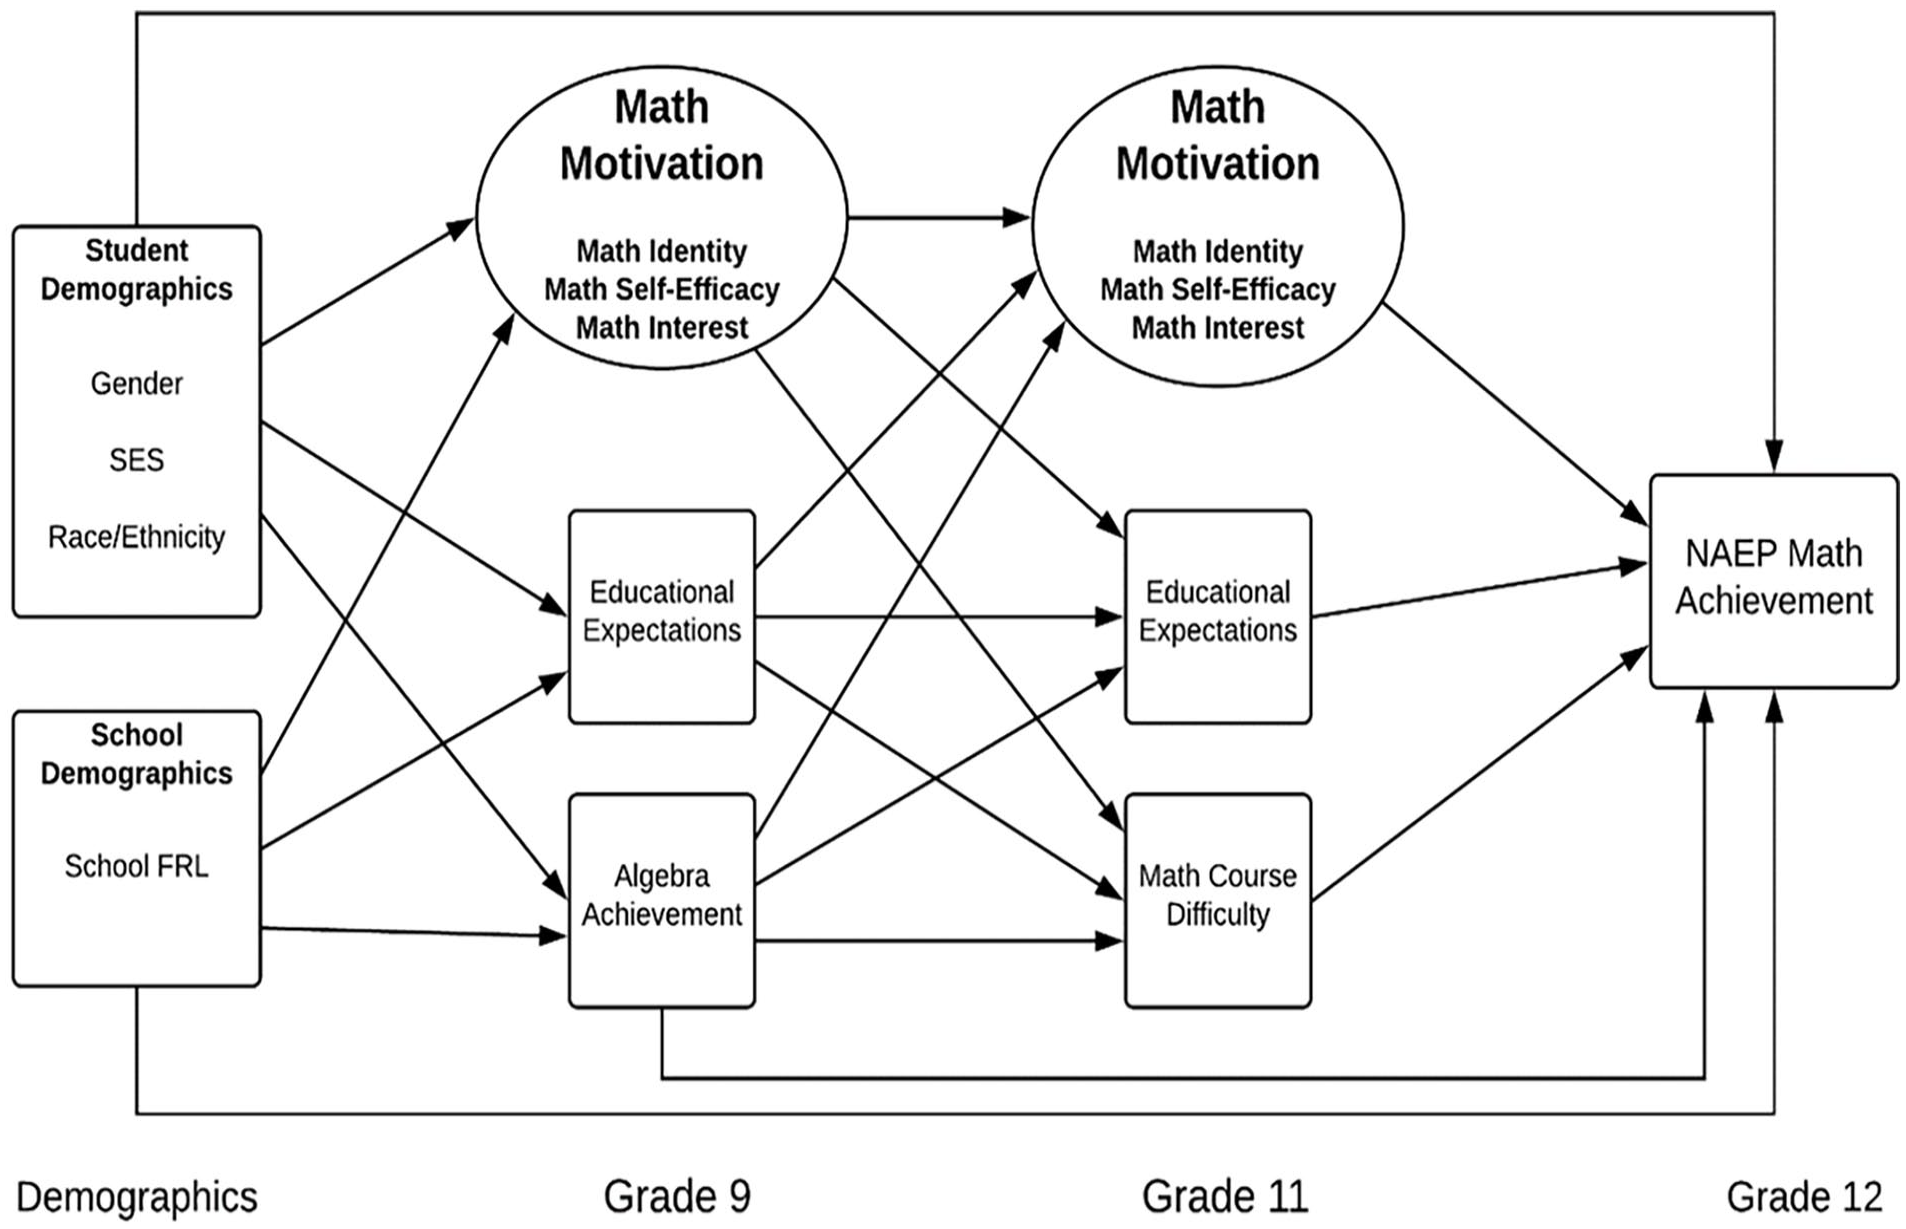
Conceptual Model with Hypothesized Relationships between Mathematics Motivation and Grade 12 NAEP Mathematics Performance
The study results indicate that, when accounting for other variables in the model, (a) mathematics interest at both grades 9 and 11 was unrelated to grade 12 mathematics performance, and (b) while a reciprocal relationship existed between mathematics identity and self-efficacy between grades 9 and 11, only grade 11 mathematics identity was significantly related to grade 12 mathematics performance. Given that the difference in the mathematics performance of males and females is negligible, the first goal of the current study is to determine whether the model results found by Bohrnstedt et al. (2020) apply equally well to both genders. In other words, is there a gender difference in the role of motivation in mathematics performance?
There appears to be limited literature investigating whether the effects of motivational constructs on mathematical performance vary between males and females. The more recent of two studies (Rodríguez et al., 2020) used cross-sectional data from a sample of around 900 students across 13 non-randomly chosen primary schools in Spain. The study identified a somewhat stronger relationship between motivational measures and mathematics performance for boys than for girls (R2 = .19 versus R2 = .10). In contrast, Ganley and Lubienski (2016), using data from the U.S. nationally representative ECLS-K study, examined the longitudinal relationships between mathematics interest, confidence, and performance. Overall, they found that the size of these relationships was similar for boys and girls. In essence, the evidence from the two studies differs in terms of the strength of the relationships between motivational variables and mathematics performance for boys and girls.
Bohrnstedt et al. (2020), similar to other studies, found virtually no mean score difference between males and females in grade 12 mathematics performance (controlling for other variables in the model). However, they did find that females scored significantly lower on the study’s measures of mathematics identity and self-efficacy at both grades 9 and 11. While the model’s coefficients for the mathematics motivational measures may be equally applicable for males and females, potential differences in the average mathematics motivation changes between grades 9 and 11 could still exist. Therefore, a second goal of the current study is to examine mean differences in mathematics motivation for males and females at grades 9 and 11 and determine whether these changes between grades differ for males and females.
The rationale for the first part of the second goal stems from the Bohrnstedt et al. (2020) study, which found a negative relationship between being female and mathematics identity and self-efficacy, but not mathematics interest, at grade 9. The rationale for the second part of the hypothesis follows from the research literature, which finds that students’ mathematics motivation declines as they progress from elementary to secondary school (Gottfried et al., 2001; McQuillan et al., 2023). Using longitudinal data, Gottfried et al. (2001) found substantial declines in students’ motivation for mathematics and science, slight declines for reading, and no change for social studies from middle elementary through the high school years. Furthermore, while girls’ self-efficacy toward mathematics is lower than boys’ (Huang, 2013), research indicates that in the elementary and middle school years, mathematics self-efficacy tends to decline at a slower rate for girls than for boys (A. L. Wigfield & Eccles, 2000; A. Wigfield et al.,1997). This leads to the hypothesis that, by the time they enter high school, the change over time will be the same for both sexes.
In summary, this research study examines two hypotheses:
Hypothesis 1. The results from the conceptual model utilized by Bohrnstedt et al. (2020) will hold equally well for males and females.
Hypothesis 2. While both males and females will score lower on average on all three motivational variables at grade 11 compared to grade 9, females, on average, will score lower than males at both grade levels; however, the change in all three variables between grades 9 and 11 will be the same for males and females.
The Role of Motivation in Mathematics Performance
As mentioned earlier, mathematics motivation in this study comprises three components: mathematics interest, mathematics self-efficacy, and mathematics identity. Due to space limitations, only a brief literature review of each component is presented here. A more extensive review, including relationships among the three components, can be found in Bohrnstedt et al. (2020).
Mathematics Interest
Mathematics interest can be defined as the predisposition a learner has to engage in a specific disciplinary area (e.g., reading, science, mathematics), including the psychological state that accompanies this engagement (Hidi & Renninger, 2006). Within the expectancy-value theoretical framework, mathematics interest is associated with the enjoyment of mathematics, thus aligning closely with intrinsic (as opposed to extrinsic) motivation, as detailed in self-determination theory (Ryan & Deci, 2000; Schiefele, 2001). The underlying assumption is that a greater interest in mathematics increases the likelihood of seeking out and pursuing activities involving mathematics, both conceptually and practically. Research also shows that individuals with a greater interest in mathematics are more likely to enroll in mathematics courses and tend to do better in them than those with a lesser interest (Atwater et al., 1995).
Mathematics Self-Efficacy
We adopted Bandura’s (1994) definition that self-efficacy is a belief about one’s ability to carry out actions that lead to the attainment of a specified goal. In his view, unless people believe they can produce the requisite behaviors needed for success, there is little incentive to act at all (Bandura, 1997). Zimmerman (2000) put it this way: When one faces a task or activity required to meet a goal, one asks whether they have “what it takes” to be successful in carrying out the task or activity. Especially germane to the current study is research by Pajares (1996), Pajares and Kranzler (1995), Pajares and Miller (1994) and X. Wang (2013) that indicates a strong relationship between mathematics self-efficacy and mathematics performance.
Mathematics Identity
While numerous definitions and theoretical perspectives exist on identities (Kaplan et al., 2021), the theoretical approach in this study and Bohrnstedt et al. (2020) draws on the social structural symbolic interactional theoretical perspective developed by Stryker (1968, 1980/2000). In this framework, identities are the definitions of oneself that grow out of the meanings that persons attach to the various roles that they occupy, meanings that are shaped by interactions with significant others (Burke & Stets, 2009, 2023; Stryker & Burke, 2000).
More specifically, our interactions with significant others provide feedback about how others see us and judge the quality of our behaviors. The notion is one of “a looking-glass self,” suggesting that we see in ourselves what others see in us through a process of reflected appraisals, where reflected appraisals represent our perceptions of how others see us. Meanings derived from interactions with significant others serve as a standard by which we judge our behavior in a given role.
Roles that may be played over the lifespan include child, student, adolescent, lover, parent, and grandparent; each can have meanings attached to it that help identify who one is and how one is seen by others at a given point in the lifespan. Other roles can also be a source of identity, including those associated with occupations, such as musician, soldier, electrician, professor, boss, CEO, or board member. Identities are both a function of and a determinant of our interactions with significant others, who are the “natural raters” we engage with while occupying various roles. These natural raters, including parents, teachers, peers, and supervisors, are individuals who, through their positions in the social structure, possess legitimacy in judging our behaviors as role-appropriate and assessing the quality of our role performances.
We can claim identities for ourselves, but as Stone (1962) argues, to be identified requires that significant others use the same words to describe who we are as we claim for ourselves. Since the verification of our identities is critical both to how we see ourselves and how others see us, we seek out interactions and participate in activities that can be used to verify our various identities. Upon incorporating standards associated with the various roles we play (labeled “identity standards” by Burke and Stets [2009, 2023]), we gain the ability to self-verify our identities by comparing our role-related behaviors with these standards. In other words, once we establish a set of identity standards for the various roles we play, we do not always need others to verify our performances—we can use the identity standards to do it ourselves.
Importantly, while the discussion up to this point may suggest that identities are dichotomous, that is not the case. Some identities hold greater importance for us and are more central to how we see ourselves. As a result, some identities are more fully embraced than others; for instance, family identity (e.g., wife) might be seen as more important than one’s job or one’s friends. 3 In this study, when an identity is referred to as though it is an entity, it should be understood that there is a varying degree of strength with which that entity is embraced.
Academic identities have long been understood to be important for understanding students’ persistence and academic success (Marsh, 1990, 1993; Marsh et al., 1988). In recent years, the focus has moved from a general student identity to more content-specific identities, such as “I am a reader” or “I am a science person.”
Research has clearly demonstrated the impact of parental, teacher, and peer perceptions on one’s perceptions of mathematical competence (Bleeker & Jacobs, 2004; Bouchey & Harter, 2005; Cribbs et al., 2015). Additionally, mentors and role models have been shown to be important for the development of a science identity (Merolla et al., 2012; Syed et al., 2011). Participation in STEM-focused student networks, particularly for young women considering careers in STEM, has proven to be significant as well (Estrada et al., 2011; Merolla & Serpe, 2013; Merolla et al., 2012).
In general, the stronger the perceived support from significant others, the greater the strength of an identity. As is true for any identity, the development of a mathematics identity occurs over time and is a reciprocal process between oneself and significant others, resulting in the establishment of identity standards by which we judge the quality and appropriateness of our role-related behaviors. Importantly, as Burke and Stets (2009, 2023) emphasize, it is our perceptions of the responses to our behaviors by significant others that drive our actions. When a discrepancy arises between our perceptions of the responses of significant others to our behavior and our identity standards, we seek out situations in which to behave in ways to reduce or eliminate the discrepancy. That is, there is a strong motivational component associated with identities.
Gender Differences in Mathematics Motivation
Differences in Mathematics Identity
Innovative studies using the Implicit Association Test (IAT) have shown that while men identify equally with the arts and mathematics, women are more likely to identify with the arts (Greenwald & Nosek, 2001; Greenwald et al., 1998). Using both the IAT methodology and explicit measures, Cvencek et al. (2011) demonstrated that (a) the stereotype that “math is for boys” emerges as early as second grade; and (b) in grades 1–5, boys identify more strongly with mathematics than girls. As noted earlier, despite this, by the end of high school, males’ and females’ mathematics performance is virtually identical.
Differences in Mathematics Self-Efficacy
A meta-analysis of gender differences in academic self-efficacy found an overall effect size of .08 favoring males (Huang, 2013). However, differences were observed across subject areas: males demonstrated stronger self-efficacy in mathematics and computers, while females exhibited higher language arts self-efficacy. The study also found that gender differences favoring males in mathematics self-efficacy emerged in late adolescence. Stearns et al. (2020), using interviews with North Carolina college students, also found that women were less likely than men to feel confident about majoring in STEM. Huang’s (2013) and Stearns et al.’s (2020) findings are consistent with those of Bohrnstedt et al. (2020), indicating that first-year high school males scored over a third of a standard deviation higher than females on the study’s measure of mathematics self-efficacy, considering other variables in the model.
Differences in Mathematics Interest
Considerable research has shown that girls show less interest in mathematics than boys as early as primary school and that the gap grows larger from childhood through adolescence (J. S. Eccles & Harold, 1996; J. S. Eccles et al., 1999; Else-Quest et al., 2010; Fredricks & Eccles, 2002; Frenzel et al., 2010; Ganley & Lubienski, 2016; Guo et al., 2015; Jacobs et al., 2002; Preckel et al., 2008). Several studies have shown that females are more interested in either the arts or English, or both, compared to STEM subjects (Bagnoli et al., 2014; Chow & Salmela-Aro, 2014; Nosek et al., 2002). Notably, even females with high mathematical ability express less interest in mathematics careers than do high-ability males (Chow & Salmela-Aro, 2014; Lubinski & Benbow, 2006; Watt & Eccles, 2006). For instance, women in the North Carolina Roots of STEM Success longitudinal study performed as well as men in STEM classes but were less likely to choose a STEM major (Stearns et al., 2020). In contrast, a nationally representative sample studied by Bohrnstedt et al. (2020) failed to observe a statistically significant difference in the expression of interest in mathematics between males and females in grade 9.
Gender Differences on Other Key Variables in the Model
Differences in Educational Expectations
Some earlier studies have suggested that females have lower educational expectations than males (Marjoribanks, 2002; Yowell, 2000). However, an examination of actual college attendance trends over the past 50 years reveals notable changes in the comparison of college attendance between males and females. In 1970, 32% of 18- to 24-year-old males were enrolled in college, compared to 20% of same-age females. By 1988, there was parity between males and females in terms of college attendance, with 30% of both 18- to 24-year-old males and females enrolled. By the fall of 2014, when the HSLS:09 college-going cohort would have been entering their first year, a reversal had occurred, with 43% of 18- to 24-year-old females enrolled, compared to 37% of males in the same age group. 4
That is, over a roughly 45-year period, college attendance for males increased by 15.6%, but for females, it increased by 115%. As will be seen below, the results from the current study show that the educational expectations of females in grade 9 in 2009 were higher than those of males, thus reversing earlier results showing the opposite.
Differences in Mathematics Coursetaking
According to data from the National Center for Education Statistics, the percentage of females taking precalculus in high school in 2009 was slightly higher than that of males (37 vs. 34%), while the percentages for statistics and probability (11%), calculus (16%), and AP/honors calculus (11%) were virtually identical between genders. 5 These results are consistent with those of Bohrnstedt et al. (2020), who reported a negligible and statistically insignificant correlation (.03) between the sex of the respondent and the difficulty of courses taken through the end of grade 11.
Differences in Previous Mathematics Performance
An examination of grade 8 NAEP mathematics scores found a consistent trend beginning with the 2003 assessment: boys consistently scored 1 to 2 points higher than girls, except in 2015, when the gap closed entirely. This finding is consistent with that of Bohrnstedt et al. (2020), who reported that the correlation between algebra performance at grade 9 and the sex of the respondent, as measured in the High School Longitudinal Study of 2009, was virtually zero (r = .01).
Method
Data Source and Sample
The study uses the special overlap sample of about 3,500 students who participated in the High School Longitudinal Study of 2009 (HSLS:09) and took the 2013 grade 12 National Assessment of Educational Progress (NAEP) mathematics assessment. HSLS:09 employed a two-stage design, with a sample of over 900 public and private high schools randomly selected in stage 1 and a sample of around 25 fall-term 9th-graders randomly selected from within these schools in stage 2. 6 After excluding cases with missing data on key variables, the size of the analytic sample was approximately 3,200. Table 1 shows a comparison of the final analytic sample with the NAEP and HSLS samples. The overlap sample exhibits a significantly higher percentage of White students and a significantly lower percentage of Black and Hispanic students than the HSLS and NAEP samples. However, the percentage of females is less than a percentage point higher in the overlap sample than in the NAEP and HSLS populations. Given that the inferences in this study are limited to the sex of the respondents, generalizations to the entire population of males and females entering high school would seem to be warranted.
Comparison of the Final Analytic Sample with the NAEP-HSLS Overlap Sample, the 2013 NAEP Grade 12 Operational Population, and the HSLS Population, by Student Subgroups

Not applicable.
HSLS does not include the National School Lunch Program (NSLP) eligibility in the dataset.
Note: Grade 12 NAEP survey weight was used in the analysis.
Source: U.S. Department of Education, National Center for Education Statistics, High School Longitudinal Study of 2009 (HSLS:09), First Follow-up and 2013 Update Restricted-Use File; 2013 National Assessment of Educational Progress (NAEP), Grade 12 Mathematics Assessment.
In the HSLS base year, which took place in the 2009–10 school year, participating students took an online algebra assessment and survey at school. The first follow-up occurred in spring 2012, when most students were in the 11th grade. The students in the NAEP-HSLS:09 overlap sample, drawn from HSLS:09 in 2013, took the grade 12 NAEP mathematics assessment. Each assessment consisted of a set of booklets of items. Because each student completed only a subset of the booklets, estimating their score required computing a set of plausible values, which were then averaged. Complete information on the imputation procedures used to generate plausible values, along with information about the sample, can be found in Bohrnstedt et al. (2020).
Model Specification
The study used structural equational modeling (Bollen, 1989, 1993) to examine the relationships among mathematics motivation at grades 9 and 11, including educational expectations, mathematics course difficulty, the other contextual variables, and grade 12 mathematics performance. The structural equation modeling incorporated two types of equations. The first type linked the items to the latent, unobserved variables in a measurement model; the second linked the latent variables to each other in a structural model. The variables used in the study, both endogenous and exogenous, based on the hypothesized conceptual framework displayed in Figure 1, are shown in Table 2 below. Details on how each variable was measured can be found in online Appendix A.
Endogenous and Exogenous Variables

Source: U.S. Department of Education, National Center for Education Statistics, High School Longitudinal Study of 2009 (HSLS:09), Base Year, First Follow-up and 2013 Update Restricted-Use File, National Assessment of Educational Progress (NAEP), 2013 Grade 12 Mathematics Assessment.
Measurement Model
In the models estimated in this study, mathematics identity, self-efficacy, and interest (at both grades 9 and 11) were treated as latent unobserved variables measured by three sets of items. For example, mathematics identity was measured by responses to “You see yourself as a mathematics person” and “Others see you as a mathematics person.” All of the items were assumed to be linked to only one of the latent variables by a measurement equation. Nine such equations were estimated at grade 9 and another nine at grade 11. (See online Appendix B for a more technical discussion of the measurement models used in the study.) The items assessing the three motivational constructs were factor analyzed using both exploratory and confirmatory factor analyses. Since the analyses in this study examine mathematics motivational measures over time and by the sex of the respondent, a set of analyses was conducted to assess the extent to which the evidence supported the hypothesis that the measurement of the latent constructs was invariant both over time and by sex of the respondent. The results supported this assumption. They can be found in online Appendix B along with results from the confirmatory factor analyses, the various tests for invariance, and a discussion of the validity evidence for each of the motivational measures used as well as estimates of their reliability.
Structural Model
Eleven structural equations were estimated, one for each of the endogenous variables in the model. As an example, the first equation examined the relationship of grade 12 mathematics performance to grade 11 mathematics identity, grade 11 educational expectations, grade 11 mathematics course difficulty, and grade 9 algebra performance, while controlling for the six student and school background (exogenous) variables.

where
The 10 other equations, which can be found in online Appendix C, are also estimated; all reflect the relationships shown for the other 10 endogenous variables shown in Figure 1. The disturbance terms for the endogenous variables measured at grade 9 were allowed to be correlated as were those measured at grade 11.
Estimation
Estimation was done using Mplus (Muthén et al., 2017), Version 8.1. Mplus yields full information maximum likelihood estimates for both the structural and measurement parameters in the model. The program allows one to estimate not only free parameters but to fix parameters to a given value (often zero) and to constrain parameters to be equal. This latter feature is important in assessing the first hypothesis—i.e., that the conceptual model holds equally well for both males and females. To evaluate Hypothesis 1, our analysis strategy mirrored that used by Bohrnstedt et al. (2020) for a parsimonious final model. This process began by constraining all parameters to be equal for both males and females in the baseline model. An iterative procedure was then followed to free up parameters one by one, including the covariances among disturbance terms, and the Satorra-Bentler chi-square difference was calculated (Satorra & Bentler, 2010) at each step. If the chi-square difference was statistically significant at the .01 level, the parameter was freed in the final model. We also used a set of statistics Mplus generates for evaluating the goodness of fit of the data to the final model, including a chi-square test (χ2), the Root Mean Square Error of Approximation (RMSEA), the Comparative Fit Index (CFI) (Bentler, 1990), and the Tucker-Lewis index (TLI) (Tucker & Lewis, 1973). In evaluating goodness of fit, an RMSEA of .05 or less is considered good and an RMSEA of .01 or less excellent (MacCallum et al., 1996). Fits of .90 or greater are considered good for the TLI and .95 for the CFI (Hu & Bentler, 1999). In addition to statistical significance, the substantive significance of the parameters in the final model was evaluated following McShane et al. (2019). Rather than adhering strictly to p-value thresholds, the sizes of the estimated parameters and their consistency with previous findings, including those of Bohrnstedt et al. (2020), were considered. To balance Type I and Type II errors, parameters with an absolute value of .10 or larger that were statistically significant were considered practically significant, while those with an absolute value smaller than .10 and statistically significant were considered substantively significant.
Results
The results are presented in two parts: first, an examination of the descriptive statistics, followed by the results testing Hypotheses 1 and 2.
Descriptive Statistics
The means, standard deviations, and correlations for both the exogenous and endogenous variables are shown in Table 3. There are three things to note. First, when looking at the means, note that the average NAEP scores for males and females are very similar; females scored only one point lower than males (156 vs. 157). Second, females had significantly, but only slightly, higher educational expectations than males at both grades 9 and 11. Third, there were virtually no differences between the means for males and females on the grade 9 algebra measure, the difficulty of mathematics courses taken through grade 11 measure, and the sociodemographic measures. The means of the latent variables (mathematics identity, mathematics self-efficacy, and mathematics interest) are examined and discussed in the discussion of the results for Hypothesis 2 below.
Weighted Means, Standard Deviations, and Correlations for the Structural Model (N = 3,200)
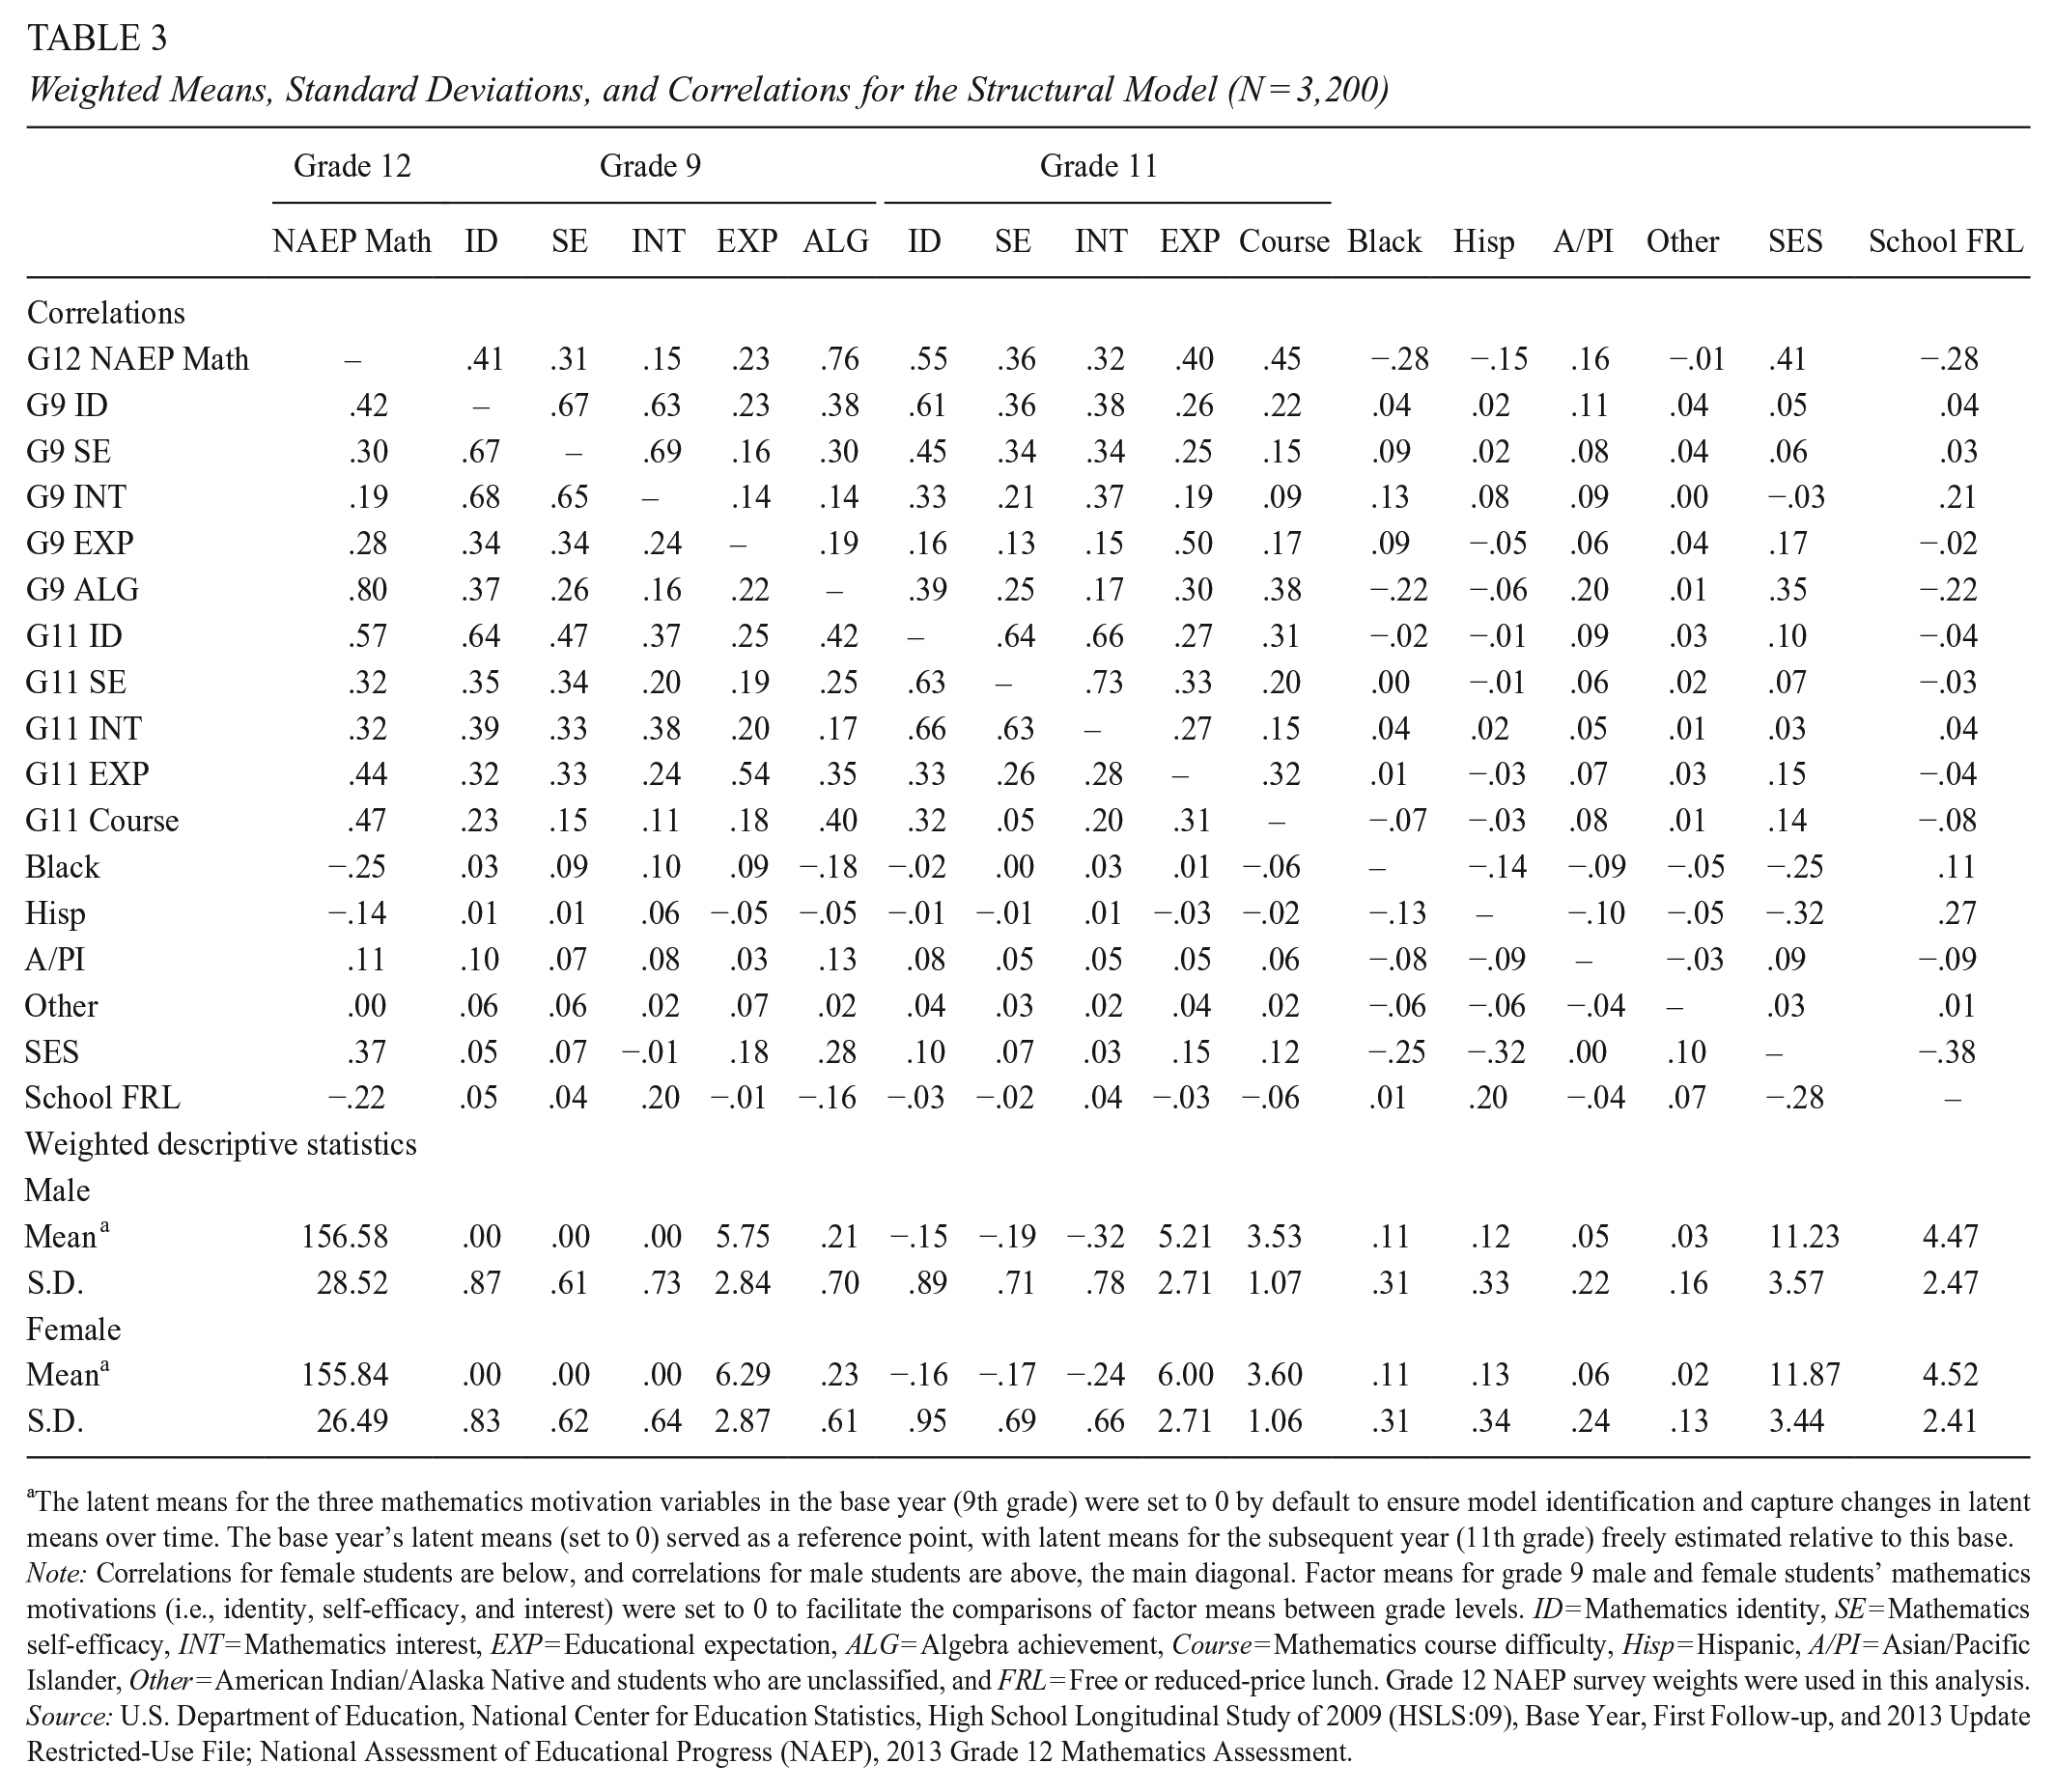
aThe latent means for the three mathematics motivation variables in the base year (9th grade) were set to 0 by default to ensure model identification and capture changes in latent means over time. The base year’s latent means (set to 0) served as a reference point, with latent means for the subsequent year (11th grade) freely estimated relative to this base.
Note: Correlations for female students are below, and correlations for male students are above, the main diagonal. Factor means for grade 9 male and female students’ mathematics motivations (i.e., identity, self-efficacy, and interest) were set to 0 to facilitate the comparisons of factor means between grade levels. ID = Mathematics identity, SE = Mathematics self-efficacy, INT = Mathematics interest, EXP = Educational expectation, ALG = Algebra achievement, Course = Mathematics course difficulty, Hisp = Hispanic, A/PI = Asian/Pacific Islander, Other = American Indian/Alaska Native and students who are unclassified, and FRL = Free or reduced-price lunch. Grade 12 NAEP survey weights were used in this analysis.
Source: U.S. Department of Education, National Center for Education Statistics, High School Longitudinal Study of 2009 (HSLS:09), Base Year, First Follow-up, and 2013 Update Restricted-Use File; National Assessment of Educational Progress (NAEP), 2013 Grade 12 Mathematics Assessment.
Results Testing Hypotheses 1 and 2
Overall Fit for the Combined Structural and Measurement Model

Source: U.S. Department of Education, National Center for Education Statistics, High School Longitudinal Study of 2009 (HSLS:09), Base Year, First Follow-up, and 2013 Update Restricted-Use File; National Assessment of Educational Progress (NAEP), 2013 Grade 12 Mathematics Assessment.
The results for the structural model shown in Figure 2 below closely mirror those reported by Bohrnstedt et al. (2020). The figure shows only the standardized results for females since the coefficients for males and females were constrained to be equal in estimating the model. 7 Furthermore, only those estimates seen as practically important are shown (i.e., with an absolute value of .10 or greater). The reader wanting to examine both the standardized and unstandardized results will find them in online Appendix D. Interpreting the results below, keep in mind that a given estimate refers to both males and females.

Structural Model with Standardized Coefficient Estimates
Direct Effects on Grade 12 Mathematics Performance
Examining the motivational measures independently of the other variables in the model, grade 11 mathematics identity had a direct effect of β = .28 on NAEP grade 12 mathematics performance. 8 Grade 11 educational expectations also had a direct effect on grade 12 mathematics performance with β = .13. In contrast, neither grade 11 mathematics self-efficacy nor interest demonstrated a direct association with grade 12 mathematics performance. Among the other endogenous variables, as predicted from Figure 1 and Bohrnstedt et al. (2020), grade 9 algebra performance—a proxy for mathematics performance prior to high school—unsurprisingly had the strongest direct association with grade 12 mathematics performance with β = .50. Additionally, the difficulty of mathematics courses taken through grade 11 was significantly related to grade 12 mathematics performance, although with a relatively weak association at β = .11.
Among the exogenous variables in the model, the variables representing being Black or Hispanic (compared to being White) were both substantially negatively related to grade 12 mathematics performance (Black, β = −.45; Hispanic, β = −.25).
Using the criteria established in the Methods section, none of the other variables were judged to be practically significant.
Relationships Among the Motivational Variables Between Grades 9 and 11
Bohrnstedt et al. (2020) found that grade 11 self-efficacy did not have a direct relationship with grade 12 mathematics performance; rather, it exhibited an indirect relationship through grade 11 mathematics identity. Furthermore, they found a reciprocal relationship between mathematics identity and self-efficacy. As depicted in Figure 2, not only was grade 9 mathematics identity positively related to grade 11 self-efficacy (β = .25), but grade 9 self-efficacy also showed a positive relationship with grade 11 identity, although the latter relationship was relatively weak (β = .11). Thus, this study provides further evidence supporting the over-time reciprocal relationship between mathematics identity and mathematics self-efficacy.
Note also that grade 9 mathematics identity predicted grade 11 mathematics interest (β = .20), a relationship that, while not strong, was almost equivalent in strength to that of grade 9 mathematics interest in predicting grade 11 mathematics interest (β = .21). However, mathematics interest played no role, either direct or indirect, in its association with grade 12 mathematics performance at either grade 9 or grade 11.
Based on the model posited in Figure 1 and the results reported by Bohrnstedt et al. (2020), one might expect that mathematics identity, self-efficacy, and interest at grade 9 would predict grade 11 educational expectations for both males and females. However, none of the estimates associated with these variables was substantively significant in their prediction of grade 11 educational expectations.
Other Relationships of Interest
Grade 9 algebra performance predicted grade 11 educational expectations (β = .18) and, unsurprisingly, the difficulty of mathematics courses taken through grade 11 (β = .32). Unexpectedly, there was a weak, yet practically significant relationship between grade 9 educational expectations and the difficulty of mathematics courses taken (β = .10). Also contrary to expectations, neither mathematics identity, self-efficacy, nor interest was significantly related to the difficulty of the mathematics courses taken, taking the other variables in the model into account.
The Role of Exogenous Variables
When considering the relationships of the grade 9 endogenous variables with the exogenous variables, perhaps not surprisingly, socioeconomic status (SES) was positively associated with all five endogenous variables. The higher the SES, the more likely one was to have a mathematics identity (β = .10), feel efficacious about doing mathematics (β = .12), and be interested in doing mathematics (β = .10). Also, the higher the SES, the higher one’s educational expectations (β = .23) and the better the score on one’s grade 9 algebra performance (β = .28). Interestingly, Black students (compared to White students) were more likely to feel self-efficacious about doing mathematics (β = .42), express an interest in mathematics (β = .48), and have higher educational expectations (β = .49), but they scored substantially lower on the grade 9 algebra test (β = −.37). All the relationships were in the same direction for Asian students (compared to White students), but Asian students scored substantially higher on the grade 9 algebra test (β = .67) than Black students. However, none of these relationships were observed for Hispanic students (compared with White students).
In summary, these relationships duplicate in sign and size those reported in Bohrnstedt et al. (2020). Most importantly, they hold equally well for males and females, providing solid support for Hypothesis 1.
Hypothesis 2 can be broken into three sections. The first posits that both males and females will score lower on the three latent motivational variables (mathematics identity, self-efficacy, and interest) at grade 11 than at grade 9. The second posits that females will score lower on average on the three motivational variables than males at both grades 9 and 11. And the third posits that the change between grades 9 and 11 will be the same for males and females. All three sub-hypotheses were evaluated by examining the latent means at grades 9 and 11.
Since the latent variables do not have a natural metric, one needed to be imposed. To evaluate the first sub-hypothesis, the latent means for all three variables for both males and females were set to zero at grade 9 and were then treated as free parameters to be estimated at grade 11. Table 5 shows that the changes for both males and females were negative for all three motivational variables, indicating that, as predicted, mathematics motivation decreased between grades 9 and 11 for both males and females. Thus, the first sub-hypothesis was supported. Furthermore, the change was smallest for mathematics identity and largest for mathematics interest. In terms of stability over time, mathematics identity was the most stable of the three latent constructs and mathematics interest the least stable, with mathematics self-efficacy in the middle.
Factor Means Comparisons for Mathematics Motivation Latent Variables, by Grade Level (N = 3,200)

Note: Factor means for grade 9 male and female students’ mathematics motivation (i.e., identity, self-efficacy, and interest) were set to 0 to facilitate the comparison of factors means between grade levels. N/A means “not applicable,” given that the mean was fixed to zero.
Source: U.S. Department of Education, National Center for Education Statistics, High School Longitudinal Study of 2009 (HSLS:09), Base Year, First Follow-up, and 2013 Update Restricted-Use File; National Assessment of Educational Progress (NAEP), 2013 Grade 12 Mathematics Assessment.
To evaluate the second sub-hypothesis, the latent means for males were set to zero for both the grade 9 and grade 11 data, as shown in Table 6. The means for females were then treated as free parameters to be estimated and compared to the fixed values for males. As can be seen, the means for females were lower than for males at both grades for mathematics identity and self-efficacy but not for mathematics interest, although the mean difference for mathematics interest was in the predicted direction. That is, the second sub-hypothesis, that females will score lower on average on the three motivational variables than males at both grades 9 and 11, was supported for two of the three motivational variables.
Factor Means Comparisons for Mathematics Motivation Latent Variables, by Sex of Respondent (N = 3,200)

Note: Factor means for grade 9 and grade 11 male students’ mathematics motivation (i.e., identity, self-efficacy, and interest) were set to 0 to facilitate the comparisons of factor means between males and females. N/A means “not applicable,” given that the mean was fixed to zero.
Source: U.S. Department of Education, National Center for Education Statistics, High School Longitudinal Study of 2009 (HSLS:09), Base Year, First Follow-up, and 2013 Update Restricted-Use File; National Assessment of Educational Progress (NAEP), 2013 Grade 12 Mathematics Assessment.
The third sub-hypothesis—that the change between grade 9 and 11would be the same for males and females—is evaluated in Table 6. The results show there were virtually no differences between the mean changes for males and females in mathematics interest and self-efficacy; however, females showed slightly less change in mathematics interest. 9 Thus, the third sub-hypothesis is also supported.
Discussion
The analyses testing Hypothesis 1 provided strong evidence that the data for both male and female high school students fit the model estimated in Bohrnstedt et al. (2020) equally well.
Identity
For both males and females, the strength of one’s mathematics identity was an important predictor of grade 12 mathematics performance. This finding is consistent with the growing literature that indicates that academic identities are important in academic performance and choices of careers in STEM-related fields, including mathematics (Carlone & Johnson, 2007; Cass et al., 2011; Chemers et al., 2011; Godwin et al., 2013; Hazari et al., 2009; Stets et al., 2017; Syed et al., 2011).
The analyses testing Hypothesis 2 showed that, as hypothesized, females are less likely than males to perceive themselves as having a mathematic identity and feel less efficacious about doing mathematics. Both were found to be true at grades 9 and 11.
Self-Efficacy
Females also felt less efficacious in mathematics compared to males. As the literature shows, this difference begins to manifest by late adolescence (Huang, 2013). In contrast to identity, self-efficacy was not directly associated with grade 12 mathematics performance in this study. Consistent with Bohrnstedt et al. (2020), self-efficacy had a significant, albeit not strong, indirect relationship with grade 12 mathematics performance. Ervin and Stryker (2001) suggest that, theoretically, identity and self-efficacy should work reciprocally. Feeling efficacious about one’s ability to do mathematics should reinforce one’s mathematics identity, which, in turn, should reinforce one’s feeling efficacious about doing mathematics. However, the research literature presents mixed findings on the impact of role-related self-efficacy on STEM outcomes.
In support of the hypothesized relationships, Brenner et al. (2017), using data from a longitudinal study of underrepresented undergraduate college students in STEM majors, found that science self-efficacy at wave 1 was positively related to identity prominence (the affective component of identity) at wave 2, which, in turn, was positively related to identity salience (the probability of the identity being enacted) at wave 3 and to science self-efficacy at wave 4. The latter relationship, while statistically significant, was weak. However, Brenner et al. (2017) did not relate their measures of identity and self-efficacy to role-related behaviors.
Cross-sectional studies by Cass et al. (2011) and Hazari et al. (2009) align with Bohrnstedt et al. (2020) and the current study, indicating that self-efficacy effects on identity-related behaviors are indirect. Thus, while evidence from this study and others supports a reciprocal relationship between STEM-related self-efficacy and STEM identity, the relationship is not strong and does not appear to differ by gender.
Social role theory (Eagly & Wood, 2012) may offer the best explanation for why, despite performing as well as males in mathematics, females feel less efficacious and are less likely to identify as proficient in it.
One of social role theory’s core tenets is that gender stereotypes arise from observing differences in who occupies various social roles, including occupational ones. Men’s higher representation in STEM occupations may foster the stereotype that they are better suited to these roles. Since STEM occupations typically demand more mathematics skills, it can reinforce the notion that women are less proficient in math. These stereotypes, learned through observation, are often reinforced by parents, teachers, and the media—both explicitly and implicitly—ultimately becoming ingrained in the culture. The good news is that this theoretical perspective also predicts that, over time, as women assume more positions in STEM, the stereotype should change, and there is evidence supporting this notion. 10
Eagly et al. (2020) discovered shifts in gender stereotypes by comparing the 1940s with recent times, using a meta-analysis of 16 nationally representative public opinion polls conducted over time. These changes are attributed to the dramatic shifts in women’s employment and educational attainment during and after WWII. The key implication is that as more females develop strong mathematics identities over time, an increase in their efficacy in mathematics is expected. Continuing support is crucial for female students to cultivate self-efficacy and build confidence in excelling in math and science.
Interest
Despite existing research suggesting that females tend to show less interest in mathematics than males, with this gap widening from childhood through adolescence (J. Eccles et al., 1993; J. S. Eccles et al., 1999; Jacobs et al., 2002), the current study surprisingly found no gender differences in mathematics interest at either grade 9 or grade 11. However, interest in mathematics exhibited neither direct nor indirect effects on either males’ or females’ grade 12 mathematics performance. Although this latter finding may seem counterintuitive, having an interest does not require a skill related to an identity. One can be interested in science without having the skills to be a scientist. Instead, interest might be related to extrinsic factors, such as whether one was taken to a science museum by their parents or has a friend with an interest in science.
In summary, interest in mathematics appears to play no role in mathematics achievement. In contrast, feeling self-efficacious about one’s ability to engage with mathematics does appear to be important. Feeling efficacious to do mathematics assumes the will and the skill to pursue problems in mathematics. One believes that she or he can do the tasks required to achieve in mathematics. There is a popular saying in Asian culture: “Master mathematics, physics, and chemistry and one can fearlessly conquer the world.”
Finally, role identities are central in defining who one is. Having a role identity related to mathematics may or may not imply an interest in mathematics, but it certainly assumes that one feels efficacious about doing mathematics. Both McCall and Simmons (1978) and Stryker (1968) argue that a hierarchy of identities defines the self. The more prominent the identity, the more it defines who one is, and the more likely it is to be invoked in our behaviors. If we see ourselves as a mathematics person and others do as well, it becomes a major motivator in seeking out opportunities to do mathematics, including coursetaking in high school and college, and in the choice of a major in college.
Educational Expectations
Bohrnstedt et al. (2020) found no differences in the educational expectations of males and females at grade 9, when controlling for other variables. In the current study, however, females had higher educational expectations than males at both grades 9 and 11 (see Table 2). That is, for the current generation, females’ educational expectations better mirror their actual educational experience vis-à-vis males.
As Figure 2 shows, educational expectations were directly related to grade 12 mathematics performance for both males and females. According to Bohrnstedt et al. (2020), educational expectations may be a general motivator, while identity and self-efficacy are more specific role-related motivators. If true, one would predict that educational expectations would be related to enrolling in courses perceived as necessary for the desired educational outcome. That is, educational expectations translate into coursetaking, which is seen as instrumental in achieving one’s educational achievement goals (e.g., getting a master’s degree). In contrast, role-related identity (and self-efficacy) motivate in a narrower way; in this case, toward mathematics achievement.
Other Results
Briefly examining other variables in the model, it’s not surprising that previous mathematical performance—measured by performance on an algebra test given as part of HSLS:09 in 2009 when students were in the 9th grade—was the most potent predictor of mathematics performance in grade 12. This aligns with existing research, which emphasizes the significant role of early mathematics performance in later achievement (Gamoran & Hannigan, 2000; Siegler et al., 2012). While there is evidence suggesting that more challenging mathematics courses lead to better achievement (J. Wang & Goldschmidt, 1999), in this study the net standardized coefficient for this variable was small for both males and females (.11).
A Puzzle
While one might reasonably assume that the male-female differences discussed above would translate into differences in grade 12 mathematics performance, this was not the case. As Table 2 shows, the mean performance of females on the grade 12 NAEP mathematics assessment was only about one point lower than that of males on the NAEP 300-point scale—insignificant from a practical perspective. How can females, scoring significantly lower on mathematical identity than males on average, perform almost identically on the grade 12 mathematics assessment when sharing a common coefficient in the structural equation model? If the intercept for females was larger than that of males for Equation 1, it could explain this. However, an examination of the intercepts (not tabled) indicated that wasn’t the case. The intercept of males was slightly higher than that of females, ruling out differences in intercepts as an explanation.
Another possibility lies in the difference in educational expectations of females compared to males. As Figure 2 shows, educational expectations were directly related to grade 12 mathematics achievement for both males and females. Table 3 indicates that females scored about .30 standard deviations higher on the measure of grade 11 educational expectations than males.
No other variable in the model is both statistically significant in its relationship with grade 12 mathematics performance and has a mean significantly greater for females than males. The significant relationship between educational expectations and grade 12 mathematics performance, along with females’ higher expectations, provides a partial resolution to the issue. But there also may be other explanations, such as an omitted variable or unexplored interaction effects.
In Summary
The results from the study suggest that motivation plays a similar role for males and females in grade 12 mathematics performance. And even though, on average, females’ mathematics identities and their sense of efficacy about doing mathematics are lower than males’, they perform almost identically to males on a nationally recognized measure of 12th-grade performance in NAEP. As noted above, one possible explanation is that females have higher educational expectations than males, which are also significantly related to grade 12 mathematics performance. However, more research is needed to further understand these relationships.
Study Limitations
While the sample and the longitudinal design are important strengths of the study, caution is needed in drawing causal conclusions due to the absence of an experimental design. While the study’s target population was U.S. 12th-graders, the generalizability to U.S. 12th-graders from 2019 onward is unknown, given the substantial shock to the educational system caused by the COVID-19 pandemic. Additionally, while the term “gender” is used in the study, respondents were only given the choice of being male or female, preluding more nuanced analyses of the role of gender and motivation in mathematics performance. Finally, generalizing the study’s conclusions to males and females from other countries and cultures should be approached with caution, as the applicability of such generalizations remains unknown.
Supplemental Material
sj-docx-1-ero-10.1177_23328584241298272 – Supplemental material for Mathematics Motivation and Mathematics Performance: Does Gender Play a Role?
Supplemental material, sj-docx-1-ero-10.1177_23328584241298272 for Mathematics Motivation and Mathematics Performance: Does Gender Play a Role? by George W. Bohrnstedt, Jizhi Zhang, Mengyi Li, Sakiko Ikoma, Bitnara Jasmine Park and Markus Broer in AERA Open
Supplemental Material
sj-docx-2-ero-10.1177_23328584241298272 – Supplemental material for Mathematics Motivation and Mathematics Performance: Does Gender Play a Role?
Supplemental material, sj-docx-2-ero-10.1177_23328584241298272 for Mathematics Motivation and Mathematics Performance: Does Gender Play a Role? by George W. Bohrnstedt, Jizhi Zhang, Mengyi Li, Sakiko Ikoma, Bitnara Jasmine Park and Markus Broer in AERA Open
Supplemental Material
sj-docx-3-ero-10.1177_23328584241298272 – Supplemental material for Mathematics Motivation and Mathematics Performance: Does Gender Play a Role?
Supplemental material, sj-docx-3-ero-10.1177_23328584241298272 for Mathematics Motivation and Mathematics Performance: Does Gender Play a Role? by George W. Bohrnstedt, Jizhi Zhang, Mengyi Li, Sakiko Ikoma, Bitnara Jasmine Park and Markus Broer in AERA Open
Supplemental Material
sj-docx-4-ero-10.1177_23328584241298272 – Supplemental material for Mathematics Motivation and Mathematics Performance: Does Gender Play a Role?
Supplemental material, sj-docx-4-ero-10.1177_23328584241298272 for Mathematics Motivation and Mathematics Performance: Does Gender Play a Role? by George W. Bohrnstedt, Jizhi Zhang, Mengyi Li, Sakiko Ikoma, Bitnara Jasmine Park and Markus Broer in AERA Open
Footnotes
Notes
Authors
GEORGE W. BOHRNSTEDT is a senior vice president and institute fellow at the American Institutes for Research. His research interests include understanding the role that motivational factors play in secondary and post-secondary outcomes, the role of AP coursetaking on STEM outcomes, and issues related to the maintaining the validity and reliability of the National Assessment of Educational Progress (NAEP).
JIZHI ZHANG is a principal researcher at American Institutes for Research. Her research focuses on using national large scale assessment data to understand how students’ psychosocial factors including motivation and identity are associated with their academic performance and achievement gaps.
MENGYI LI is a senior researcher at Meta Platforms, Inc. She has expertise in school-based research, child literacy development, and conducting large-scale surveys.
SAKIKO IKOMA is a senior researcher at American Institutes for Research (AIR). Her area of expertise is the sociology of education, especially regarding professionalization of teaching, school climate, professional learning communities (PLCs), teacher quality, academic resilience, and credentialism and meritocracy.
BITNARA JASMINE PARK is a senior researcher at the American Institutes for Research. Her research focuses on generating valid and reliable empirical evidence. Her research leverages large-scale national and international data to inform and shape educational policy and practice. She brings a unique expertise to her work, focusing on understanding students' academic development through sophisticated statistical modeling techniques.
MARKUS BROER is a managing researcher at the American Institutes for Research where he oversees and contributes to research related to the National Assessment of Educational Progress. Major research interests include validity research and studying inequality in educational outcomes.
References
Supplementary Material
Please find the following supplemental material available below.
For Open Access articles published under a Creative Commons License, all supplemental material carries the same license as the article it is associated with.
For non-Open Access articles published, all supplemental material carries a non-exclusive license, and permission requests for re-use of supplemental material or any part of supplemental material shall be sent directly to the copyright owner as specified in the copyright notice associated with the article.