
Abstract
Pandemic-era disruptions to schooling resulted in academic setbacks for many students. To help students catch up, school districts nationwide are implementing a range of academic recovery interventions. In this paper, we use multiple data sources to evaluate the impact and implementation of academic recovery interventions in four school districts during the 2021-2022 school year. Our estimates suggest the interventions failed to reach the expected number of students and had little detectable impact on students’ test scores. Interviews with district officials highlight a host of challenges districts faced during the 2021-2022 school year. Considering the overall scale of pandemic learning loss, our results raise urgent questions about the adequacy of academic recovery efforts relative to students’ needs. The results also have implications for how districts might respond to disrupted learning in the future (e.g. in the wake of natural disasters).
Keywords
Pandemic-era disruptions to schooling have resulted in academic setbacks for many students in the US. The pandemic’s negative impact on learning is reflected in a range of assessments, from the National Assessment of Educational Progress (NAEP) (U.S. Department of Education, 2022a; 2020b) to NWEA’s MAP Growth tests (Kuhfeld & Lewis, 2022; Lewis & Kuhfeld, 2023) and Curriculum Associates’ i-Ready assessments (Curriculum Associates, 2020). Besides generally harming academic progress, pandemic disruptions have worsened prepandemic inequities by disproportionately impacting students with lower test scores and students from historically marginalized groups (Dorn et al., 2021; Education Policy Innovation Collaborative [EPIC], 2021; Lewis et al., 2021). 1
School districts nationwide have responded with a range of interventions to help students catch up academically, aided by $190 billion from the American Rescue Plan’s Elementary and Secondary School Emergency Relief (ESSER) fund. Popular interventions include teaching students in small groups, offering one-on-one tutoring, adding classes before and after school, and adding instructional minutes to the school day (Diliberti & Schwartz, 2022). The stakes surrounding districts’ academic recovery efforts are high. Hanushek (2023), for example, estimates that students who fell behind during the pandemic could see their lifetime earnings fall by 2–9 percent, and states could see their GDPs decrease by 3.5 percent, on average. Using changes in earnings in states with prior increases on the NAEP, Doty et al. (2022) estimate smaller but still sizable impacts on earnings of 1.6 percent. Beneath these averages, the pandemic’s disparate impact raises urgent concerns about equity and earnings inequality. As the U.S. Department of Education’s Office of Civil Rights noted in a 2021 report, students “who went into the pandemic with the fewest opportunities are at risk of leaving with even less” (U.S. Department of Education, 2021, p. 51).
In this paper, we use multiple data sources to assess academic recovery efforts in four school districts. The districts are part of an ongoing collaboration between districts and researchers at the American Institutes for Research, Harvard University, and NWEA. Our analysis of participation and achievement test data suggests that the districts’ interventions during the 2021–2022 school year failed to reach the intended number of students, and few had statistically or practically significant effects on student math and reading test scores through spring 2022. Interviews with district leaders in three of the four districts (with interventions we assess) highlight a host of implementation challenges districts faced during the 2021–2022 school year, including challenges reaching target populations, staffing interventions, scheduling interventions, accommodating existing policies, and building adequate central office capacity.
Taken together, these results are important not only for districts’ near-term recovery efforts but also for how districts can respond to future recovery efforts coming out of periods of disrupted learning (e.g. natural disasters) (Opper et al., 2023). Indeed, we estimate that even if programs had yielded the same large effects associated with high-dosage tutoring programs in the prepandemic literature (Nickow et al., 2024), the planned scale (i.e., participation rate and dosage) of the four districts’ recovery interventions for the 2021–2022 school year would not have been enough to address the full scale of their students’ academic recovery needs. If K–12 systems are not able to improve and expand their efforts to help students catch up, pandemic losses could have long-term implications for equity and opportunity in the US.
Background
COVID-19’s negative impact on academic achievement in K–12 schools has been well documented. Two years after the pandemic upended schools nationwide, results from the NAEP’s 2022 long-term trend assessments marked the nation’s largest drop in reading scores since 1990, and the first ever drop in mathematics scores (U.S. Department of Education, 2022a); these results were soon followed by historic drops in the main NAEP assessments in reading and mathematics (U.S. Department of Education, 2022b). To help put the losses in perspective, Fahle et al. (2023) estimate the magnitude of the average decline is roughly equivalent to half a grade level in math and almost a third of a grade level in reading.2,3 But the pandemic’s effects were not uniform. Across assessments and studies, the academic losses have generally been worse in math than reading, worse for students who spent more of the 2020–2021 school year in a remote or hybrid learning environment, and worse for students living in low-income households and those from historically marginalized groups (Fahle et al., 2023; Goldhaber, Kane, McEachin, & Morton, 2022a; Goldhaber, Goldhaber, Kane, McEachin, Morton, Patterson, et al., 2022b; Lewis et al., 2021; West & Lake, 2021). Among districts that operated remotely for most of the 2020–2021 school year, for example, students in districts serving a high percentage of minority students were the equivalent of .8 grade levels behind their prepandemic scores in math, while students in low minority districts were about .5 grade levels behind (Fahle et al., 2023). To further contextualize the scale of these losses, we note that the magnitude of the test score declines in math was similar to (if not a bit larger than) that of the historically large declines experienced by evacuees of Hurricane Katrina, one of the worst natural disasters in U.S. history (Sacerdote, 2012).
During the 2021–2022 school year—the time-period covered by this study and, for many districts, the first school year “in-person” since the pandemic—the school-year pace of academic growth mostly returned to prepandemic rates (Kuhfeld & Lewis, 2022). But to close the gap between pre- and post-pandemic test scores, the pace of academic growth needs to be faster than “normal.” During the 2022–2023 school year, the pace of learning was not significantly faster; in fact, it may have been slightly slower. As a result, the average student in grades 3–8 needs an extra four to five months of instruction to reach prepandemic achievement levels in math and reading (Lewis & Kuhfeld, 2023). And for historically marginalized students disproportionately impacted by the pandemic, the timeline for academic recovery is even longer. Just to return to prepandemic levels of inequality, students attending high-poverty schools are estimated to need the equivalent of an additional month of schooling relative to students attending low-poverty schools (Isaacs et al., 2023).
District Recovery Efforts
Prepandemic research suggests some of the academic interventions that districts are using to deal with pandemic losses—like tutoring—have the potential to accelerate student learning (Nickow et al., 2024). At the same time, research unsurprisingly suggests that the relationship between an intervention and academic outcomes is mediated by the intervention’s design and implementation (e.g., Lynch et al., 2022; McEachin et al., 2018; Nickow et al., 2024). The promising results on tutoring, for example, rely on “high dose” designs that provide tutoring to small groups multiple times per week during the school day throughout the school year (Harris, 2009; Nickow et al., 2024). Meanwhile, the delivery of supports like tutoring is influenced by broader implementation issues, including the supply of providers, leadership commitment, coordination dynamics, and scheduling logistics (White et al., 2023). Stepping back, a broader literature underscores how front-line implementation is further complicated by the institutional context surrounding schools, as multiple actors—those who deliver interventions but also school leaders, central office staff, superintendents, school boards, and other policymakers—influence which intervention options are considered and the level of resources available to support them (Meier et al., 2004; Sandfort & Moulton, 2015). Despite the growing empirical literature on the negative consequence of the pandemic and the stakes surrounding recovery, little is known beyond a few cases about the extent to which specific district responses are helping students rebound (Barry & Sass, 2022; Cortes et al., 2023).
In the next section, we describe our study methods, including our sample, data, and analytic approach. Then we review our findings on impact and implementation and end with a discussion of the results and their implications.
Methods
Sample
This study investigates academic recovery efforts in a sample of four districts to understand whether and how districts’ responses provided students opportunities to catch up to prepandemic levels of achievement. These large, urban school districts were recruited 4 during the summer of 2021 to be part of the Road to COVID Recovery (R2R) research project. 5 Together, the districts enroll over 340,000 students across three states. As shown in Table 1, the districts serve higher proportions of students of color and students attending high-poverty schools compared to national averages.
Sample Demographics

Note: FRPL=free or reduced priced lunch. The source of the variables is the Common Core of Data (CCD) collected by the National Center for Education Statistics during the 2019–2020 school year.
Data
We use a combination of quantitative and qualitative data to examine academic interventions during the 2021–2022 school year. The study’s main conclusions about academic recovery and impact rely on the quantitative data.
Quantitative Data
The quantitative data for our study come from student achievement test scores on the NWEA Measures of Academic Progress (MAP) Growth math and reading assessments in grades 3–8. The MAP Growth test has several advantages for measuring academic recovery. First, the tests are administered in fall, winter, and spring, allowing us to gauge changes in achievement during the school year. This is important for assessing pandemic recovery interventions because some did not launch until the second half of the year. Second, the tests are computer adaptive (i.e., item difficulty increases or decreases in response to performance). Adaptive tests like MAP Growth are more precise at the high and low ends of the achievement distribution, which is useful for assessing pandemic recovery given the disproportionate effects of the pandemic on students who were already struggling academically (Kingsbury et al., 2014). Third, its items are linked to a common vertical scale that allows us to compare achievement and growth within and across districts.
The study districts also provided detailed student-level eligibility and participation data on their academic recovery interventions 6 that allowed us to examine how many and which students participated, how long they participated (e.g., days) and at what level of intensity (e.g., hours per day), and the impact of the intervention on math and reading achievement. Per our agreements with the districts, we veil their names when reporting our results and are purposely ambiguous when describing interventions to protect their anonymity. Appendix Tables A1 and A2 respectively display the math and reading standardized MAP Growth scores for the sample for each intervention by treatment status and term.
Qualitative Data
To identify the academic interventions for the study, we collected detailed programmatic data from documents and interviews on recovery efforts in each district. 7 Prior to data collection, we defined academic recovery interventions as programs that (a) were new or had expanded since the pandemic, (b) were supported by ESSER funds, and/or (c) provided targeted students with additional learning time beyond what was offered during standard instruction. Over the course of the school year, we interviewed small groups of district staff and program leaders selected by each district for their knowledge of the district’s academic COVID recovery interventions, resulting in a dataset of eight interviews across 22 total staff members. The identified interventions fell into five categories: (a) tutoring programs, (b) small-group push-in and pull-out interventions (c) out-of-school-time programs (d) virtual learning programs, and (e) extended school-year calendars. For the purposes of this study, we collapse tutoring programs and small-group pull-out interventions into one category because of the similarities in the design of the two types of interventions. The interventions implemented in each of the four districts and details on their designs are respectively displayed in Table 2 and Appendix B.
Program Usage Across Sample Districts

Besides interviewing district staff about intervention designs, we conducted additional interviews with district-level program leaders 8 in three of the four districts (the fourth district declined to participate). In these additional interviews, we used the results of the impact analysis as a jumping off point for probing the leaders about implementation factors that might explain the results. These interviews took place in the summer of 2022, lasted between 60 and 90 minutes, and covered a range of implementation issues, including intervention participation, perceptions about what was working and not working, challenges and barriers, and the intervention’s future. Table 3 describes the number of administrators interviewed for each district and the interventions covered in the supplemental interviews.
Supplemental Implementation Interviews and Intervention Programs

Analysis
Impact Analysis
We estimate the impact of each recovery intervention using a value-added framework that controls for observable pretreatment student characteristics, as well as pretreatment test scores. This approach has been used to understand the impact of schools on student outcomes in general (e.g., McEachin et al., 2016), as well as to evaluate the impact of educational programs and policies on students’ achievement (Barry & Sass, 2022).
Value-added methods can provide unbiased estimates of intervention impacts if students’ assignment to treatment is as good as random after conditioning for observable pretreatment characteristics. While “pretreatment” might typically be interpreted as the start of the school year (fall 2021) and earlier, in several of our participating districts we saw evidence that student assignment to treatment was additionally based on measures of academic progress that became available during the school year. Specifically, second semester participation was related to students’ winter 2021–2022 MAP Growth assessment scores—even after controlling for earlier pretreatment test scores (i.e. from fall 2021 and the prior spring 2021). If students struggling academically mid-school year were more likely to be assigned to second semester treatment, then our impact estimates would be negatively biased unless we condition on mid-year test scores in addition to earlier pretreatment characteristics.9,10
To account for this scenario of mid-year treatment assignment, we therefore estimated the following semester-level model:

Here,
The coefficient of interest from this model is
In one district, MAP Growth testing rates were notably low in spring 2022, with roughly 50 percent of tested grades not taking the assessment in that final term. As a result, in that district, we estimated the impact of first semester treatment participation only, using fall 2021 scores as the baseline achievement measure and winter 2022 results as the outcome.
Generally, the analytic sample for each district is limited to those students who had MAP Growth assessment scores from the start and end of the term in which the treatment took place (e.g., fall 2021 and winter 2021–2022 for first semester recovery interventions), as well as from two terms prior (e.g., spring 2021). 14 See Appendix C for more detail on alternative model specifications—including the use of different functional forms and measures of treatment participation—and the placebo tests we conducted to check for signs of selection bias influencing our estimates.
Interview Analysis
Each interview was conducted by a team of two researchers and was audio recorded. After each interview, the researchers completed an interview summary form that captured what they had learned about the intervention in each section of the interview protocol (e.g., reflections about participation, dosage, outcomes, challenges faced, and plans for next year). The team then wrote case memos about each intervention, documenting emerging findings from the summary forms and including quotes from cleaned interview transcripts to establish a chain of evidence to support our claims. These memos focused primarily on how the participants’ account of intervention participation, dosage, content, and delivery might explain the results in the quantitative data. Upon completing the memos, the research team reviewed them to identify common themes across districts and interventions.
These supplemental interviews elaborate on our quantitative findings, but they also have important limitations. Most notably, we interviewed leaders in only three districts that managed to start providing interventions to students during the 2021–2022 school year and to collect data on students’ participation. So, we cannot capture the range of implementation conditions faced by the districts that could not start interventions or collect data on them in the 2021–2022 school year. Even in the districts where we conducted interviews, we did not capture the perspective of front-line implementers (e.g., teachers, tutors, interventionists). Instead, we rely on the perspective of central office leaders. In the end, the weight of the study and its conclusions rests on the quantitative impact analysis, while our qualitative findings help suggest the complexity surrounding the implementation of academic recovery interventions during the pandemic.
Results
Intervention Impacts
Table 4 and Figure 1 show the estimated impacts of treatment on math achievement for each of a series of math interventions in the four districts. We report impact estimates for each of the math interventions used across the four districts as the total effect across all grades served by the intervention and separated into effects for the elementary and middle school grade ranges served by the intervention when possible. In column 1, we report the coefficient on the indicator of whether a student received at least one session of treatment with math achievement as the outcome. For five of the resulting seven district/intervention combinations (across grades), the confidence interval for the impact includes zero, implying that we could not reject the null hypothesis of no impact. The confidence interval for all but one of these combinations also rules out effects larger than .05 standard deviations, a threshold under which school year intervention effect sizes are considered “small” in education research (Kraft, 2020). In the remaining two cases, we estimate marginally significant impacts of participation on math achievement for all grades or a subset of grades: District A Tutoring/Small Group #1 and District B Virtual Learning. Though statistically significant, the magnitude of these estimated effects are also small, ranging from .02 to .04 standard deviations.
Estimated Treatment Effects of Math Interventions
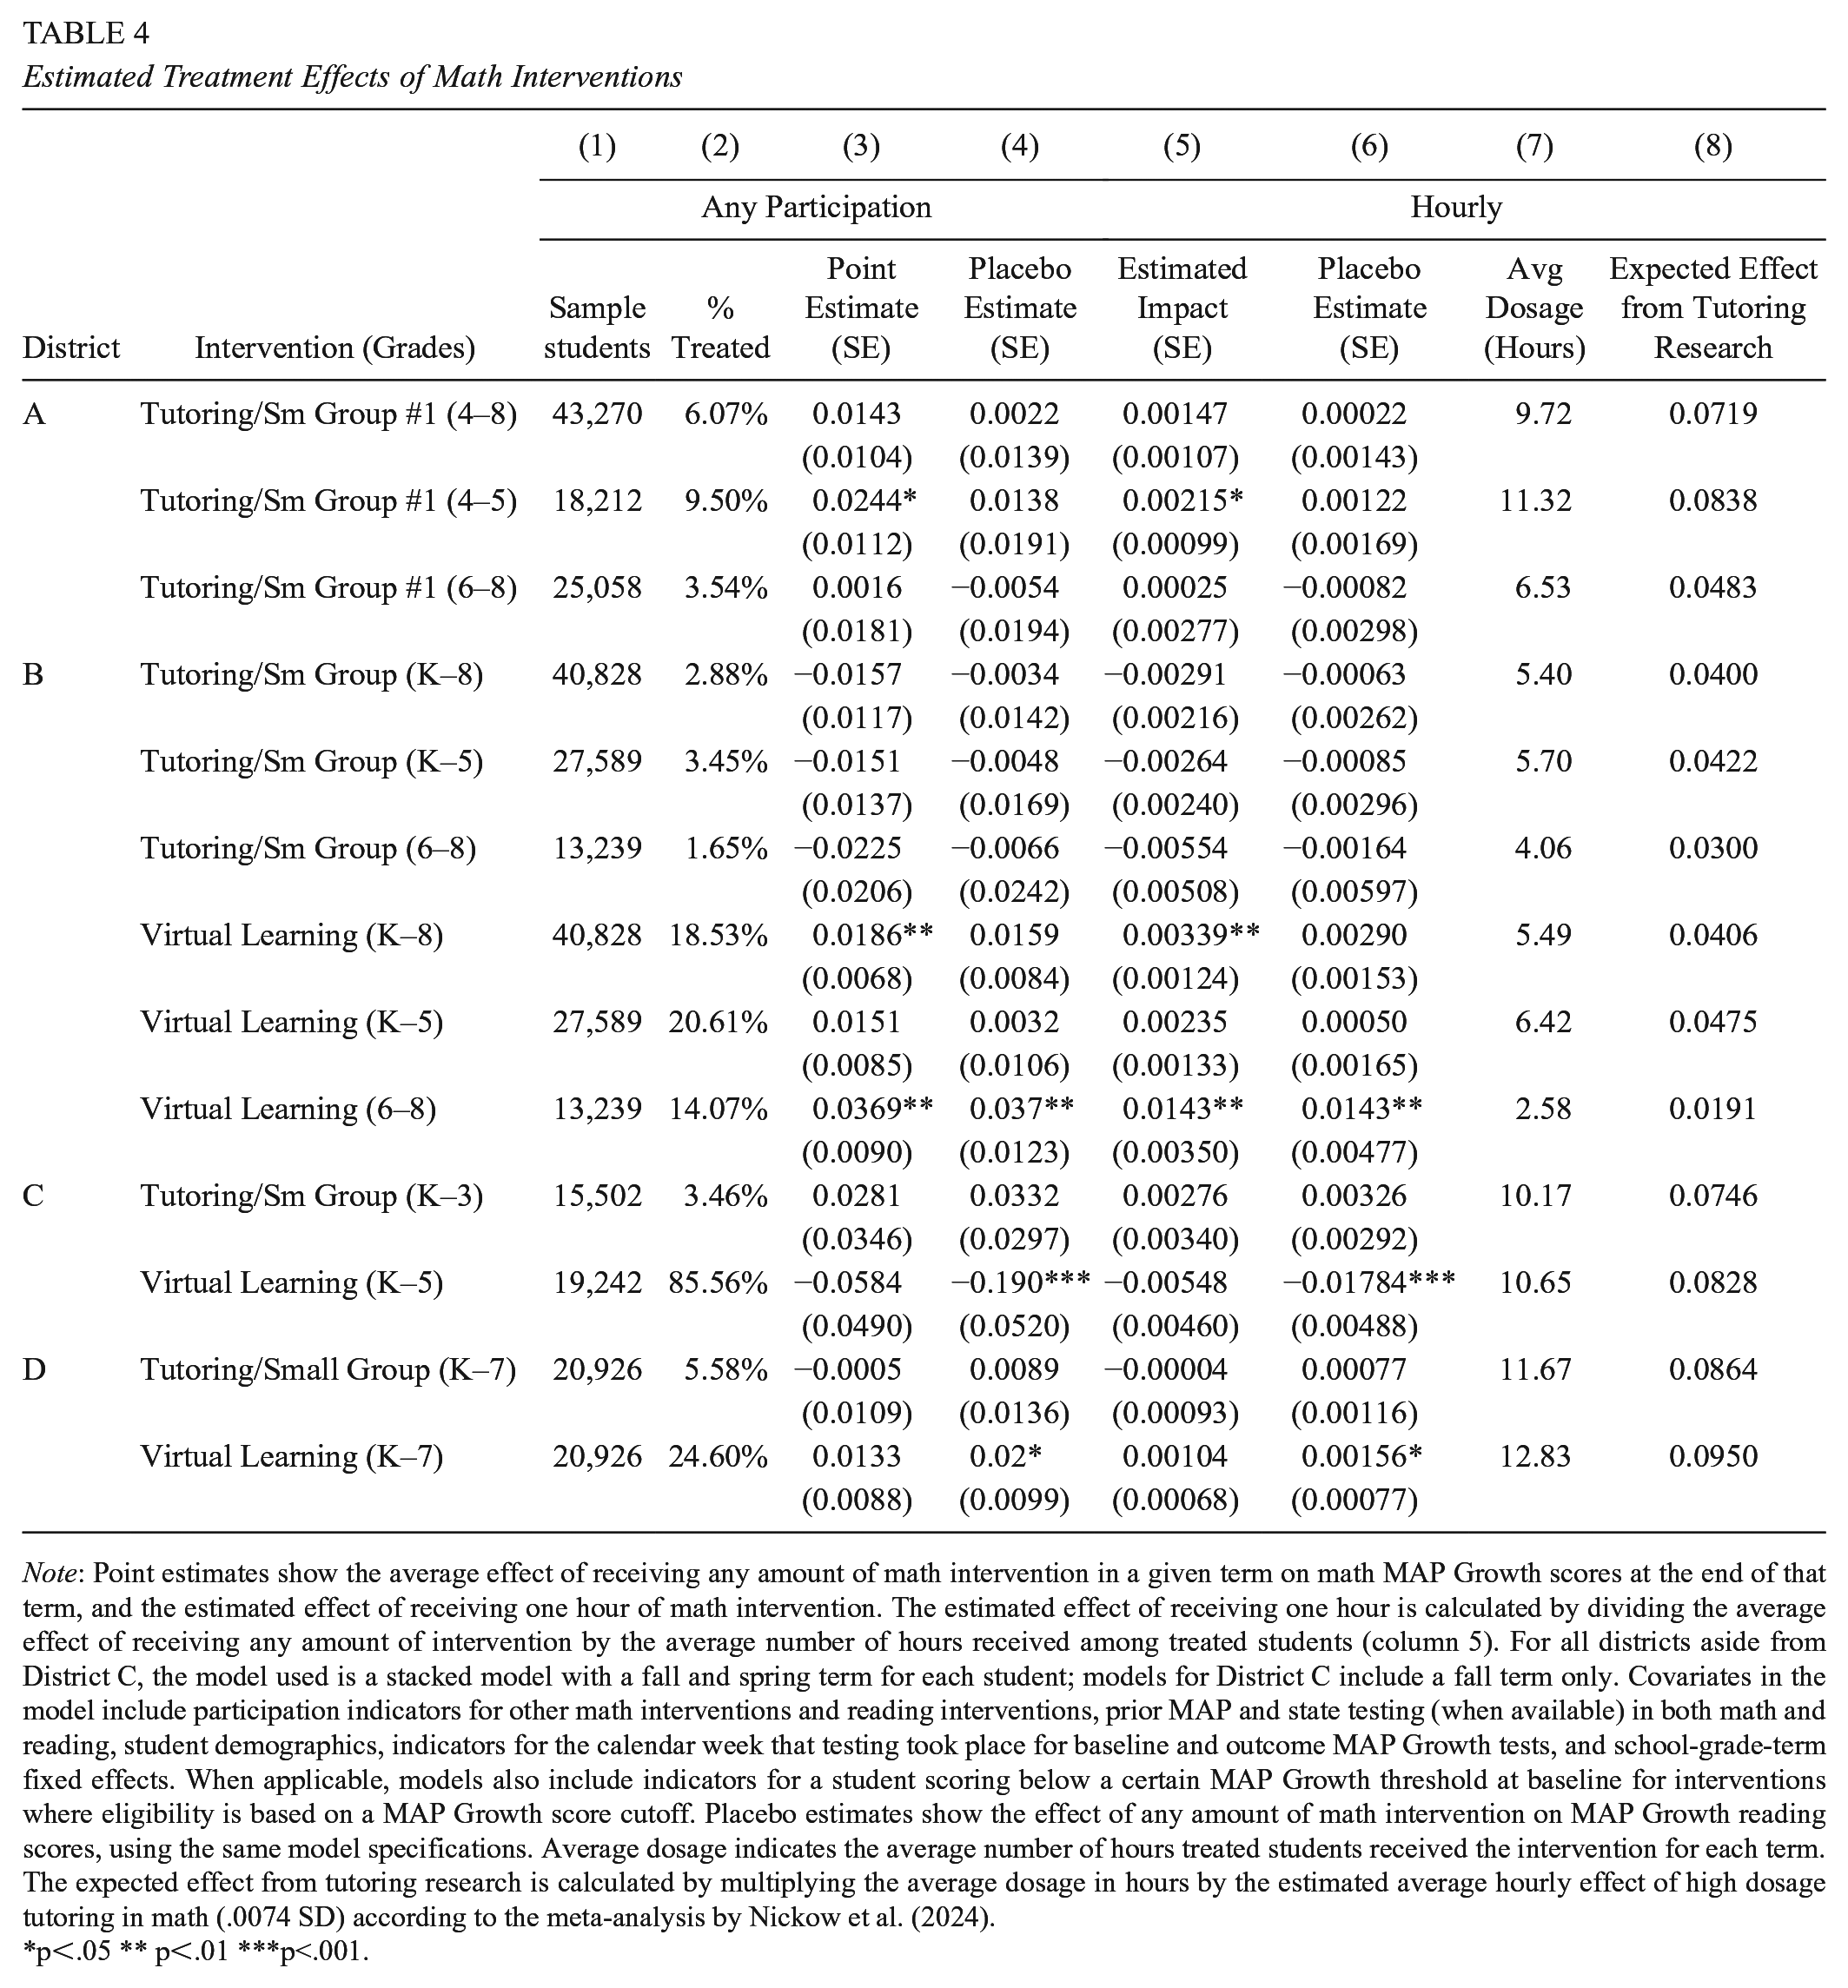
Note: Point estimates show the average effect of receiving any amount of math intervention in a given term on math MAP Growth scores at the end of that term, and the estimated effect of receiving one hour of math intervention. The estimated effect of receiving one hour is calculated by dividing the average effect of receiving any amount of intervention by the average number of hours received among treated students (column 5). For all districts aside from District C, the model used is a stacked model with a fall and spring term for each student; models for District C include a fall term only. Covariates in the model include participation indicators for other math interventions and reading interventions, prior MAP and state testing (when available) in both math and reading, student demographics, indicators for the calendar week that testing took place for baseline and outcome MAP Growth tests, and school-grade-term fixed effects. When applicable, models also include indicators for a student scoring below a certain MAP Growth threshold at baseline for interventions where eligibility is based on a MAP Growth score cutoff. Placebo estimates show the effect of any amount of math intervention on MAP Growth reading scores, using the same model specifications. Average dosage indicates the average number of hours treated students received the intervention for each term. The expected effect from tutoring research is calculated by multiplying the average dosage in hours by the estimated average hourly effect of high dosage tutoring in math (.0074 SD) according to the meta-analysis by Nickow et al. (2024).
p<.05 ** p<.01 ***p<.001.
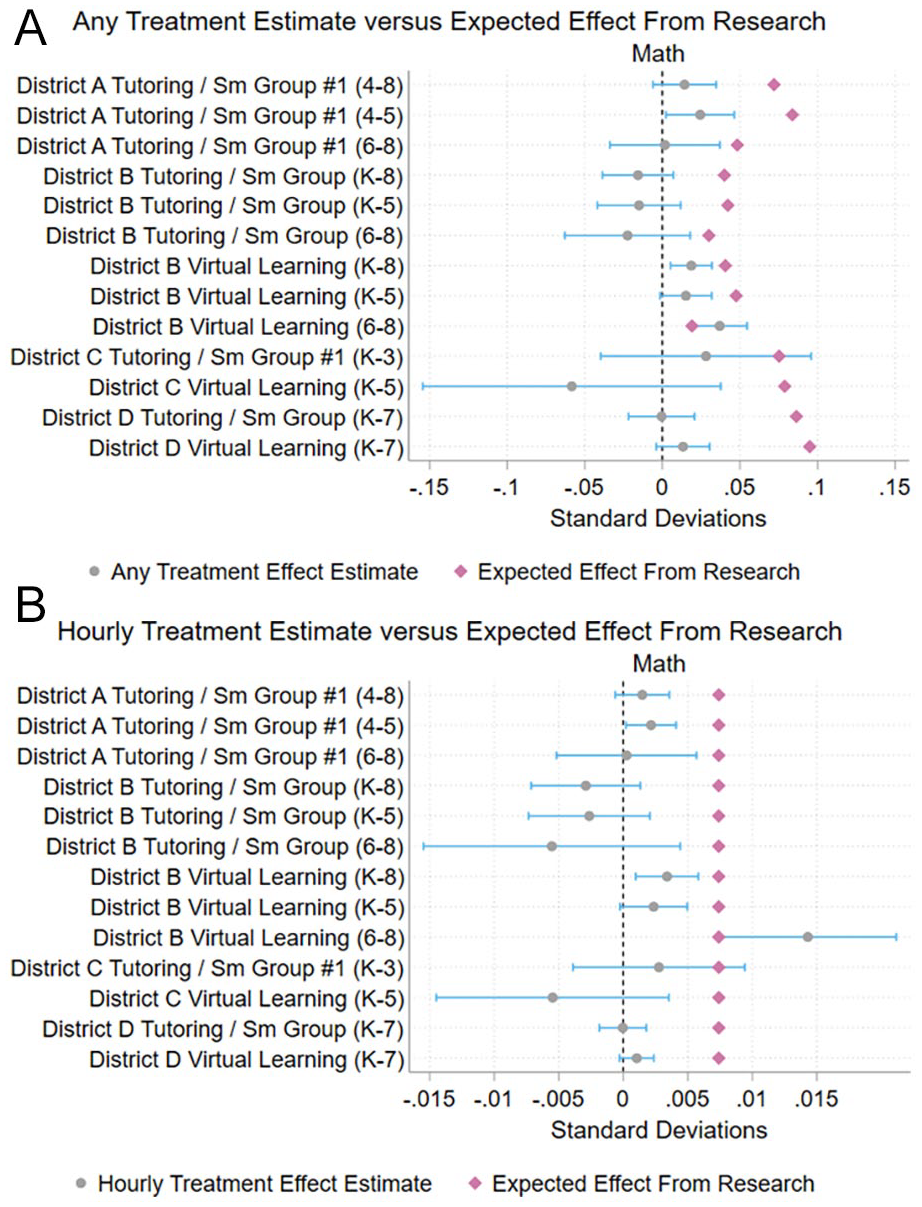
Estimated treatment effect of math interventions: (A) Impact estimates for binary measure of treatment and (B) Impact estimates for hourly measure of treatment.
Column 2 shows coefficients from corresponding placebo tests, which examine selection bias by estimating the impact of participating in a subject-specific intervention (which plausibly only affects test achievement in that subject) on achievement in the opposite subject. In only one of the two cases in which we found small positive coefficients on participation in math intervention(s) did the intervention also pass the placebo test: District A Tutoring/Small Group #1. While it is possible that the positive placebo estimate for District B Virtual Learning is representative of true impacts of the intervention on reading achievement, we also cannot rule out the possibility that students who participated in this intervention were different from students who did not participate in unobservable ways that led to their gains in both math and reading (as opposed to the fact that they participated in the intervention). Therefore, the positive placebo test reduces our confidence that the significant impact estimates for District B Virtual Learning should be directly attributed to the intervention.
Columns 3 and 4 show the estimated treatment effect per hour of treatment, along with its corresponding placebo test. We calculate these estimates by dividing the results in columns 1 and 2 by the average number of intervention hours for treated students in the district, reported in column 5. This approach, which assumes a linear relationship between treatment dosage and impact, is a fairly simplistic method of modeling the effect of an hour of treatment. We report these hourly estimates simply to convert impact estimates to a scale that is comparable across interventions, given the considerable variation in the average treatment dosage received across interventions and districts. 15
For context, we also report in column 6 the estimated impact we would have expected to see if the interventions had the same impact per hour as found in the prepandemic research on high-quality tutoring (Nickow et al., 2024; see Appendix C for additional detail). These “expected” total impacts for participating students range from .02 to .10 standard deviations across interventions. In all but one case (District B Virtual Learning grades 6–8), the expected impacts exceed the observed treatment effects. Furthermore, Figure 1 shows that, in most cases, the upper bounds of the confidence intervals for the treatment effects are below the expected effect estimate. In other words, we can rule out that the interventions had the same effect on math achievement per hour as the high-quality prepandemic tutoring programs in Nickow et al.’s (2024) meta-analysis.
Table 5 and Figure 2 show comparable results for seven district/intervention combinations (across grades) targeted at reading achievement. In only one case (District C Tutoring/Small Group #1), the estimate for the effect of any participation was statistically different from zero—but the point estimate was negative. 16 For the estimated effects of an hour of treatment, District A Tutoring/Small Group #1, District A Tutoring/Small Group #2, and District C Tutoring/Small Group #1 had significant impacts, though District C’s intervention’s impact was again negative.
Estimated Treatment Effects of Reading Interventions

p<.05 ** p<.01 ***p<.001.
Note: Point estimates show the average effect of receiving any amount of reading intervention in a given term on reading MAP Growth scores at the end of that term and the estimated effect of receiving one hour of reading intervention. The estimated effect of receiving one hour is calculated by dividing the average effect of receiving any amount of intervention by the average number of hours received among treated students (column 5). For all districts aside from District C, the model used is a stacked model with a fall and spring term for each student; models for District C include a fall term only. Covariates in the model include participation indicators for other reading interventions and math interventions, prior MAP and state testing (when available) in both math and reading, student demographics, indicators for the calendar week that testing took place for baseline and outcome MAP Growth tests, and school-grade-term fixed effects. When applicable, models also include indicators for a student scoring below a certain MAP Growth threshold at baseline for interventions where eligibility is based on a MAP Growth score cutoff. Placebo estimates show the effect of the any amount of reading intervention on MAP Growth math scores, using the same model specifications. Average dosage indicates the average number of hours treated students received the intervention for each term. The expected effect from tutoring research is calculated by multiplying the average dosage in hours by the estimated average hourly effect of high dosage tutoring in literacy (.0089 SD) according to the meta-analysis by Nickow et al. (2024).

Estimated treatment effect of reading interventions: (A) Impact estimates for binary measure of treatment and (B) Impact estimates for hourly measure of treatment.
Because of the small, negative, and/or null effects estimated for each intervention, we did not estimate interaction effects of interventions for students who participated in multiple interventions within the year. Nevertheless, a small proportion of students received multiple ELA interventions in two of the four districts and math interventions in three of the four districts. The percentage of students receiving multiple interventions in a subject in these districts ranged from 5 to 22 percent. A higher percentage of students were receiving at least one intervention in both math and ELA, ranging from 14 to 74 percent across the four districts.
When we consider the specifics of participation in these interventions, the estimated impacts shown in Figures 1 and 2 are unsurprising. The number of students served and the amount of instruction provided were nearly always lower than planned (see Appendix Tables A3 and A4 for eligibility, participation, and dosage rates for math and ELA interventions). For example, districts’ tutoring and small group interventions intended to serve between 5 and 45 percent of students across targeted schools and grades. However, over the course of the school year, the data indicate that these programs generally reached less than 20 to 30 percent (and sometimes less than 10%) of their intended enrollment, totaling 5 to 10 percent of all students in the targeted schools and grades.
The dose of programming students received also fell short of districts’ plans. We found districts that had planned on offering students between 15 and 30 hours of mathematics tutoring per term (30 to 60 hours per year) ended up, on average, providing students 5 to 10 hours of math tutoring. For students who did participate, the number of sessions and the length of sessions were also often less than originally planned. In one district that had planned to offer students 90 sessions of tutoring over the course of the school year, students attended 13 sessions on average. In another district, math tutoring sessions were supposed to provide 100 minutes of instruction during the week over five sessions; in practice, the average student attended 28 minutes of tutoring per week.
Intervention Implementation
The lack of impact from the interventions is unsurprising given the major implementation challenges identified in interviews with district leaders. Leaders mentioned a range of implementation challenges. All three districts reported challenges related to (a) reaching the targeted students consistently and equitably across schools; (b) staffing and staff capacity; (c) scheduling and delivering intervention services; (d) adapting interventions to accommodate existing federal, state, and district policies; and (e) building central office capacity and internal systems for scaling interventions. Importantly, each of these challenges was situated in and often exacerbated by the challenging context of the ongoing pandemic during the 2021–2022 school year.
Reaching Target Students
The interventions we studied typically targeted students based on one or more test performance thresholds (e.g., students who had scored below the 20th percentile on the MAP Growth test). Some interventions incorporated other eligibility criteria, such as low attendance rates, low course grades, or teacher recommendations when assigning students to interventions. But intervention leaders said they often decentralized decisions about student participation to schools and classrooms—effectively letting school personnel refer students to treatment—in the hope that the approach would generate buy-in from principals and teachers and help match students with appropriate interventions. In practice, this left principals and teachers to decide the balance between district-mandated eligibility criteria and their own professional judgment about which students had the greatest needs and/or would benefit most from the intervention.
Decentralizing eligibility decisions played out in several ways. For example, leaders of one intervention reported that teachers recommended students with test scores above the eligibility threshold because the teachers believed their students’ scores were inflated and did not accurately reflect their achievement. While these teachers may have had a better understanding of their students’ needs than what was reflected in test results, in other places leaders reported that local decision-makers were directing services away from target populations and toward students with lower academic needs. Leaders of a reading intervention in one district reported schools focused on “bubble” students on the cusp of proficiency, rather than the low-performing students the intervention intended to serve (the intervention targeted students who performed at or below the 15th percentile of the school’s test score distribution). In another district, 31% of the students who took part in a math intervention intended for students at or below the 20th percentile in math had scores above the 40th percentile. In two of the districts, leaders reported that schools occasionally used tutoring to help students who were performing at grade level but struggling with a specific topic. One leader concluded, “I think it [tutoring] is happening with the wrong set of kids.”
Sometimes schools did not adhere to the intervention’s targeting criteria because teachers believed the intervention was misaligned with student needs. For example, a leader of a math intervention in one district explained that some schools found that the students initially chosen for the intervention did not have the foundational skills necessary to benefit from it. In response, the district expanded its eligibility for the intervention from the lowest 25 percent of math performers to the lowest 30–35 percent of performers and gave teachers discretion to identify the students in this group who they thought would benefit from the intervention.
In another case, district leaders required schools to use district-level eligibility criteria (e.g., test score thresholds) for an initial wave of students and then allowed schools to use their own criteria to identify a second wave of students to access the intervention and fill in any available slots. Here, the district leaders felt this approach improved local buy-in and allowed schools to expand access to the intervention for more students while still preserving the district’s interest in serving priority students. In the end, guidelines for assigning students to interventions that appear routine on paper were, in practice, hard to apply consistently.
Hiring and Deploying Staff
Districts used a range of strategies to staff interventions. Some contracted with vendors or hired new intervention specialists to work in schools. Others hired graduate assistants, retired and current teachers, or undergraduate and high school students. When possible, districts leveraged existing staff and existing relationships with vendors, individual volunteers, and community-based organizations to find intervention staff. Each approach presented its own challenges.
For example, districts that contracted with vendors gave up some control over the staff selection process, making it difficult for district leaders to ensure staff quality and consistency throughout the year. In a tutoring program that relied on community providers, the intervention leader said they felt like they did not have the luxury to do anything beyond basic background checks because of a tight labor market. Conversely, when districts hired intervention specialists and tutors directly, central offices—already stretched thin—had to invest substantial time and resources in the hiring process.
District leaders reported that leveraging existing staff and prior vendor relationships helped get interventions started earlier in the year. Starting from scratch, however, created delays in some cases. For example, leaders in one district said they spent the first five months of the school year negotiating contracts with tutoring vendors to ensure that they were federally compliant and could be paid using ESSER funding. This meant that the district’s tutoring programs did not launch until February and March 2022. In another district, a small team in the central office was responsible for hiring, onboarding, and training tutor providers. The leader of this team said its limited capacity created a bottleneck that delayed tutors’ placement in schools. Once in schools, tutors had to work with teachers to identify student needs, delaying the delivery of services even further. In certain schools, persistent teacher turnover caused still other delays, as teacher–tutor relationships had to be restarted with each new hire.
Even when districts were able to get providers in place, other staffing problems could occur. One intervention leader reported needing to redeploy intervention specialists to cover regular classrooms because of COVID-related teacher absences during the Delta and Omicron surges. The leader of a reading intervention in another district concurred, explaining how the Delta surge affected staffing in one school:
At the start of the year, at one of our schools, they had something like 24 teachers out. They all had COVID. That was two weeks where interventionists were pulled from what they would regularly do. There’s no way around it. . . You need a body in the classroom.
“Usually, it was a domino effect,” the leader said, with illnesses delaying interventions for weeks. In the same district, teachers reportedly used interventionists at the beginning of the year to help get small groups going, rather than delivering academic interventions. As one leader put it, the interventionists “have an eye on what the school needs,” beyond their specific responsibilities to individual students.
Just as schools sometimes struggled to provide interventions because of teacher absences during the Delta and Omicron surges, COVID outbreaks also resulted in student absences that could reduce the planned-for frequency and dosage. As students moved in and out of school and experienced stress and pressure related to the pandemic, some interventionists reported challenges with student behavior that made it harder to deliver the planned dose of academic support. Commenting on the amount of time spent in intervention sessions to manage student behavior, one district leader said, “If behavior is the thing that students need to get going [in school], maybe behavior should be the intervention.” Finally, interviewees noted that even the fear of COVID could affect implementation. Early in the school year, for example, leaders said that some teachers were reluctant to send students to pull-out groups because they thought it would increase everyone’s risk of infection.
Scheduling and Delivering Interventions
Interviews suggested that scheduling challenges could also make it harder for schools to deliver interventions as planned. “It comes down to access,” said one intervention leader. “How easy is it to pull a student [from class] and bring them back?” Across all three districts, intervention leaders reported that delivering pull-out programs during the school day could be challenging. This was due, in part, to instructional time being fully planned out during the regular school day. Responding to data showing low intervention uptake and dosage, one district leader shared, “All of our literacy minutes were already being used for other things, so the data do not shock me.” According to intervention leaders, some classroom teachers resisted pull-out interventions because they did not want students to miss grade-level core instruction. In other cases, students who would have been eligible for a pull-out intervention based on their test scores could not receive it because it conflicted with other, higher priority (or state-mandated) supports (e.g., ELL/Individualized Education Program services).
In multiple cases, leaders reported that intervention providers had to navigate schedules with individual teachers to meet with target students. This process meant that the same intervention could occur at different times in different buildings, so the untreated counterfactual (what students missed during their intervention) varied across students and schools. One tutoring program director likened scheduling to a complex puzzle, a “game of figuring out where each person goes and fits [so that]. . . Kids get hours but also we want tutors to get their hours.” Local complexity and discretion sometimes meant that “schools did their own thing [when it came to scheduling] and that is hard for us [the district] to control,” according to one district leader.
District-level schedules could also make accessing interventions easier or harder. For example, one district mandated extra intervention minutes for reading in all elementary school schedules, but not for math. As a result, reading intervention providers (a position that predated the pandemic) were reportedly more likely to find time to work with students than math intervention providers (a new position). 17
In each of these cases, ease of scheduling was a function of who was responsible for scheduling and the extent to which intervention times aligned with existing school schedules. When intervention time was accounted for in school schedules and building administrators helped prioritize and coordinate scheduling, intervention leaders reported fewer scheduling issues. When schools worked directly with external contractors to schedule interventions outside of school hours, district leaders reported fewer issues and constraints. However, scheduling intervention sessions after the school day limited access for students who wanted to participate in extracurricular activities or did not have access to transportation after school.
Arranging intervention times was not the only scheduling challenge. In some cases, schools did not have adequate space for interventionists to work with students in small groups, further complicating intervention delivery. A district leader of a math intervention, for example, said:
Location was often an issue. Classrooms were not physically designed to have a group pulled in the back in many schools. So, their [students’] time was less because they lost minutes coming and going to the group.
By contrast, in cases where intervention providers had space to work and could easily bring all their materials into the classroom, schools were reportedly better able to provide the planned dose of the intervention.
Aligning with Existing Federal, State, and District Policies
District leaders also faced the challenging task of embedding interventions in an existing system of federal, state, and local policies. At times, this required adapting interventions to accommodate existing rules and procedures, which, in turn, delayed the rollout of services or diminished their quality. To use ESSER funding for a tutoring intervention, leaders in one district had to revise their vendor contracts to meet federal contracting requirements, which delayed the intervention’s rollout. Another district leader discussed having to comply with a state mandate requiring the use of tutoring to deliver a remediation curriculum, even though the leader believed it was more appropriate to use tutoring for grade-level content. Districts were implementing concurrent interventions that could conflict with the academic recovery intervention in ways confusing to teachers. To prevent confusion and frustration, district leaders prioritized aligning the features of the interventions and occasionally had to depart from evidence-based practices. For example, one district administrator discussed increasing tutoring group sizes to more than what is considered best practice to align with the small-group sizes prescribed by the district’s recently adopted, multi-tiered system of supports (MTSS) program.
Competing district initiatives also strained educator capacity for implementing interventions. Examples of concurrent initiatives implemented by the districts in the 2020–2021 school year included new core curricula in reading and math, new training for teachers, COVID quarantine and testing policies and procedures, other digital tools for assessing and remediating student learning, new social-emotional and mental health supports, and other districtwide interventions. One district leader asked rhetorically, “How much capacity do people have? It [the multiple initiatives] is so much,” implying that educators were overburdened and exhausted by the new policies and interventions adopted by the district. Another district leader said that, because schools were still learning how to implement other interventions that served the same student population as their tutoring program, it made it harder to ensure consistent scheduling for students and tutors.
Ensuring Central Office Capacity to Support Scale
Finally, district central offices often lacked capacity to oversee and coordinate the implementation of the interventions. Many of the representatives we spoke to worked in small teams, consisting of two or three total staff members, who were suddenly in charge of hiring intervention providers, coordinating school schedules, and overseeing implementation of an intervention for their entire district. Therefore, district leaders had limited time and capacity to manage these processes while also fulfilling other professional roles and responsibilities in the district. In reflecting on the past year, one district administrator shared that they could have provided better professional development to interventionists had it not been for the hours of new literacy training required by state law that they also had to provide for teachers.
District representatives also described working with internal systems that were not designed to handle the demands of interventions on such a large scale. As noted earlier, one district’s process for hiring, onboarding, and training tutors was time consuming and delayed student placement with tutors. Another district leader shared that compliance management of diverse tutoring providers was cumbersome, primarily because the district did not have internal data systems to track tutoring hours and attendance across different providers. These remarks suggest that, to implement interventions at scale, districts need the authority and resources to invest in central office staffing and internal systems for overseeing these programs.
In summary, COVID-recovery interventions were often not implemented at the frequency or dosage originally planned in part because schools faced challenges related to reaching the targeted students, staffing, scheduling interventions, and limited central office capacity. Of course, these tasks were challenging because schools were attempting to help students recover from COVID while the pandemic was still happening. In addition, district leaders had limited capacity and systems from within the central office to take these interventions to scale, and sometimes had to adapt interventions to accommodate existing policies in ways that delayed services or reduced the quality of services offered to students.
The findings from our interviews underscore the challenging reality of the districts’ implementation contexts. While our findings illuminate how these challenges hindered implementation in the 2021–2022 school year, many of the districts have already developed plans to address some of these persistent challenges in the 2022–2023 school year. Our interviews with district leaders suggest that implementation of recovery interventions is an iterative process that will require continual adjustments to internal (e.g., staffing shortages, intervention eligibility criteria and assignment policies, school schedules) and external (e.g., a surge in COVID-19 cases, state and federal policies) factors.
Discussion & Conclusion
Consistent with other recent evidence that districts made little progress toward academic recovery on average during the 2021–2022 school year (e.g., Jacobson, 2022; Kuhfeld & Lewis, 2022), our analysis of four districts’ recovery interventions finds that they served few students and had minimal (if any) positive effects on student achievement relative to business as usual. Of course, in theory, the wide range of catch-up efforts in these districts could be raising achievement for all students, making it hard to detect treatment effects from the interventions. These districts vary in the amount of recovery they need to return to their prepandemic achievement levels, but they all have more ground to make up than the average U.S. district, whose 2022 state test scores declined −.49 grade levels in math and −.31 grade levels in reading relative to 2019 (Reardon et al., 2023). As displayed in Table 6, the 2022 scores of the four districts herein declined by −0.22 to −0.56 grade levels in math and −.08 to −.60 grade levels in reading (Reardon et al., 2023). To catch up, student learning will need to move at a faster pace than it did prepandemic.
Estimated Achievement Loss and Recovery from Spring 2019 to 2022, Grades 3–8

Note: Spring 2019 and spring 2022 estimates are from the Stanford Education Data Archive (Version SEDA 2022 2.0; Reardon et al., 2023) and are scaled such that a 0 in this metric is equal to the average of the national NAEP average (in grade 5.5) in spring 2019, and 1 unit in this metric is equal to 1 student level standard deviation (SD). Estimates in this scale are comparable across the whole country, and over time, but they are not comparable across subjects. Tutoring hours to eliminate the loss are calculated based on Nickow et al.’s (2024) estimates that approximately 38.9 hours of tutoring per year in math results in a .27 SD gain in math achievement and 35.0 hours of tutoring per year in literacy results in a .29 SD gain in reading achievement.
To better understand our findings on intervention participation, dosage, and impacts, we interviewed a subset of district leaders about implementing interventions. The results suggest that staffing and scheduling problems often plagued recovery efforts. As a result, many interventions served fewer students than originally intended—and often served students who were not in the targeted groups. In some cases, academic interventions displaced regular classroom instruction, reducing the contrast between the intervention “treatment” and business as usual, again making it difficult to detect treatment effects. Schools and districts alike experienced the benefits and limits of decentralized decision-making, which can support local adaptation but also create inconsistency and confusion.
The implementation challenges district leaders recounted suggest that the simple-sounding logic of academic intervention—identify students in need and provide them extra support—belies a host of complex design decisions and implementation dynamics. Under existing decentralized decision-making structures and constraints on capacity and time, there are no easy solutions to address pandemic losses.
Providing sufficient intervention for all students in need is going to require historic action. States and districts can help by providing transparent and accessible measures of students’ academic progress and recovery to schools, families, and students. Recent surveys indicate that parents currently underestimate the extent to which their own students are behind (Anderson et al., 2022; Hubbard & Burns, 2022; Polikoff & Houston, 2022). Districts and states may need to do more to inform families and communities about how students are doing now, whether they are on track for recovery, and what can be done if recovery does not look like it is happening at an adequate pace. There is evidence, outside of the pandemic context, that better alignment between grades and measured test scores results in better student achievement (Gershenson et al., 2022). In light of emerging evidence of grade inflation during the pandemic (Goldhaber & Young, 2023), it is important for school districts to make sure grades and other student outcomes (e.g., math and reading assessments) are aligned, given that grades are arguably the most direct means for schools to communicate with parents about student learning. Many schools are also implementing voluntary interventions that require school systems to articulate the extent to which students need supplemental (outside of the regular school day) services and to nudge families to use the intervention(s) to get even moderate student take-up (Robinson et al., 2022).
Successfully increasing the scale of interventions in districts will, in some cases, require more resources (e.g., staff and staff compensation). We show elsewhere that learning losses varied across districts (Goldhaber, Kane, McEachin, & Morton, 2022a) and that the ESSER funds districts received may be sufficient for recovery in low-income districts that were in person during the 2020–2021 school year. But ESSER funds are unlikely to be sufficient for the larger share of districts that spent more time in remote status. Moreover, because the ESSER dollars were based on district poverty rates, these federal dollars will also be inadequate in the low-poverty districts that were remote for much of 2020–2021 (Goldhaber, Goldhaber, Kane, McEachin, Morton, Patterson, et al., 2022b; Shores & Steinberg, 2022). In addition to funding, our findings suggest that districts may need to invest in central office capacity and internal administrative systems (e.g., data systems, hiring procedures) to implement academic recovery interventions at scale.
Given that a tight labor market limited the ability of schools to implement some recovery initiatives, districts may also need to cast a broader net to recruit adults to provide interventions in schools and seek out new or expanded partnerships with external organizations. Our interviews indicate that some districts managed to supplement their academic interventions with external partnerships. They tapped local community centers, educator preparation programs, college students, parents, and local community members to provide academic help. Given the scale of the need, these types of external partnerships are a key resource for expanding recovery efforts in the 2022–2023 school year. Not every district we studied, however, was able to leverage external partnerships to support academic recovery.
Finally, districts will need help to expand their interventions to be commensurate with their students’ losses. In most cases, this will mean expanding student participation and dosage in existing programs, as well as layering interventions (e.g., high dosage tutoring and an extended school year) for targeted students. To illustrate this point, we end the paper by translating the average student’s remaining recovery in these districts to the hours of high dosage tutoring that would be needed for a full recovery (see Table 6). Just for students in grades 3–8, the four districts in this study will need to deliver an average of 9 to 23 hours of math tutoring per student in addition to an average of 2 to 21 hours of reading tutoring per student to fully recover all students. In these large districts, this roughly equates to between 150,000 and 650,000 total hours of reading tutoring and between 370,000 and 1,430,000 total hours of math tutoring provided by a district to students in grades 3–8. If we assume tutors work 5-hour days for 180 days a year, delivering 150,000 hours of reading tutoring would require deploying around 160 reading tutors. For most districts, this level of intervention would be a significant step up in intensity from what was implemented during the 2021–22 school year. Districts do not, however, have to tackle this problem alone. States and other civic leaders can help districts mobilize communities by providing information, political cover (for example, on extending learning time), and investing in the capacity of districts, schools, and communities to support and advocate for recovery. A coordinated approach is not only important for school systems’ response to pandemic-related learning disruptions, but will also inform our responses to future emergencies that disrupt schooling for extended periods of time.
Complete academic recovery—and, ideally, academic acceleration—is as urgent as it is challenging. Especially in the places hit hardest by the pandemic, academic recovery from COVID-19 is likely to require an all-hands-on-deck response for the next several years. Recovery is unlikely to be completed when the federal dollars run out in September 2024, suggesting that states will need to take further action to support additional academic interventions.
Supplemental Material
sj-docx-1-ero-10.1177_23328584241281286 – Supplemental material for The Impact and Implementation of Academic Interventions During COVID-19: Evidence from the Road to Recovery Project
Supplemental material, sj-docx-1-ero-10.1177_23328584241281286 for The Impact and Implementation of Academic Interventions During COVID-19: Evidence from the Road to Recovery Project by Maria V. Carbonari, Miles Davison, Michael DeArmond, Daniel Dewey, Elise Dizon-Ross, Dan Goldhaber, Ayesha K. Hashim, Thomas J. Kane, Andrew McEachin, Emily Morton, Atsuko Muroga, Tyler Patterson and Douglas O. Staiger in AERA Open
Footnotes
Acknowledgements
We could not have drafted this report without the district leaders who generously gave their time and attention to us during a challenging school year. We are also grateful to Anna McDonald, Ian Callen, Andrew Camp, and Andrew Diemer for their assistance in various aspects of this research.
Declaration of Conflicting Interests
The author(s) declared no potential conflicts of interest with respect to the research, authorship, and/or publication of this article.
Funding
The author(s) disclosed receipt of the following financial support for the research, authorship, and/or publication of this article: This research was supported by the Carnegie Corporation of New York, the Walton Family Foundation, Kenneth C. Griffin, the AIR Equity Initiative, and an anonymous foundation.
Notes
Authors
MARIA V. CARBONARI is a PhD student at the University of Pennsylvania Graduate School of Education; email:
MILES DAVISON is a research scientist at NWEA; email:
MICHAEL DEARMOND is the director of policy at the Center for Analysis of Longitudinal Data in Education Research (CALDER) at the American Institutes for Research (AIR); email:
DANIEL DEWEY is a research analyst at the Center for Education Policy Research at Harvard University; email:
ELISE DIZON-ROSS is a researcher at the Center for Analysis of Longitudinal Data in Education Research (CALDER) at the American Institutes for Research (AIR); email:
DAN GOLDHABER is the director of the center for Analysis of Longitudinal Data in Education Research (CALDER) at the American Institutes for Research (AIR) and the director of the Center for Education Data & Research (CEDR) at the University of Washington; email:
AYESHA K. HASHIM is a research scientist at NWEA; email:
THOMAS J. KANE is the Walter H. Gale Professor of Education and faculty director of the Center for Education Policy Research at Harvard University; email:
ANDREW MCEACHIN is the senior research director of policy research at the ETS Research Institute; email:
EMILY MORTON is a researcher at the Center for Analysis of Longitudinal Data in Education Research (CALDER) at the American Institutes for Research (AIR); email:
ATSUKO MUROGA is a postdoctoral fellow at the Center for Education Policy Research at Harvard University; email:
TYLER PATTERSON is an economics PhD student at the University of Chicago; email:
DOUGLAS O. STAIGER is the John Sloan Dickey Third Century Professor in the Department of Economics at Dartmouth; email:
References
Supplementary Material
Please find the following supplemental material available below.
For Open Access articles published under a Creative Commons License, all supplemental material carries the same license as the article it is associated with.
For non-Open Access articles published, all supplemental material carries a non-exclusive license, and permission requests for re-use of supplemental material or any part of supplemental material shall be sent directly to the copyright owner as specified in the copyright notice associated with the article.