
Abstract
Some high school seniors who plan to attend college in the fall following graduation do not enroll. This phenomenon, known as summer melt, contributes to lower educational attainment, particularly among low-income students. We extend the literature on summer melt in two ways. First, we show that melt estimates can be sensitive to measurement decisions and local context, and in particular that estimates based on student-level National Student Clearinghouse data can overstate the extent of summer melt. Second, we show that aspects of students’ behavior and perceptions, such as their attendance rates, Free Application for Federal Student Aid (FAFSA) completion, and confidence about their intended college, predict summer melt. These results suggest ways that school staff and summer melt interventions could potentially target additional support to college-intending students to facilitate their successful transition to college.
A college education is associated with a wide range of positive social and economic outcomes in adulthood (see e.g., Barrow & Malamud, 2015; Card, 2001; Hout, 2012). Yet some high school seniors who plan to attend college in the fall after high school graduation do not enroll—a phenomenon known as summer melt. Research suggests that more than 1 in 10 students nationally experience summer melt (Castleman & Page, 2014a) and that melt is much more common among graduates from large, predominantly low-income, urban school districts (e.g., Daugherty, 2012; Holzman & Hanson, 2020; Kirkman et al., 2022). Although rates of summer melt undoubtedly vary across contexts, the way scholars define and operationalize melt also varies across studies, making it difficult to discern the extent to which rates of summer melt differ due to changes in context or measurement. We begin this article by investigating how measurement decisions affect melt estimates.
We then explore which students are most likely to experience summer melt. Although researchers generally find that students from specific demographic groups—namely, low-income, Black, and Latinx students (Castleman & Page, 2014a; Daugherty, 2012; Holzman & Hanson, 2020)—are most likely to melt, few studies provide information about which student characteristics, beyond demographics, are strongly associated with summer melt. We examine the extent to which students’ school engagement, academic achievement, college eligibility, and commitment to attending college are associated with summer melt. Our analyses aim to provide information that high school staff could potentially use to deliver additional support to the students who are most likely to melt, and that summer programs could potentially use to better target melt interventions.
Background
A college degree has become increasingly important for economic security and social well-being. College graduates are more likely to be financially secure as adults, satisfied with their careers, and healthier (Glenn & Weaver, 1982; Hout, 2012; Oreopoulos & Petronijevic, 2013). Yet despite the considerable benefits of a college degree, large and persistent socioeconomic disparities in college enrollment remain (Bailey & Dynarski, 2011). A substantial body of research has focused on identifying barriers to college attendance and interventions that may improve college access (for a review, see Page & Scott-Clayton, 2016). We build on this literature by highlighting key considerations when measuring summer melt and identifying important predictors of summer melt.
Defining Summer Melt
Researchers define summer melt differently depending on the measures available to them. Measuring melt requires having information on (a) whether students intended to enroll in college in the fall following high school graduation and (b) whether students successfully enrolled. Some studies define “college-intending” based on students’ reports that they planned to enroll in college after high school graduation (Kirkman et al., 2022) or had started or completed the Free Application for Federal Student Aid (FAFSA) prior to high school graduation (Castleman & Page, 2015). Other studies combine these two indicators with measures of whether or how many times students met with a college counselor (Castleman & Page, 2014a). Still others use indicators of whether students applied to at least one college and completed the FAFSA (Holzman & Hanson, 2020), whether they met with a college advisor during their senior year (Castleman & Page, 2015), whether they were accepted to at least one college and submitted the FAFSA (Castleman & Page, 2014a), or simply whether they were accepted to at least one college (Durham et al., 2020). Some studies combine many of these indicators, including whether students reported planning to attend college, had applied to at least one college, and had been accepted by at least one college (Castleman et al., 2014). These differences in how researchers measure whether students intend to enroll in college after high school graduation probably affect melt estimates. For example, broader measures of college intent, such as whether students reported planning to attend college, are likely to show more melt, while more restrictive measures, such as those requiring that students were admitted to at least one college and submitted the FAFSA, are likely to show less melt.
Most studies operationalize college enrollment using administrative data collected from colleges by the National Student Clearinghouse (e.g., Castleman & Page, 2014a, 2017; Castleman et al., 2012). A few studies measure enrollment using administrative data from specific colleges (e.g., Page & Gehlbach, 2017; Tackett et al., 2018) or students’ self-reported enrollment (e.g., Castleman & Page, 2014a). If these data sources understate college enrollment, then studies will overstate the extent of summer melt. We begin this article by showing how different ways of measuring both college intentions and college enrollment affect melt estimates. Specifically, we investigate the extent to which particular measurement decisions may lead researchers to overstate or understate summer melt.
The Causes of Summer Melt
Research suggests that summer melt occurs, in part, because students encounter difficulties completing the college enrollment process after graduating from high school. Students may experience summer melt because they are unaware of various college enrollment requirements (e.g., submitting health forms or registering for orientation programs and courses) or because they experience challenges completing financial aid applications or verification processes (Castleman & Page, 2014b; Holzman & Hanson, 2020). Students may also procrastinate and miss or forget important deadlines (for a review, see Xu, 2021) or feel uncertain or anxious about whether they will succeed in college (Holland, 2019; Roderick et al., 2008). During the summer, students often have little or no access to school-based support such as college counselors or college access programs (for a review, see Castleman & Page, 2014b). This lack of school-based support may be particularly detrimental to students whose parents have limited college experience or financial resources. First-generation and low-income students are more likely to be identified for FAFSA verification (Holzman & Hanson, 2020; Lee et al., 2021), may have fewer connections to peers or adults who are aware of—and thus can remind them about—important deadlines, and are less likely to have college-educated adults in their social networks who can allay their concerns about going to college.
We add to this literature by focusing on aspects of students’ experiences and perceptions during their senior year of high school that are associated with subsequent summer melt. Understanding risk factors for summer melt that go beyond the largely demographic and socioeconomic factors that have been identified in past research can potentially help school staff and college access programs design effective preventative programs to support students while they are still in high school.
Interventions That Aim to Reduce Summer Melt
Much of the literature on summer melt consists of evaluations of various types of interventions during the summer after high school graduation. These evaluations suggest that both high-touch interventions that provide college counseling services over the summer months and low-touch interventions that provide information and reminders via text messages can reduce melt for some students. For example, Castleman et al. (2012) found that a sample of predominantly low-income Latinx and Black students who were randomly assigned to and received summer counseling supports were less likely to experience summer melt. Castleman et al. (2015) found similar effects for Latino students randomly assigned to receive counseling services over the summer, though they did not find positive effects for any other student subgroups. Castleman and Page (2017) found that low-income and first-generation students randomly assigned to receive text message reminders about upcoming college-related deadlines were more likely to enroll in college the following fall. Castleman and Page (2015) argue that students whose schools offer fewer counseling services during the academic year may especially benefit from summer text message and peer counseling interventions. Our analyses inform this literature by identifying additional risk factors for melt that summer interventions could potentially target. For example, if aspects of students’ behavior (such as school absenteeism) or college plans (such as whether they plan to attend part-time) are strongly associated with melt, summer interventions could potentially focus their higher-touch counseling supports toward these students, who may have more complex needs, while delivering lower-touch interventions to students with fewer needs.
Data, Sample, and Measures
Data
We use survey and administrative data from the Los Angeles Unified School District (L.A. Unified). Our main data source is the district’s 2018–2019 College and Career Readiness Survey (CCRS), a senior exit survey that asks students about the colleges to which they applied and were accepted, the college they planned to attend, and the types of help they received with the college application process. 1 The district administered the survey to all 12th graders enrolled in district-operated 2 schools between May 2 and June 7, 2019. 3
Fifty-nine percent of 12th graders answered at least one survey question. Response rates for students from alternative schools and special education centers were particularly low (32% and 0%, respectively). Once we exclude those students from our sample, the response rate is 64%. Following the procedure described in Valliant and Dever (2018), we create survey weights to adjust for survey nonresponse. Specifically, we predict nonresponse using three-level logistic mixed effects models 4 that nest students in their high schools and small school programs (e.g., magnet schools, dual language programs) and divide students into 75 classes (average class N = 303) based on their propensity for response. We then construct inverse probability weights for each class and calibrate the weights using iterative proportional fitting (Kolenikov, 2014).
We link students’ responses from the senior exit survey to the following additional student-level, district datasets: (a) administrative data from students’ kindergarten through 12th-grade years, which describe their demographic characteristics, family background, academic achievement, school-related behavior, and course-taking; (b) students’ responses to the districts’ annual school climate survey, which describes students’ educational expectations; (c) California Student Aid Commission (CSAC) data on students’ FAFSA submission; 5 and (d) National Student Clearinghouse (NSC) and California Partnership for Achieving Student Success (Cal-PASS Plus) data on students’ college enrollment. The NSC is an organization that collects college enrollment and degree verification data from most postsecondary institutions. The postsecondary institutions that participate in the NSC represented 97% of college enrollments during the period of our study (NSC, 2023a). We supplement the NSC data with Cal-PASS Plus transcript data that describe California community college students’ course taking, which we use to identify students who enrolled in a California community college following high school graduation. 6
Sample
Our analytic sample (N = 12,413) includes spring high school graduates who (a) reported the 4-year colleges to which they were accepted or the 2-year college at which they had registered or planned to register, (b) reported the college they planned to attend, (c) reported they planned to enroll in college the year after high school graduation and planned to start college during the summer or fall terms (or were unsure about what term they would start), (d) had nonmissing NSC or Cal-PASS Plus data on whether they enrolled in college the fall after high school graduation, 7 and (e) had nonmissing outcome measures.
Table 1 describes the district’s 2019 graduates and the analytic sample. It shows that the students in our sample were primarily Latinx (78%), low income (88%), 8 and multilingual (72%). These students scored 0.21 standard deviations higher, on average, than the typical student in the district on the 11th-grade English and math standardized tests (the Smarter Balanced Assessment or SBAC), which makes sense because all of the students in the sample intended to enroll in college immediately following high school graduation. Nearly two-thirds of the students in our sample passed at least one semester of Advanced Placement (AP) or International Baccalaureate (IB) coursework, and slightly more than a third passed at least one AP or IB exam. More than half of the students (53%) completed the college preparatory coursework (“A-G” courses) required to be eligible to attend a public, 4-year college in California. 9
Descriptive Statistics, Overall and by Type of Intended College
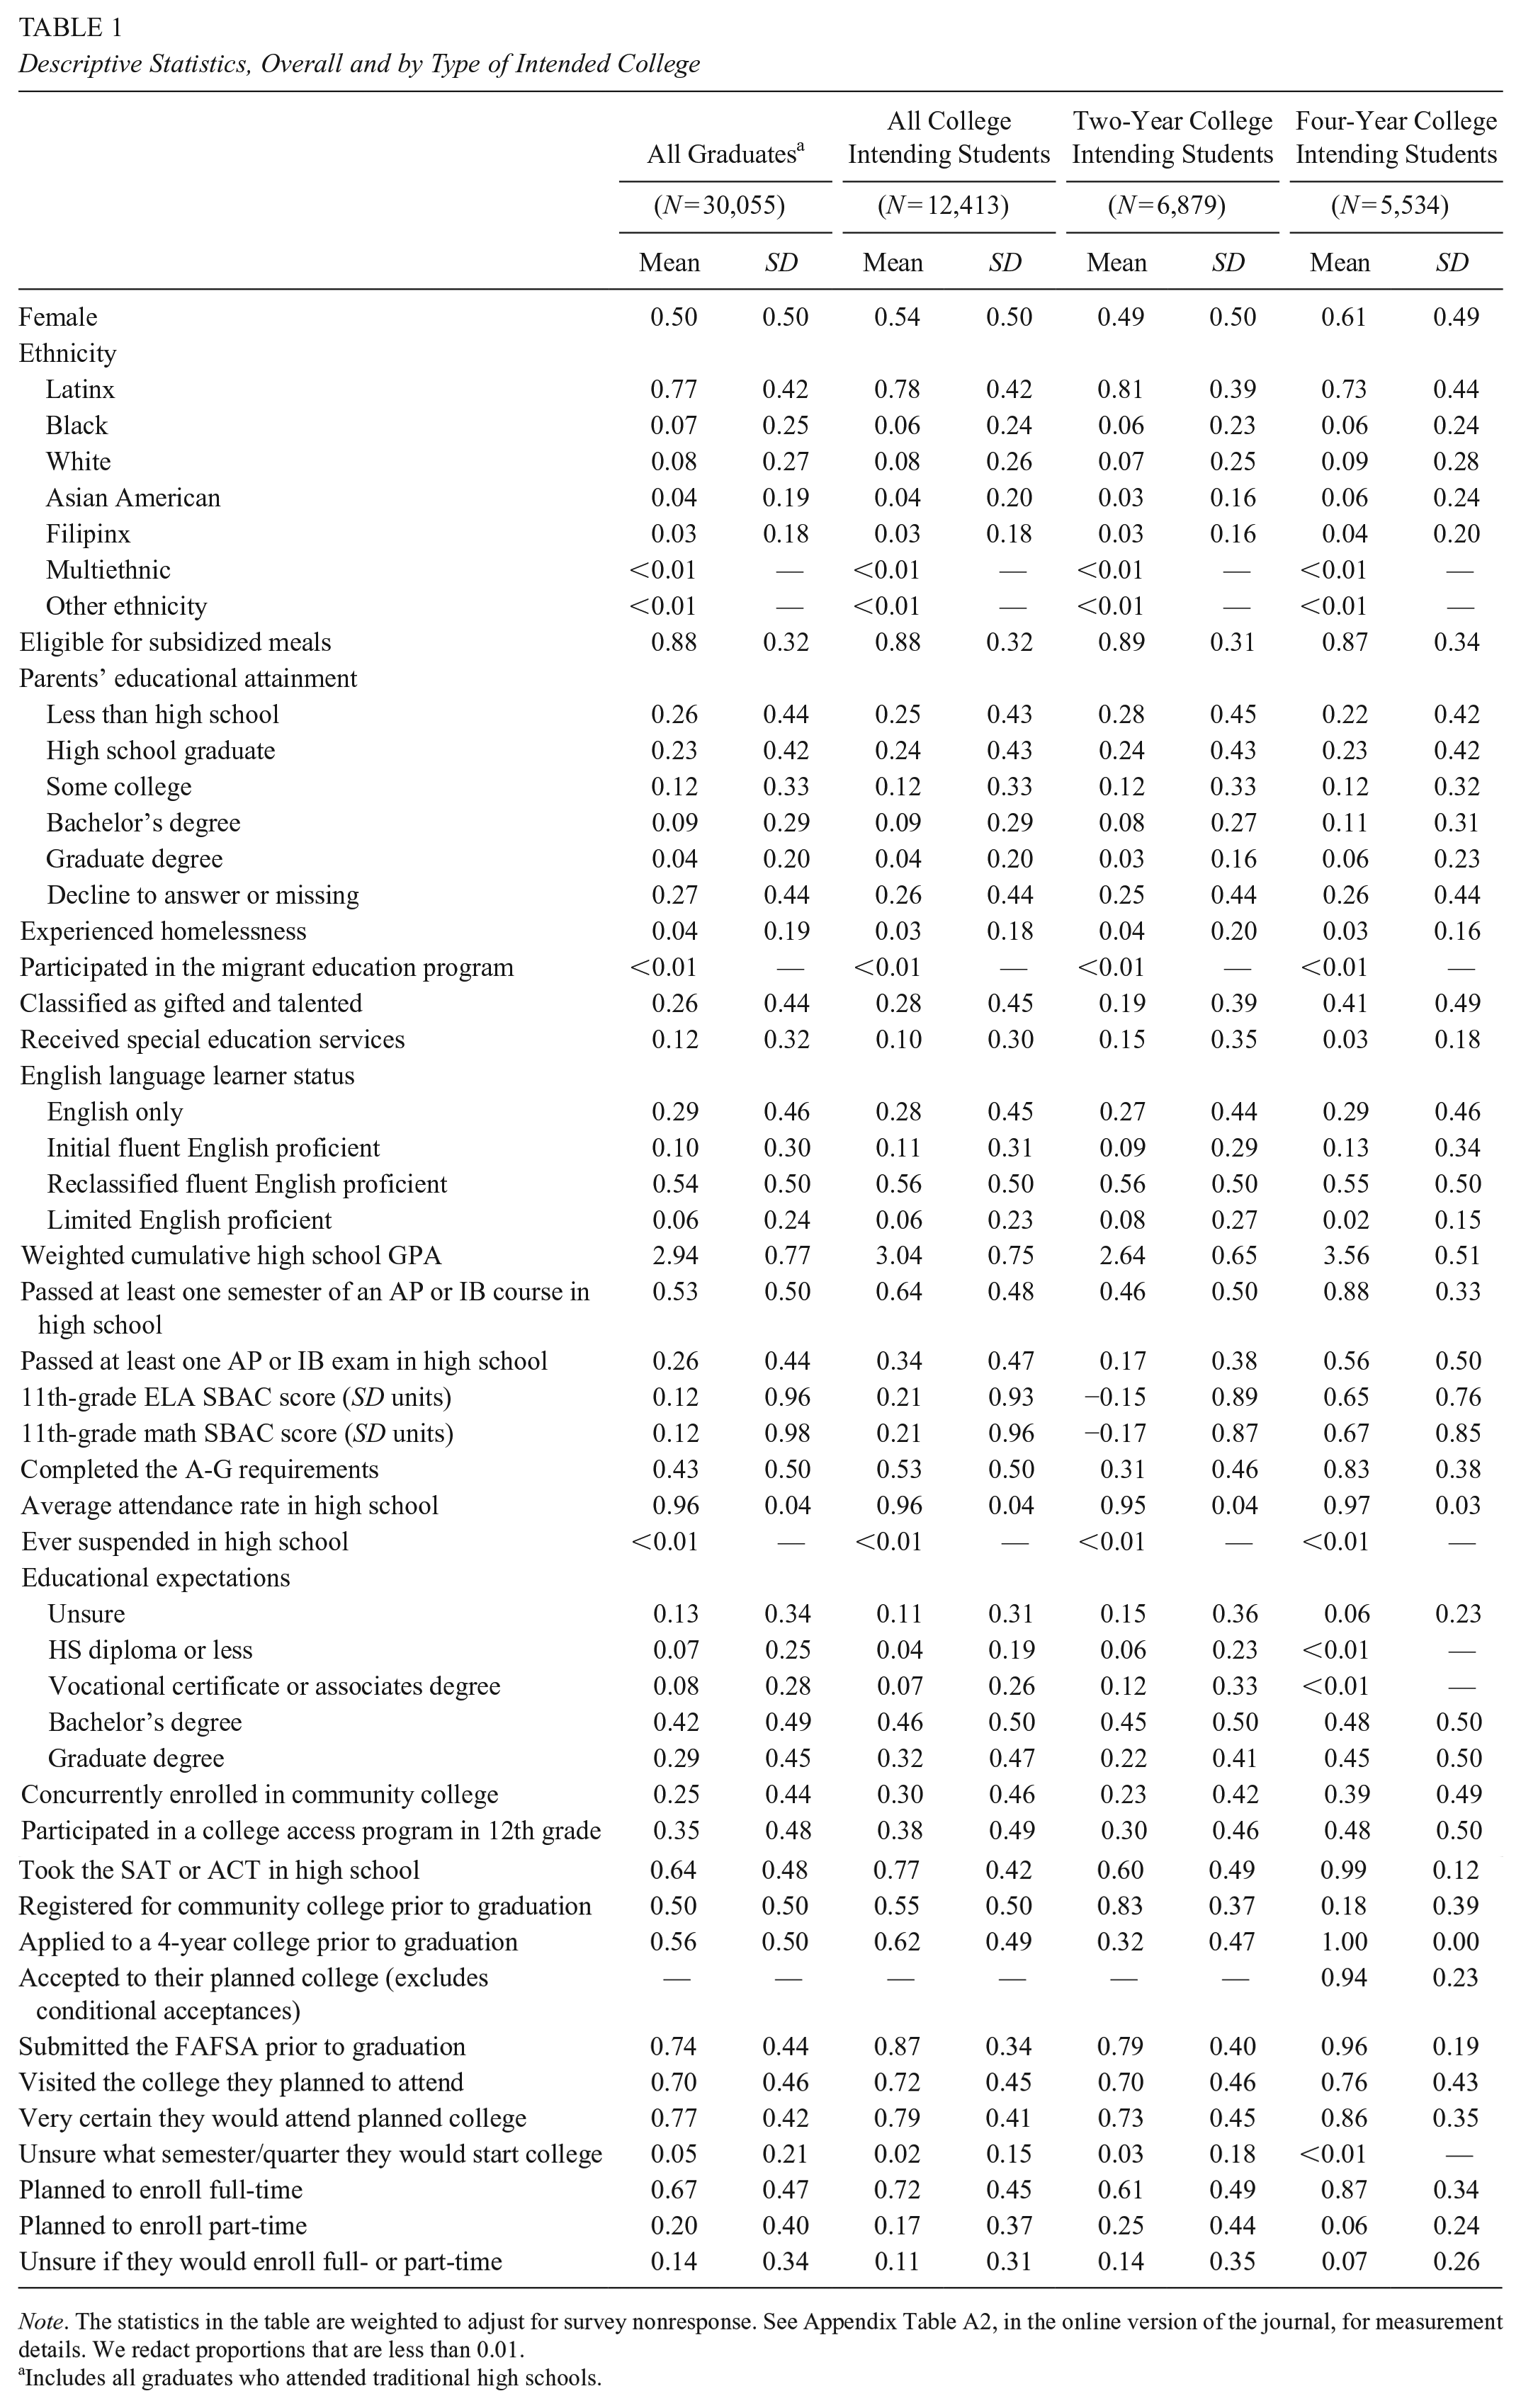
Note. The statistics in the table are weighted to adjust for survey nonresponse. See Appendix Table A2, in the online version of the journal, for measurement details. We redact proportions that are less than 0.01.
Includes all graduates who attended traditional high schools.
Table 1 also shows that students in the sample who planned to attend 2-year colleges differed from their 4-year college intending peers. Two-year college-intending students were more likely to be male (12 percentage points [pp]), Latinx (8 pp), eligible for subsidized meals (3 pp), to have parents who did not graduate from high school (5 pp), to have received special education services (12 pp), and to have been classified as limited English proficient in 12th grade (6 pp). They were less likely to be white (2 pp) or Asian American (4 pp), to have parents who held a bachelor’s (3 pp) or graduate degree (3 pp), or to be classified as gifted and talented (22 pp).
Two-year and 4-year college-intending students differed most in their academic preparation. Two-year college-intending students had considerably lower 11th-grade ELA (0.80 SD) and math (0.84 SD) SBAC scores and cumulative weighted GPAs (0.92 GPA points) and were substantially less likely to have passed AP or IB coursework (42 pp) or an AP or IB exam (38 pp) or to have completed the A-G requirements (52 pp). 10 These differences in students’ demographic backgrounds and academic preparation, and in 2- and 4-year institutions’ admissions and enrollment processes, suggest that the predictors of summer melt may differ depending on whether students are 2- or 4-year college intending. Thus, in addition to examining summer melt among all students (i.e., “overall” melt), we also examine melt among 2-year and 4-year college-intending students separately.
Measures
Predictors
Table 1 shows all of our student-level predictors (see Appendix Table A2, in the online version of the journal, for measurement details). These predictors include demographic characteristics (e.g., gender, ethnicity 11 ); family background characteristics (e.g., eligibility for subsidized meals, parents’ educational attainment, indicators of whether students experienced homelessness or were the children of migrant workers 12 ); school academic program (e.g., receiving special education services, being identified as gifted and talented, and English-language learner status); academic achievement and course taking (e.g., 11th-grade standardized test scores, weighted cumulative grade point average, passing AP or IB coursework and exams); school engagement (average high school attendance rate); school-related behavior (suspension); and college eligibility (completed the “A-G” requirements).
We also measure several aspects of students’ commitment to attending college, including their educational expectations; participation in a college access program; concurrent enrollment at a community college while in high school; completion of tasks related to college exploration, admission, and affordability; certainty about attending their planned college; the semester they intended to start college (summer, fall, or unsure); and planned enrollment intensity (full-, part-time, or unsure). The measures of students’ educational expectations and participation in a college access program come from the district’s annual school climate survey. 13 We measure students’ concurrent enrollment using district-provided Cal-PASS Plus community college transcript data and district administrative data. To measure students’ completion of college-related tasks, we use indicators of whether they took the SAT or ACT during their high school years (from administrative data), submitted a 4-year college application or registered at a 2-year college (from the senior exit survey), submitted the FAFSA or California Dream Act application (from administrative data), or visited the college they planned to attend prior to high school graduation (from the senior exit survey). The senior exit survey asked students how certain they were that they would attend their planned college, and we code that variable into two categories (“very certain” compared to “not certain” or “somewhat certain”).
Outcome Measures
We construct four summer melt measures for our analyses. Most prior studies have examined melt among all college-intending students, irrespective of whether they planned to attend 2- or 4-year colleges (e.g., Castleman & Page, 2014a; Castleman et al., 2014; Holzman & Hanson, 2020; cf. Sanchez, 2020). Following this literature, we construct a measure of “overall” melt (i.e., melt among 2- and 4-year college-intending students). We also construct separate measures of melt for 2-year and 4-year college-intending students, respectively. For the 4-year college-intending students, we measure whether they did not enroll in any college and whether they enrolled in a 2-year college rather than their planned 4-year college.
For the overall melt measure, we classify students as college intending if they reported they planned to attend a specific college and either indicated they had applied to and been accepted at the 4-year college they planned to attend (including being conditionally accepted) or they had registered or planned to register at the 2-year college they planned to attend.
For our more specific measures of melt, we classify students as 4-year college intending if they reported they planned to attend a specific 4-year college and indicated they had applied to and been accepted at that college (including being conditionally accepted). We classify students as 2-year college intending if they reported they planned to attend a specific 2-year college and that they had registered or planned to register at that college. We determine whether colleges are 2- or 4-year colleges based on their classification in the Integrated Postsecondary Education Data System (IPEDS). 14
We define enrolling in college the fall after high school graduation as having enrolled by October 31, 2019, per NSC or Cal-PASS Plus. 15 For our measure of whether 4-year college-intending students enrolled in a 2-year college, we define enrolling in a 2-year college as having enrolled in a 2-year college, per the IPEDS, by October 31, 2019.
To examine how different ways of measuring melt affect melt estimates, we also construct four additional measures of “overall melt” that have been used in prior studies. We describe those measures in more detail below and in Appendix Table A3 in the online version of the journal.
Analytic Approach
To examine the association of student characteristics with each of our melt outcomes, we estimate a series of weighted mixed effects models that nest students in schools. For ease of interpretation, we report results from the linear models, where

In addition, we estimate weighted logistic mixed effects models (see Appendix Tables A8–A11 in the online version of the journal) and discuss in the text only those results that are statistically significant in both the linear and logistic models. Both types of models are weighted to adjust for senior exit survey nonresponse.
We estimate a series of nested models. Our main tables show the association of demographic characteristics with melt (Model 1) and then add measures of students’ academic preparation, school-related behavior, and commitment to college (Model 2). We show a more extensive set of models in the online appendix. Because a large percentage of students in our analytic sample have missing data for one or more variables in our models (20% are missing on one variable, 18% on two variables, 8% on three variables, and 1% on four or more variables), we impute missing data for our predictors using multivariate imputation with chained equations. 16
Findings
Measuring Summer Melt
First, we compare our estimate of overall melt with estimates from four studies that use different definitions of whether students are “college intending.” We selected comparison measures that studies described with enough detail for us to replicate them and that used variables that exist in our data. 17
Table 2 shows that estimates of overall summer melt vary only a little, from 18% to 21%, when measured using different definitions of whether students are “college intending.” Not surprisingly, broader measures, such as the Kirkman et al. (2022) measure, which only requires college-intending students to have reported that they planned to attend college the year after high school graduation, produce higher melt estimates. More restrictive measures, such as the Castleman and Page (2014a) measure, which requires college-intending students to have reported they had been accepted to or had registered for at least one college and submitted the FAFSA (or, if they were high income, planned to attend college the following year), produce lower melt estimates.
Comparison of Summer Melt Definitions

If the authors did not report the cut-off date they used for determining whether students enrolled in college the fall after high school graduation, we assume the authors used the NSC’s definition for fall enrolment, October 31st.
We limit our sample of college-intending students to those who reported they planned to start college the summer or fall after high school graduation or that they planned to attend college the year after high school graduation but were unsure what semester they would start college.
The report does not state the deadline by which students need to have submitted the FAFSA. Thus, we classify students as college intending if they submitted the FAFSA by November 1st, the deadline the authors state for having enrolled in college.
Although estimates of summer melt in our sample vary only slightly depending on different definitions of “college intending,” estimates vary dramatically depending on the data source used to measure college enrollment. Figure 1 displays estimates of overall melt, and melt among 2- and 4-year intending students, measured two ways: with student-level NSC data and with a combination of student-level NSC and student-level Cal-PASS Plus transcript data. Overall melt estimates are nearly twice as large when we rely solely on student-level NSC data to measure students’ college enrollment (35% compared to 19%). This difference stems largely from dramatically different melt estimates for 2-year college-intending students when measured solely with student-level NSC data (54%) instead of with NSC and Cal-PASS Plus combined (27%). 18

Rate of summer melt by melt type and data source.
These very different estimates are attributable to high Family Educational Rights and Privacy Act (FERPA) block rates at the community colleges most commonly attended by L.A. Unified graduates (see Dynarski et al. [2015] for a discussion of the impact of FERPA blocks and other factors that affect the NSC data’s coverage and accuracy). Nine of the 15 community colleges that students in our sample most often planned to attend had FERPA block rates at or above 50% during the period of our study (see Appendix Table A12 in the online version of the journal). When college students FERPA block (i.e., notify their postsecondary institution that they do not want information about their enrollment shared with the NSC), those students appear as non-college-goers in the NSC student-level data files that researchers typically use to measure summer melt (NSC, 2017, p. 5).
FERPA block rates vary considerably across and within states, regions, and cities (NSC, 2023b). In 2019, the year our sample enrolled in college, NSC reported state-wide overall (i.e., 2- and 4-year combined), 2-year, and 4-year FERPA block rates that ranged from close to 0% to 11%, 17%, and 18%, respectively. New Jersey had the highest overall and 4-year block rates and Arizona had the highest 2-year block rate. Additionally, 250 institutions’ average block rates during this period were greater than 10% (NSC, 2023b), and in some cities, several institutions’ block rates were particularly high. To take one example, the seven colleges that made up the Dallas County Community College District (now called Dallas College) had block rates that ranged from 44% to 54% (NSC, 2023b). Our results illustrate that in local contexts where FERPA block rates are high, melt estimates based on NSC student-level data alone will be overstated. Measuring enrollment with data provided by colleges or state data systems, such as the data we use from Cal-PASS Plus, can substantially improve the accuracy of melt estimates. 19
Student Characteristics Associated With Summer Melt
Next, we examine the correlates of summer melt. Table 3 shows how our predictors are associated with overall melt, while Table 4 shows associations with specific types of melt (i.e., melt among 4-year intending students who did not enroll in any college, melt among 4-year intending students who enrolled in a 2-year college, and melt among 2-year intending students). We begin by discussing how student demographics, academics, and behavior are associated with melt. We then discuss how various measures of students’ commitment to college are associated with melt, conditional on students’ demographic and academic characteristics. Although we take into account many predictors of melt, we caution readers not to interpret our results as causal, a point to which we return in the discussion. For ease of exposition, we emphasize results for overall melt, but point out instances in which the results for 2- or 4-year college-intending students diverge from the overall results.
Nested Linear Mixed Effects Models Predicting Overall Summer Melt (Includes 2- and 4-Year College-Intending Students)

Note. HS = high school; the statistics in the table are weighted to adjust for survey nonresponse. Unweighted N = 12,413.
p < .05. **p < .01. ***p < .001.
Nested Linear Mixed Effects Models Predicting Summer Melt, by Melt Type

Note. HS = high school; the statistics in the table are weighted to adjust for survey nonresponse. Unweighted 4-year college-intending N = 5,534. Unweighted 2-year college-intending N = 6,879.
p < .05. **p < .01. ***p < .001.
Demographics, Student Program, Academics, and School-Related Behavior
Social class
Replicating findings from past studies (e.g., Castleman & Page, 2014a; Daugherty, 2012), our results show that students from socioeconomically disadvantaged backgrounds were more likely to experience summer melt than their more advantaged peers (see Table 3).
Specifically, Model 1 shows that students whose parents did not complete a high school degree were three percentage points more likely to melt than peers whose parents who completed high school. Note that the bivariate associations of single measures of social class with melt, including eligibility for subsidized meals, are larger—see Appendix Table A4 in the online version of the journal for details. Model 2 suggests that the association between parents’ educational attainment and overall melt is attributable to differences in students’ academic preparation. In contrast, the association between eligibility for subsidized meals and overall melt persists even among students who had similar academic preparation and appeared to be equally committed to going to college and is driven by 4-year college-intending students (see Table 4).
Gender
Girls were about five percentage points less likely than boys to experience summer melt, but our models indicate that the association between gender and melt is attributable to gender differences in commitment to college-going (see Table 3 and Appendix Table A4 in the online version of the journal).
Race and ethnicity
Similarly, Table 3 shows that white and Asian American students were less likely to melt than their Latinx peers, but these differences disappear once we compare students with similar academics and behavior. Among 4-year college-intending students who had similar academic preparation, school-related behavior, and commitment to college-going, however, Black students were about 4 percentage points less likely to melt than their Latinx peers, and Filipinx students were about 12 percentage points more likely to melt than their Latinx peers (see Table 4).
Student program
Students who were classified as “Limited English Proficient” (LEP) during the spring of 12th grade were about eight percentage points more likely to experience summer melt than otherwise similar students (see Table 3), and these melt differences were particularly pronounced for 4-year college-intending LEP students (see Table 4). These melt disparities may arise because LEP high school students are more likely to be recent immigrants with less knowledge of the college matriculation process. It is also possible that these melt disparities result from LEP students reporting their college intentions less accurately because they are still in the process of learning English.
Academics
Students with stronger academic preparation, including higher standardized test scores, AP course taking, and A-G course completion, were less likely to experience summer melt (see Appendix Table A4 in the online version of the journal). But those associations mostly become statistically insignificant once we compare students with similar educational expectations and similar college-related behaviors and commitments (see Model 2 in Table 3). The exception is that 4-year college-intending students who did not complete the A-G requirements, and thus were not eligible to attend CSU or UC campuses, were more likely to enroll at a 2-year college (3 pp) than otherwise similar peers.
Attendance
We find strong and consistent evidence that college-intending students with lower high school attendance rates were less likely than otherwise similar students to enroll in college in the fall after high school graduation (see Tables 3 and 4). College-intending students who were chronically absent (i.e., those with annual attendance rates below 91%) were about five percentage points more likely to melt than otherwise similar peers with satisfactory attendance (i.e., ≥96%). Students with “at risk” attendance (i.e., those with attendance rates between 91% and 95%) were four percentage points more likely to melt than otherwise similar peers with satisfactory attendance. These results indicate that missing school is an important risk factor for summer melt, which is in some ways unsurprising given that nonenrollment in college can be thought of as a more extreme instance of absenteeism.
Commitment to College-Going
Several measures of college-intending students’ commitment to college-going, including FAFSA completion, students’ certainty about their intended college, students’ planned enrollment timing and intensity, and students’ concurrent enrollment in college classes, are associated with summer melt.
FAFSA completion
We find strong and consistent evidence that students who completed the FAFSA were substantially less likely to experience summer melt than otherwise similar students. 20 Students who completed the FAFSA before high school graduation were about 14 percentage points less likely to melt than otherwise similar peers (see Table 3), and these results hold for both 2- and 4-year college-intending students (see Table 4). The negative association between FAFSA completion and melt probably stems from at least two causes. First, FAFSA completion serves as a proxy for students’ and families’ commitment to the student enrolling in college. Second, and probably more important for our predominantly low-income sample, FAFSA completion typically leads to financial aid receipt, which substantially reduces financial barriers to college enrollment.
Certainty about their intended college
We also find consistent evidence that students who expressed certainty about the college they planned to attend were less likely to melt. Two-year college-intending students who reported on the senior exit survey that they were very certain they would attend their planned college were seven percentage points less likely to melt than otherwise similar students who reported being somewhat certain or not certain (Table 4). Four-year college-intending students who were very certain they would attend their planned college were five percentage points less likely to melt to no college and seven percentage points less likely to melt to a 2-year college (see Table 4).
Planned enrollment timing and intensity
We find strong evidence that students who were unsure about the semester they planned to start college and those who planned to enroll part-time were more likely to melt. The association between summer melt and students’ uncertainty about the semester they would start college is driven entirely by 2-year college-intending students (see Table 4). Students who expressed uncertainty about the semester they planned to start college may have been less committed to attending college or lacked a concrete plan for college attendance. Both 2- and 4-year college-intending students who planned to attend college part-time were about nine percentage points more likely to melt than otherwise similar peers (see Table 4). Students’ plans to attend college part-time may reflect less commitment to college-going. They may also reflect greater concerns about the financial costs of attendance and the need to offset those costs by working, or concerns about balancing family obligations with college coursework.
Two-year college registration and concurrent enrollment in a two-year college
Behaviors that may indicate students are connected with or committed to a 2-year college—taking community college courses while in high school or registering for a 2-year college—are associated with summer melt in different ways depending on whether students say they intend to enroll in a 2- or a 4-year college. Table 4 shows that when 2-year intending students had registered for a 2-year college by May 1 of their senior year, they were five percentage points less likely to experience summer melt than otherwise similar peers. Likewise, when 2-year-intending students had already concurrently enrolled in 2-year college courses during high school, they were 14 percentage points less likely to experience summer melt than otherwise similar students. In contrast, when 4-year college-intending students had registered for a 2-year college, they were three percentage points more likely than otherwise similar students not to enroll in college and two percentage points more likely to enroll in a 2-year college (see Table 4). Likewise, when 4-year college-intending students were concurrently enrolled in 2-year college courses during high school, they were one percentage point more likely than otherwise similar students to enroll in a 2-year college rather than their intended 4-year college (see Table 4).
Discussion
Using data from the Los Angeles Unified School District, a large, urban district where most students are low-income, first-generation college students of Latinx heritage, this article makes several contributions to the literature on summer melt. First, we find that decisions about how to measure summer melt can affect the accuracy of melt estimates. We show that measures of college enrollment that use student-level data from the NSC may dramatically overstate the extent of summer melt in schools, school districts, and states where a large percentage of students block access to information about their college enrollment. In those contexts, information from the colleges and universities themselves, or from state data systems that have compiled that information, is essential for accurately estimating the extent of summer melt. Additionally, our results indicate that some ways that researchers have classified students as “college intending” in past studies may mask potential correlates of melt. In particular, we find that some components of prior studies’ definitions of “college intending” are associated with summer melt (e.g., completing the FAFSA and registering for college), which suggests that studies that aim to identify students who are at risk of melt, so that they can better support them, may benefit from using broader definitions of college intentions.
Note, though, that a limitation of our study is that we only measure melt based on whether students planned to enroll in college in the fall after high school graduation and whether they enrolled that fall. We do not measure melt among students who planned to delay their enrollment (say, by a semester or a year) or among students who enrolled later than the fall (i.e., within 1 or 2 years of high school graduation). In our sample, the COVID-19 pandemic and colleges’ shift to remote instruction affected the spring term of our sample’s first year in college and the entire subsequent school year. As a result, we only measure melt as of the fall, pre-COVID, semester. Future research should, however, explore how melt estimates differ among students who delay college enrollment.
This article also contributes important information about student risk factors for summer melt, which can potentially inform schools’ efforts to target college counseling supports and preventative programs to those students most in need. Our results show that students with moderate or high rates of absenteeism during high school are considerably more likely to melt than otherwise similar peers, regardless of whether they plan to attend a 2- or 4-year college. These results imply that it could be beneficial for college counseling staff to collaborate more with the school staff responsible for student attendance to understand why students have been absent and help reduce barriers to their attendance in high school. Not only are such efforts likely to improve students’ engagement with high school, but our results suggest that they may also facilitate college-intending students’ successful transition to college.
Our results also highlight the critical importance of ensuring that students complete the FAFSA well in advance of high school graduation. If 12th graders do not submit the FAFSA before they graduate, they may have limited access to adults who can help them complete their application during the summer months because school-based supports, such as counselors, are not typically available during the summer break (Arnold et al., 2009; Castleman & Page, 2014b). In addition, students who file the FAFSA late in the school year or during the summer and are selected for verification may not have enough time to complete the required paperwork prior to the start of the fall semester. For example, at Santa Monica College (SMC, 2024) and California State University, Northridge (CSUN, 2024), the 2- and 4-year colleges most often attended by L.A. Unified graduates, it can take up to 4 or 9 weeks, respectively, for the financial aid office to process students’ verification paperwork. Moreover, 4-year college-intending students may be particularly disadvantaged by submitting the FAFSA in the late spring or summer because late-filers receive, on average, less institutional aid (McKinney & Novak, 2015; Page et al., 2020), and in California, are not guaranteed state financial aid (CSAC, 2024), meaning they might not receive enough aid to attend college. Our results suggest that identifying students who have not completed the FAFSA and connecting them with school or community-based resources to assist them with the process may increase their chances of successfully enrolling in college (see, e.g., Bettinger et al., 2012). Our results also suggest that recent state policies mandating FAFSA completion, in California 21 and elsewhere, may help reduce summer melt (Deneault, 2023), especially if those policies are designed to encourage early FAFSA completion.
We also find that students who are less certain about whether they will attend their planned college are more likely to melt than otherwise similar peers. Students’ uncertainty probably stems from a wide range of concerns—including being able to pay for housing or food, accessing transportation to campus, paying tuition or for textbooks, doing well in classes, and fitting in socially. Identifying and supporting students who are less committed to their planned college may require a personalized approach from high school counseling staff and/or college access organizations, starting after students have “decided” on their planned college, and perhaps extending through the summer following high school graduation. Future research should examine the sources of students’ uncertainty about their planned college, how to help high school students make college plans that are more likely to materialize, and how to support graduating seniors who perceive their planned college option as infeasible or undesirable.
Our findings also indicate that high schools may need to target some supports differently to 2- and 4-year college-intending students. Two-year college-intending students who have not registered at a 2-year college prior to high school graduation are substantially more likely to melt than otherwise similar peers. Ensuring that students successfully register prior to high school graduation, perhaps through collaborations with local community colleges, may increase the likelihood that they successfully enroll. Our results also suggest that helping students become familiar with 2-year colleges through concurrent enrollment programs may reduce the likelihood that students experience melt.
In California, it is critical that 4-year college-intending students complete their A-G requirements so that they are eligible to attend in-state, public 4-year colleges. We find that students who planned to attend a particular 4-year college, and had been admitted to that college, were more likely to melt to a 2-year college if they ended up not completing their A-G requirements by the time they graduated. These results imply that schools need ways to identify 4-year college-intending students who are not on-track to complete college eligibility requirements at the start of senior year or the end of the fall semester, as well as those students who are at risk of falling off track, so that school staff can provide opportunities for credit recovery or academic support to ensure that 4-year college-intending students remain eligible to attend their planned college.
Readers should keep in mind, however, that interventions developed to address the risk factors for summer melt that we identify in this article will need to be evaluated rigorously to assess whether they reduce melt. This is essential because some of our measures probably serve, at least in part, as proxies for other risk factors or school practices that we cannot measure with our data. For example, although we find that students who do not complete the FAFSA before high school graduation are more likely to experience melt, it is likely that, for some students, not completing the FAFSA is a symptom of other underlying challenges, such as parents’ lack of support for their child’s plan to attend college. To the extent that FAFSA completion reflects unmeasured risk factors, interventions that target only FAFSA completion will be less effective than our estimates imply.
To take another example, we find that 4-year college-intending students who registered at a 2-year college prior to high school graduation were more likely to melt and to enroll in a 2-year college than otherwise similar peers. But we do not know why these 4-year college-intending students registered at a 2-year college. One possibility is that they were less committed to attending a 4-year college, which might imply that interventions should address the sources of their uncertainty about 4-year college. Another possibility is that these students attended high schools that partnered with a local community college to register students, or that encouraged all students to register for 2-year colleges, which might imply that those school-based strategies do not benefit 4-year college-intending students. Future research should focus both on understanding these causal processes and on rigorously evaluating the effectiveness of interventions intended to address students’ risk factors for summer melt.
For schools to target support to college-intending students at risk for summer melt, school staff need relevant information about their students’ attendance rates, FAFSA completion, course progress, and college intentions so that they can monitor these measures throughout the college-going process and support students as needed. Districts might consider providing reports to schools that flag seniors who are at risk of experiencing summer melt based on data from administrative sources on attendance, course taking, grades, and FAFSA completion, as well as information on students’ college intentions and concerns gathered at key time points, perhaps via short surveys embedded in existing digital tools. Schools could also consider incorporating these information gathering efforts and other college-related tasks into in-class activities during senior year to ensure widespread participation. Because many schools have limited college counseling staff (Hurwitz & Howell, 2014) and counselors have limited time to assist students with the college admissions process (e.g., Bridgeland & Bruce, 2011; Phillips et al., 2017), schools will likely need additional counseling resources, or the involvement of school staff who are not counselors, to provide sufficient support for students at risk of experiencing summer melt.
Conclusion
Summer melt, which is more common among low-income high school students who would be the first in their families to attend college, reduces individuals’ socioeconomic mobility and contributes to educational inequities (Castleman et al., 2014). Our analyses indicate that melt estimates based on NSC data may overstate the extent of melt in contexts where FERPA block rates are high. We also highlight aspects of 12th graders’ behaviors and perceptions, including school absenteeism, FAFSA noncompletion, and doubts about their intended college, that are important risk factors for melt. These results suggest that schools should direct resources to students with these risk factors to ensure that their college-intending high school students become college students.
Supplemental Material
sj-xlsx-1-ero-10.1177_23328584241278314 – Supplemental material for Leaks in the College Access Pipeline: Examining Summer Melt in a Large Urban School District
Supplemental material, sj-xlsx-1-ero-10.1177_23328584241278314 for Leaks in the College Access Pipeline: Examining Summer Melt in a Large Urban School District by Carrie E. Miller, Meredith Phillips and Caitlin E. Ahearn in AERA Open
Footnotes
Acknowledgements
The authors presented a previous version of this article at the 2023 American Educational Research Association meeting. We are grateful to L.A. Unified district leaders for their collaboration, especially past and present members of the counseling and A-G Intervention teams, including Carol Alexander, Cindy Lin, Micki Vasquez-Hanh, Jesus Angulo, and Shelly Alavez. We also appreciate Mollie Rudnick’s thoughtful guidance about how to connect this research to educational practice. We are also grateful to Kyo Yamashiro for her contributions to the development of the College and Career Readiness survey. We thank this journal’s anonymous reviewers for excellent feedback that improved the article and Vanessa Morris for her assistance with cleaning the survey data. We thank the Mayer and Morris Kaplan Family Foundation for their financial support of this research. This research project is affiliated with the Los Angeles Education Research Institute (LAERI) and has benefited from its research and partnership infrastructure. The content is the sole responsibility of the authors and does not necessarily reflect the views of L.A. Unified or of LAERI.
Declaration of Conflicting Interests
The author(s) declared no potential conflicts of interest with respect to the research, authorship, and/or publication of this article.
Funding
The author(s) disclosed receipt of the following financial support for the research, authorship, and/or publication of this article: This research was supported by the Mayer and Morris Kaplan Family Foundation. The authors also benefited from computing support provided by the California Center for Population Research at UCLA (CCPR), which receives core support (P2C-HD041022) from the Eunice Kennedy Shriver National Institute of Child Health and Human Development (NICHD). The content is solely the responsibility of the authors and does not necessarily represent the official views of the Mayer and Morris Kaplan Family Foundation, the Eunice Kennedy Shriver National Institute of Child Health & Human Development, or the National Institutes of Health.
Open Practices Statement
Notes
Authors
CARRIE E. MILLER is the associate director and a senior research analyst at the Los Angeles Education Research Institute (LAERI) at UCLA, UCLA Luskin School of Public Affairs, Public Affairs Building, 337 Charles E. Young Drive, Los Angeles, CA 90095; email:
MEREDITH PHILLIPS is an associate professor of public policy and sociology at UCLA, UCLA Luskin School of Public Affairs, Public Affairs Building, 337 Charles E. Young Drive, Los Angeles, CA 90095; email:
CAITLIN E. AHEARN is a postdoctoral fellow at the Center on Poverty and Inequality at Stanford University, Stanford Center on Poverty and Inequality, 450 Serra Mall Wallenberg, Stanford, CA 94305; email:
References
Supplementary Material
Please find the following supplemental material available below.
For Open Access articles published under a Creative Commons License, all supplemental material carries the same license as the article it is associated with.
For non-Open Access articles published, all supplemental material carries a non-exclusive license, and permission requests for re-use of supplemental material or any part of supplemental material shall be sent directly to the copyright owner as specified in the copyright notice associated with the article.