
Abstract
Cross-national studies on socioeconomic status (SES) achievement gaps have focused on the size of the gap and given less attention to where in the SES distribution the achievement gap tends to be relatively large within a society, and whether this location varies across countries. We estimate the relative size of achievement gaps between students at the 50th and 10th percentiles versus the 90th and 50th percentiles of SES distribution within a society, using the Organisation for Economic Co-operation and Development (OECD) Programme for International Student Assessment (PISA) data. We find OECD countries vary in the size of the ratio of achievement gaps at lower-tail SES and upper-tail SES. Our multivariate analyses show that the ratio is positively associated with within-country patterns of economic inequality, measured by the ratio of income inequality and the ratio of segregation at lower-tail and upper-tail SES. We do not find evidence of an association between the achievement gap ratio and patterns of educational stratification.
Introduction
Educational inequality has been a central theme in sociology of education in the United States and cross-national research. However, much of the research has focused on the magnitude of educational inequality, for example, by examining the socioeconomic status (SES) achievement gap or the SES gradient, but less attention is given to educational (in)equality for whom.
Jencks’s (1988) typologies of conceptions of equal opportunity serve as the theoretical underpinnings of this study. Early on, Jencks pinpointed that “we (Americans) have dramatically different views about whom educational institutions should treat equally” (Jencks, 1988, p. 518). To illustrate this conceptually, he gives an example of how a third-grade reading class teacher with a strong belief in equal opportunity may have different choices of distributing her time and attention in a classroom. The teacher may (a) give all children equal time and attention (equal distribution of resources), (b) reward children who are trying hard and showing high achievement (meritocratic distribution of resources), or (c) compensate for any disadvantage at home by giving extra attention at school (compensatory distribution of resources). Jencks explains that American societies are always in quandary between meritocratic and compensatory conceptions of equal opportunity. Those who think that educational institution should award based on past academic effort will support meritocratic conception, whereas those that think that educational institutions should prepare runners for the next contest will hold compensatory conception of equal opportunity (Jencks, 1988). In contrast, Chen (2021) claims that, in Japan, injustice is perceived as eliminable through identical treatment, rather than through affirming the difference and treating differentially. In such society, equal opportunity may be defined as equal distribution of resources.
As Jencks (1988) noted, different conceptions of equal educational opportunity would have different practical consequences, because these norms may shape policymakers’ choices and teachers’ behaviors in the classroom. We might expect that if a society emphasizes meritocratic or compensatory conception, the society may have larger educational inequality at the upper part of the SES distribution than at the lower tail. Under meritocratic distribution of resources, high-performing children who would be rewarded and receive additional resources may be predominantly from high-SES families, because high-SES parents are more likely to have the resources to provide educational support to their children, which may result in larger achievement gap at upper-tail SES. Under compensatory distribution of resources, low-SES children may receive additional support early on, and the achievement gap at the lower end of SES may be minimized. On the other hand, if the society emphasizes equal distribution of resources, the society may have a larger achievement gap at the lower part of the SES distribution, because equal treatment may hinder providing extra support to those that most need it. Therefore, if countries have different prevailing conceptions and norms of equal educational opportunities, countries may differ in where the educational inequality is relatively large in the SES distribution.
Reardon’s (2011) study is insightful as our analytical model in empirically examining the issue of educational equality for whom, which Jencks (1988) highlighted. Reardon showed a shift in the income achievement gap in the United States over the last 50 years. He found that the association between income and achievement increased rapidly for children in upper-income families, whereas the association remained pretty stable for children in low-income families. Reardon suggests that this is a result of increasing parental investment in children’s cognitive development among the affluent families. However, research has not yet examined whether the larger achievement gap at the upper tail of income distribution that Reardon found in the United States is a global phenomenon.
In this article, we engage with the question of where in the SES distribution educational (in)equality is larger, by examining the relative size of achievement gaps at the lower-tail (50/10 percentile) versus upper-tail (90/50 percentile) of SES distribution within a society. We construct a measure that is comparable across countries, in order to compare the relative size and to explore the processes that may explain the cross-national variation. Our research questions are twofold: (a) To what extent does the relative size of achievement gaps at lower-tail and upper-tail SES differ across OECD (Organisation for Economic Co-operation and Development) countries? and (2) To what extent is the relative size of achievement gaps at lower-tail and upper-tail SES associated with economic inequality and educational inequality?
Prior Research
SES and Student Achievement
Family SES is known to be one of the strongest predictors of the child’s academic achievement. Since the Coleman Report (1966), the association between SES and achievement, or the disparity in test scores between high- and low-SES students, has been widely researched in the United States. More recently, there are many studies investigating the trends in this association. For example, Reardon (2011), using data from 12 nationally representative samples of U.S. students, shows that income achievement gap grew by approximately 40% from the mid-1970s to mid-1990s. An important point to highlight, especially for this study, is that Reardon also finds that the increasing association between family income and achievement for families above the median income level, rather than rising income inequality, is what partly explains the increase in the income achievement gap. In contrast to Reardon’s first finding, Hanushek et al. (2020) find that there is no substantial change in SES achievement gap, comparing the top and bottom quartiles of the SES distribution between mid-1950s and 2000, using data from PISA (Programme for International Student Assessment), Trends in International Mathematics and Science Study (TIMSS), and National Assessment of Educational Progress (NAEP), and a composite SES index from parents’ education and home possessions, though this conclusion has been questioned (Reardon, 2021).
The SES achievement gap or SES gradient has also been documented across a wide range of countries (OECD, 2019c). Since Heyneman and Loxley (1983), many studies have explored factors that explain the cross-national variation in the size of SES achievement gap or SES gradient. More recently, Chmielewski (2019) takes the cross-national studies a step further and combines 30 international large-scale assessments over 50 years, to examine the global trend of SES achievement gap. Using the 90th and 10th percentiles for three different measures of SES, parents’ education, parents’ occupation, and number of books at home, she finds evidence of increasing SES achievement gaps over the past 50 years in the majority of countries examined.
These comparative studies on SES and achievement, whether it be cross-sectional or longitudinal study, have advanced greatly in their methodologies, but they have limited their focus to the strength or the magnitude of the association. Past studies have focused on whether the SES achievement gap or gradient is growing or diminishing, or whether the SES achievement gap or gradient is larger or smaller than in other countries. To date, there has been little cross-national research investigating where in the SES distribution achievement gap tends to be relatively large within a society, and whether this location varies across countries. As mentioned earlier, Reardon (2011) finds that in the last 50 years, the income achievement association remains pretty stable for children in low-income families, whereas the association increases rapidly for children in upper-income families. As a result, the primary location of educational inequality in the United States has shifted from larger achievement gap at the lower tail to larger achievement gap at the upper tail of income distribution. Reardon suggests that with the increasing importance of educational success for future earnings and the increasing importance of test scores for educational success, higher-income families may be changing how they invest in children’s cognitive development. As a result, there may be increasing return to investment, or, put differently, a dollar of income may be buying more academic achievement than it did previously among the affluent families (Reardon, 2011). However, it remains to be tested whether the relatively large achievement gap at upper-tail income that Reardon finds in the current United States is a widespread phenomenon. In addition, the processes of why some countries may have larger achievement gap at upper-tail SES or why some countries may have larger achievement gap at lower-tail SES need to be explored.
National Characteristics and SES Achievement Gap
Comparative research on the association between SES and achievement have theorized and tested various factors that explain the cross-national variation in the association. Some have looked at economic development as an explanation of cross-national variation in SES achievement association. Heyneman and Loxley (1983) argued that because schooling is a scarce good and the power of educational attainment to determine occupational success is relatively large in economically less-developed societies, this scarcity and the tight link between education and occupation motivate students regardless of their family SES, and thus the SES achievement association may be less pronounced in less-developed countries. Using a variety of data, they conclude that the SES achievement association is a function of national economic development, measured by GDP (gross domestic product). Baker et al. (2002), however, revisited the debate using the TIMSS data, and conclude that the SES and achievement association is not conditioned by national economic development.
Others have investigated whether income inequality explains the cross-national variation in SES achievement association. Magnuson and Waldfogel (2008) explain that because income affects children’s education in many aspects, children of poor families may have access to fewer resources in and out of the home, may receive less warm and supportive parenting, may receive poorer childcare or health care, or may attend poorer-quality schools; any increase in income inequality will lead to an increase in inequality in educational outcome. Furthermore, based on relative deprivation theory, increase in income inequality could affect individuals at the bottom of income distribution to feel more deprived leading to poorer self-assessment, which would affect their educational outcome. Or, as the rich gain more financial resources, they could exert more power over the state spending decisions on education, which may magnify the inequality in student achievement (Magnuson & Waldfogel, 2008). Chmielewski and Reardon (2016) test this empirically, using the PISA data and comparing across 19 OECD countries, and find that countries with more income inequality, measured by Gini coefficient, tend to have larger income achievement gap, calculated by the 90th and 10th income percentile gaps. Chmielewski (2019), combining 30 international large-scale assessments, investigates whether the change in income inequality, measured by Gini coefficient, explains the cross-national variation in the change in SES achievement gaps, calculated by the 90th and 10th SES percentile gaps. She finds divergent associations by national income level: Among low-income countries, countries with increasing income inequality experience increasing SES achievement gap; but among high-income countries, countries with increasing income inequality experience decreasing SES achievement gap.
Some researchers have also studied segregation as an explanation of cross-national variation in SES achievement association. In the United States, parental focus on children’s schooling, together with rising income inequality, has led to growing economic segregation among neighborhoods and schools (Owens et al., 2016). Chmielewski and Reardon (2016) find that income achievement gaps are larger in countries with higher levels of income school segregation, and that this association is robust when controlling for other factors. In addition, they decompose the 90/10 income achievement gap into 50/10 income and 90/50 income achievement gaps, and find that segregation of high-income students significantly predicts 90/50 gaps, but segregation of low-income students does not significantly predict 50/10 gaps. Chmielewski and Reardon recognize that the mechanism underlying the association is not clear, and that it could be either inequalities in school quality or inequalities in environment and opportunities associated with residential segregation.
Educational Characteristics and SES Achievement Gap
Comparative research on social mobility has shown that institutional structures of educational system shape mobility process and occupational destinations. To classify educational systems, Allmendinger (1989) developed two typologies: “stratification,” the degree and type of tracking at the secondary level; and “standardization,” the degree to which the quality of education is standardized nationwide. Müller and Shavit (1998) added “vocational specificity,” the proportion of students leaving the educational system with credentials that are vocationally specific. These classifications have been useful concepts to show how educational “systems vary in their capacity to structure students’ entry into the societies’ stratification systems” (Kerckhoff, 2001, p. 7), and have been used extensively in comparative research. In this study, we focus on “stratification.” Stratification is often measured by how early tracking begins, the number of distinct tracks, the percentage of students in vocational tracks. Evidence shows that SES achievement gaps are larger in countries that allocate students to a large number of different educational tracks at an early age (Bol et al., 2014; Chmielewski & Reardon, 2016; Hanushek & Woessmann, 2006; Marks, 2005; Schütz et al., 2008). When students are differentiated into different curricular tracks, it can reproduce social inequality if lower-SES students are systematically assigned to lower tracks, and if the educational quality and academic environment, including teachers and students’ socio-psychological aspects, are lower in vocational tracks (Bol et al., 2014; Marks, 2005).
Another important educational characteristic highlighted in comparative research on achievement gap is inequality in school resources. Although most studies on school resources have focused on how variation in school resources is associated with student achievement, there are some studies that have examined how it relates to unequal student achievement. Akiba et al. (2007) investigated whether the gap in students’ access to qualified teachers is associated with larger achievement gap, using data from TIMSS. Based on cross-national analyses, they find that larger gaps in the percentages of high-SES students and low-SES students’ access to high-quality teachers do not predict larger achievement gaps between high-SES and low-SES students. On the other hand, Montt (2011), using the PISA data, finds that countries with larger variations in school resources, measured by the extent each school differs from the country mean in terms of material resources, the proportion of teachers with International Standard Classification of Education (ISCED) 5a degrees, and class size, is associated with larger variance in achievement. Park and Kyei (2011), using the International Adult Literacy Survey (IALS) data, investigated country-level factors that explain the adult literacy gap. Combining the analyses with the TIMSS data, they showed that cross-national variation in the literacy gap between more- and less-educated individuals is associated with the extent of inequality in school resources, measured by the Theil indices of between-school inequality in instructional materials, class size, teachers’ experience and certification, within a country. Countries with higher between-school inequality in school resources tend to have larger literacy gap by educational attainment. These studies are important as they highlight policy-relevant and manipulable factors that may mitigate reproductive processes between families and schools.
Methods
Data
We use data from the PISA 2012, PISA 2015, and PISA 2018 studies. PISA is an international assessment conducted by OECD. PISA tests 15-year-old students in reading, math and science, and administers student and school questionnaires. 1 PISA reading literacy requires students to locate information, understand the meaning, and evaluate and reflect on the content and form of the text. Math literacy includes areas of change and relationships, space and shape, quantity, and uncertainty. Science literacy includes areas of physical systems, living systems, and earth and space systems (OECD, 2019b). PISA is suitable for our analyses, because it has comparable measure of SES and academic achievement across OECD countries. Approximately 80 countries participate in the PISA study, but we limit the sample to OECD countries for our analyses, because many of the variables for national characteristics are only available for OECD countries.
Measure of Shape of Educational Inequality
In this study, we shed light on where the educational inequality tends to be large within the SES distribution of the society. We measure it by the relative size of achievement gap at the lower tail of SES distribution (50/10 percentile) and achievement gap at the upper tail of SES distribution (90/50 percentile). This indicator will show whom the society may need to target in pursuing educational equality.
For achievement, we use the core domain subject for each year, that is, math for PISA 2012 study, science for PISA 2015 study, and reading for PISA 2018 study. In each cycle of PISA, one of the core domains is tested in detail, consisting approximately one-half of the total testing time. For SES, we use ESCS (Economic Social-Cultural Status), which is a composite index of parent’s education, parent’s occupations, and an index summarizing a number of home possessions, constructed by OECD. 2
We estimate the achievement gap in two parts of the SES distribution for each country and each year, using the following methods described in Reardon (2011): (a) standardize test scores to a mean of 0 and standard deviation of 1 within each country and year; (b) create a SES percentile rank within each country and year; (c) fit a cubic function to capture the association between SES percentile rank and achievement; 3 and (d) use the fitted curve to estimate the difference in average test scores between the students at the 50th and 10th percentile of SES distribution, and the difference in average test scores between the students at the 90th and 50th percentile of SES distribution. 4
Using these two achievement gaps, we then calculate the natural logarithm of the ratio (50th and 10th SES percentile achievement gap / 90th and 50th SES percentile achievement gap) and its standard error. 5 Positive values indicate that there is more educational inequality in the bottom half of the SES distribution; negative values indicate that there is larger educational inequality in the upper part of the SES distribution.
We highlight two frameworks that underlie our concept. First, our approach highlights the nature of family SES as a within-country positional good rather than as an absolute good in terms of how it provides advantages to children. We take this approach because our aim is to understand patterns of within-country inequality in educational outcomes and their relationship to within-country patterns of inequality of resources or opportunities. Because within-country inequality depends on the within-country allocation of educational resources, experiences, and opportunities, a within-country analysis is most appropriate. To that end, we use within-country SES ranks rather than absolute SES in all our analysis. Our focus on the within-country positional role of SES does not imply, however, that SES does not potentially also operate as an absolute good—either within or between countries.
Secondly, we are not interested in the magnitude or the strength of SES achievement gap but, rather, where the achievement gap tends to be relatively large within the SES distribution of a society. More concretely, we are not interested in whether Country A has a larger SES achievement gap than Country B, but whether the ratio of lower- to upper-tail achievement gaps is larger in Country A than Country B. Countries with a small SES achievement gap may still have a large value in our analyses, if the size of achievement gaps differs greatly between the 50/10 and the 90/50 SES percentile.
To visualize how we estimate the ratio of interest, Figure 1 shows the association between reading score and family SES for two countries, United States and Japan, which have very different values in the ratio of interest. For each country, we fit a cubic function to model the association between average test scores and SES percentiles; from the fitted curve, we compute the expected test score at the 10th, 50th, and 90th percentile of SES for each country. In each panel of Figure 1, the dotted arrow shows the lower-tail (50/10 SES) achievement gap; the solid arrow shows the upper-tail (90/50 SES) gap. The overall 90/10 SES achievement gap is larger in the United States (0.98) than in Japan (0.79). The lower-tail gap is larger in Japan than the United States (0.50 to 0.43, respectively); while the opposite is true of the upper-tail gap (0.29 in Japan, compared to 0.55 in the United States). Thus, the ratio of the 50/10 to the 90/50 gap—our measure of the relative size of lower- and upper-tail achievement gaps—is much larger in Japan (1.72) than in the United States (0.78). The figure also makes clear that this ratio is a way of describing what we refer to as the “shape of educational inequality.” In Japan, the curve concave down and therefore steeper at the left (lower-tail SES); whereas in the United States, the curve is concave up and steeper at the right (upper-tail SES). Our analysis focuses on describing and understanding the variation across countries of the within-country “shape of educational inequality” hereafter.
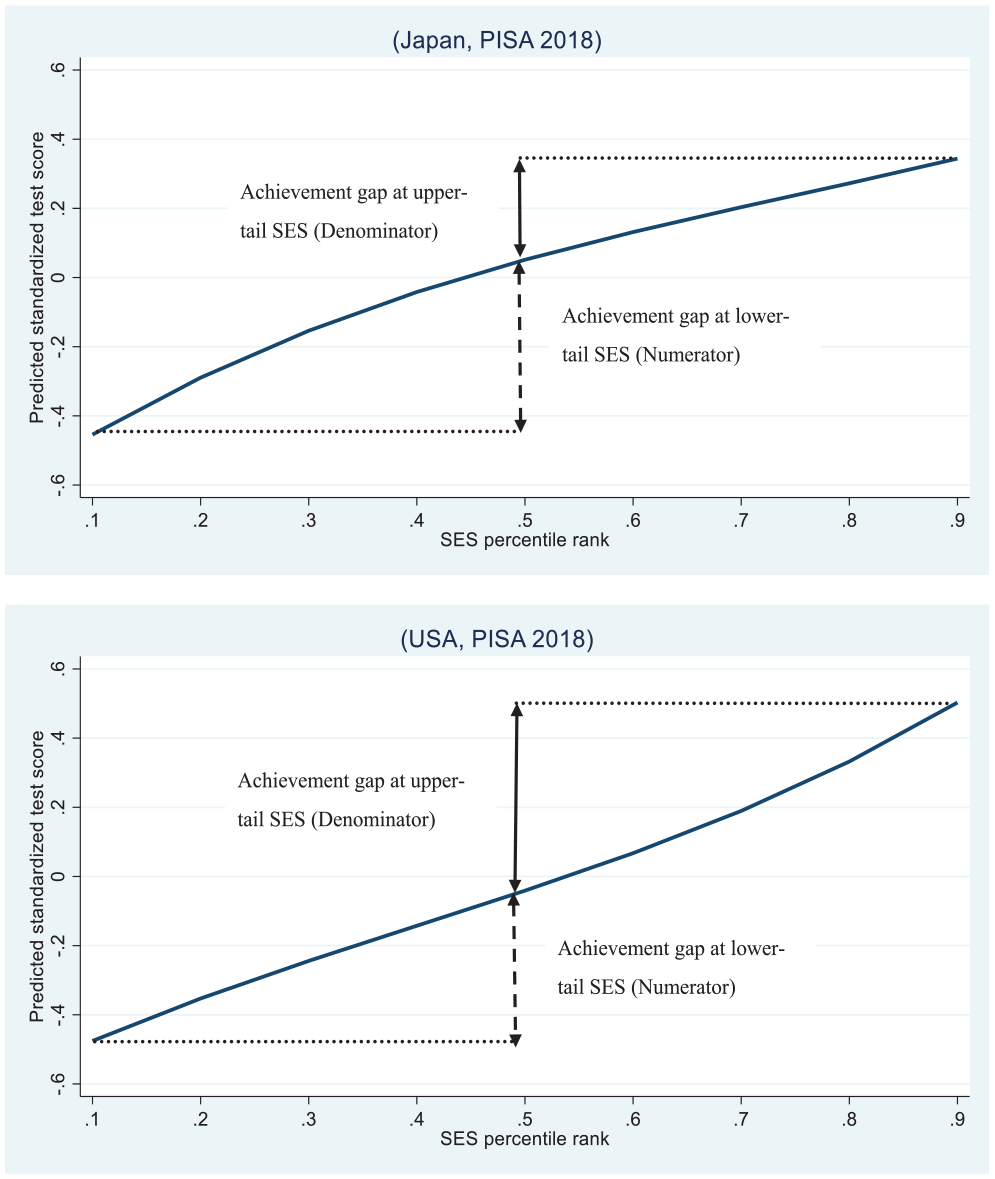
Estimated association between reading and family SES, PISA 2018.
Measures of National Characteristics
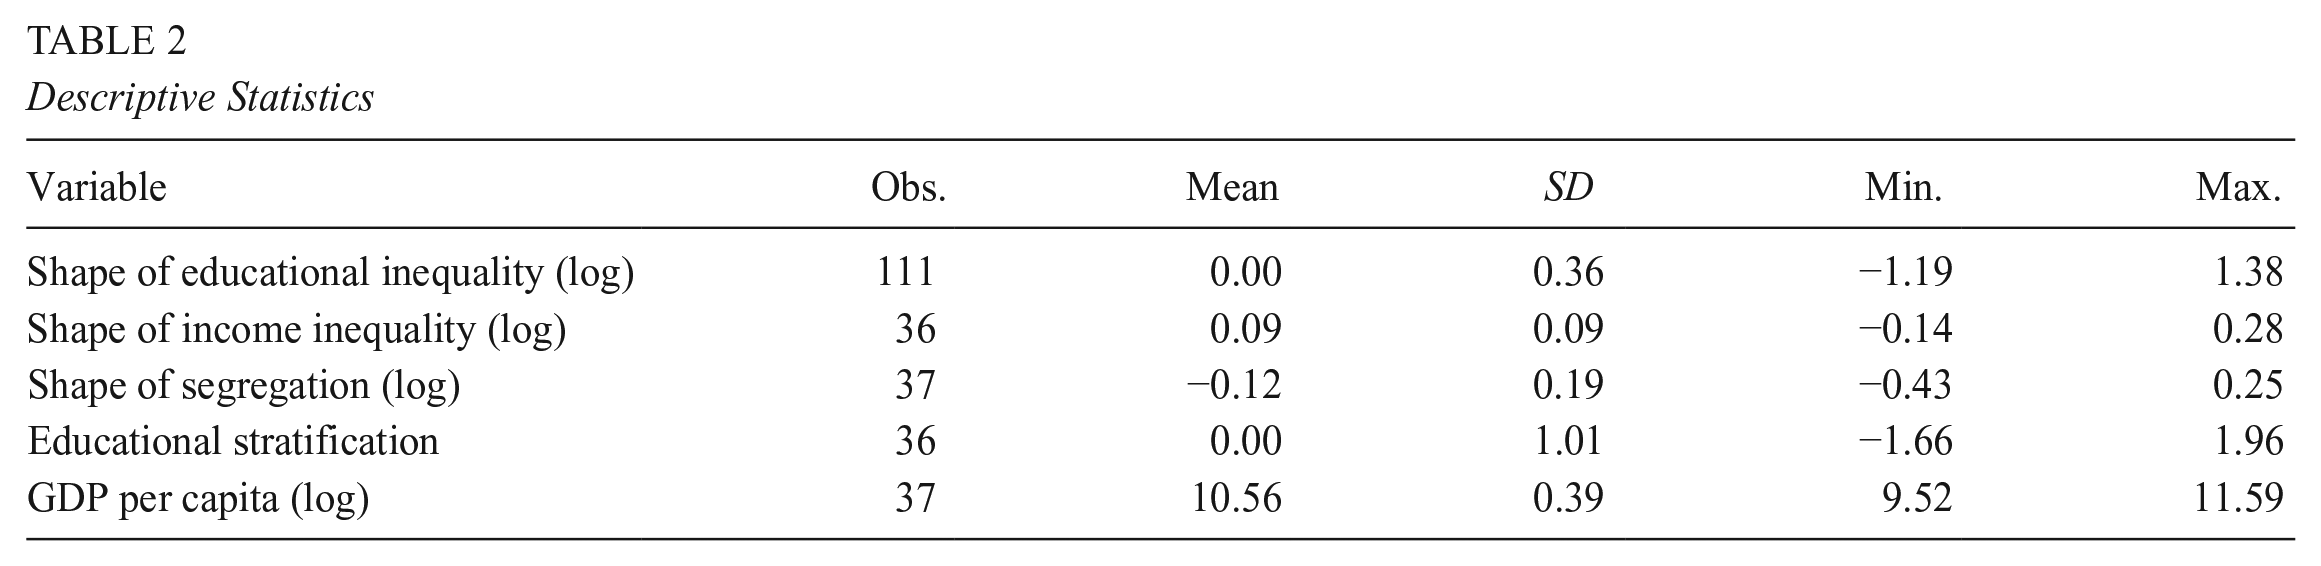
We focus on four factors as possible explanations of cross-national variation in the relative size of achievement gaps at lower-tail and upper-tail SES: income inequality, segregation, educational stratification, and school resource inequality. Table 1 summarizes the variables and their data sources, and Table 2 shows the descriptive statistics of the variables used in the analysis. In the following sections, we describe in detail how we conceptualized and constructed each variable.
List of Variables

Descriptive Statistics
Economic Inequality
For economic inequality, we include two variables, a measure of the shape of income inequality and a measure of the shape of segregation. For income inequality, we use the P9050, which is the ratio of the 90th percentile income to the median income; and P5010, which is the ratio of median income to the 10th percentile income (OECD, 2023a). Our measure of the shape of income inequality is the natural logarithm of the ratio of lower- and upper-tail income inequality.
For segregation, we use the Isolation index from the PISA international reports (OECD, 2019a, 2019c), which measures whether disadvantaged/advantaged students are more concentrated in some schools. The index is related to the likelihood of a disadvantaged/advantaged student to be enrolled in schools that enroll students of another type. Disadvantaged is defined as the lowest 25% and advantaged is defined as the highest 25% of SES distribution. The index ranges from 0 to 1, with 0 corresponding to no segregation and 1 to full segregation (OECD, 2019a). Similar to income inequality, we construct a measure of the shape of segregation by calculating the natural logarithm of the ratio of the Isolation index of disadvantaged students and the Isolation index of advantaged students
Educational Inequality
We also include two measures of inequality in the educational system. First, we include a measure of educational stratification, the extent to which students are differentiated in terms of academic and vocational tracks. Our educational stratification measure is an index constructed from three elements: the percentage of students enrolled in vocational school at upper secondary level, the age of selection, and the number of different types of schools (eigenvalue of 2.13; 71% of variance explained). The percentage of students in vocational school is from the OECD Education GPS data (OECD, 2023b), and the age of selection and the number of types of schools are from the PISA international report (OECD, 2019c). We hypothesize that in countries where, early on, a larger number of students are tracked in vocational track or separate tracks, the achievement gap will be especially large at the lower-tail of SES distribution, because the aspiration of low-SES students may be cooled down, and as a result, they may cease to study hard early on.
Second, we include a measure of the shape of school resource inequality. We hypothesize that larger inequality in school resources at the upper tail, relative to the lower tail, of the SES distribution is associated with larger upper-tail relative to lower-tail achievement gaps. To measure the shape of school resource inequality, we use three measures: the educational materials and educational staff indices constructed by OECD (OECD, 2014, 2017, 2020) 6 and a measure of class size. Each of these has some drawbacks as a measure. The OECD school resource indices are based on principals’ perceptions of the shortage of school resources, and so may not be comparable across schools within a country. The class size measure is more objective, though is perhaps a cruder measure of educational resources.
We model each of these as a cubic function of SES rank and estimate the ratio of lower-tail to upper-tail inequality for each. In most countries, we could not reject the hypothesis that the ratio equals 1 for all three measures. As a result, there is little or no detectible variation in the shape of educational resource inequality across countries. While that does not imply that school resources and the shape of school resource inequality do not affect achievement gaps, we lack sufficient precision and statistical power to test our hypotheses regarding their role in shaping educational inequality, and so do not include these measures in our analyses.
Control Variable
We use GDP per capita PPP (current international $), obtained from the World Bank Indicator (World Bank, 2023), as a control variable, because the level of national income level may be associated with SES achievement gap as well as income inequality. As our dependent variable is estimated from 2012, 2015, and 2018 PISA data, for all the national characteristics variables and indices, we use or calculate the values for 2012, 2015, and 2018, and take the arithmetic mean. 7 Table 3 shows the correlation among the national characteristic variables. 8
Correlation Among Independent Variables

p<.05. **p<.01. ***p<.001.
The shape of income inequality and the shape of SES school segregation are positively correlated. Countries with relatively large income inequality at the lower-tail SES also tend to have relatively large school segregation at the lower-tail SES. Educational stratification is negatively associated with shape of SES school segregation. Countries with more students in vocational track and more distinct school types have relatively large school segregation at the upper-tail SES.
Analyses
We employ a three-level precision-weighted hierarchical model. Because the ratios (of achievement gaps at 50/10 SES and 90/50 SES) are estimated with error, we use a random-effect model to estimate the mean and variance of the true gaps (Level 1). In estimating Level 1, we weight estimates proportional to the precision of their estimates, which we compute as the inverse of the squared standard error of the estimate (described in Note 5). At Level 2, we include the year variables, as the years are nested within countries (Level 3). Through this modeling, we are able to take into account for both the clustering of years within each country and for the known error variance of the ordinary least squares (OLS) estimates. The unit of analysis in our study is the country-year-achievement gap ratio, and our sample is 105 country-years within 35 countries.


where
Findings
Variation in the Shape of Educational Inequality
Our first research question is how the shape of educational inequality differs across countries. Figure 2 shows the ratio of lower- and upper-tail SES achievement gap for each OECD country. The dot shows the ratio, and the bars show the 95 confidence intervals. On the left y-axis is the natural logarithm of the ratio, and for ease of interpretation, we have added the approximate equivalent ratio on the right y-axis. For example, in Canada, the achievement gap between the 50th and 10th SES percentiles is about 1.7 times larger than the achievement gap between the 90th and 50th SES percentiles. In contrast, in Slovenia, the achievement gap between the 50th and 10th SES percentiles is about 0.7 times of the achievement gap between 90th and 50th SES percentiles.

Relative size of achievement gap at lower and upper-tail of SES distribution, 2018.
One can see that the relatively larger achievement gap at the upper-tail of SES distribution in the United States (Reardon, 2011) is not a global phenomenon. In approximately 25% of the countries on the left side of the graph, the achievement gap is larger at the upper tail of SES distribution. For example, in Colombia, the estimated achievement gap at the upper tail of SES distribution is .69 standard deviation, whereas the estimated achievement gap at the lower-tail of SES distribution is .40 standard deviation. In approximately 40% of the countries on the right side of the graph, the achievement gap is larger at the lower tail of SES distribution. For example, in Israel, the predicted achievement gap at the lower tail of SES distribution is .73 standard deviation, whereas the predicted achievement gap at the upper tail of SES distribution is .31 standard deviation. In approximately 35% of the countries in the middle of the graph, the achievement gap at the lower tail and upper tail of SES distribution are about the same.
Country Characteristics and Shape of Educational Inequality
We now explore what explains this cross-national variation by turning to the second research question: To what extent is the relative size of lower-tail and upper-tail SES achievement gaps associated with economic inequality and educational inequality? We first examine the bivariate relationship using the PISA 2018 data. Figure 3 shows the association between the shape of income inequality, measured as the ratio of P5010 and P9050

Shape of income inequality and shape of educational inequality, 2018.
As we hypothesized, there is a positive association between the shape of income inequality and shape of educational inequality. A 1% difference in the ratio of 50/10 to 90/50 income inequality is associated with 2.2% difference in the ratio of lower- to upper-tail SES achievement gaps (adjusted R-squared = .20). In countries with larger lower-tail income inequality (relative to upper-tail income inequality), there is a relatively larger lower-tail SES achievement gap; whereas in countries with larger upper-tail income inequality, the opposite is true. Past research has shown that the size of income inequality is predictive of the size of the SES achievement gap (Chmielewski & Reardon, 2016); but in addition, this study shows that the shape of income inequality is associated with the shape of the achievement gap.
Figure 4 shows that association between the shape of SES school segregation, conceptualized as the ratio of Isolation index of disadvantaged students and Isolation index of advantaged students
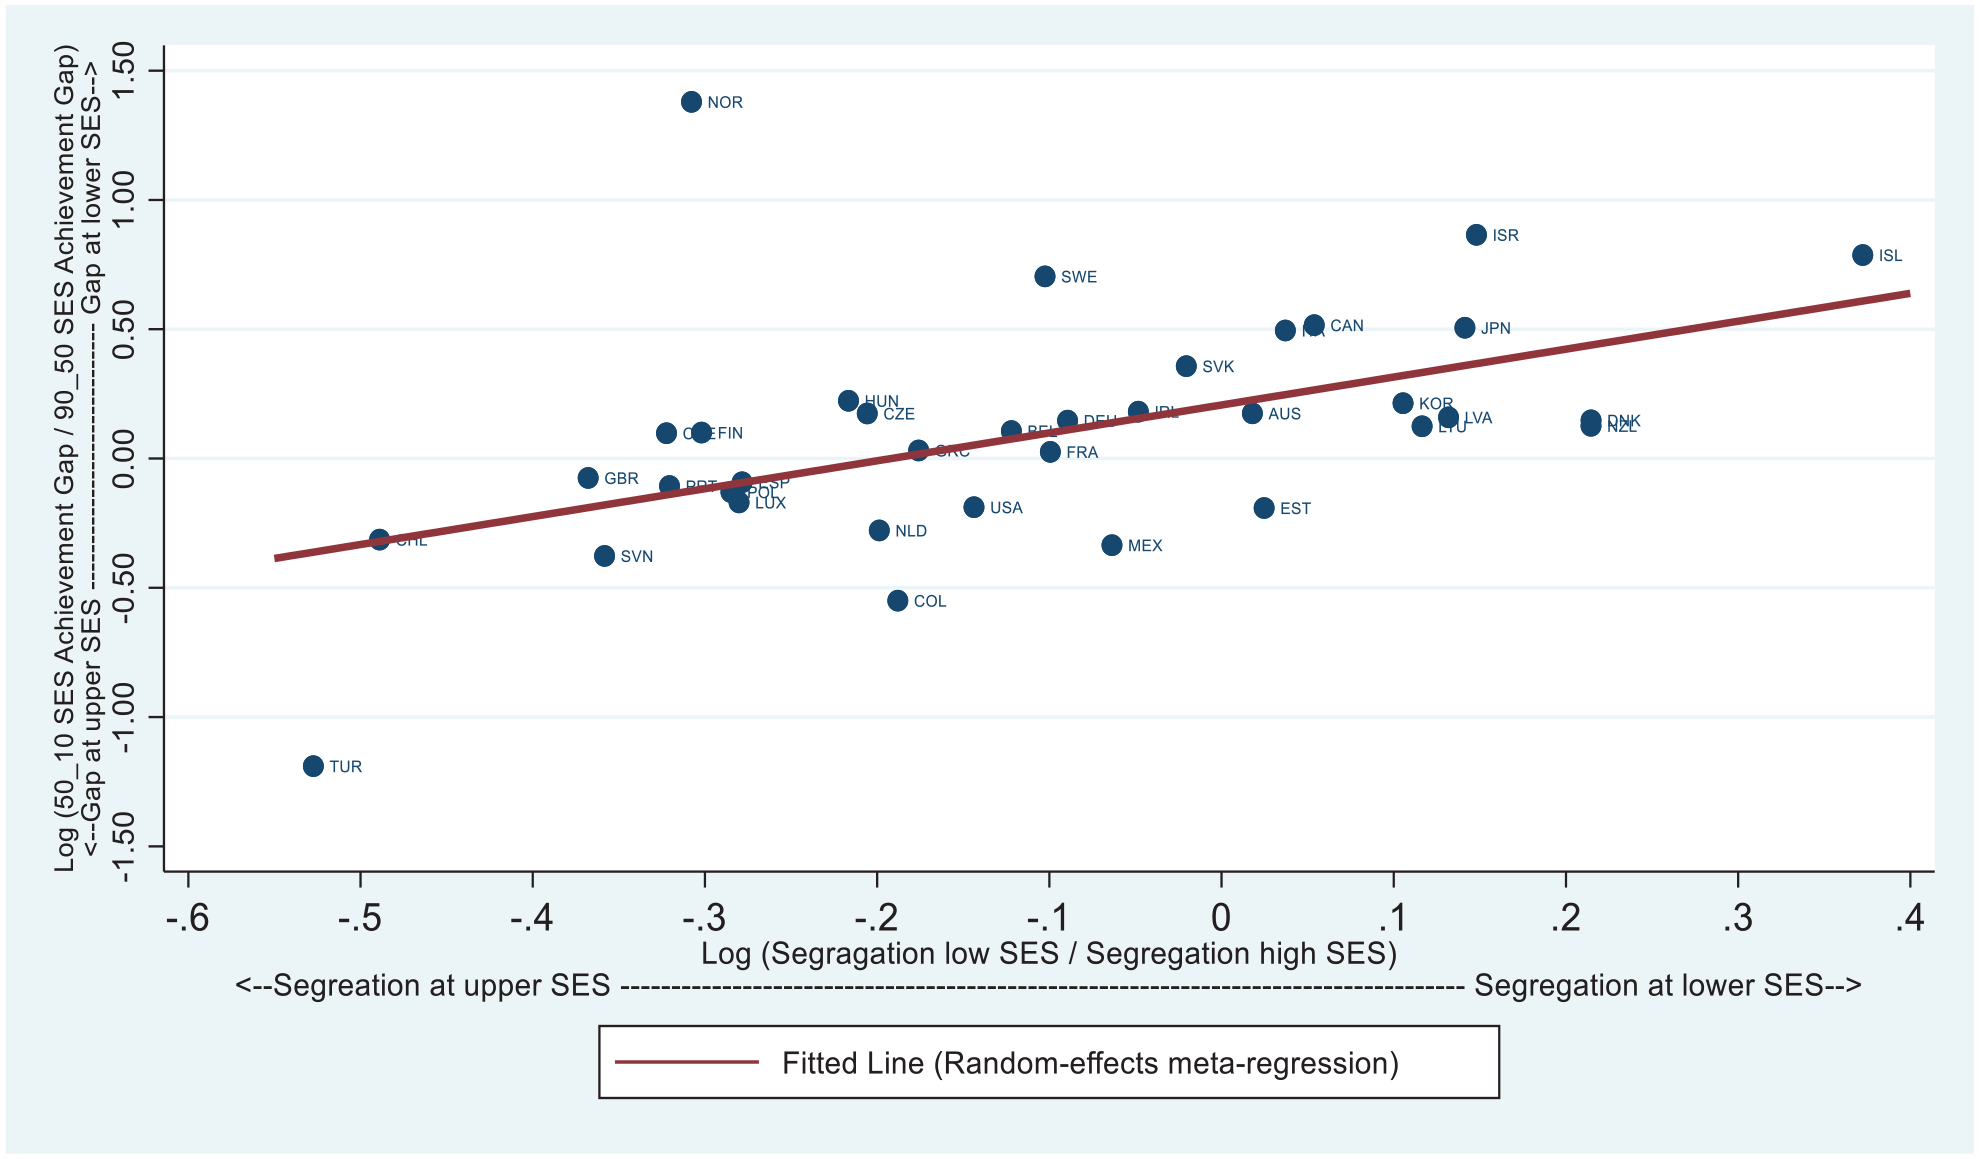
Shape of segregation and shape of educational inequality, 2018.
As we hypothesized, there is a positive association between shape of SES school segregation and shape of educational inequality. A 1% difference in the ratio of lower- to upper-tail school segregation is associated with 1.1% increase in the achievement gap ratio (adjusted R-squared = .34). Countries with larger lower-tail segregation (versus upper-tail) have relatively larger lower-tail SES achievement gaps, and vice versa.
Figure 5 shows the association between educational stratification, conceptualized as the extent and timing of students who are tracked into vocational programs, and the shape of educational inequality.

Educational stratification and shape of educational inequality, 2018.
In contrast to our hypothesis, there is a U-shaped association, negative to a certain point and positive onward, but the R-squared is small (.08). We look deeper into this by decomposing the ratio into achievement gap at upper-tail SES and achievement gap at lower-tail SES (results not shown). Among countries with below median educational stratification, those with comparatively more educational stratification tend to have larger upper-tail SES achievement gaps. Among countries in the middle of educational stratification, the size of both the lower- and upper-tail SES achievement gap is relatively the same regardless of the level of educational stratification. At the higher end of educational stratification, countries with more educational stratification tend to have larger lower-tail SES achievement gaps. This suggests that educational stratification by separating students into academic and vocational tracks may be associated with both more disadvantage of low-SES students and more advantage of high-SES students. However, the association is relatively weak and is based on a simple univariate analysis.
Multivariate Analyses
We now turn to multivariate analyses to see if the preliminary findings above hold when controlling for the economic level of the country and other factors. In these analyses, we expand our data to 2012, 2015, and 2018 data to give more power. Our dependent variable is the natural logarithm of the ratio of achievement gap at the 50/10 SES percentile and achievement gap at the 90/50 SES percentile. As mentioned in the analyses section, we employ a hierarchical model to take into account that the years (2012, 2015, 2018) are nested within countries. It should be reminded that different years have different subjects as dependent variable, because we use the core domain of each year. Therefore, the coefficients on the year variables may reflect not only temporal change but also differences in the relationships for different subjects; because year and subject are perfectly collinear in these data, we cannot distinguish temporal trends from between-subject differences. Nonetheless, we are not interested in comparing or modeling differences in the shape of the gaps across years/subjects, but rather we use the three years/subjects in each country as multiple observations within each country to increase the precision of our estimates.
Table 4 shows results of the multivariate analyses. We control for GDP and the clustering by year in all the models. We include each factor independently (Model 1 to Model 2), and then include all the variables simultaneously (Model 3) to examine whether the association is robust. Model 1 shows that both the shape of income inequality and shape of SES school segregation have significant association with shape of educational inequality. If a country has larger SES school segregation at the lower-tail SES, the country is likely to have larger achievement gap at the lower-tail SES, and this is over and above the effect of shape of income inequality. In other words, countries with both relatively larger income inequality and SES school segregation at the lower-tail (versus upper-tail) SES tend to have the largest achievement gap at the lower-tail SES. The variance explained (comparing the variance to a null model with just the Level 2 variables) is quite large (65%). The cross-national variation in the ratio of achievement gaps at 50/10 SES and 90/50 SES can be largely explained by where the income inequality and segregation are relatively large within the SES distribution of the society. Model 2 shows that educational stratification, conceptualized as the extent of tracking into vocational programs, does not have significant association with the shape of educational inequality, controlling for GDP. Finally, Model 3 shows that the shape of income inequality and the shape of segregation remain significant when including all the variables simultaneously. 10
Estimated Multivariate Associations of Country Characteristics with Relative Size of Lower- and Upper-Tail SES Achievement Gaps

*p<.05. **p<.01. ***p<.001.
Turning to the control variables, GDP has a robust association with the shape of educational inequality. In other words, more economically developed countries tend to have a larger achievement gap at the lower end of SES distribution.
Confounding Factors
Lastly, we test for potential biases in our measure due to cofounding factors. It could be the case that countries with large absolute SES achievement gap tend to have relatively larger achievement gap at the upper tail of SES distribution. Or countries with higher average achievement may have relatively smaller achievement gap at the upper tail of SES distribution. These questions are also of interest for policy makers. Figure A1 in the appendix shows the bivariate association between the 90/10 SES achievement gap and shape of educational inequality. Although there is some pattern that countries with larger overall achievement gaps tend to have relatively larger upper-tail SES achievement gaps, the association is not statistically significant (p-value = .22). Figure A2 in the appendix shows the association between average achievement and shape of educational inequality. Although countries with higher achievement tend to have relatively larger lower-tail SES achievement gaps, the association is not statistically significant (p-value = .13). Because the ratio of lower- to upper-tail SES achievement gaps is not associated with the overall achievement gap or with average level of achievement, we did not include these two factors in our final analyses for parsimony of the model. 11
Conclusion and Discussion
This study found that the shape of educational inequality varies greatly across OECD countries, with approximately 40% of countries having a larger achievement gap at the lower-tail SES, 25% having a larger achievement gap at the upper-tail SES, and 35% having approximately the same size of achievement gap at lower- and upper-tail SES. The relatively larger achievement gap at upper-tail SES that Reardon (2011) found in the United States is not a widespread phenomenon among the OECD countries. We also found evidence that income inequality and SES school segregation partially explain this cross-national variation. Countries with relatively larger income inequality at upper-tail SES tend to have larger achievement gap at upper-tail SES. In addition, countries with relatively larger SES school segregation at upper-tail SES have larger achievement gap at upper-tail SES. With evidence of increasing income inequality causing increasing income segregation (Owens et al., 2016), it may be important to investigate among whom income inequality and segregation are growing, as our finding suggests that it will affect among whom the achievement gap will be large. Educational stratification of vocational and academic tracks did not have significant association with the shape of educational inequality. Because our findings are based on cross-sectional correlational patterns, we cannot establish causal relationship. Yet the findings suggest that broad societal inequality and social policies may play an important role in determining where in a country’s SES distribution the achievement gap may be largest.
We acknowledge that our measures of national characteristics are limited and based on past literature on factors that explain the variation in the absolute size of achievement gap rather than the relative size of lower-tail and upper-tail SES achievement gaps. Future research may examine the prevailing norms of educational equality in a society as a source of cross-national variation in the shape of educational inequality.
Our framework of looking at family SES as a positional good has limitations and potential biases, because the absolute position of family SES could certainly matter as well. For example, children without any books for reading at home would suffer more severe damages of learning opportunities, regardless of whatever their peers may have within the society. In addition, one could argue that in the current globalized economy, people’s socioeconomic position, such as job and income, can be heavily influenced by what happens in other countries as well. Therefore, our analytical decision to use the rank-ordered SES within each country neglects the effect of absolute value of and between-country differences in parents’ education, occupation, and home possessions. However, we make this analytical decision, because based on Jencks’s (1988) framework, we are primarily interested in why some countries have larger inequality at the upper tail or lower tail of SES distribution, and thus in the relative size of inequality within a country. In addition, Wilkinson (1997) has shown that the association between income and health outcome is much weaker across countries than within countries, and that the relative position within a society is what matters most.
Finally, this study has important policy and research implications. It is important to note that unlike other traditional measures of educational inequality, it is not clear if or why one might prefer larger or smaller values of the achievement gap ratio. Rather, the achievement gap ratio enables one to identify where the educational inequality is relatively large within the society’s SES distribution, and to gauge the relative magnitude of the ratio through cross-national comparison. This could encourage policymakers to scrutinize the prevailing norms of educational inequality and engage in the dialogue of whom educational institutions should treat equally within their society. The study also suggests further focus for research relating to educational inequality. If a society has a relatively larger achievement gap at the upper SES, as Reardon (2011) suggested, parents of affluent families may be investing in their children’s academic achievement in ways that generate more return to their investment. To reduce educational inequality in such a society, it may be important to study the behavior and decision of affluent families and its implications on the system. In contrast, in a society with a relatively larger achievement gap at the lower SES, it may be necessary to investigate what prevents the country from implementing compensatory policies and providing extra support to children of poor families, and to consider how policies and initiatives targeted to the lowest-SES children would be feasible in the society.
Footnotes
Appendix
Acknowledgements
We are grateful to two anonymous reviewers for their valuable comments. We also benefited from feedback from audiences at Stanford’s SCANCOR Seminar Series.
Declaration of Conflicting Interests
The author(s) declared no potential conflicts of interest with respect to the research, authorship, and/or publication of this article.
Funding
The author(s) disclosed receipt of the following financial support for the research, authorship, and/or publication of this article: This research was supported by JSPS KAKENHI (Grant Numbers: 20K02570).
Notes
Authors
YUKO NONOYAMA-TARUMI is a professor of sociology of education at Musashi University, 1-26-1 Toyotama-kami, Nerima-ku, Tokyo, 176-8534, Japan;
SEAN F. REARDON is the endowed professor of poverty and inequality in education and is professor (by courtesy) of sociology at Stanford University, CERAS building, 520 Galvez Mall, #526 Stanford, CA 94305-3084;