
Abstract
Adequately preparing for retirement requires planning and knowledge about available savings and investment options. Teachers participate in a complex set of plan designs, and many do not participate in Social Security. While teachers represent a large part of the public workforce, relatively little is known regarding their knowledge and preparation for retirement. We administered a survey to a nationally representative sample of teachers through RAND’s American Teacher Panel and asked teachers about their retirement planning and employer-sponsored retirement plans. We find that while most teachers are taking steps to prepare for retirement, many teachers do not currently possess the basic retirement knowledge necessary to plan effectively. Teachers struggled to identify their plan type, how much they contribute to their plans, retirement eligibility ages, and who contributes to Social Security. These results suggest that better education around teacher retirement plans has the potential to improve teachers’ retirement planning and preparation.
Keywords
Introduction
Retirement planning is important for retirees’ financial well-being (Ameriks et al., 2003; Lusardi & Mitchell, 2011a; van Rooij et al., 2012), health (Elder & Rudolph, 1999), and satisfaction (Topa et al., 2009). Good retirement planning requires knowledge about and coordination between the various savings vehicles available to workers (Lusardi & Mitchell, 2011a; van Rooij et al., 2012). A metaphorical “three-legged stool” is commonly used to describe good retirement planning, illustrating the interdependence of the elements of retirement savings. In this metaphor, three elements support retirement security: personal savings, employer-sponsored plans, and Social Security (DeWitt, 1996). How much an individual must save to reach a secure retirement depends on the value of their employer-sponsored plan and Social Security benefits (Mitchell & Moore, 1998). Lacking knowledge about the various retirement savings components makes planning difficult and can leave workers in retirement-insecure positions (R. L. Clark et al., 2012).
Some aspects of teachers’ retirement systems simplify planning and create the perception of security. Teachers are generally automatically enrolled in a state or school district-sponsored retirement plan. Most teachers participate in traditional pensions that guarantee lifetime benefits to eligible members. The pension system or sponsoring government manages most decisions, including setting contribution rates and allocating investments. Benefits for experienced teachers are rarely changed. Teachers must make very few decisions to enroll, are invested reasonably well, and earn lifetime income when eligible.
However, other aspects of teachers’ pensions complicate retirement planning. Teachers’ pensions are often backloaded, meaning that teachers earn relatively meager benefits in the early and middle portions of their careers and much more valuable benefits toward the end (Costrell & Podgursky, 2009, 2010; McGee & Winters, 2017). Backloaded pension plans result in very different retirement savings rates for teachers with different career lengths (Costrell & McGee, 2019). And backloading impacts a large share of the teaching workforce. In the median state, 80 percent of teachers will not work long enough to qualify for full retirement benefits (Aldeman & Rotherham, 2014).
Teachers who work less than a full career or split a career across two states earn less valuable benefits and may face retirement insecurity without supplemental savings (Aldeman & Johnson, 2015; Costrell & Podgursky, 2009, 2010). It is challenging for teachers to predict how much they should be saving privately to offset this uncertainty (Marchitello et al., 2021; McGee & Winters, 2019). In addition, approximately 40 percent of teachers are not covered by Social Security (Kan & Aldeman, 2014), making them more reliant on their employer-provided plans.
Over the past two decades, teachers’ pensions have also faced significant funding challenges, creating uncertainty around retirement benefits and a potential drag on teacher compensation (Backes et al., 2016; Moody & Randazzo, 2020). State and school district costs for teacher retirement plans have grown dramatically and now exceed $1,800 per pupil and account for over 12% of current public education expenditures (Costrell, 2023; Costrell & McGee, 2022). In response to rising retirement costs, many states and cities have cut benefits for new teachers, reducing teacher compensation and further exacerbating retirement planning challenges (Marchitello et al., 2021; McGee, 2016).
The precipitous growth of teacher pension costs leaves less money for other important expenditures (e.g., teachers’ salaries and benefits, educational supplies, and support staff), potentially reducing the attractiveness of teaching (McGee, 2016). At the same time, research has also raised concerns about the current health of the teaching profession, including some acute geographic and subject area shortages, declining professional prestige, dwindling student interest in pursuing teaching as a career, and a marked drop in enrollment in traditional education preparation programs (Kraft & Lyon, 2022). Given the large proportion of education expenditures now devoted to teacher pensions and the broader challenges around the health of the teaching profession, teacher retirement policy has big implications for both the teacher workforce and the larger public education system.
Understanding how much teachers know about their employer-sponsored retirement plans and their levels of financial literacy is vital to ensuring all teachers are equipped to make sound decisions about their retirement in this complex environment. Identifying where there are gaps in retirement plan knowledge may help policymakers and plan managers design information interventions that improve decision-making (R. Clark et al., 2017; Van Rooij et al., 2011).
Gaining a better understanding of teachers’ knowledge and preparation may also help us know where positive retirement plan changes are possible. Teachers’ knowledge about and preferences around their retirement plans are likely linked (Brown & Weisbenner, 2014). Early- and middle-career teachers do not exhibit strong preferences around retirement plan design (Fuchsman et al., 2023). Due to rising costs and evidence that current systems often do not support the whole teaching workforce well, many states are exploring or have implemented plan changes and alternative retirement plan designs (Koedel & Podgursky, 2016). Understanding teachers’ current plan knowledge and preparation could help inform these policy changes, and more informed teachers would be better situated to represent their interests and preferences in these debates.
In this paper, we investigate teachers’ retirement knowledge and preparation using a nationally representative sample of teachers from RAND’s American Teacher Panel. This work is a contribution not only because teachers represent a large and important part of the public workforce but also because the literature on teachers’ retirement knowledge and preparation is sparse (DeArmond & Goldhaber, 2010).
Our results show that most teachers are taking steps to prepare for retirement. Over half of teachers have tried to develop a plan for retirement, and 70 percent are saving separately from their employer-sponsored plan. Of teachers who are or have been married, 70 percent report that their spouse has a separate employer-offered retirement plan. However, results also show that teachers, especially early-career teachers, exhibit less financial literacy than other college-educated adults, and a lower proportion of teachers have tried to develop a retirement plan.
In addition, results indicate that many teachers do not currently possess the knowledge to plan effectively for retirement. Approximately 45 percent of teachers could not identify their retirement plan type, and 30 percent are uncertain how long their benefits will last. Teachers also struggled to identify how much they contribute to their retirement plans, when they will be able to retire, and who contributes to Social Security. Unsurprisingly, late-career teachers were the most knowledgeable.
These results suggest that teachers have not been fully equipped to make decisions about their retirement. Teachers’ current knowledge levels could result in poor retirement planning, especially among short- and medium-tenure teachers. States and districts could implement education interventions to improve teachers’ knowledge about and planning for retirement (Collins & Urban, 2016; Kaiser et al., 2020; Lusardi et al., 2020).
Differences in retirement plan knowledge may be one reason that early- and mid-career teachers appear to value traditional pensions less than late-career teachers (Fuchsman et al., 2023). Since teachers have limited knowledge about their retirement plans and many appear not to have strong preferences around plan structure, it may be possible to better educate teachers about retirement plan design and how it impacts them to build support for or reduce opposition to positive changes to teacher retirement plans. At the very least, improving teachers’ knowledge about their plans would improve their ability to effectively plan for retirement in a complex and ever-changing environment.
Background
Teachers participate in two basic categories of employer-sponsored retirement plans: defined benefit (DB) and defined contribution (DC). Nationally, 80 percent of public schoolteachers participate in DB plans and 14 percent participate in DC plans (U.S. Bureau of Labor Statistics, 2020). Nearly all teachers who participate in a DB plan are in a traditional pension or final average salary (FAS) DB plan. 1 These plans base benefits on a formula using an employee’s tenure, age, and average salary over the last few years of the employee’s career. On the other hand, DC plans, like private sector 401(k) plans, base benefits on how much money has accrued in an individual’s retirement account from employee and employer contributions and investment returns.
Teachers also participate in two less common alternative plans. Cash balance (CB) plans are a type of DB plan where benefits accrue similarly to DC plans but include a minimum guaranteed benefit. Finally, some teachers participate in hybrid systems that include both FAS and DC plan components.
One key difference between designs that affects retirement planning is how benefits accrue. FAS plans are backloaded, meaning that teachers do not earn substantial benefits until they near retirement eligibility (Aldeman & Johnson, 2015; Costrell & Podgursky, 2009). In contrast, DC and CB benefits accrue more evenly across teachers’ careers (Costrell, 2019).
Backloading can impact retirement planning due to uncertainty about how long teachers will work under the same system. New teachers are unlikely to know if they will teach for a full career much less whether they will do so in one state (Aldeman & Rotherham, 2014; Costrell & McGee, 2019; Costrell & Podgursky, 2010; Lueken, 2017; Marchitello et al., 2021; McGee & Winters, 2019).
In the median state, only 45 percent of teachers work long enough to qualify for retirement benefits, and 80 percent do not qualify for full benefits (Aldeman & Rotherham, 2014). Seemingly harmless decisions, such as switching states, can reduce net pension wealth by over 50 percent (Costrell & Podgursky, 2010). These features of traditional pensions underscore the importance of the other two legs of the proverbial retirement savings stool—private retirement savings and Social Security participation.
While all private-sector employees participate in Social Security, only 60 percent of teachers participate (Kan & Aldeman, 2014). Teachers in the District of Columbia and 15 states either do not participate in Social Security or leave the decision to participate to districts. Teachers not enrolled in Social Security must rely on their personal retirement savings and their employer-sponsored pension to meet their retirement security needs.
Despite the shortcomings of traditional pension plans for early- and mid-career teachers, pension proponents believe these plans are important recruitment and retention tools (Boivie, 2011, 2017). Advocates argue that most teachers would be worse off under alternative plan designs and that pensions facilitate orderly turnover at known ages (Rhee & Joyner, 2019; Weller, 2017). However, the effectiveness of pensions as workforce management tools depends on teachers’ understanding of how pensions work.
Retirement systems provide teachers with information to help them plan for retirement. This information usually concentrates on how long they must work to become eligible for a pension and how to calculate benefits for full-career teachers. However, this information may not include other important aspects that are relevant to early- and mid-career teachers, such as how much they have accrued at earlier ages and whether they are on the path to a secure retirement. Benefit handbooks are oftentimes bogged down in the minutiae of plan aspects such as service credit, designating beneficiaries, and divorce, making it challenging for teachers to see their larger retirement savings picture.
Understanding teachers’ levels of retirement knowledge, preparation, and financial literacy is vital to ensuring they are equipped to make sound decisions about their retirement. While previous literature demonstrated the importance of retirement education for retirement outcomes (Collins & Urban, 2016; Kaiser et al., 2020; Lusardi et al., 2020), the literature on teachers’ retirement knowledge is sparse. DeArmond and Goldhaber (2010) find that approximately 80 percent of Washington teachers can identify their retirement plan types, but early-career teachers were less likely to be correct. Among employees at a large state university, Brown and Weisbenner (2014) show that two-thirds of employees can identify their employee contribution rates within plus or minus two percentage points and that 71 percent knew that they were not enrolled in Social Security. In the general population, Gustman and Steinmeier (1999) find that half of adults can identify their retirement plan type, and less than half of respondents can identify their retirement eligibility age within one year. Finally, Chan and Stevens (2008) show that 60 percent of the general population does not know if they will receive Social Security benefits.
Additional literature linked teachers’ labor market behavior to pension incentives, suggesting that teachers understand their retirement plans well enough to exit when they maximize the present value of their retirement benefits (Costrell & McGee, 2010; Costrell & Podgursky, 2009; Goldhaber et al., 2022; Kim, 2020; Ni & Podgursky, 2016; Ni et al., 2020). While this may be the case, it is not the only piece of information important for retirement planning and is only relevant for full-career teachers.
Data
We combined three data sources to learn about teachers’ retirement knowledge and preparation. The primary source was a survey administered through RAND’s American Teacher Panel (ATP), which we merged with retirement plan information from the Urban Institute’s State and Local Employee Pension Plan Database and retirement system information from the Boston College’s Center for Retirement Research’s Public Plans Database.
RAND American Teacher Panel
We administered an approximately 15-minute survey using RAND’s ATP between February 10 and March 16, 2020. 2 The ATP is a nationally representative online survey research panel of American public K–12 schoolteachers. 3 Respondents are compensated $1 for each minute of expected survey time.
Our survey included questions about teachers’ knowledge, preparation, and preferences around retirement as well as previously validated scales for financial literacy, personality, numeracy, and risk tolerance (Frederick, 2005; John et al., 1991; Kimball et al., 2008; Lipkus et al., 2001; Lusardi & Mitchell, 2011b; Toplak et al., 2014). RAND invited 9,904 teachers to take the survey, and 5,464 completed it (55 percent response rate). 4
Table 1, Panel A, includes summary statistics for the analytic ATP sample, which matches the general teacher population well. 5 Female teachers make up 77 percent of the sample. Teachers identifying as white are 84 percent of the sample, and Black, Hispanic, and Asian teachers are 8, 7, and 3 percent of the sample, respectively. Nearly three-quarters of the sample are married or in a domestic partnership, while 1 percent are widowed, 10 percent are divorced, 1 percent are separated, and 14 percent are single or never married.
Sample Summary StatisticsPanel A: Teacher Characteristics

Note. The sample excludes teachers who could choose which plan to enroll in or were hired in plan transition years. Unweighted responses.
Panel B: Summary of Retirement Knowledge Question Responses

Note. The sample excludes teachers who could choose which plan to enroll in or were hired in plan transition years. Question and answer text available in Appendix B. Unweighted responses.
Elementary schoolteachers are 44 percent of respondents and 56 percent teach in secondary schools. Respondents report an average of 15.69 years of experience in their current states with a standard deviation of 8.42 years. Experience ranged from zero years to 52 years. The average age is 44.91 with a standard deviation of 10.68 years.
Teacher Retirement Plan Data
We obtained data on specific plan parameters for nearly all state teacher retirement plans from the Urban Institute’s State and Local Employee Pension Plan Database (SLEPP). 6 These data were originally collected in 2012 and updated in 2018. To ensure the accuracy of the SLEPP database, we combed through retirement systems’ member handbooks and annual financial reports. We updated plan data when our interpretation of plan parameters differed from the SLEPP database or if anything had changed since 2018. 7 We combined these data with Boston College’s Center for Retirement Research’s Public Plans Database (PPD), utilizing 2020 normal cost and employer normal cost rates. 8
Retirement Knowledge
Grading the Retirement Plan Knowledge Quiz
Evaluating teachers’ knowledge about their retirement plans is complicated. Each state, the District of Columbia, and five municipalities (Chicago, Kansas City, New York City, Saint Louis, and Saint Paul) operate separate retirement systems with multiple retirement plans, sometimes called “tiers,” within each system.
We consider a benefit tier to be each potential combination of plan parameters that teachers can participate in that could result in a correct set of answers to the quiz. 9 Our data include 210 total tiers across 56 states and municipalities. 10 Only 5 states and municipalities have just one tier and 44 have four or fewer.
Most tiers determine eligibility based on when a teacher was hired, but some have additional or alternative eligibility requirements such as the dates teachers vest (qualify for a benefit), retire, or are eligible to retire. We approximate teachers’ year of hire using reported experience in the state and assume teachers have worked continuously since their hire year to infer their benefit tier. 11
There are two remaining challenges to determining tier membership. First, some states, such as Ohio and Florida, allow teachers to choose among a set of plans. If teachers in choice states meet eligibility criteria for multiple plans, then we cannot know if the teacher is correct when answering some plan knowledge questions. Second, teachers hired in a transition year, the start year for a new tier, could be enrolled in the previous tier or the new tier depending on the date they were hired. Since actual hire dates are unknown, we cannot be certain which tier transition year hires are enrolled in. Considering these two challenges, we limited the sample to respondents who could only be enrolled in one tier. 12 We retained 78 percent of the sample with this restriction. 13
As we noted at the beginning of this section, teacher retirement plans are complex and, as a result, evaluating teachers’ knowledge about their plans is complicated. Doing so required us to make several choices that may influence the results. To help readers evaluate the impact of these choices, we perform several sensitivity checks to investigate how sample weighting, sample construction, and our grading scheme impact our estimates of teachers’ retirement plan knowledge. The results of those analyses are included in Appendix C.
We do not find evidence that sample construction or weighting meaningfully affects the results. Of course, our grading scheme does impact the percentage of respondents who get various questions correct. Appendix C also presents the results from a more lenient grading scheme to provide an upper bound for teacher retirement plan knowledge.
Retirement Knowledge Quiz Results
We included five survey questions designed to measure how much teachers know about their retirement plans. Table 1, Panel B, summarizes the responses to these questions. 14 Figure 1 contains graded responses to the five-item retirement plan knowledge quiz, with error bars representing the 95 percent confidence interval. Table 2 displays the share of correct responses by experience quartile, with the 95 percent confidence interval in brackets below each result. Teachers in the first quartile of experience have fewer than 9 years of experience (early-career) while quartile four teachers have more than 20 years of experience (late-career). 15

Share correctly answering retirement plan knowledge questions.
Share Correctly Answering Knowledge Questions by Experience Quartile
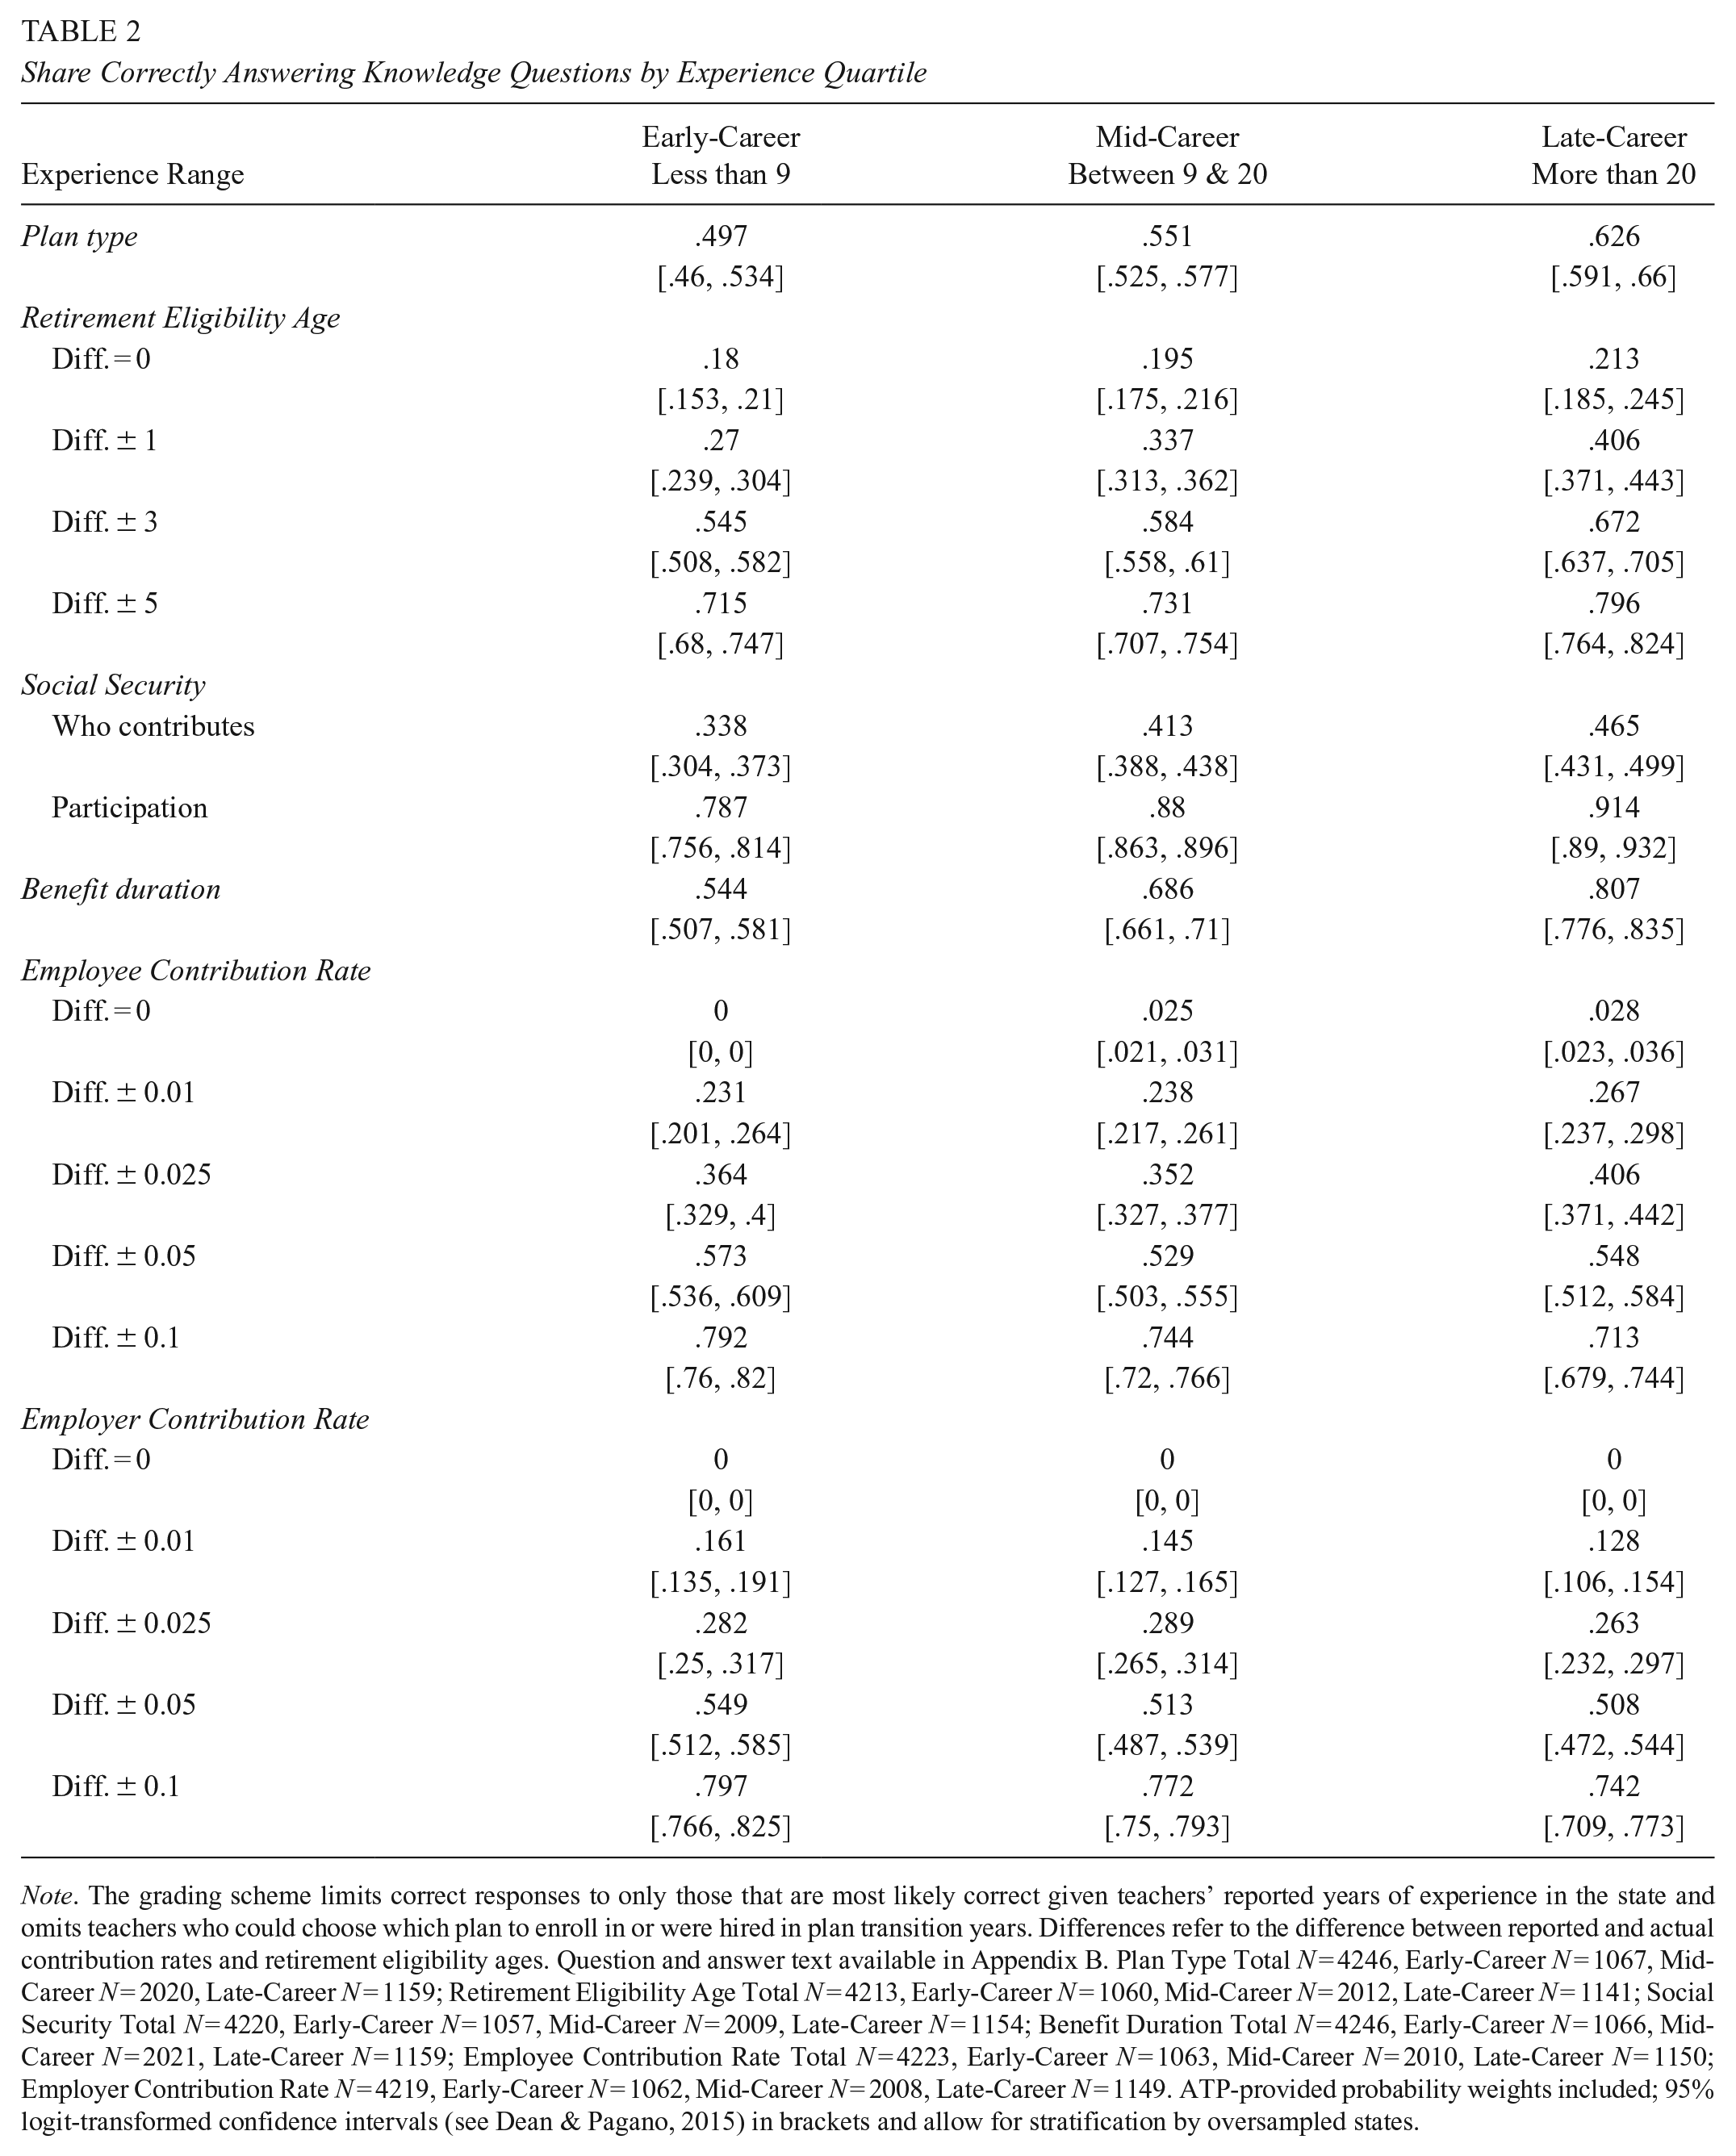
Note. The grading scheme limits correct responses to only those that are most likely correct given teachers’ reported years of experience in the state and omits teachers who could choose which plan to enroll in or were hired in plan transition years. Differences refer to the difference between reported and actual contribution rates and retirement eligibility ages. Question and answer text available in Appendix B. Plan Type Total N = 4246, Early-Career N = 1067, Mid-Career N = 2020, Late-Career N = 1159; Retirement Eligibility Age Total N = 4213, Early-Career N = 1060, Mid-Career N = 2012, Late-Career N = 1141; Social Security Total N = 4220, Early-Career N = 1057, Mid-Career N = 2009, Late-Career N = 1154; Benefit Duration Total N = 4246, Early-Career N = 1066, Mid-Career N = 2021, Late-Career N = 1159; Employee Contribution Rate Total N = 4223, Early-Career N = 1063, Mid-Career N = 2010, Late-Career N = 1150; Employer Contribution Rate N = 4219, Early-Career N = 1062, Mid-Career N = 2008, Late-Career N = 1149. ATP-provided probability weights included; 95% logit-transformed confidence intervals (see Dean & Pagano, 2015) in brackets and allow for stratification by oversampled states.
Retirement Plan Type
Our first question provided descriptions of four common retirement plan types and asked respondents to identify the description that most closely matched their primary retirement plan. 16 Answers corresponded with FAS, DC, CB, and hybrid plans. Table 1, Panel B, shows that 54 percent of teachers believe they are enrolled in FAS plans and another 28 percent believe they are enrolled in hybrid plans. Only 12 percent believe they are enrolled in DC plans and 6 percent think they are enrolled in CB plans.
Our question design differs from DeArmond and Goldhaber (2010), who provided plan labels and plan descriptions, and Gustman and Steinmeier (2002), who provided plan labels but not plan descriptions. We use plan descriptions without plan labels for two reasons. First, we are interested in assessing teachers’ retirement preparation, which depends on their understanding of how benefits accrue. Teachers might be able to identify plan labels without knowing how those plans determine benefits or how different plans affect them.
Second, teachers may not be familiar with the plan labels we use, especially DC and CB, or their implications for retirement plan design because these are not common in plan literature and educational materials. Retirement systems commonly refer to FAS plans as “pensions” or “defined benefit” plans, and systems use a variety of terms to refer to DC and CB plans, including “investment plan” and “guaranteed return plan,” respectively. 17 The lack of consistency in plan design terminology could lead to respondent confusion and noisy results that do not necessarily reflect teachers’ plan design knowledge.
Figure 1 shows that 55.7 percent correctly identified the description matching their retirement plans. 18 Experienced teachers were more likely to identify their retirement plan type correctly than newer teachers (Table 2). Just under half (49.7 percent) of early-career teachers could identify their retirement plans. Mid-career teachers were correct 55.1 percent of the time, while 62.6 percent of late-career teachers could identify their retirement plan.
Retirement Eligibility Age
We asked teachers at what age they would be eligible for full retirement benefits. The mean reported retirement eligibility age is 59.72, the median is 60, and the standard deviation is 7.08 years (Table 1, Panel B). 19
Most systems have multiple retirement eligibility thresholds. Thresholds usually involve age, years of service, and/or the sum of age and years of service. For example, teachers in Minnesota’s Tier 1 plan are eligible to retire at whichever comes first: age 65 with 3 years of service, age 62 with 30 years of service, or once age and years of service sum to 90. We estimate respondents’ earliest possible retirement eligibility age using plan eligibility thresholds, reported age and experience, and assuming teachers work continuously until their earliest eligibility age.
Teachers had difficulty identifying their retirement eligibility ages (Figure 1). Less than 20 percent of teachers knew their exact eligibility age, 33.7 percent knew the age within one year, 59.6 percent answered within 3 years, and 74.3 percent identified a retirement eligibility age within 5 years.
Teachers with more experience were more likely to know their retirement eligibility ages (Table 2). Late-career teachers knew their exact retirement eligibility age 21.3 percent of the time, compared to 18 percent for early-career teachers and 19.5 percent for mid-career teachers. Late-career teachers provided an age within one year of their actual retirement eligibility age 40.6 percent of the time, and 67.2 percent could identify an eligibility age within three years. Early- and mid-career teachers were significantly less likely to know their retirement eligibility ages within one or three years.
Social Security
To gauge teachers’ knowledge about Social Security participation and contributions, we asked them if they contribute to Social Security or if their school districts do on their behalf. We provided four possible answers: (1) teachers contribute, (2) school districts contribute, (3) both contribute, and (4) no one contributes.
We assume that teachers who say that at least one party contributes to Social Security (i.e., answers 1–3) believe that they participate in the program, while those who say no one contributes believe they do not participate. Thirty-one percent of respondents answer that neither they nor their employers contribute to Social Security and thus believe that they do not participate. The remaining 69 percent believe that they participate in Social Security. Most teachers knew whether they participated in Social Security: 86.4 percent correctly identified whether they participated in the program (termed “Participation” in the tables and figures).
Teachers were much less knowledgeable about who contributes to Social Security. When teachers participate in Social Security, both teachers and districts contribute to the program. Only 16 percent answered that both they and their districts contribute (Table 1, Panel B). Forty percent of teachers believe they contribute to Social Security but that their school district does not, and 14 percent believe that only their employer contributes on their behalf. The rest answered that no one contributes.
The 54 percent of teachers who think that only they or their employer contribute are incorrect regardless of Social Security participation. The remaining teachers who answered that both contribute or that no one contributes can still be incorrect if they are incorrect about their participation. Overall, only 40 percent of respondents were correct in identifying who contributes to Social Security (termed “Who Contributes” in the tables and figures).
Experienced teachers were more likely to know whether they participate in Social Security and who contributes. Late-career respondents were correct about participation 91.2 percent of the time, mid-career teachers were correct 88.2 percent of the time, and early-career teachers were correct 78.5 percent of the time (Table 2). Regarding who contributes to Social Security, 45.8 percent of late-career teachers answered correctly. Early- and mid-career teachers were, respectively, 12.6 and 4.1 percentage points less likely than late-career teachers to be correct.
Benefit Duration
We asked teachers how long they will receive monthly payments as part of their retirement plan. Potential answers included “As long as I live,” “For a fixed time,” “Until the money runs out,” and “Other, please specify.” Seventy-three percent of teachers believe their benefits will last until they die, 20 percent believe benefits will last until the money runs out, and 6 percent think the payments will last for a fixed time (Table 1, Panel B).
We consider benefit duration to be directly tied to plan types. While many plans give retirees flexibility in choosing how their benefits will be paid out, FAS plans, CB plans, and the FAS component of hybrid plans generally pay benefits in the form of an annuity that lasts for the beneficiary’s lifetime, and DC plans provide benefits until the money in the retiree’s account runs out. 20
Respondents were somewhat knowledgeable about how long they will be able to collect benefits. Sixty-eight percent correctly identified their benefit duration based on their plan participation (Figure 1). 21 Teachers with more experience were more likely to know how long their benefits would last (Table 2). Eighty-one percent of late-career teachers could identify their benefit duration, but only 54.4 percent and 68.6 percent of early- and mid-career could do so, respectively.
Employee Contributions
We asked teachers how much they contribute to their retirement plans as a percentage of their salary. The distribution of responses to the employee contribution question was highly skewed: the average response was 13.43 percent, while the median response was 8 percent (Table 1, Panel B). The distribution varied widely. The standard deviation was 23.15 percentage points. The fifth percentile was 0 percent, and the 95th percentile was 50 percent. 22
Many tiers have more than one employee contribution rate. We use respondents’ reported age, experience, and salary to identify the contribution rate for tiers where the rates vary based on these factors. 23
Teachers had difficulty identifying their contribution rates (Figure 1). Only 2 percent of teachers knew their exact contribution rates. Less than 25 percent of respondents answered within one percentage point of the correct response. Fifty-five percent of respondents identified a contribution rate to be within 5 percentage points of the actual rate, and 74.8 percent were within 10 percentage points.
Experience had a limited impact on teachers’ knowledge about their own contribution rates (Table 2). While no early-career respondents could identify their exact contribution rates, they were nearly as likely as mid- and late-career teachers to pick a rate within 1 and 2.5 percentage points and more likely to pick a rate within 5 and 10 percentage points. Strikingly, 28.7 percent of late-career teachers did not pick a contribution rate within 10 percentage points of their actual rate.
Employer Contributions
We asked teachers how much their employer contributed to their retirement plans. The distribution of responses (Table 1, Panel B) was also highly skewed: the average response was 14.42 percent while the median response was 6 percent. The standard deviation was 27.41 percentage points. The fifth percentile was 0 percent and the 95th percentile was 75 percent. 24
Responses to the employer contribution rate question were somewhat more skewed toward zero than responses regarding employee contribution (compare Appendix Figures E.1 and E.2). Many respondents appear to believe that their employer contributes very little toward their retirement. Responses to the employer contribution rate question also exhibit a larger standard deviation, potentially resulting from greater ambiguity related to the definition of employer contribution.
Many plans do not report employer contribution rates in membership handbooks, opting to explain that actuaries determine a required contribution rate. When reported, the total employer contribution rate often includes both the employer’s share of the normal cost (i.e., the cost of benefits earned that year) and a debt service payment on unfunded liabilities. We are interested only in the employer’s normal cost portion because that is the amount that directly benefits the teacher. We use the employer’s share of the normal cost rate from PPD as the correct employer contribution rate.25,26
Teachers had more difficulty identifying employer contribution rates than their own contribution rates (Figure 1). None knew their employer’s exact contribution rate. Less than 15 percent of respondents answered within one percentage point of the correct response. Approximately 52 percent identified a contribution rate to be within 5 percentage points of the actual rate.
Experience had a small impact on teachers’ ability to identify employer contribution rates (Table 2). Early-career teachers were 1.6 percentage points more likely to correctly identify their employer’s contribution rate within one percentage point than mid-career teachers and were 3.3 percentage points more likely than late-career teachers. As with the employee contribution results, early-career teachers were slightly more knowledgeable about the employer contribution across all bandwidths, and late-career teachers were the least knowledgeable.
Retirement Preparation and Financial Literacy
We evaluate teachers’ retirement preparation and financial literacy using responses to seven survey questions. 27 The responses to each question for the full sample and by experience quartiles are available in Figure 2 and Table 3. 28 In Figure 2, the error bars represent the 95 percent confidence intervals, which are also provided in brackets in Table 3.

Retirement preparation responses.
Retirement Preparation by Experience
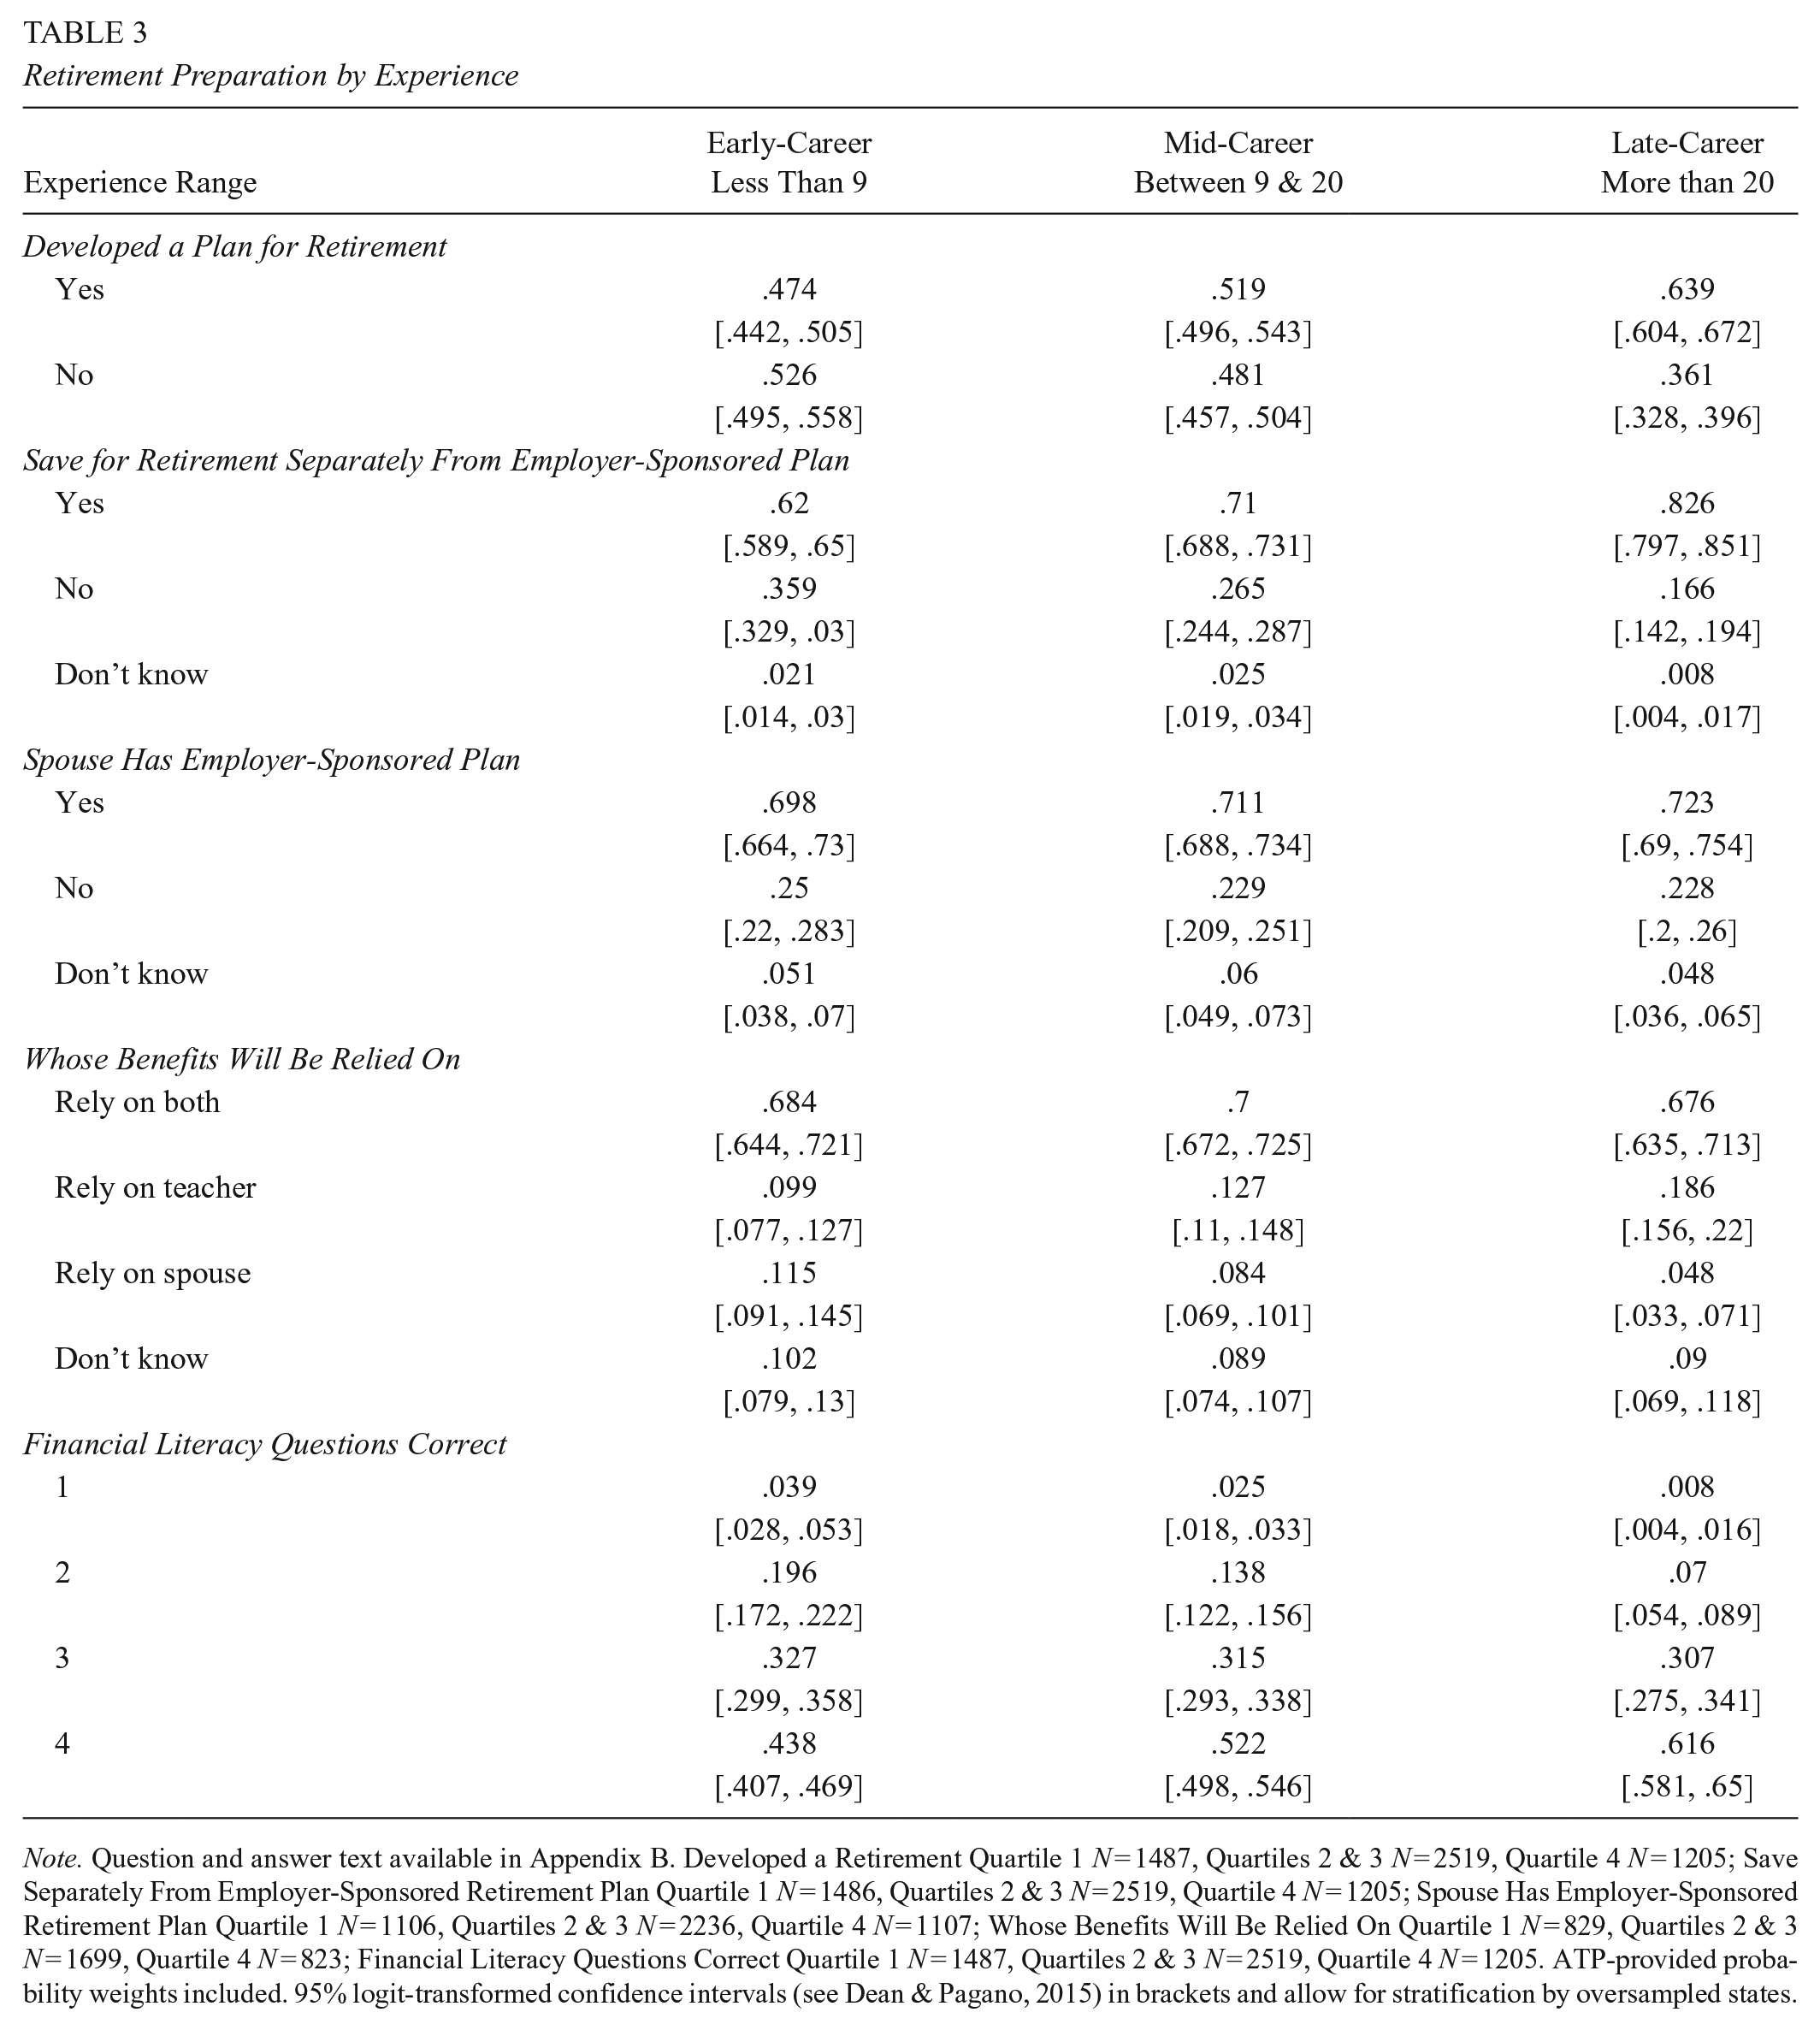
Note. Question and answer text available in Appendix B. Developed a Retirement Quartile 1 N = 1487, Quartiles 2 & 3 N = 2519, Quartile 4 N = 1205; Save Separately From Employer-Sponsored Retirement Plan Quartile 1 N = 1486, Quartiles 2 & 3 N = 2519, Quartile 4 N = 1205; Spouse Has Employer-Sponsored Retirement Plan Quartile 1 N = 1106, Quartiles 2 & 3 N = 2236, Quartile 4 N = 1107; Whose Benefits Will Be Relied On Quartile 1 N = 829, Quartiles 2 & 3 N = 1699, Quartile 4 N = 823; Financial Literacy Questions Correct Quartile 1 N = 1487, Quartiles 2 & 3 N = 2519, Quartile 4 N = 1205. ATP-provided probability weights included. 95% logit-transformed confidence intervals (see Dean & Pagano, 2015) in brackets and allow for stratification by oversampled states.
Prior research suggests that adults who have attempted to figure out how much to save for retirement are more likely to develop a retirement saving plan, stick to that plan, and engage in other formal planning activities like attending retirement seminars or consulting with financial planners (Lusardi & Mitchell, 2011a). Planners also accumulate as much as three times more wealth compared to non-planners (Lusardi & Mitchell, 2007a, 2007b, 2011a).
Results suggest that teachers plan for retirement at lower rates than other college-educated adults. Fifty-three percent of teachers in our sample reported trying to develop a plan for their retirement compared to approximately 60 percent of college-educated adults. 29
Retirement planning varied somewhat by experience. Only 47 percent of early-career teachers have tried to develop a plan and 52 percent of mid-career teachers have. Late-career teachers were the most likely to try to develop a plan, but even among this group, 36 percent have not.
The second question asked if teachers have any money saved for retirement separately from their employer-sponsored plan. Since traditional pensions can leave early- and mid-career teachers with insufficient retirement savings, it is important to understand what other steps teachers are taking to save for retirement. Seventy-one percent of teachers indicate that they have some additional money set aside, 27 percent have no other money set aside, and 2 percent do not know. Experience is associated with an increased likelihood of having additional money saved for retirement. Among early-career teachers, 62 percent had additional money set aside, but that share is 83 percent among late-career teachers.
For the final two questions on retirement preparation, we asked the 85 percent of respondents who reported being married or in a domestic partnership about their partner’s retirement plans. First, we asked if their partner participates in a separate retirement plan offered through their employer. Overall, 71 percent of these respondents report that their partner has a retirement plan offered through their employer, while 23 percent indicated that their partners do not, and 6 percent did not know.
Second, we asked these teachers whose retirement benefits they will rely on during retirement. Sixty-nine percent of teachers said they will rely equally on both benefit plans, 14 percent said they will rely primarily on their benefits, 8 percent of respondents said they will rely primarily on their partner’s benefits, and 9 percent did not know. More experienced teachers indicated they would be more likely to primarily rely on teaching-related retirement benefits rather than their partners’ benefits.
Finally, we included three questions designed to measure financial literacy from Lusardi and Mitchell (2011b) that are correlated with retirement planning (Lusardi & Mitchell, 2007a, 2011a). 30 On these questions, teachers exhibited less financial literacy than other college-educated adults. Fifty-two percent of respondents answered all three questions correctly compared to 68 percent of college-educated adults. 31 This result might be partially explained by the fact that teaching is a female-dominated profession, and women, on average, are found to present lower levels of financial literacy than men (see, e.g., Fonseca et al., 2012). Teachers with more experience, however, were more likely to answer more questions correctly: 62 percent of late-career teachers answered all three questions correctly compared to 44 percent of early-career teachers and 52 percent of mid-career teachers.
Discussion and Conclusion
Retirement planning is important for wealth accumulation, retirement security, and well-being in retirement. Employer-sponsored retirement plans and Social Security are large and important components of retirement savings. Teachers must understand how these components function to be able to create an effective retirement strategy. They must also be knowledgeable to be able to represent their interests and preferences when policymakers consider retirement plan changes.
Using a representative sample of public K–12 schoolteachers, we assessed how much teachers know about their retirement plans and what basic steps they have taken to plan for a comfortable and secure retirement. This paper builds on the literature investigating workers’ financial literacy and its importance for retirement planning and life outcomes (Lusardi & Mitchell, 2011a, 2011b; Lusardi et al., 2020). It also adds to the substantial literature documenting retirement plans’ importance in the teacher labor market and for education funding more broadly (Koedel & Podgursky, 2016).
Our results show that teachers have significant gaps in their knowledge about their retirement plans. While most teachers know what type of plan they participate in, how long benefits will last, and whether they participate in Social Security, a significant share of teachers do not know these basic facts—44.3 percent, 32 percent, and 13.6 percent, respectively.
Teachers exhibited less knowledge about the specifics of their retirement plans. For example, few teachers appear to know how much they or their employers contribute, when they will be eligible to retire, or who contributes to Social Security. Generally, teachers with more experience were more knowledgeable.
Results also show that most teachers are taking steps to prepare for retirement and that more experienced teachers are more likely to take steps. However, teachers face challenges here too. While most teachers have tried to develop plans for their retirement and have personal retirement savings, they are planning at lower rates and exhibit less financial literacy than other college-educated adults. On the positive side, most teachers who are or were married or in a domestic partnership report that their partners have retirement plans.
These results have important policy implications. First, teachers’ limited knowledge about the specifics of their retirement plans indicates that positive reforms could be implemented with minimal disruption to their retirement planning. Combined with the fact that many teachers do not have strong preferences around retirement plan design, this may create an opening for better education to increase support for or decrease opposition to reform.
Nationally, teacher retirement systems face significant funding shortfalls with unfunded liabilities exceeding $600 billion (McGee, 2019; Novy-Marx & Rauh, 2011). Due to these shortfalls, annual per-pupil teacher retirement costs have nearly tripled since 2004 and now account for 12 percent of total per-pupil education expenditures (Costrell, 2023). Recent evidence suggests that teachers might prefer alternative retirement plans to FAS plans and that teachers may not value FAS plans as highly as other aspects of their compensation (Fuchsman et al., 2023; McGee & Winters, 2019). Reforming retirement plans to be fiscally safer and to work better for a larger share of the teaching workforce might be the best way to protect teachers’ retirement.
Second, improving knowledge about Social Security and increasing teachers’ participation could have positive labor market impacts. While 86 percent of teachers knew whether they participate in Social Security, only 40 percent knew that both employees and employers contribute. Prior research suggests that Social Security is a benefit that teachers value more than its cost (Fuchsman et al., 2023). However, teachers appear unaware that they and their employers share in the cost of this benefit, and 40 percent of teachers do not participate due to a long-ago choice by their employer. Given the value teachers place on Social Security, increasing participation in and knowledge about who pays could positively impact recruitment and retention.
Finally, these results suggest that employers, teacher preparation programs, and retirement systems could do more to educate teachers about their retirement benefits and improve financial literacy. If teachers do not know how their employer-sponsored retirement benefits and Social Security work, then it will be very challenging for them to effectively plan for retirement or to adequately represent their interests and preferences in retirement policy discussions. These key stakeholders are well-situated to help educate teachers so that they can plan effectively for and achieve a secure retirement.
Footnotes
Appendix A: Number and Types of Retirement Plans
Plan Types by State/Municipality

| Plan Type | States/Municipalities | ||||
|---|---|---|---|---|---|
| FAS | AL | AK | AZ | AR | CA |
| CH | CO | CT | DE | DC | |
| FL | GA | HI | ID | IL | |
| IA | KS | KC | KY | LA | |
| ME | MD | MA | MI | MN | |
| MS | MO | MT | NE | NV | |
| NH | NJ | NM | NY | NYC | |
| NC | ND | OH | OK | PA | |
| RI | SL | SP | SC | SD | |
| TN | TX | UT | VT | VA | |
| WA | WV | WI | WY | ||
| DC | AK | FL | IN | MI | OH |
| PA | SC | UT | |||
| CB | KS | ||||
| Hybrid | HI | IN | MI | OH | OR |
| PA | RI | TN | UT | VA | |
| WA | |||||
Note. Plan types refer to the general structure of benefit accrual; see text for an explanation of different plan types. FAS plans and final average salary plans; DC plans are defined contribution plans; CB plans are cash balance plans; hybrid plans combine elements of FAS and DC plans. There are 74 state/municipality-plan type combinations. CH is Chicago, IL; KC is Kansas City, MO; NYC is New York City, NY; SL is Saint Louis, MO; SP is Saint Paul, MN.
Appendix B: Survey Question and Answer Text
Appendix C: Sensitivity Checks of Knowledge Results
The main results are the product not only of teachers’ knowledge but also potentially influenced by weighting, multiple assumptions, and sample restrictions. We perform several sensitivity checks to investigate how sample weighting, sample construction, and assumptions impact estimates of teachers’ retirement plan knowledge. The first three sensitivity checks relax the sample restrictions and use a lenient grading scheme. Results reported in Figure 1 are recreated in the column titled “Strict” in Appendix Tables C.1 and C.2.
First, we compare responses to the universe of potential answers for teachers in the teacher’s state/municipality. The response is considered correct if it matches any correct response for the state/municipality. For example, Florida teachers answering that they are enrolled in the state’s FAS plan would be correct because Florida offers an FAS plan even if the teacher is truly enrolled in the state’s DC plan. Results for this check are available in the column titled “Lenient” in Appendix Table C.1. Knowledge estimates from the lenient grading scheme generally correspond with a larger share of teachers answering the questions correctly than under the strict grading scheme. Except for retirement eligibility age results, all estimates are within 7 percentage points of the main (strict) estimates.
Second, the divergence in results from the lenient and strict grading schemes could be either the result of lenient grading or the sample composition since the strict grading scheme’s sample omits teachers in states that can choose their retirement plan and teachers hired during transition years. We reestimate the lenient grading scheme results for only the strict grading scheme’s sample to shed light on whether sample construction accounts for the differences between grading schemes. Results when using the lenient grading scheme on the strict grading scheme’s sample closely resemble the results of the lenient grading scheme on the full sample. These estimates suggest that it is, indeed, the different grading schemes that explain differences between the results rather than the sample composition.
The third check relaxes the two sample restrictions that form the strict scheme to see how these assumptions impact the strict estimates separately. The first restriction limits the sample to teachers that could only plausibly be enrolled in one plan. The second restriction limits the sample to teachers who were not hired in transition years. Results from relaxing the two restrictions independently and together do not differ substantially from the strict results: the maximum difference between results is 1.6 percentage points and the median difference is 0.4 percentage points.
The fourth sensitivity check alters the hire year for teachers (see Table C.2). Hire year had been determined using the difference between the year of survey administration and years of experience in the state, relying on the assumption that teachers have no breaks in service. This check relaxes the continuous service assumption by adding and subtracting 1, 3, and 5 years from the assumed hire year, which has the potential to place teachers into different plans. The results do not differ substantially from the initial strict estimates: the maximum difference in estimates is 4.1 percentage points and the median difference is 0.4 percentage points.
The final sensitivity check investigates whether the ATP-provided sample weights used to make the full sample nationally representative impact the results for the strict sample or experience quartiles. Figure C.1 and Table C.3 provide unweighted results analogous to the results shown in Figure 1 and Table 2. The unweighted results are quite similar to the weighted results. All but one of the differences are less than 5 percentage points, and the median difference is 1.2 percentage points.
Appendix D: Summary Statistics for Full Sample
Observations by State

| State | Strict Sample | Full Sample | State | Strict Sample | Full Sample |
|---|---|---|---|---|---|
| Alabama | 27 | 33 | Montana | N < 5 | N < 5 |
| Alaska | N < 5 | N < 5 | Nebraska | 182 | 200 |
| Arizona | 25 | 27 | Nevada | 0 | 8 |
| Arkansas | 426 | 445 | North Carolina | 94 | 107 |
| California | 581 | 638 | North Dakota | N < 5 | 5 |
| Chicago, IL | 0 | 0 | New Hampshire | 0 | 0 |
| Colorado | 45 | 61 | New Jersey | 41 | 54 |
| Connecticut | 16 | 17 | New Mexico | 26 | 30 |
| Delaware | 9 | 9 | New York | 408 | 461 |
| District of Columbia | N < 5 | N < 5 | New York City, NY | 302 | 393 |
| Florida | 162 | 644 | Ohio | 0 | 49 |
| Georgia | 372 | 395 | Oklahoma | 33 | 34 |
| Hawaii | 8 | 9 | Oregon | 7 | 9 |
| Idaho | 6 | 6 | Pennsylvania | 21 | 54 |
| Illinois | 128 | 143 | Rhode Island | 155 | 173 |
| Indiana | 24 | 24 | St. Louis, MO | 0 | 0 |
| Iowa | 13 | 13 | St. Paul, MN | N < 5 | N < 5 |
| Kansas | 15 | 19 | South Carolina | 36 | 60 |
| Kansas City, MO | 0 | 0 | South Dakota | N < 5 | N < 5 |
| Kentucky | 33 | 37 | Tennessee | 72 | 86 |
| Louisiana | 47 | 58 | Texas | 414 | 512 |
| Maine | N < 5 | N < 5 | Utah | 7 | 8 |
| Maryland | 39 | 45 | Vermont | 0 | N < 5 |
| Massachusetts | 69 | 86 | Virginia | 78 | 100 |
| Michigan | 0 | 41 | Washington | N < 5 | 16 |
| Minnesota | 23 | 24 | West Virginia | 19 | 21 |
| Mississippi | 29 | 35 | Wisconsin | 196 | 219 |
| Missouri | 34 | 37 | Wyoming | N < 5 | N < 5 |
Appendix E: Distribution of Retirement Knowledge Question Responses
Employer Contribution Rates With Alternative Definitions

| Employer Share of Normal Cost | Total Normal Cost | Employer Share of Total Cost | Total Cost | |
|---|---|---|---|---|
| Diff. = 0 | 0.000 | 0.000 | 0.000 | 0.000 |
| Diff. ± 0.01 | 0.145 | 0.041 | 0.058 | 0.014 |
| Diff. ± 0.025 | 0.281 | 0.118 | 0.132 | 0.028 |
| Diff. ± 0.05 | 0.521 | 0.269 | 0.221 | 0.062 |
| Diff. ± 0.1 | 0.771 | 0.578 | 0.455 | 0.206 |
Note. The grading scheme limits correct responses to only those who are most likely correct given teachers’ reported years of experience in the state and omits teachers who could choose which plan to enroll in or were hired in plan transition years. Differences refer to the difference between reported and actual employer contribution rates and retirement eligibility ages. Question and answer text available in Appendix B. Employer Share of Normal Cost, Employer Share of Total Cost, and Total Cost N = 4219; Total Normal Cost N = 3813. ATP-provided probability weights included.
Appendix F: Heterogeneity by Retirement Plan Type Response
Appendix G: Heterogeneity by Gender,Race,and Marital Status
Share Correctly Answering Knowledge Questions by Marital Status

| Married | Prev. Married | Single | |
|---|---|---|---|
| Plan type | .632*** | −.015 | −.055** |
| (.009) | (.027) | (.024) | |
| Retirement Eligibility Age | |||
| Diff. = 0 | .302*** | −.023 | −.044** |
| (.009) | (.025) | (.022) | |
| Diff. ± 1 | .480*** | −.038 | −.038 |
| (.010) | (.027) | (.025) | |
| Diff. ± 3 | .738*** | −.035 | −.041* |
| (.009) | (.025) | (.023) | |
| Diff. ± 5 | .871*** | −.023 | −.034* |
| (.007) | (.020) | (.018) | |
| Social Security | |||
| Who contributes | .395*** | .053* | −.033 |
| (.009) | (.027) | (.024) | |
| Participation | .871*** | .022 | −.034* |
| (.007) | (.017) | (.018) | |
| Benefit duration | .711*** | .032 | −.094*** |
| (.009) | (.025) | (.024) | |
| Employee Contribution Rate | |||
| Diff. = 0 | .024*** | −.009** | −.011** |
| (.002) | (.004) | (.005) | |
| Diff. ± 0.01 | .288*** | −.016 | −.030 |
| (.009) | (.024) | (.021) | |
| Diff. ± 0.025 | .424*** | −.014 | −.021 |
| (.010) | (.027) | (.024) | |
| Diff. ± 0.05 | .605*** | −.007 | −.016 |
| (.010) | (.027) | (.024) | |
| Diff. ± 0.1 | .820*** | −.023 | −.009 |
| (.008) | (.022) | (.019) | |
| Employer Contribution Rate | |||
| Diff. = 0 | .003** | −.003** | −.001 |
| (.001) | (.001) | (.002) | |
| Diff. ± 0.01 | .140*** | −.017 | −.002 |
| (.007) | (.019) | (.017) | |
| Diff. ± 0.025 | .273*** | −.007 | −.007 |
| (.009) | (.025) | (.022) | |
| Diff. ± 0.05 | .522*** | .010 | −.008 |
| (.010) | (.028) | (.025) | |
| Diff. ± 0.1 | .768*** | .001 | .027 |
| (.008) | (.023) | (.020) | |
Note. The grading scheme limits correct responses to only those that are most likely correct given teachers’ reported years of experience in the state and omits teachers who could choose which plan to enroll in or were hired in plan transition years. Differences refer to the difference between reported and actual contribution rates and retirement eligibility ages. Question and answer text available in Appendix B. Plan Type N = 4244; Retirement Eligibility Age N = 4212; Social Security N = 4177; Benefit Duration N = 4244; Employee Contribution Rate N = 4221; Employer Contribution Rate N = 4218. ATP-provided probability weights included. Married null hypothesis is if the share correct is different than zero; previously married and single null hypothesis is that the difference between the share correct for previously married and single is different than the share correct for married. Standard errors stratified by oversampled states. ***p < .01; **p < .05; *p < .1.
Acknowledgements
We thank the Walton Family Foundation and the Equable Institute for financial support. We thank Heidi Erickson for her help on earlier versions of this work. We thank Andrew Camp and participants at the AEFP 46th Annual Conference for their comments.
Declaration of Conflicting Interests
The author(s) declared the following potential conflicts of interest with respect to the research, authorship, and/or publication of this article: Josh McGee is a member of the Equable Institute board of directors. Dillon Fuchsman and Gema Zamarro have nothing to disclose.
Funding
The author(s) disclosed receipt of the following financial support for the research, authorship, and/or publication of this article: The Walton Family Foundation and the Equable Institute provided financial support for the project.
Ethical Approval
The survey used as the basis for this study was approved by the University of Arkansas IRB.
Open Practices
The survey data used in this article can be obtained online from the RAND American Educator Panel Data Portal (https://www.rand.org/education-and-labor/projects/aep/data-portal.html). Additional materials for this article are available on openICPSR (![]() ).
).
Notes
Authors
DILLON FUCHSMAN is a senior research associate with the Urban Education Research Center at the University of Missouri — Kansas City, 615 E 52nd St., Kansas City, MO 64110; email:
JOSH MCGEE is a research assistant professor and associate director of the Office for Education Policy in the Department of Education Reform at the University of Arkansas, 751 W Maple St., Fayetteville, AR 72701; email:
GEMA ZAMARRO is a full professor and endowed chair in teacher quality in the Department of Education Reform at the University of Arkansas, 751 W Maple St., Fayetteville, AR 72701; email: