
Abstract
Social scientists have long recognized field of study as an important mechanism of gender differentiation and stratification in U.S. higher education, but they have rarely attended to how elective curriculums mediate gender differentiation in major selection. Under elective curriculums, major selection is an iterative process, in which students select courses in stepwise fashion at the beginning of each academic term, and are able to change majors early in their undergraduate careers. We observe how an elective curriculum mediates gendered patterns of major selection, using a novel data set describing 11,730 students at a large public research university. We find (a) gender and intended major are strongly correlated upon college entry; (b) large proportions of students change majors between entry and declaration; (c) because most changes are to academically adjacent fields, gendered patterns in field of study persist through the undergraduate career. Findings suggest the value of an iterative conception of major selection and offer tractable means for intervening in the process through which students select majors.
JEL codes: I21, I24, I26, J16.
Keywords
Introduction
Major field of study is an important mechanism of stratification in higher education. Majors vary in their reputations for curricular difficulty and in the distribution of grades students receive (Armstrong & Hamilton, 2013; Arum & Roksa, 2011). They serve as signals to employers about graduates’ training, career orientations, and likely fitness for particular jobs (Bostwick, 2016; Quadlin, 2018; Roksa & Levey, 2010). And they are gendered. Majors vary both in their gender demography and in the cultural meanings associated with different fields of study (Charles & Bradley, 2009). These facts warrant ongoing investigation by social scientists, who have accreted a substantial literature on the relationship between gender, field of study, and occupational stratification and inequality (e.g., Buchmann et al., 2008; England et al., 2020; Gerber & Cheung, 2008; Jacobs, 1996; Morgan et al., 2013). Yet researchers have only begun to study how the elective curriculum itself mediates patterns of gender major segregation.
Colleges and universities in the United States are commonly organized on an elective curriculum, in which students select a composite of courses to meet requirements for declaring particular majors. Elective curriculums give students considerable freedom to change majors through the early stages of their undergraduate careers. At least in theory, this makes it possible for students to explore multiple potential majors as their coursework accumulates. The ubiquity of elective curriculums in the United States calls for conceptualizing major selection as an iterative process, in which undergraduates’ accumulating experiences in college over time may at least potentially influence when and how they commit to majors. Yet the iterative character of academic progress under elective curriculums—the extent to which they entail cumulative consideration and decision-making about coursework—is only occasionally recognized and directly observed in studies of major selection (Kizilcec et al., 2023).
A conceptualization of major selection as iterative is especially apt for studies of gender and academic choice, since prior work demonstrates that gender identities reciprocally evolve with educational experiences from children’s earliest years forward (Armstrong & Hamilton, 2013; Bettie, 2003; Martin, 1998; Musto, 2019; Thorne, 1993). Prior research in the United States and cross-nationally has shown clear patterns of gender asymmetry in women’s and men’s undergraduate fields of study (Charles & Bradley, 2009) and estimated the relationship between this asymmetry and subsequent occupations and earnings over the life course (Bobbitt-Zeher, 2007; Kim et al., 2015). While this is a robust field of inquiry, we argue that major selection under elective systems is best understood as an iterative process rather than a one-time activity, and that analyzing it at the level of majors rather than aggregate academic categories better reflects the empirical complexity of major selection. Doing so allows us to make progress on two fronts.
First, students’ field of study typically is measured only once (see Denice, 2020; Riegle-Crumb et al., 2016, for exceptions), even while elective curriculums enable students to change majors as their college experiences evolve. Indeed, data sources rarely record more than one instance of major selection—whether at entry, declaration, or graduation—thereby limiting the ability to observe transit between majors. Academic exploration is encouraged especially on admissions-selective campuses emphasizing the liberal arts, where elective curriculums are associated with ideals of self-actualization and self-discovery (Delbanco, 2012; Mullen, 2010).
Scholarly intuition as well as prior research leave open the question of whether elective curriculums might reenforce or mitigate the academic predilections students bring with them to college. On the one hand, the freedom to explore and choose among a wide variety of courses over multiple academic terms might enable discovery of new academic opportunities and contacts with mentors and peers who might encourage novel preferences (Chambliss & Takacs, 2014) and the pursuit of novel “possible selves” (Markus & Nurius, 1986). On the other hand, freedom of choice might enable the “indulging” of gendered selves observed by Charles and Bradley (2009), enabling women and men to elect courses that are compatible with prevailing gender ideology. Finding out which of these is the case requires observing selected majors at multiple points in the undergraduate career.
Second, prior quantitative inquiry on gender and field of study has typically relied on statistical models that oblige researchers to radically reduce complexity on what we might call the supply side of academic selection. Undergraduates in U.S. universities may have scores or even hundreds of potential majors to declare, yet researchers typically compress this variety into large aggregate categories—STEM (science, technology, engineering, and mathematics), social sciences, arts and humanities, for example—occluding observation of transit between majors in the same aggregate category. Changing majors within social sciences—from anthropology to economics, for example—might be a larger move both demographically and substantively than going from statistics (STEM) to economics. The heterogeneity of major supply is also important, because students often feel overwhelmed by the wide range of academic options they face (Bailey et al., 2015; Rosenbaum et al., 2006). Thus, there may be much more movement between majors than commonly used statistical models imply.
The research presented here enables progress on both fronts. On the first, we take advantage of a unique dataset describing the demographic characteristics, measured academic accomplishment, gender, and choices of major among 11,730 students at a large public research university in the United States. These data contain observations of majors at two points in each student’s undergraduate career: (a) at college entry, reported as intended major and (b) after major declaration during the 3rd academic year. This allows us to assess the amount of transit between fields of study among entire cohorts of students at an institution with an elective curriculum and hundreds of possible majors.
On the second front, we utilize a statistical technique that retains the complexity of empirical relationships on the supply side of academic selection. Correspondence analysis (CA), a methodological toolkit common in European social science but little used in North America, enables us to observe transits across the entire population of available majors.
This article makes three key contributions. First, we demonstrate the value of modeling major selection under elective curriculums as an iterative, stepwise process. The majority of undergraduates at our case university change majors at least once, providing evidence of the ubiquity of the phenomenon. Second, observing major selection as an iterative process enables us to see that overall patterns of gender difference in fields of study persist because the majority of movement is between majors adjacent to one another in academic space both substantively (e.g., from one engineering major to another) and demographically (i.e., between majors with similar student demographic composition). Iteration is common at the individual level despite population-level stability in the distribution of gender across undergraduate fields of study. Prior works are suggestive of substantively adjacent transit, but they mostly focus on students leaving STEM into other aggregate categories of majors (e.g., Chen, 2013). Third, we make a contribution to academic practice and administration: Because major selection is iterative, educators and institutions have considerable room to experiment with interventions of information and curricular design that might mitigate or redirect how students and majors come together.
Prior Work
U.S. colleges and universities organize undergraduate programs around majors: clearly specified programs of study that enable concentration in a specific disciplinary or substantive domain. Majors matter for students’ college experiences, because the academic content and character of majors vary with the disciplinary traditions with which they are associated (Lattuca & Stark, 2009). Majors also matter long after students leave college. Earnings returns to college vary substantially by fields of study. A degree in petroleum engineering, for example, is associated with more than three times the earnings of an early childhood education degree (Carnevale et al., 2015). Earnings premiums for specific majors are almost as large as what accrues to a college degree relative to a high school diploma (Altonji et al., 2012). Such premiums hold even after controlling for measures of academic accomplishment (Arcidiacono, 2004). And majors serve as signals to potential employers about graduates’ training, career orientations, and likely fitness for particular jobs (Quadlin, 2018; van de Werfhorst, 2016).
Social scientists have produced a sizable literature on the relationship between gender, field of study, and occupational stratification and inequality. Overall, this work finds that socioeconomic status is a primary factor in sorting students into colleges and universities with different selectivity rates and prestige, while gender is a primary factor sorting students into different majors within institutions (Gerber & Cheung, 2008). In one of the most comprehensive inquiries to date, Davies and Guppy (1997) regressed choices of lucrative versus nonlucrative fields of study on social background characteristics (e.g., gender, number of siblings, family structure, age, race/ethnicity, cultural resources, and socioeconomic status) and found only gender to show a significant effect, with male students being more likely than female students to be in fields of study associated with greater postcollegiate earnings.
Majors vary both in their gender demography and in their cultural meanings. Although there has been a general increase in the enrollment of women in higher education such that women are now the majority of entrants and graduates in the United States and in other industrial countries, there are many fields where women (or men) are substantially overrepresented (DiPrete & Buchmann, 2013). Gender segregation by field of study, typically summarized as the share of women (or men) who would have to change fields to achieve gender balance among all fields, declined rapidly in the 1970s but stagnated in the early 1980s. While women’s entrance into male-dominated fields propelled initial desegregation, men’s reluctance to enter female-dominated fields has stalled further integration (England & Li, 2016). Charles and Bradley (2009) suggest that gender segregation can be explained in part by the emphasis fields place on specific skills. Skills associated with nurturance and interpersonal relationships are regarded as feminine; while strength, analytical acumen, and interaction with things (rather than people) are associated with masculinity. Charles and Bradley additionally argue that whenever norms of self-expression dominate societies, students tend to be more likely to “indulge” their gendered selves—opting for fields of study associated with their own gender. 1 Ethnographic work by Hamilton (2014) suggests that elective curriculums may abet this phenomenon when they include strongly gendered fields of study (e.g., interior design and fashion merchandising).
As important as majors are for college experiences, future jobs and earnings, and gender identity and stratification, the accomplishment of major declaration under elective curriculums is very difficult to observe empirically at scale. When students are given freedom and even encouraged to sample a variety of academic fields early in college, commitment to a major may be an iterative and cumulative phenomenon: comprising a series of incremental actions about what specific courses to consider and select (Chaturapruek et al., 2021). Even when coursework completed early in the undergraduate career is statistically associated with subsequent major declaration (Lang et al., 2022), elective curriculums leave considerable room for transitions to adjacent majors or to entirely new fields of study. While the overall complexity of this process awaits its appropriate inquiry mechanism, an important next step is to find means of observing whether, and how much, students’ declared majors depart from their expressed major preferences at college entry. This is the goal of our inquiry here.
Our work below extends promising recent empirical contributions into the organization of undergraduate academic progress by Denice (2020) and Pardos and Nam (2020). Analyzing a sample of undergraduates entering three U.S. research universities between 2013 and 2015, Denice found that a third of observed students changed professed majors at least once in their college careers and that an additional 12% changed majors two or more times. Our own inquiry extends this work by taking advantage of data describing entire cohorts of students enrolling in a comprehensive research university with an elective curriculum. It also complements Pardos and Nam’s (2020) utilization of comprehensive transcript data of undergraduates at the University of California, Berkeley, to depict the relative adjacencies of different fields of knowledge as expressed in student course selections. Taken together, these studies and our own suggest the importance of attending to the relationship between course selection and academic architectures with fresh scrutiny.
Setting, Data Source, Method, and Empirical Strategy
We take advantage of panel data describing all students who entered a large, public, comprehensive research university in the United States in 2009 and 2010 (N = 11,730). 2 We first observe the distribution of demographic attributes and academic achievement across these students’ intended fields of study upon entering college. We then observe the same distribution 3 years later, when virtually all the students had declared majors, and compare the patterns at these two points in time. For each student, the data contain information on gender, parent educational attainment, household income, and academic achievement.
Setting
The empirical setting is a large, comprehensive public research university enrolling approximately 50,000 undergraduates enrolled at any given time. We here refer to the institution by the pseudonym Big State. In its undergraduate admissions Big State is moderately selective, admitting approximately three-quarters of applicants who apply each year. Its 6-year graduation rate is approximately 80%. Big State draws from among the most academically accomplished students statewide: Nearly half its undergraduates finished high school in the top 10% of their classes. The majority of Big State’s undergraduate self-identify as White, and approximately 25% are first-generation college students.
Big State expects students to identify intended major fields of study in their applications, even though they are not admitted to the university on the basis of intended major. Applicants who do not have an intended major at application are encouraged to choose a “general studies” option. After matriculation, students face little official constraint in changing majors beyond the following: Only those students with a 2.0 grade point average or above are eligible, and intramural departments and programs have the authority to specify their own requirements. Business administration, for example, requires a grade point average of 3.5 or above. There is evidence of a presumption that many students will continue to consider major options as their college careers unfold: Some majors—business and specialized engineering majors, for example—can only officially be declared after matriculation; university communications provide explicit advice and encouragement for students to make major changes during the second or third semester. Thus, we have reason to be agnostic about the relationship between stated intentions upon application and declared fields of study in junior year.
Data Source
We utilize panel data compiled from multiple administrative units at Big State describing undergraduate students who entered the university as freshmen during the years 2009 and 2010. The dataset includes full transcripts, on which intended or declared majors are specified for each semester of enrollment. Our data additionally contain self-reported demographic information describing students’ gender (M/F); family income (by intervals); parents’ educational attainment; and two measures of prior academic achievement: high school class rank and scores on standardized tests (ACT/SAT).
A total of 12,217 students entered the university as 1st-year students during 2009 and 2010. Of these, our research sample of 11,730 students excludes cases with missing data on the variables describing gender, family income, parents’ educational attainment, high school class rank, and standardized test scores (i.e., SAT/ACT scores). Table 1 provides descriptive statistics of these data.
Descriptive Statistics of Demographic and Academic Characteristics of Big State University 2009 and 2010 Freshman Entrants Study Sample (N = 11,730)

Source. Big State University transcript dataset.
Method
We use CA, a statistical and visualization technique developed to describe the most distinct patterns and most important differences and similarities among large populations of cases described by multivariate data. Because CA is novel to many educational and social scientists in North America (but see Ferrare, 2013; Rawlings & Bourgeois, 2004), we devote additional care and space to a description of our method and analytic strategy here.
CA is part of a family of techniques known as geometric data analysis, an approach to multivariate statistics with three primary utilities. First, it is spatial. CA was designed to represent multidimensional spaces for observation of mathematical distances among cases. Second, it is well-suited to description and visualization of empirical complexity because it encompasses measures of every variable describing every case in a population. Third, CA is now highly formalized, with well-established conventions of implementation, data representation, and replication. It is widely used in environmental sciences, plant sciences, and agriculture (e.g., Fried et al., 2008; Legendre & Legendre, 2012; ter Braak, 1986). CA also enjoys a large research community of European sociologists of culture working in the traditions of Pierre Bourdieu and Jean-Paul Benzecri (Blasius et al., 2019).
The statistical building blocks of correspondence analysis are straightforward (Le Roux & Rouanet, 2004, p. 41). One begins by determining the Euclidean distances between the elements of the contingency table of interest, in our case fields of study, as rows and combined student attributes as columns. The distances are determined using
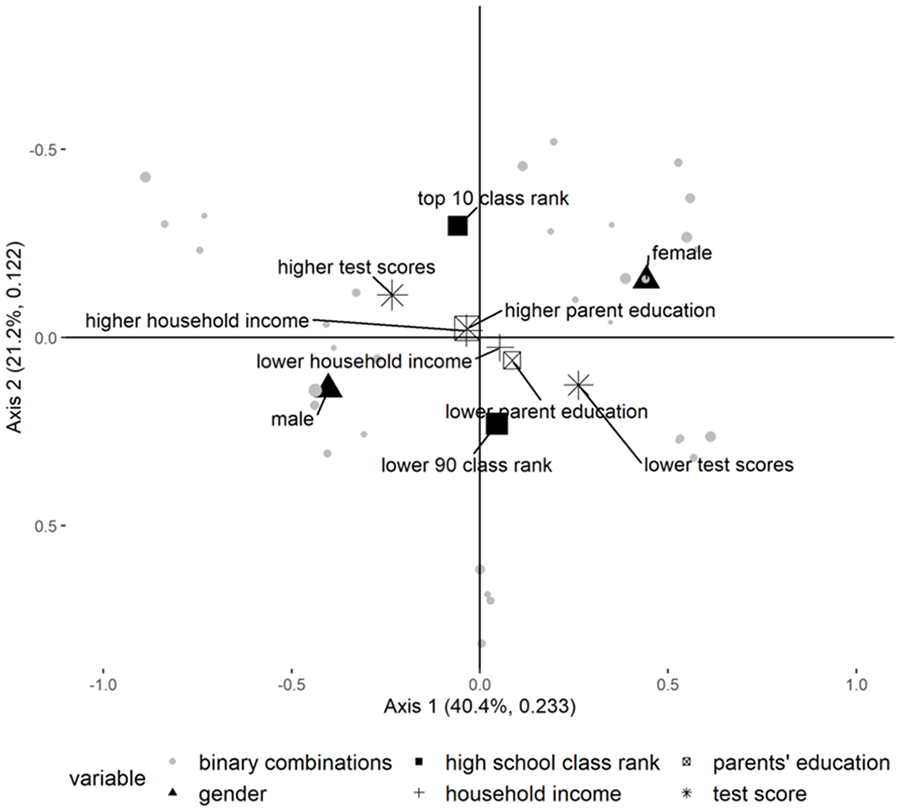
Weighted mean points for gender, household income, parent education and academic achievement in the academic space of Year 1, plane of Axis 1 and 2 (61.6% of overall variance).
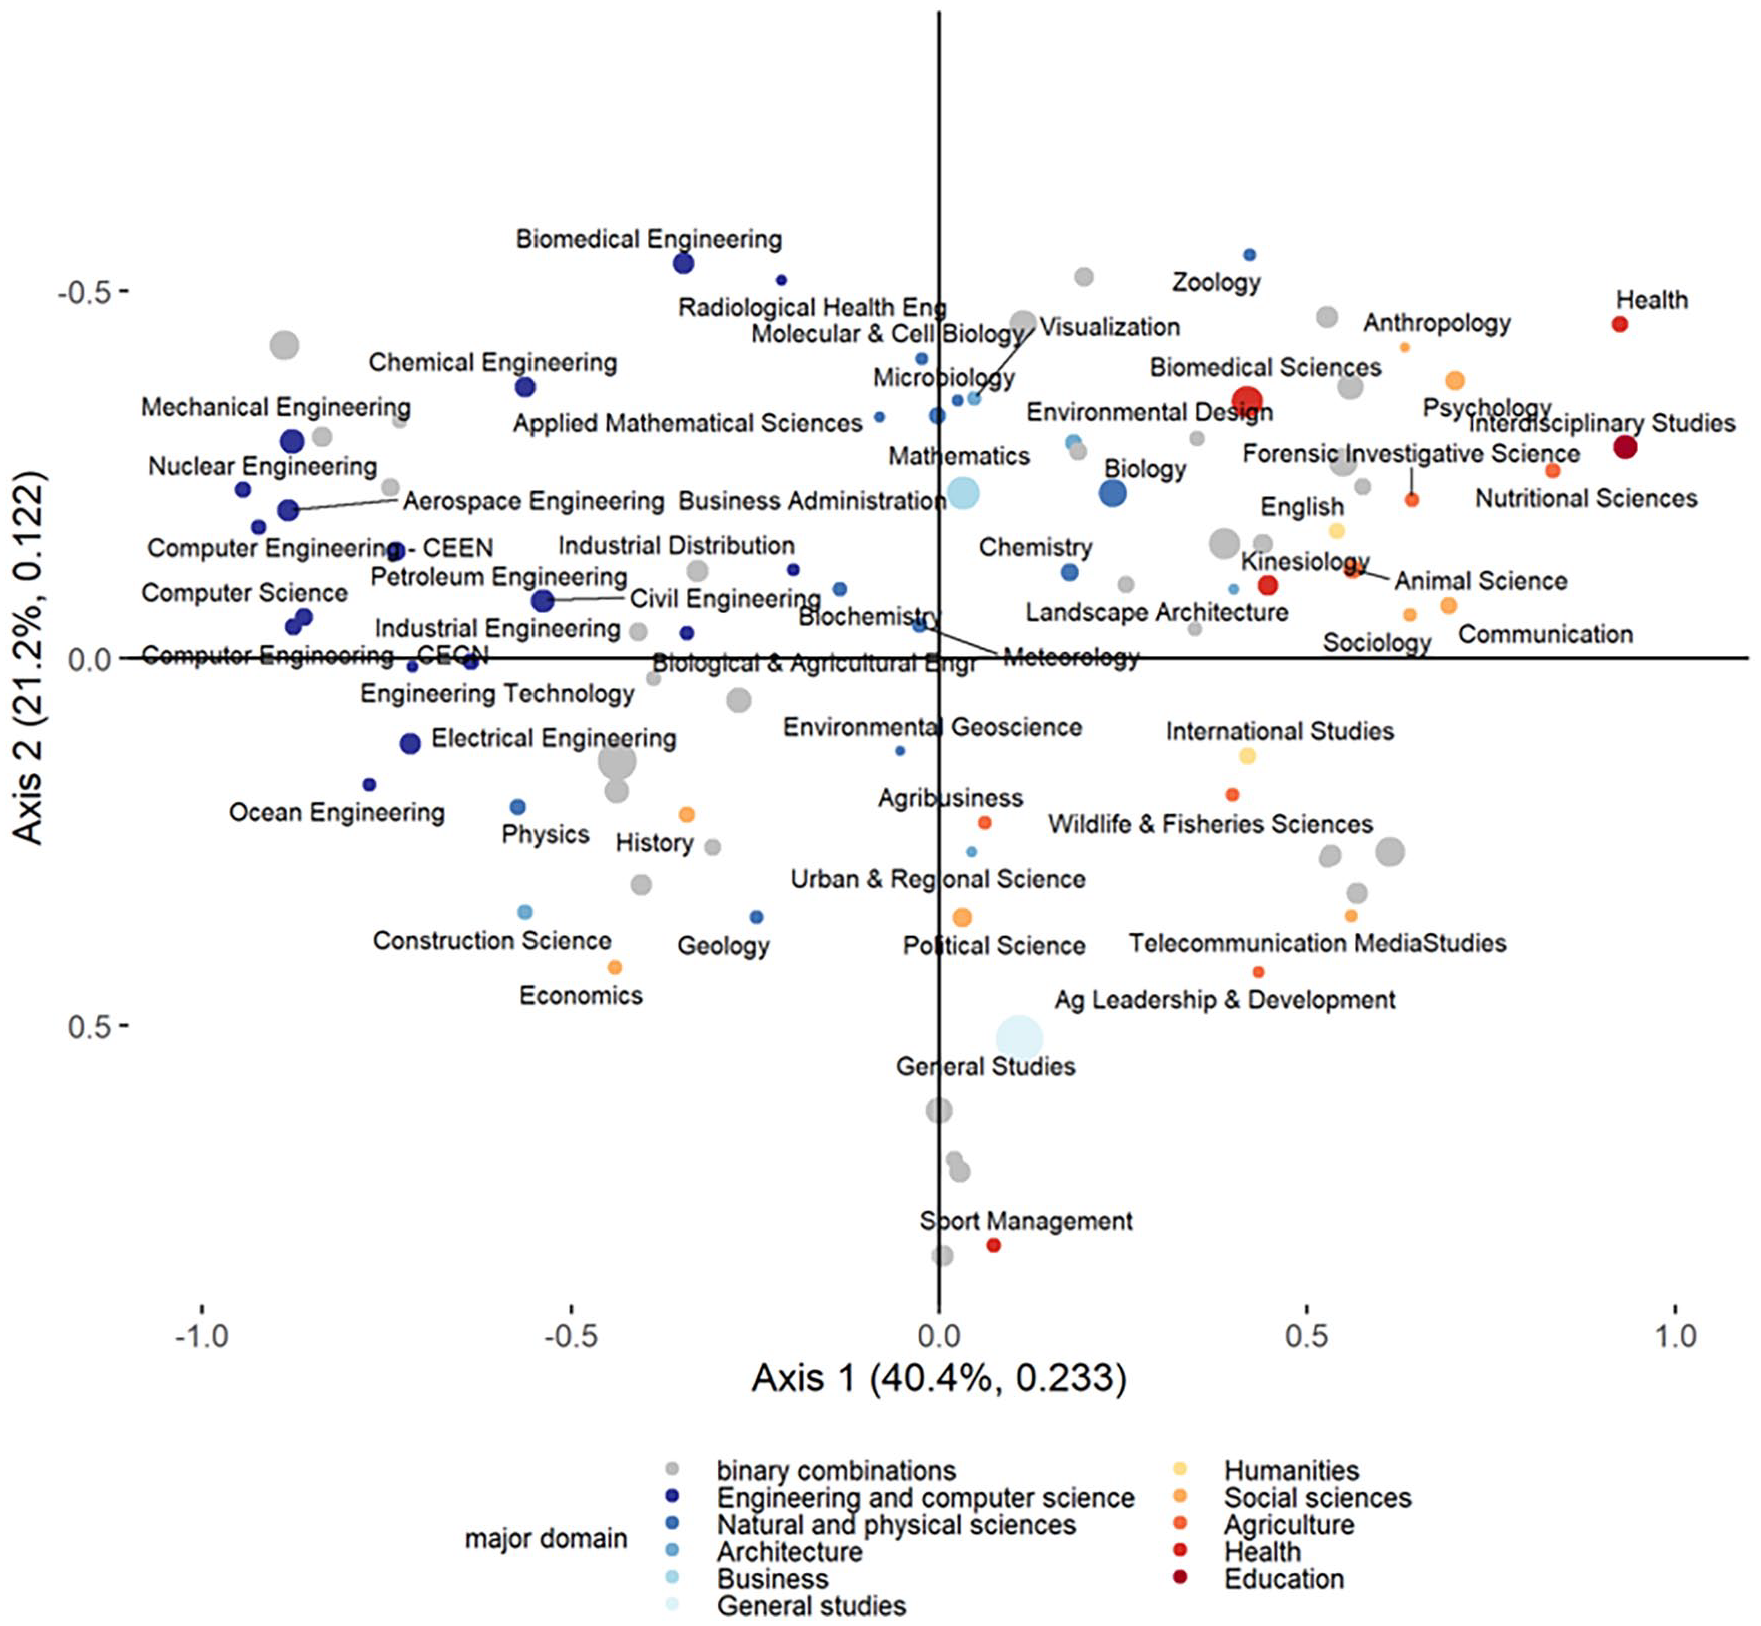
Distribution of intended fields of study in the academic space of Year 1, plane of Axis 1 and 2 (61.6% of overall variance).

Weighted mean points for gender, household income, parent education and academic achievement in the academic space of Year 3, plane of Axis 1 and 2 (56.5% of overall variance).

Distribution of intended fields of study in the academic space of Year 3, plane of Axis 1 and 2 (56.5% of overall variance).
CA is well-suited for visualizing the simultaneous distribution of multiple demographic attributes across the complicated academic landscape of undergraduate majors at a large research university like Big State. We use the technique descriptively: CA tells us where cases (college students, clustered by major) are located relative to one another in a multivariate space. An important virtue of the method is that it reveals both the most prominent similarities and the most prominent differences between fields of study and combinations of demographic attributes in the population.
CA does not, indeed cannot, provide insight on how or why cases or clusters come to be located as they are. However, it does provide novel visualizations of relative positions that can corroborate or challenge other statistical analyses, generate research questions, and inform theory.
Empirical Strategy
Our analysis proceeds in four steps. First, we combine data from five variables describing Big State students—gender, parents’ educational attainment, household income, high school class rank, and standardized test scores—with intended or declared major to construct two academic spaces, one representing data for 1st-year students (Year 1) and the other representing juniors (Year 3). Since our window of observation is limited to 2009 to 2014, only 84% of the cohort reached Year 3 in time to be included in the analysis of that year.
The spaces are Euclidian; within them, combined attributes are represented as clusters of points (Le Roux & Rouanet, 2004). To enhance the clarity of visualizations, we set fields of study with fewer than 25 students as well as students who enrolled in the collaborative program with a partner community-college district as supplementary elements.
3
This selection left us with 57 fields of study in Year 1 and 75 for Year 3 as active elements in the analysis. Our concatenation of all five variables represented in these data—recoded into binary variables (see details about this analytic decision below)—yielded 32 categories of combinations (
Second, we observed change over time by comparing the academic spaces of Year 1 and Year 3. To obtain a measure for change, we correlated the coordinates of majors of the most prominent two axes of each academic space. Correlation coefficients close to 0 indicate change, while those closer to 1 or − 1 indicate stability.
Third, to discern which of the five student attributes in our dataset (gender, parents’ educational attainment, household income, high school rank, or test score) most prominently influence variance on each axis in our academic spaces, we projected each of the five variables on each axis and calculated the correlation ratio (η2), or the ratio of between-variance to the total variance.
Fourth and finally, we analyzed the major transit patterns for all students by calculating the proportions of students who (a) persist with their initial major, (c) transit into another major within the same domain as the initial major, (c) transit into a major within a different domain, and (d) do not reach Year 3 within our window of observation.
In their raw formats, gender is a binary variable, income and educational level are categorical variables, and high school grade rank and SAT/ACT scores are continuous variables. We recoded all nonbinary variables into binary variables, for two reasons. First, when binary and nonbinary variables are combined in correspondence analysis, they can produce strong statistical discrimination. Rendering all variables in binary form minimizes this statistical artifact. Second, since we combined the values of all variables into one combinatorial variable, creating binary variables was a way to reduce the number of empty or low-frequency cells in the input tables for the correspondence analysis. 4
Our guiding principle for the creation of binary variables was to obtain fairly balanced distributions while preserving some sociological meaning of the resulting categories. We recoded household income, reported as an interval variable, into a binary of up to $79,999 (0) or $80,000 and above (1). 5 For parental educational level, we used father or mother, whichever was highest. We then created a binary by describing this parent’s possession of an associate degree or lower (0) and bachelor’s diploma or higher (1). Because SAT scores are more commonly reported than ACT scores in U.S. schools, we used the SAT score in cases where a student had both scores reported. For SAT we used the “Reasoning” score, since it is a single score with both mathematical and writing components; for ACT, we used the “Composite” score. Since both the SAT Reasoning and ACT composite scores are normally distributed, we made the binary cut at the median (1,180 for SAT and 26 for ACT) and then combined them to one variable indicating lower (0) or higher (1) score. Finally, the high school grade rank was cut at the 90th percentile, separating those who are eligible for automatic admission to Big State (1) from all others (0). While this cut-point seems high, the distribution among the two categories is fairly balanced for students in our sample (see Table 2).
Descriptive Statistics for Five Binary Variables of Demographic and Academic Characteristics of Big State University 2009 and 2010 Freshman Entrants Study Sample (N = 11,730)

Source. Big State University transcript dataset.
Note. Gender has not been recoded. We use the following cut-points for ordinal and continuous variables: parents’ educational level bachelor’s diploma or higher; family income $80,000; standardized test scores 1,180 for SAT and 26 for ACT; high school class rank 90th percentile.
From these data, we constructed two contingency tables—one each for Year 1 and Year 3—by cross-classifying the students according to fields of study (as rows) and combinations of demographic attributes (as columns; cf. Börjesson & Broady, 2016). By combining demographic attributes in this way, we were able to compare the distribution across fields of study of (for example) (a) higher academically achieving daughters of highly educated parents with higher income with (b) lower academically achieving sons of lower educated parents with lower income—and all other possible combinations. In other words, the academic spaces are constructed by observing the simultaneous influence of all four demographic attributes on field of study. This means that the relative primacy of any demographic attribute in shaping academic space in Year 1 or Year 3 is an outcome of the analysis, not of representational strategy.
Following Mann and DiPrete (2013), we also checked whether major gender composition was related to course work heterogeneity. We did so by calculating the Gibbs-Martin diversity index for each major and then correlated this with the axes most strongly related to gender.
Results
Put most briefly, the results presented below show that gender and intended major are strongly associated at point of entry to Big State. In addition, despite substantial major transit during the first 2 years of college, the gendered pattern in fields of study persists at Year 3 because most transits are to academically adjacent fields (Table 3). The overall association between fields of study and combinations of demographic attributes is substantial, with a φ2 (mean square contingency coefficient) of .58 in Year 1 and .72 in Year 3. Visualizations of each contingency table bring the most prominent patterns to light, as we will illustrate throughout this section.
Initial Field of Study Year 1, Share of Students Who Remain or Transit by Year 3, and Stalled Progression (N = 11,730)

Source. Big State University transcript dataset.
Note. Stalled progression means that students had not reached junior classification (Year 3) during our window of observation. Our classification of majors in major domains largely corresponds to this particular institutional setting and the organization of departments into schools or colleges. When, for example, an engineering major is housed outside the school of engineering, we have classified this as an engineering major, congruent with The Classification of Instructional Programs (CIP) coding of Big State University. Since education has only one major category, students technically cannot change to another major within this domain.
As we proceed with interpretation, we will focus on the first two axes in both the Year 1 and Year 3 tables. For Year 1, the first two axes represent 61.6% (40.4 + 21.2) of the overall variance; for Year 3, they represent 56.5% (38.9 + 17.6). Following guidelines and rules of thumb for CA and retaining all axes contributing above average to the overall variance would have left us with five axes for each year (Le Roux & Rouanet, 2004, p. 49). The substantial drop in eigenvalues between the second and the third axis for both Year 1 (21.2% to 4.8%) and Year 3 (17.6% to 5.8%) means that the first two axes are statistically much more stable; thus, we limit our presentation to them here.
Year 1 Results
Here we consider the intended majors that Big State’s matriculated 1st-year students in the years 2009 and 2010 reported in their applications. This information provides traces of the predispositions toward fields of study students bring with them when they arrive at college. By including intended major with the data describing students’ gender, social class, and academic accomplishments (test scores and high school class rank) in the analysis, we are able to ascertain the relative prominence of gender as a characteristic associated with intended major at the very beginning of the college career.
The CA for Year 1 produces two clouds of points: one for combined student attributes and one for fields of study. Figure 1 shows the cloud of points for combined attributes in the plane of axis 1 (horizontal) and axis 2 (vertical). Each gray point is a combined attribute. Points are closer to each other if they are equally represented in the same majors and farther apart if they are overrepresented or underrepresented in different majors. In Figure 1, we facilitate readability by also plotting the mean points of each category of the binary variables. Gender is the most prominent measured demographic variable related to undergraduate fields of study in Year 1 (Figure 1). A closer inspection of the demographics shows that the horizontal axis separates male students with higher SAT/ACT scores, mainly from the top high-school class rank and parents with more education, from female students with lower SAT/ACT scores. In other words, simultaneous with gendered distinctions, distinction between fields of study along the first axis corresponds with differences in students’ class background and prior academic attainments.
Gender also contributes substantially to the vertical axis, but it interacts with measured academic accomplishment in an almost inverse fashion compared to the horizontal axis. Regardless of household origin, males with lower prior academic attainments (represented in the lower portion of Figure 1) are distant from males with higher academic attainments and from females at all levels of academic attainment.
Figure 2 depicts the cloud of points for all fields of study. Their relative position is determined by the measured characteristics of intended majors (again: gender, household income, parent education, high school class rank, and test score). As reference, each combined attribute has been plotted as a gray point. Each field of study can be thought of as having a demographic profile, that is, a certain share of higher academically achieving daughters of highly educated parents with higher income, lower academically achieving sons of lower educated parents with lower income, and so on. Fields of study with similar demographic profiles are located relatively closer together, while those that are far apart along one dimension are dissimilar in terms of the attributes that are most salient along that dimension. While the structure depicted in Figure 2, together with subsequent figures, might lend itself to an array of interpretations, the weight of statistical evidence from a correspondence analysis is based on an axis-by-axis inspection of those elements—rows and columns—that contribute above average to the variance of each axis.
Consider first the horizontal axis of Figure 2. The main substantive distinction among fields of study along this axis might be described as fields about things versus fields about people (Su et al., 2009), or technical fields versus care fields (Barone, 2011). Dispersion of fields across this horizontal axis separates almost all of Big State’s engineering majors (toward the left) and social science, leisure/fitness, and health-related fields (toward the right). This most clear-cut demographic distinction appears because male students with higher SAT/ACT scores tend to be overrepresented—given their representation in the student body at large—at a common set of majors including mechanical engineering, aerospace engineering, electrical engineering, petroleum engineering and computer science, all of which are clearly distinguished from majors with large proportions of female students with lower test scores, such as interdisciplinary studies (the major preparing for a teacher certificate), biomedical sciences, psychology, health, general studies, nutritional sciences, and communication. Fields of study closer to the midpoint of the first axis, such as chemistry, biology, and political science, have a more balanced distribution of female and male students.
Much in line with the findings made by Mann and DiPrete (2013), imbalances in gender composition of majors are little related to coursework heterogeneity. The correlation between the coordinates of the fields of study on the first axis and the measure of coursework heterogeneity, the Gibbs–Martin index, is .20, indicating statistical independence. 6
The vertical axis in Figure 2 shows a distinction between those enrolled in general studies and those enrolled in biomedical sciences, biomedical engineering, business administration, interdisciplinary studies, and biology. Since general studies is a program for those who have yet to declare a major, this axis appears to separate students still searching for majors from those who have already made a major commitment. Although, at first glance, this axis might appear related to systematic variation in coursework heterogeneity, the correlation coefficient for the coordinates of the fields of study and their segregation index is close to zero (–.03), just as for the first axis. The opposition between majors instead corresponds to differences in measured academic accomplishment (cf. Figure 1).
These gendered patterns echo main findings from previous research on gender and major choice (e.g., Charles & Bradley, 2009; DiPrete & Buchmann, 2013; Jacobs, 1996) as well as student perceptions of gender bias against women (Ganley et al., 2018). However it is important to highlight that this empirical pattern was obtained by putting these previous findings to the test by including other demographic attributes (household income, parent education) and two measures of prior academic accomplishment (high school class rank, test scores). We underline that this highly gendered axis was not predetermined by the design of the analysis but, instead, emerged as the most prominent pattern in the empirical material. Both axes are outcomes of an agnostic process of statistical description.
Year 3 Results
By Year 3, well over half of Year 1 students have changed majors, with men and women equally likely to change. 7 This finding is important on its own, because it indicates that the choice afforded by Big State’s elective curriculum is shaping processes of major selection and commitment. We will return to this point in the discussion. Additionally, since some majors at Big State can only be declared after matriculation, the total number of fields of study and specializations is slightly larger in Year 3 (n = 107) than in Year 1 (n = 99). This also is important, because it suggests that the task of major selection may grow more complex as the undergraduate career unfolds—a point that prior work focusing on initial majors has been unable to capture.
At the same time, our results indicate that the basic demographic structure of the academic space at Big State remains stable despite this fluidity (Figure 3). 8 In fact, the gender dispersal observed at Year 1 is a bit stronger at Year 3. Household income and parent education level are distributed similarly in the academic space of Year 3 as they were in Year 1. The only observable change in the distribution of student attributes is in academic achievement. In Year 1, high school class rank was a more distinguishing feature than test scores; this is reversed in Year 3, when test scores are more distinguishing than class rank. 9 However, there is still considerable overlap between higher and lower grades as well as test scores.
The stability observed among combined attributes is clearly visible in the cloud of points for fields of study in Year 3 (Figure 4). Although the number of majors has increased, the relative positions of fields of study in relation to each other is remarkably similar to the academic space of Year 1. We continue to find most of the engineering majors on the left side and interdisciplinary studies, health, communication, psychology, agricultural communications, and journalism on the right side along the horizontal axis. The vertical axis of Year 3 also bears a clear resemblance to Year 1, with majors such as agricultural leadership and development, general studies, construction science, and sport management located in the lower end; with biomedical sciences, biomedical engineering, mechanical engineering, business honors, and chemical engineering in the upper end.
Overall, large proportions of students either remain in their initial major (29%) or transit to fields adjacent to their initial one (20%). 10 For instance, a student whose initial major was in agriculture is most likely to either stick with that same major or choose another major in agriculture. Intended natural and physical science majors who move away from these fields seem more likely to transit to relatively distant academic domains. Social science fields seem to be most at hazard for absorbing transits from other domains.
Thus, while there is significant movement between majors between Year 1 and Year 3, the sum of these movements does not alter the overall demographic structure of the academic space (as shown in Table 4a–c). This is because students who change majors are moving from multiple positions and in multiple directions, and because most of them are moving to fields adjacent to their initial ones. Second, men and women are equally likely to persist with their initial majors. For instance, while men are slightly more likely than women to persist with a major in architecture, and women slightly more likely than men to remain in initial social science majors, these differences are relatively small. Interestingly, there are virtually no gender differences in persistence with initial major in the domain of engineering. Finally, men are more likely to transit into engineering majors—a male-dominated domain—while women are more likely to transit into health and social sciences—two female-dominated domains. These patterns are most pronounced among those students who reported majors in general studies at Year 1. Overall, and depending on the analytic angle at which one assesses the empirical picture, the distribution of students across majors is dynamic and stable at the same time.
Initial Field of Study Year 1, Declared Field of Study Year 3, and Stalled Progression (N = 11,730)

Source. Big State University transcript dataset.
Note. Stalled progression means that students had not reached junior classification (Year 3) during our window of observation. Since education has only one major category, students technically cannot change to another major within this domain.
Bold entries show proportion of students switching majors within the same major domain as initial major.
Initial Field of Study Year 1, Declared Field of Study Year 3, and Stalled Progression, Female Students (N = 5,656)

Source. Big State University transcript dataset.
Note. Stalled progression means that students had not reached junior classification (Year 3) during our window of observation. Since education has only one major category, students technically cannot change to another major within this domain.
Bold entries show proportion of students switching majors within the same major domain as initial major.
Initial Field of Study Year 1, Declared Field of Study Year 3, and Stalled Progression, Male Students (N = 6,074)

Source. Big State University transcript dataset.
Note. Stalled progression means that students had not reached junior classification (Year 3) during our window of observation. Since education has only one major category, students technically cannot change to another major within this domain.
Bold entries show proportion of students switching majors within the same major domain as initial major.
Discussion
Under elective curriculums, major selection is an iterative process, in which students select courses that accumulate toward fulfillment of major requirements in a stepwise fashion. This iterative selection architecture might either reenforce or mitigate the academic predilections students bring with them to college. The empirical focus here has been the well-documented phenomenon of gendered patterns in major selection. When college students are allowed to explore a variety of coursework and change majors, the gendered predilections students bring with them from earlier years of schooling might either increase or decrease: Elective systems might enable the perpetuation of gendered selves coalesced earlier in the life course, or the discovery of new academic opportunities and new possible selves. Our study design allowed us to observe both intended majors at college entry and declared majors around the middle of the undergraduate career. Correspondence-analytic techniques enabled us to describe relationships between chosen fields of study, gender, household income, and measures of prior academic accomplishment simultaneously, while also statistically accommodating the full range of majors on offer at a public research university with a comprehensive curriculum.
Our high-level findings are (a) substantial variation by gender in intended field of study in Year 1; (b) routine transit between majors between Year 1 and Year 3, with the majority of students changing majors; and (c) the majority of transits to substantively proximate majors, such that the overall distribution of males and females across the curriculum remained stable between college entry and junior year. Additionally, we found that among gender, household income, high school class rank, and test scores, gender is the factor most strongly associated with intended major at both time points. Focusing on students who changed majors, we found that men and women were both equally inclined to change majors and equally multidirectional in their transits, even while transits did not change the overall distribution of men and women across the curriculum.
These findings comport with prior studies indicating that choice of major is shaped by students’ orientations toward potential careers before college, and encourage an iterative conceptualization of the gendered production of academic identities and human capital. Such a conceptualization would build on accumulated scholarship documenting the gendered features of academic experiences across the life course: in early childhood (Martin, 1998), elementary school (Musto, 2019; Thorne, 1993), high school (Bettie, 2003; Pascoe, 2007; Weeden et al., 2020), college (Armstrong & Hamilton, 2013), and into labor and marriage markets (Cech, 2013; Hamilton, 2016; Quadlin, 2018; Rivera, 2016). Borrowing a classic insight from work-and-occupations research (Hughes, 1971), we might theorize a gender career, coextensive with the academic one, in which gendered conceptions of self coevolve with the accretion of academic experiences across school organizations and over time.
The iterative conceptualization offered here helps clarify how the transition from high school to college study is an important moment in gender careers. The transition to college obliges young people to express preferences about specific fields of study and make concrete choices about course-taking to enact those preferences. Early course choices matter, initiating path dependencies that make progress toward some fields of study more likely and others less so (Chambliss & Takacs, 2014; Lang et al., 2022). As academic time passes and academic transcripts accumulate (Quadlin, 2017), the cost of shifting to alternative programs of study gradually rises, such that students are likely to experience incrementally less fluidity and discretion in academic (and gendered) choices as they move toward college completion. Our findings at Big State are consistent with such a theorization. Students enter the university expressing strongly gendered intended major fields of study; many of them change majors, and men and women change at comparable rates, but they tend to transit to majors that are substantively near their initial intentions, such that the overall distribution of gender across the curriculum remains much the same (cf. Hamilton, 2014).
Yet the large proportion of students who transit between majors during their first 2 years at Big State provides strong evidence that young men and women utilize the choice opportunities elective curriculums afford. While the overall gendered pattern in major selection remains stable at the population level, it is also true that at least some men and women move from gender-typical to gender-atypical majors after matriculation. Qualitative studies suggest possible mechanisms. For example, Chambliss and Takacs (2014) found that students often choose courses based on highly contingent and local factors—the good or bad reputations of specific courses, for example, or the apparently random advice of a roommate or peer—suggesting that students might be at hazard for shifting their ambitions in light of accumulated feedback and experience. Friendship networks and extracurricular activities also strongly influence students’ perceptions of the kind of studies and careers they might prefer, aspire to, or potentially be good at (Binder et al., 2016; McCabe, 2016). Such work obliges recognition that any individual’s history is more than a set of background variables and suggests the importance of attending to context and contingency in the evolution of gender and academic careers.
Our work provides evidence that curricular organization shapes how these careers unfold. Copious research on tracking has sensitized sociologists to this fact at the K–12 level (Gamoran, 2010; Oakes, 2005); higher education scholars would do well to follow suit. For example, we wonder about the extent to which the elective system itself shapes the character and meaning of gender careers in U.S. education. Elective curriculums explicitly define major declaration as a “choice,” over which students themselves are encouraged to be the ultimate arbiters. Under such a curricular regime, gendered (and racialized, and classed) patterns of major selection are easily understood to be the responsibility of students—not the organizational conditions that oblige selection to take a certain form (see also Cech, 2021).
An important implication of our work for academic practice is that iterative selection under elective curriculums means that there is room for educators to intervene in the process through which students and fields of study come together. We can imagine many information interventions in which students might become better informed about (for example) both how strongly career preferences professed in high school are related to chosen field of study in college and how electives give students freedom to explore paths of study they never imagined before. Newly common online platforms for enabling course consideration and selection offer a context in which educators might “nudge” students to consider courses further afield from those they typically view or select (Chaturapruek et al., 2021; Thaler & Sunstein, 2008). Other recent research suggests that instructional interventions that present college women with role models or futures selves as experts in specific fields of study has positive influences in major selection (Porter & Serra, 2020). Future work should build on these insights, perhaps ideally in carefully designed experiments instrumented to accumulate knowledge on the kinds of interventions that move the needle on course consideration and major selection for specific demographic groups and fields of study.
Future research also should attend to the spectacular organizational variety that characterizes U.S. higher education (Kirst & Stevens, 2015). Our own data allowed us to investigate the relationship between gender, household income, K–12 academic attainment, and major commitment at a single university. Yet we recognize that schools vary widely in their demographic composition, selectivity, curricular offerings, and student cultures. Parallel research should investigate the extent to which gendered trajectories through higher education may be different in academic systems in which college hopefuls apply to specific programs of study and proceed through highly scripted curricula in those programs after matriculation. Indeed, this curricular design is common in higher education worldwide (OECD, 2004), creating ripe conditions for cross-national comparative research. The analytic strategy presented here offers a highly tractable means of pursuing cross-organizational comparisons among multiple colleges and universities. We hope that others will take advantage of the analytic tools deployed here and apply them to other schools with comparable administrative data, accreting a quantitative-comparative educational social science of uncommon contextual fidelity.
Footnotes
Acknowledgements
Previous iterations of this work benefited from critical audiences at Stanford University, Uppsala University, and the 2020 meetings of the American Sociological Association. Comments from anonymous reviewers at AERA Open greatly improved the article.
Data Availability Statement
Data were obtained from the administration of the case university. Participant information was already coded by the case university, and the key linking identities to the code was not available to the research team. Adequate steps, including using the pseudonym Big State for the case university, were taken to protect the privacy of the participants and the confidentiality of their data.
Declaration of Conflicting Interests
The author(s) declared no potential conflicts of interest with respect to the research, authorship, and/or publication of this article.
Funding
The author(s) disclosed receipt of the following financial support for the research, authorship, and/or publication of this article: T. Dalberg gratefully acknowledges support from the Knut and Alice Wallenberg Foundation (Dnr. KAW 2017.0459 and KAW 2018.0403).
Research Ethics
The research reported in this article was reviewed and approved by the Institutional Review Board at Stanford University.
Notes
Authors
TOBIAS DALBERG is a senior lecturer in sociology of education at Uppsala University, Box 2136, SE-750 02 Uppsala, Sweden;
KALENA E. CORTES is the Verlin and Howard Kruse ‘52 Founders Professor at Texas A&M University, The Bush School of Government and Public Service, 4220 TAMU, 2088 Allen Building, Texas A&M University, College Station, TX 77843; ![]() ).
).
MITCHELL L. STEVENS is a professor of education at the Graduate School of Education, Stanford University, Stanford CA 94305;