
Abstract
Existing research demonstrates gender- and race/ethnicity-based inequities in college outcomes. Separately, recent research suggests a relationship between time poverty and college outcomes for student parents and online students. However, to date, no studies have empirically explored whether differential access to time as a resource for college may explain differential outcomes by gender or race/ethnicity. To address this, this study explored the relationship between time poverty, gender or race/ethnicity, and college outcomes at a large urban public university with two and four year campuses. Time poverty explained a significant proportion of differential outcomes (retention and credit accumulation) by gender and race/ethnicity. More time-poor groups also dedicated a larger proportion of their (relatively limited) discretionary time to their education, suggesting that inequitable distributions of time may contribute to other negative outcomes (e.g., reduced time for sleep, exercise, healthcare). This suggests that time poverty is a significant but understudied equity issue in higher education.
Prior studies have highlighted inequitable college outcomes by gender and race/ethnicity in the United States (Cohen et al, 2021; Michener & Brower, 2020), exploring various potential explanatory variables, including financial resources, prior academic preparation, and social/cultural capital (Enriquez et al., 2014; Goldrick-Rab, 2016). One unexplored potential explanatory variable is time as a resource for college. In recent work, we found that women, Black, and Hispanic students were all significantly more time-poor compared to men and White or Asian students (Wladis et al., 2024). In other qualitative research, time pressures or a lack of time have been cited by minoritized students as a reason for dropout (Hodges et al., 2013; Horstmanshof & Zimitat, 2007). Based on this existing research, it seems reasonable to hypothesize that differential access to time as a resource for college may explain some or all of the differences in college outcomes by gender and/or race/ethnicity. However, to date, no large-scale quantitative studies have been conducted to examine this.
Some limited research has described time as a finite resource that can be spent on college (Bennett & Burke, 2018; Mathuews, 2018; Wladis et al., 2018, 2023). However, in general, time as a finite resource for college is not widely used in the higher education lexicon; nor has time been routinely included in completion models. To address this gap, this study aims to provide the first quantitative evidence of how measures of time poverty (i.e., insufficient time to devote to college work [Wladis et al., 2018]) may explain differences in college outcomes by gender or race/ethnicity. This study also explores for the first time in a large-scale quantitative study the extent to which more time-poor student groups may sacrifice more of their “free” time for their education and, thus, may experience negative nonacademic consequences of time poverty as well. Based on these results, we discuss how addressing time as a finite resource may be a potential approach to redressing various sources of inequity that impact certain groups in college.
Literature Review and Conceptual Framework
Women (compared to men) and White and Asian students (compared to Black and Hispanic students) are more likely to complete their degrees (e.g., National Center for Education Statistics [NCES], 2020). Data also show an intersection of race/ethnicity and gender, with Black women and Hispanic women having lower degree attainment in comparison to White women (e.g., Cohen et al., 2021; Michener & Brower, 2020). For those Black and Hispanic students who do graduate, they experience less academic momentum (significantly longer times to complete their bachelor’s degree) than White and Asian Students (e.g., NCES, 2019). One of the primary reasons minoritized students give in qualitative research for delaying or leaving college in the United States is “lack of time” or “time pressures” (Hodges et al., 2013; Horstmanshof & Zimitat, 2007). However, it is yet unclear whether time as a resource for college can explain differential college outcomes by race/ethnicity or gender, and large-scale or quantitative studies are lacking in this area.
Time Poverty
Time is a finite resource (Giurge et al., 2020). As such, time poverty has traditionally been expressed as having insufficient time to maintain physical and mental well-being (Vickery, 1977). Specific to the higher education context, Wladis et al. (2018) defined time poverty as insufficient time to devote to college work (i.e., lack of available time to maintain academic well-being). Time in higher education tends to be viewed as an individual commodity free from constraint, ignoring structural and environmental factors that impact students’ access to time as a resource for college (Bennett & Burke, 2018). However, for many students, time poverty is not a choice but a financial necessity (Mathuews, 2018). For example, at The City University of New York (CUNY), where this study was conducted, over three quarters of students who work do so to pay for living expenses (CUNY, 2018), and only one in five parents in this study agreed that the childcare available to them provided them with enough time for their studies.
When time is viewed as an individual resource free from constraint, this can disadvantage those student groups that are most subject to structural and environmental factors that impact their access to time. In particular, low-income students and students of color in the United States often delay college for economic reasons (Bozick & DeLuca, 2005); this makes them significantly more likely to have work and family responsibilities (Ross-Gordon, 2011). Further, Goldrick-Rab (2016) described how students from poor and minoritized backgrounds often face competing demands on their time, including providing financially for their families, caretaking responsibilities, transportation issues, and food and housing insecurity.
Conceptualizing How Time Poverty May Explain Differential Academic Outcomes
Research has shown that the quantity and quality of time dedicated to academic study relates to college success (e.g., Stinebrickner & Stinebrickner, 2008) and that time poverty can negatively impact college outcomes (Burston, 2017; Wladis et al., 2018, 2023) and well-being (Mathuews, 2018) for some student groups. Wladis et. al. (2018) report that student parents had significantly higher rates of time poverty, which explained significant differences in college outcomes for parents versus nonparents. Women and students of color are more likely to be student parents than White and Asian students (Institute for Women’s Policy Research, 2019). Wladis et al. (2024) found that women, Black, and Hispanic students were all significantly more time-poor compared to men and White or Asian students; this difference was explained primarily by childcare for gender, and by both childcare and work hours by race/ethnicity. Taken together, these studies suggest that outcome gaps by gender and race/ethnicity may also be able to be explained, at least in part, by differential time poverty rates, although no empirical research has as yet tested this hypothesis formally.
We posit that time poverty, a byproduct of other demographic and environmental factors, reduces the quantity and quality of time that different student groups have available to engage in academic study, and that this negatively impacts various outcome measures (see Figure 1). For instance, women of color in college, in comparison to other student groups, are more likely to have children, which creates time demands for caretaking and as a byproduct, less time for other life activities (Institute for Women’s Policy Research, 2019; Wladis et al., 2024). This lack of time may in turn negatively impact academic outcomes (e.g., persistence/momentum) if the women of color are not able to devote the time needed to study. Or, if students sacrifice “free” time and self-care activities (e.g., time spent on sleeping, eating, healthcare, or leisure) in an attempt to maintain the necessary time for their studies, this may potentially lead to negative impacts on physical and mental health.

Conceptual framework: Time poverty in higher education.
Other factors may be related simultaneously to academic outcomes, time poverty, and gender or race/ethnicity, and, therefore, also need to be considered when investigating the relationships between these factors. Age may be one important variable that relates to race/ethnicity, time poverty, and college outcomes. Students of color in the United States often delay college (Bozick & DeLuca, 2005; Cohen et al., 2021), which makes them simultaneously older at college entry, as well as more likely to be time-poor because of work and family responsibilities (Ross-Gordon, 2011; Wladis et al., 2018). Age is strongly correlated with time poverty, with older students more time-poor than younger ones (Wladis et al., 2024). Further, age explains some time poverty patterns by race/ethnicity: Black students enroll in college at older ages than White students on average, explaining some of the differences in time poverty rates between these two groups; at the same time, Hispanic students enroll in college at younger ages than White students on average, and thus, mean differences in time poverty between these two groups mask the fact that Hispanic students are even more time-poor than White students of the same age (Wladis et al., 2024). Age is also correlated with more negative college outcomes (e.g., Francis et al., 2019); research shows that older women have less degree completion than younger women (Jacobs & Berkowitz King, 2002; National Student Clearinghouse Research Center, 2017), and older students of color obtain lower levels of degrees then their White peers (Cohen et al., 2021). Students often report that slower or stopped-out academic progress is largely because of competing work and family commitments for women (Jacobs & Berkowitz King, 2002), and a combination of competing life commitments and other systematic disadvantages that often increase as students of color grow older (Cohen et al., 2021; Goldrick-Rab, 2016). Age has also been linked to greater online enrollment, with older students needing the flexibility provided by this instructional format to help with school-life balance (Wladis et al., 2023).
Income and first-generation status may also relate to race/ethnicity, time poverty, and college outcomes. It is already known that students of color are more likely to be lower-income as well as first-generation college students; low-income and first-generation college students are also at greater risk of poorer college outcomes (see review in Rehr et al., 2022). Low-income students can face issues of time poverty as they face competing demands on their time, including being expected to contribute more to their parents’ household by providing care for other family members as well as financial support (Goldrick-Rab, 2016); they also often need to work through college out of financial necessity (Mathuews, 2018; Rehr et al., 2022). Because the research suggests these factors may be related simultaneously to academic outcomes, we include age, first-generation status, and socioeconomic status (SES), as well as grade point average (GPA) (which is considered another form of capital for college [Enriquez et al., 2014]), in our model of time poverty in higher education, and we include them as controls in our analyses (see Methods section for more details).
Conceptualizing Potential Nonacademic Impacts of Time Poverty
Academic impacts are not the only potential negative effects of time poverty. Students who have less available time for college may sacrifice a greater proportion of their “free” time for their studies. Using nationally representative data from the United States, Conway et al. (2021) found that time poverty was significantly higher for parents than nonparents and that more time-poor parents on average spent more time on their studies than less time-poor parents, despite having less time available for college in the first place; this suggests that the most time-poor students may increase the proportion of free time that they dedicate to college.
If so, then these time-poor students would have less time to spend not only leisure, which has consequences for mental health (Haworth & Veal, 2004), but also on healthcare, sleep, and exercise, which has been linked to chronic diseases and cognitive deficits (e.g., Booth et al., 2012; Chattu et al., 2019). Further, negative well-being outcomes (physical health issues, stress, anxiety, depression) have been connected to overwork (e.g., Kuroda & Yamamoto, 2018). Thus, differential time poverty for different student groups may also have significant nonacademic impacts.
In addition to the direct academic challenges of having less time as a resource for college, time-poor students must make difficult decisions about what to do with their constrained “free” time. If time-poor students sacrifice larger proportions of their already reduced “free” time for their education, then models that focus on academic outcomes alone underestimate the impact of time poverty. There are different ways that time-poor students may decide to allocate their very limited “free” time to their studies: They may choose to reduce time spent on college, to reduce their limited “free” time even further to increase time spent on college, or a combination of both, each with different potential negative academic and non-academic consequences (see Figure 2). Exploring how time poverty relates to student choices to prioritize “free” versus “education” time gives us some measure of the potential nonacademic impacts of time poverty.

Equalizing free time versus education time: Two possible approaches time-poor students might choose to allocate their limited time for their college studies.
Measuring the prevalence of time poverty among different groups and exploring its relationship to both academic and nonacademic outcomes empirically is an important first step to identifying areas where access to time as a resource for college could best be viewed as a critical systemic inequity, rather than solely a personal choice.
Research Questions
The aim of this study is to provide empirical knowledge, based on quantitative analysis, of the extent to which differential access to time as a resource for college may explain inequitable college outcomes by gender and/or race/ethnicity. Specifically, we explore the following questions:
To what extent is time poverty correlated with college retention (reenrolling in the subsequent semester) and academic momentum (credit accumulation)?
To what extent might time poverty explain differential college outcomes by gender or race/ethnicity?
To what extent might the most time-poor groups sacrifice more free time to spend on their education compared to student groups that are less time-poor?
Method
Sample and Data Source
The dataset in this study came from CUNY, the third largest university system in the United States (Yale Daily News, 2013) and the largest public urban university in the United States (Boland, 2021). CUNY has a diverse population: 42% are non-native English speakers, 45% are first-generation college students, more than three-quarters identify as non-White, and 40% have household incomes under $20,000. CUNY includes both 2- and 4-year colleges, and students from all of the CUNY colleges offering 2- or 4-year undergraduate programs participated in the study. CUNY is not nationally representative; however, because of the diversity of its student body, it is a good location for investigating the relationship between time poverty and college outcomes among different groups.
The sample frame included all students enrolled during fall/spring terms from fall 2015 to spring 2017 in any courses that had multiple sections in multiple mediums (e.g., online, hybrid, face-to-face); 1 this data was obtained from the university’s institutional research offices. All students enrolled in the courses in the sample frame were invited via email to participate in an online survey. Institutional data for the whole sample frame was merged with survey results.
The survey asked students to report the number of hours they spent on different activities (paid work, childcare, housework, time spent attending class or studying, time spent on administrative tasks related to college) during a typical week that semester. Specific categories and descriptions were modeled after those used in the American Time Use Survey (ATUS) (U.S. Bureau of Labor Statistics, 2020), but streamlined to collect only time-use relevant to their college studies, paid work, housework, or childcare. Students were prevented from entering invalid values (i.e., >168 hours/week, negative values).
This measure of time use was chosen for several reasons. We anticipated that asking students about time use during a typical week during the current term would be more relevant to their course outcomes that term than asking them about time use for the day prior to the survey because (1) CUNY students often have very different schedules from day to day (e.g., some days spent entirely on work, others entirely on school, weekends spend entirely on childcare, etc.), so time spent on a single day is often poorly representative of a typical week (this issue has been discussed elsewhere, see, e.g., Sonnenberg et al., 2012); and (b) we were concerned that CUNY students would be more likely to complete the survey on a day when they were less time-poor; and therefore, asking about the prior 24 hours would likely bias time estimates towards underreporting of time poverty. 2
The survey dataset included 41,574 student surveys. The response rate was 18%, which is more than double those of other official surveys conducted within CUNY (CUNY, 2014). Our analysis of this sample suggests that it is representative of the larger CUNY population (see more details below). Scholars have increasingly been calling for more attention to be paid to survey representativeness, and less to response rates, as large surveys with much lower response rates than the one here have been found to be as representative as surveys with higher response rates (e.g., simulated response rates of 15%–20% for sample frames of 1,000 students or more generated sample means whose correlation with those of a full survey sample with a larger response rate was 0.98–0.99 3 ) (Fosnacht et al., 2017).
We compared the means between the weighted survey sample and the full sample frame to test the sample used in this research for representativeness for all variables available from CUNY Institution Research offices. Our analysis of the survey sample suggests that it is largely representative of the greater CUNY population (see Table 1). The were no substantial differences between the sample and the full sample frame.
Summary Statistics of Survey Sample
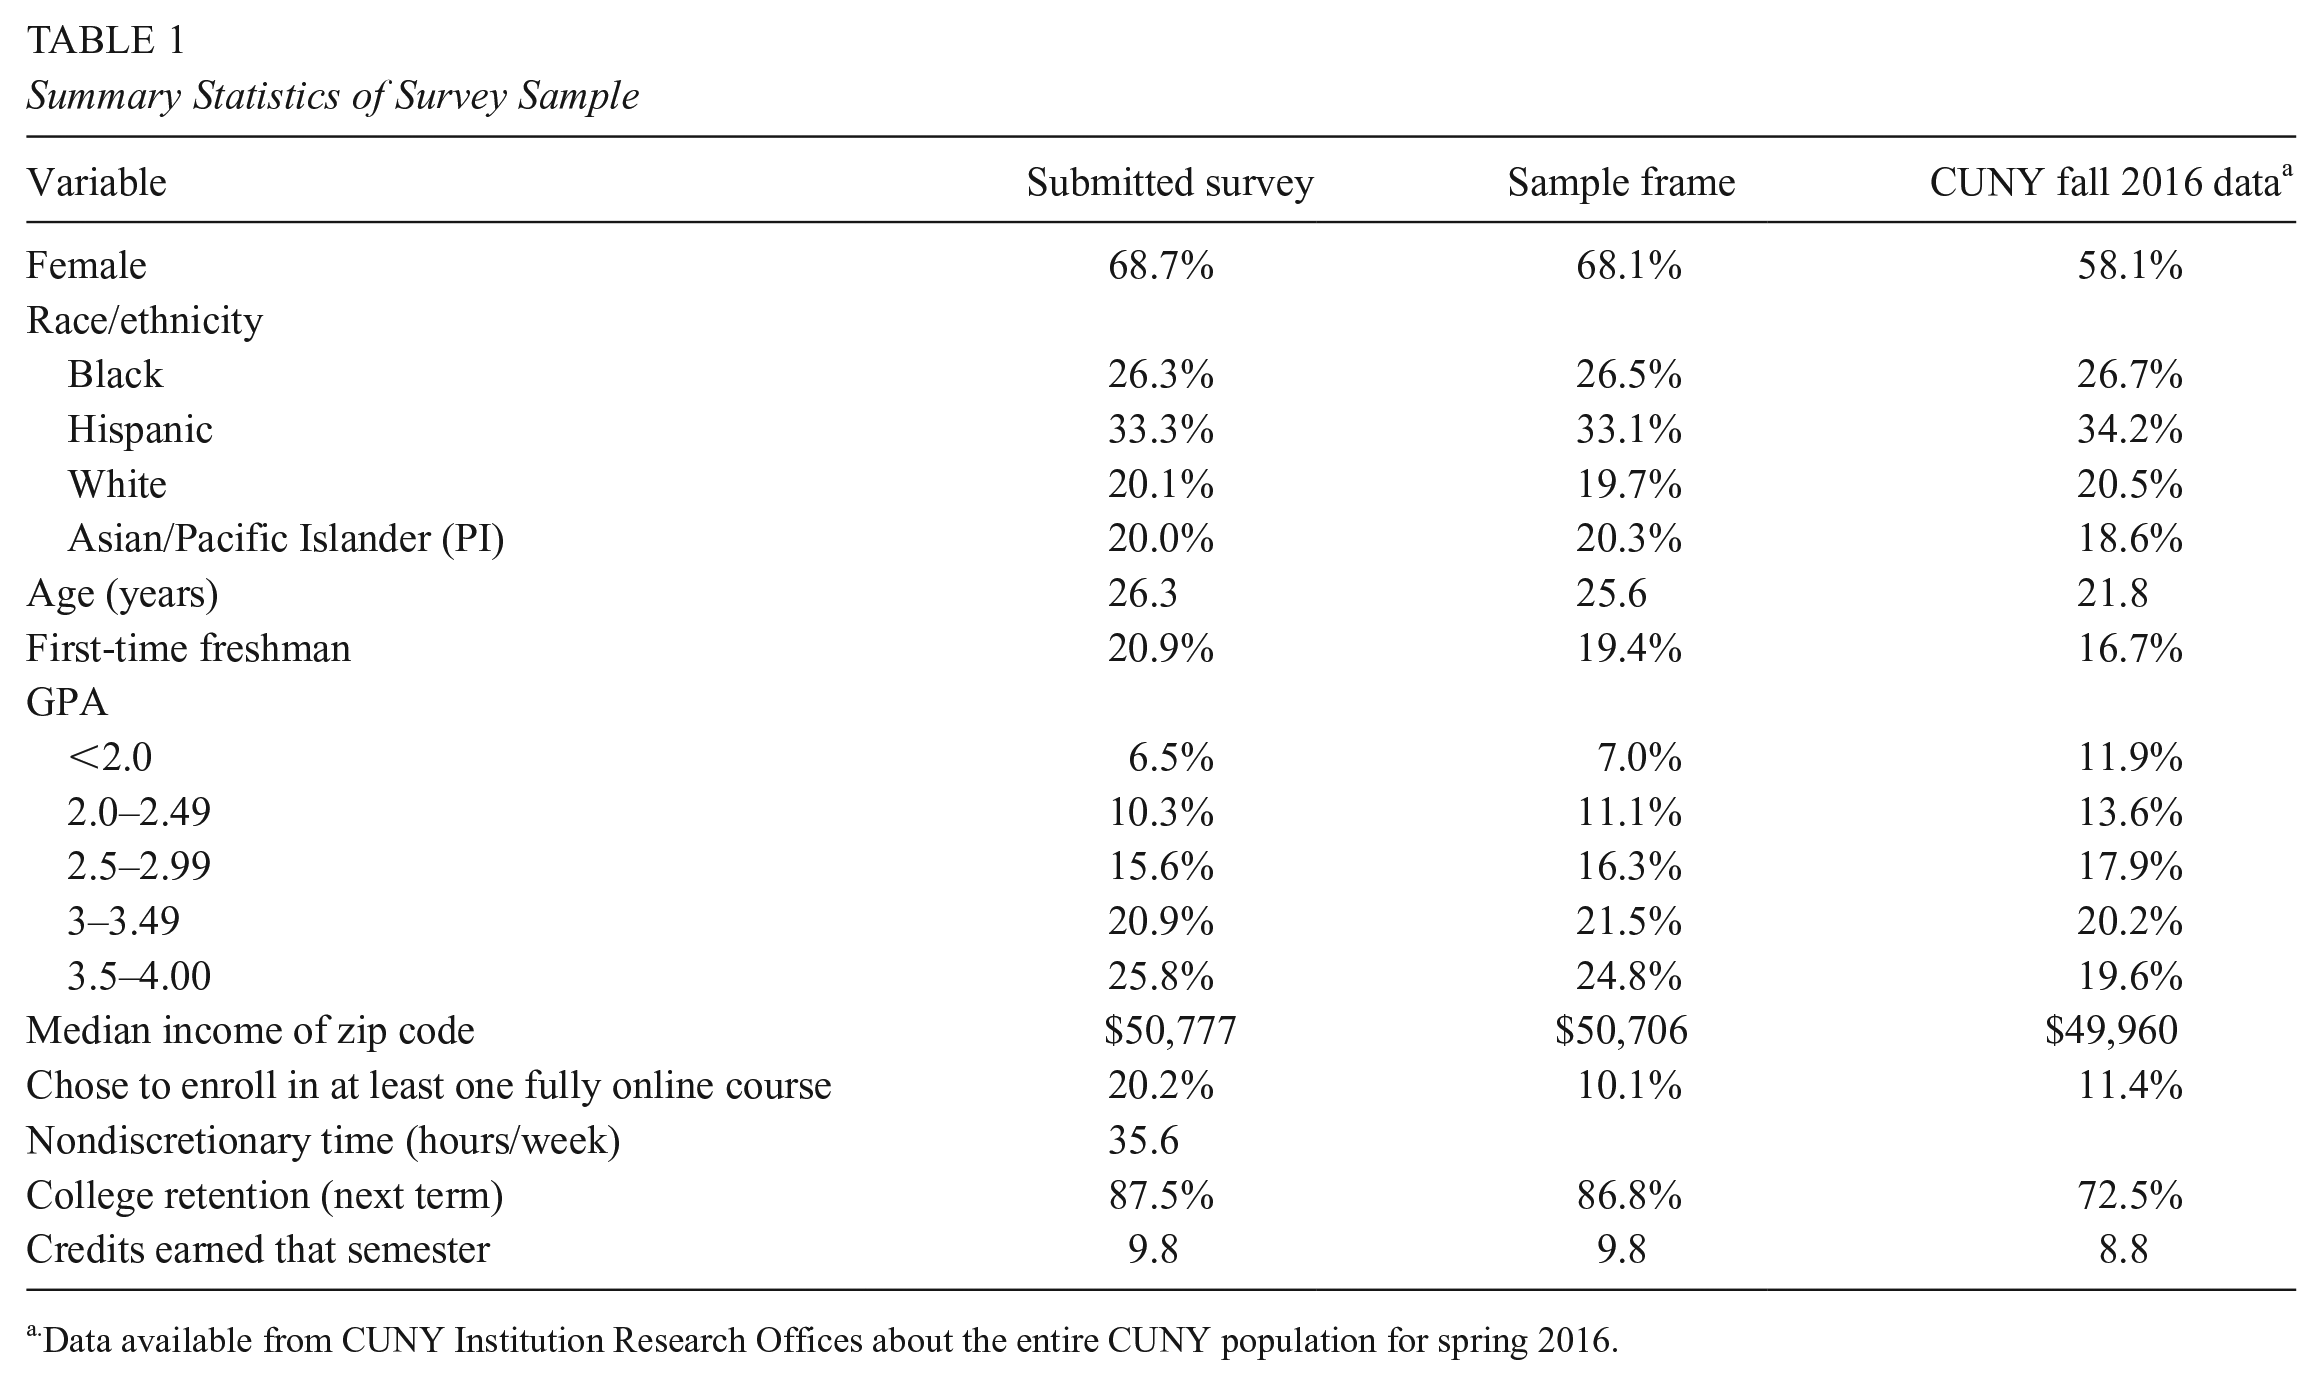
Data available from CUNY Institution Research Offices about the entire CUNY population for spring 2016.
To account for student-level nonresponse, survey responses were weighted by running entropy balancing. This is a type of propensity score weighting method that allows us to require that covariate distributions of the sample and the sample frame match on all prespecified moments (Hainmueller, 2012), resulting in a dataset of students who took the survey for which the mean/proportion on all control variables of the new weighted dataset matches the characteristics of the sample frame. The resulting weight distribution did not contain significant outliers: Weights ranged from 0.58 to 2.48. To account for item nonresponse, multivariate multiple imputation by chained equations was used to impute values for survey questions with missing responses, using all independent variables to be used in the subsequent analyses. Depending on variable type, logit models or predictive mean matching using three nearest neighbors was used. A median of 1.6% of data were missing across imputed variables (excluding variables with no missing values). The final imputed dataset contained 15 imputations. All subsequent results reported in this article were computed using the final imputed and weighted dataset.
Measures
Academic outcomes measured were college retention, or reenrollment at CUNY in the subsequent spring/fall semester; 4 and academic momentum, or the number of credits earned that term. We chose this measure because it is a significant predictor of longer-term academic outcomes (e.g., transfer, degree completion) (DesJardins et al., 2006) and because it is temporally closely related to the student’s time use as reported.
In this study, time poverty was operationalized as the total nondiscretionary time commitments that a student reported in the survey. We followed the model that classifies nondiscretionary time as including paid work, housework (all unpaid work necessary to sustain the household, except childcare), and childcare (e.g., Kalenkoski et al., 2011; Wladis et al., 2018). Here we report the linear relationship between nondiscretionary time and outcomes because they fit the data better than those with quadratic relationships (we obtained
As noted in the literature review section, some research suggests other factors that may be related simultaneously to academic outcomes, time poverty, and gender or race/ethnicity. Because of this, control variables that might correlate with gender, race/ethnicity, time poverty, or educational outcomes, were included: GPA, median household income of the student’s zip code, age, whether the student was a first-time freshman, first-generation college student status, and whether the student was enrolled in at least one fully online course; all of these except for first-generation status were taken from institutional research data. Summary statistics for these variables can be seen in Table 1.
Two types of models are presented: base models that include only the independent and dependent variables of interest, and full models that additionally contain control variables. These two models are both important, and each provides us with different information. Base models are the most relevant to policy and structures designed to support the existing college population because they describe current conditions (e.g., some groups are older on average and also more time poor, but for the purpose of developing supports, we are not interested in the counterfactual in which all groups enroll in college at the same ages). On the other hand, full models provide some information about the extent to which differences currently observed on average between groups may be explained in part by a combination of the control variables (e.g., that age explains some of the differences in time poverty and college outcomes by race/ethnicity). We report results for both types of models; and when the two types of models differ substantially, we note this and discuss potential reasons and implications for these differences. However, in our narrative analysis, we focus more on the base models because our primary goal is to describe existing inequities, and because covariates likely have a complicated relationship with other variables, making full models significantly more difficult to interpret in measuring racial disparities (Foster, 2010). While it is useful to consider how certain covariates may alter model coefficients in order explore the reasons for current inequities, the relationships do not only go in one direction: For example, GPA may be the result of time poverty in prior semesters, which likely correlates with current time poverty; or age may be both a cause (e.g., more family responsibilities) and a result (e.g., time poverty may extend time-to-degree) of time poverty. Thus, while we discuss the results of full models here, we are more cautious in our interpretations of them given this complexity.
Analytical Models
For logit models (e.g., dependent variable is retention), the equation was:
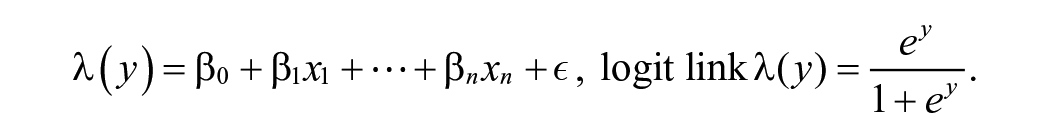
For linear regression (e.g., dependent variable is nondiscretionary time, credits) the equation was:

For both equations,
For mediation analysis, we used the KHB decomposition method (Buis, 2010; Kohler et al., 2011), which is a general decomposition method based on the traditional structural equation modeling (SEM) framework. This model is preferable to others because it generates an indirect effect that is not distorted by the rescaling that occurs when a potential mediator variable that is correlated with the dependent variable is added to a nonlinear model, such as in logistic regression. In the KHB method (in linear regression) if


Here

And then

Because the addition of
We acknowledge that using the language of mediation is often associated with causation; however, this study is observational, and therefore not appropriate for causal inferences. Because attempts to reword this research using other terminology felt too inaccessible to many readers, as a compromise we have chosen to put the word “effect” (e.g., direct or indirect “effect”) into quotes where it appears, and to remind the reader throughout that these data do not support causal inferences. We thus aim to strike a balance between accessibility and rigor in our use of terminology.
Results and Discussion
Does Time Poverty Correlate With College Outcomes?
First, the extent to which time poverty appears to be correlated with college retention or credit accumulation on average across all students was explored.
In Figure 3a, students who did not reenroll in the subsequent term had on average 9.0 more hours of nondiscretionary time commitments (i.e., more time poverty) than those who did reenroll
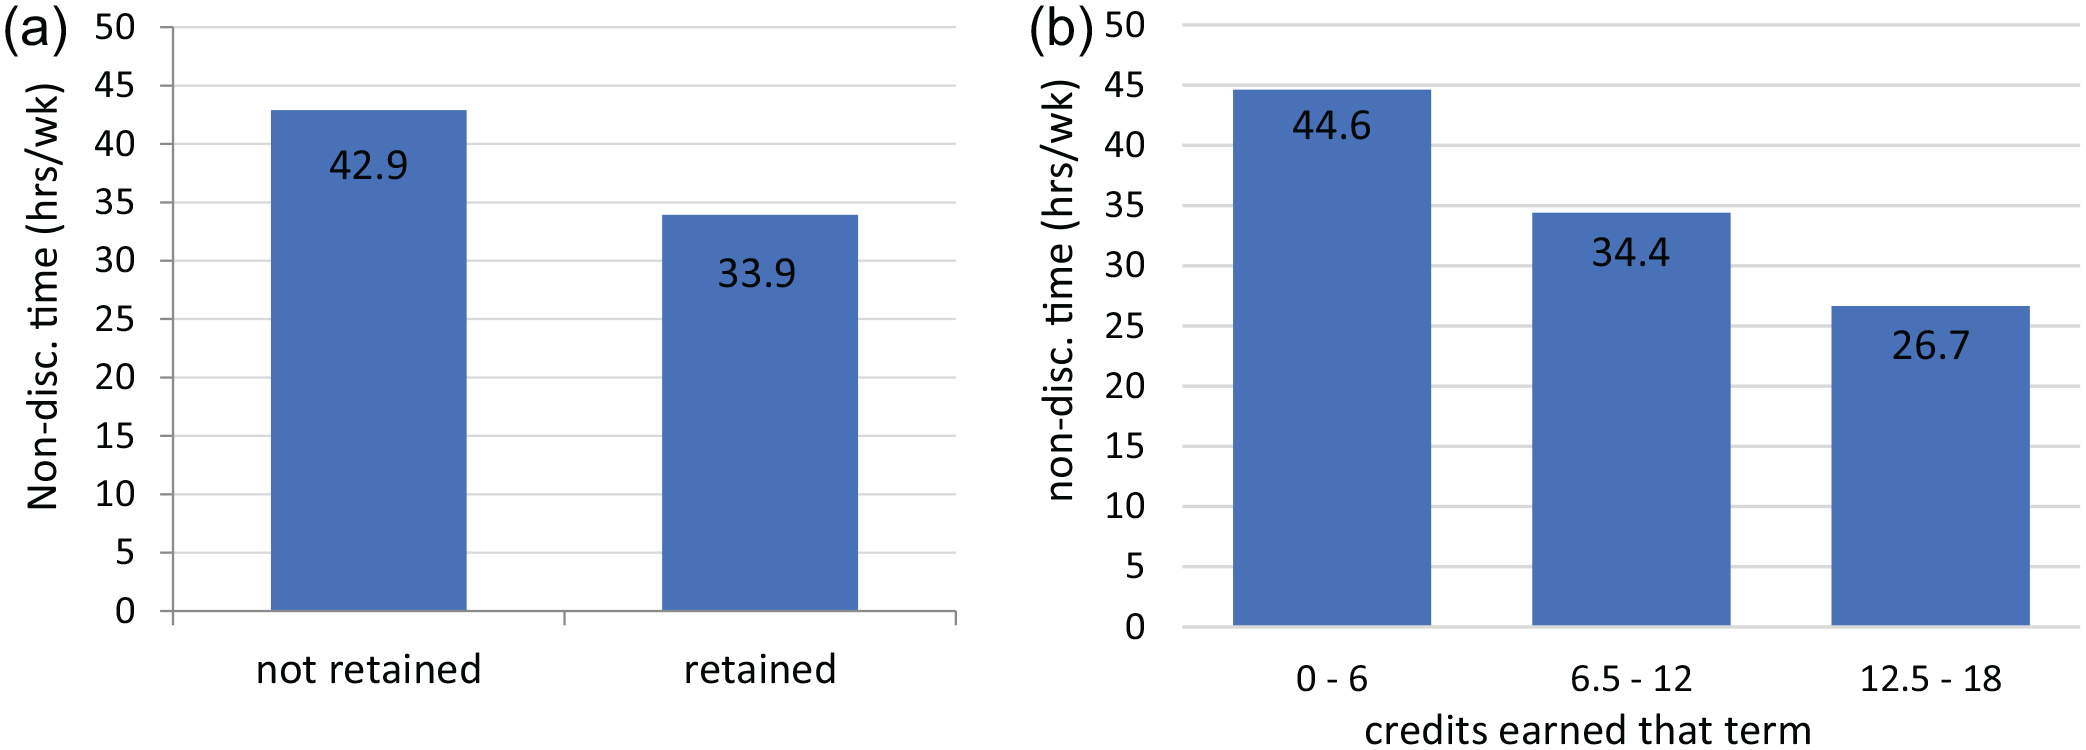
Total nondiscretionary time (hours/week) by retention and credit accumulation. (a) By retention. (b) By credits earned.
This initial exploration shows that time poverty is strongly correlated with both college retention and academic momentum for students on average.
Time Poverty as a Mediator of the Relationship Between Gender and College Outcomes
In both logistic and linear regression models, Black, Hispanic, and White students were all retained on average at significantly lower rates and earned significantly fewer credits
Table 2 shows that the indirect “effect” for both college retention and credit accumulation is significant, in models both with and without controls. The direct “effect” is in the opposite direction as the indirect “effect”; thus, time poverty fully mediates any differences in retention or credit accumulation by gender, explaining over 100% of the gap.
Mediation Analysis (KHB Method) of the Extent to Which Nondiscretionary Time (Hours/Week) Explains the Relationship Between Gender and College Outcomes

Note. College retention: average partial effects reported (APE). Credits accumulated: linear regression coefficients reported (coef.), percentage points. Reference group: men. Full model includes control variables: ethnicity, age, GPA, income, first-generation status, and whether the student chose to enroll in any online courses.
Average partial effects are reported here instead of coefficients because they are more interpretable. The p values reported here are based on the coefficients of the models and not on the average partial effects, although they are the same for the total and direct effects; the standard errors and t and p values are not known for the indirect “effect” of APE, which is why standard error is not reported for indirect effects in this table, although it does exist for the model coefficients directly. (See Breen et al. [2013] for more details.)
Women’s higher rates of nondiscretionary time commitments correlate with lower retention compared to men by 0.8 percentage points
Similarly, the credit accumulation gap by gender could have a meaningful real-world impact over time: Based on mean enrollment intensity of this population, and assuming the credit accumulation rates remain constant over time, according to these models, women who have the same rates of nondiscretionary time as men would on average complete their bachelor’s degree one term earlier, in 12 semesters, the same mean for men in this sample. 7
Models with controls show a reduced gap, but similar mediation patterns. Thus, some of the gap (especially for retention) is likely attributable to differences in control variable attributes by gender. However, the mediation of time poverty remains even after controlling for other factors. Here the base models show how the inequitable distribution of time poverty relates to outcomes for women versus men in the current sample as they are, whereas the full models show how an inequitable distribution of time poverty might relate to outcomes for women versus men in a theoretical world where men and women were identical on all control variables.
In these models, the gender gap in credit accumulation was completely explained by the unequal distribution of nondiscretionary time, and the seemingly equal retention rates by gender masked a retention inequity that is related to the unequal distribution of time poverty by gender. Research has shown that mothers spend a greater proportion of their discretionary time on college than fathers, especially when they have less discretionary time overall (Conway et al., 2021), so women may maintain their retention rates despite having less time for college by sacrificing more of their free time. According to these models, women who had the same non-discretionary time as men had retention rates that were even higher (perhaps because they spent a higher proportion of their discretionary time on college). This is an important equity issue that has remained hidden when looking only at average effects.
Time Poverty as a Mediator of the Relationship Between Race/Ethnicity and College Outcomes
The KHB method was used to explore the extent to which time poverty might explain differential outcomes by race/ethnicity for retention (Table 3) and credit accumulation (Table 4).
Mediation Analysis (KHB Method) Of the Extent to Which Time Poverty Explains the Relationship Between Race/Ethnicity and College Retention

Note. Logistic regression: average partial effects (APE) reported. Full model includes control variables: gender, ethnicity, age, GPA, income, first generation status, and whether the student chose to enroll in any online courses.
Average partial effects are reported here instead of coefficients because they are more interpretable. The p values reported here are based on the coefficients of the models and not on the average partial effects, although they are the same for the total and direct effects; the standard errors and t and p values are not known for the indirect “effect” of APE, which is why standard error is not reported for indirect effects in this table, although it does exist for the model coefficients directly. (See Breen et al. [2013] for more details.)
Mediation Analysis (KHB Method) Of the Extent to Which Time Poverty Explains the Relationship Between Race/Ethnicity and Credit Accumulation, Linear Regression
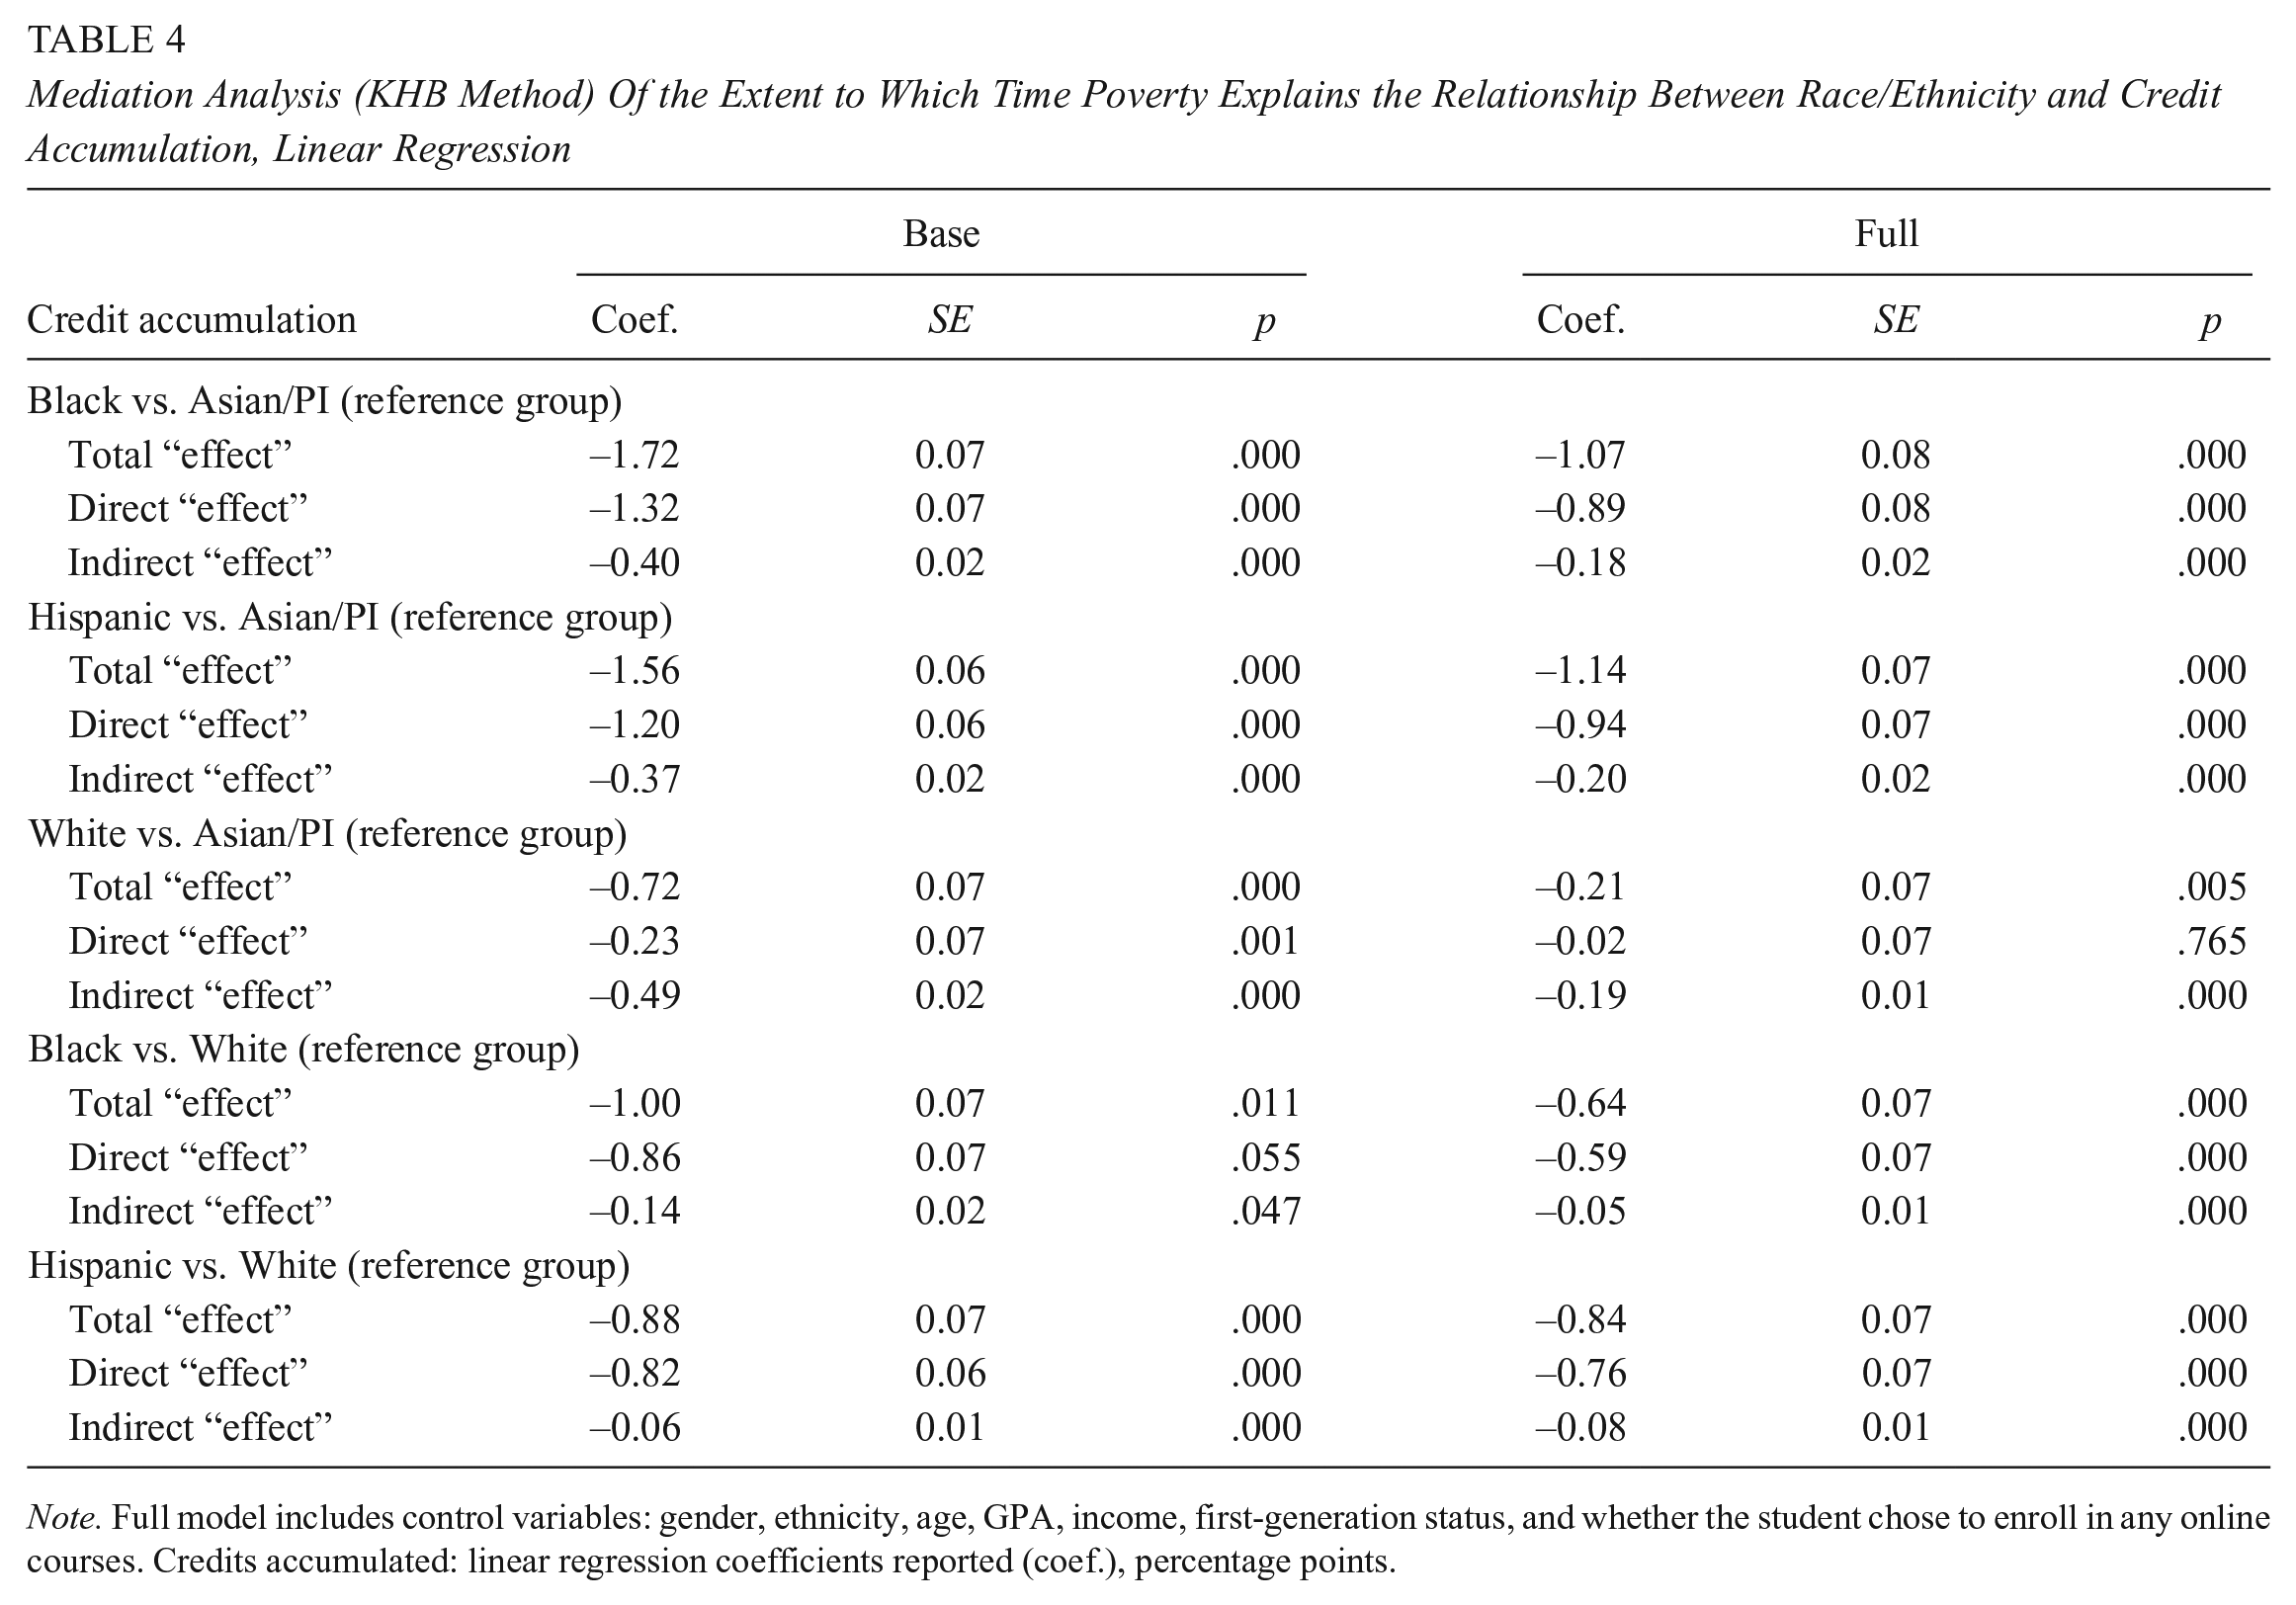
Note. Full model includes control variables: gender, ethnicity, age, GPA, income, first-generation status, and whether the student chose to enroll in any online courses. Credits accumulated: linear regression coefficients reported (coef.), percentage points.
In Table 3, we compared each group to Asian/PI and White students separately to explore the extent to which time poverty explains retention gaps by race/ethnicity. Time poverty significantly mediated the relationship between race/ethnicity and college retention for Black, Hispanic and White versus Asian/PI students, in models both with and without controls.
The probability of retention was 4.5, 3.3, and 2.9 percentage points lower for Black, Hispanic, and White students, respectively; versus Asian/PI students on average
When comparing Black or Hispanic students to White students, nondiscretionary time commitments also significantly mediated the relationship between race/ethnicity and college retention in models both with and without controls. When comparing Black and Hispanic to White students, the probability of retention was 1.5 and 0.2 percentage points lower, respectively, which is 26.7% and 100%, respectively, explained by Black and Hispanic students’ relatively higher amounts of nondiscretionary time commitments. If we assume that these differences in rates of retention remain constant across 12 semesters, at 6 years on average compared to White students, Black and Hispanic students are 16.6% and 2.0% less likely, respectively, to be retained. For Black students, this difference shrinks to 12.4% after controlling for time poverty; for Hispanic students, the gap is relatively small, but disappears completely after controlling for time poverty.
In Table 4, we focus on the relationship between time poverty and credit accumulation: Black and Hispanic students were compared separately to Asian/PI or White students, to determine the extent to which time poverty may explain gaps in credit accumulation by race/ethnicity. In all cases, nondiscretionary time partially mediated the relationship between race/ethnicity and credit accumulation (
Time poverty explained 23.3%, 23.7%, and 68.1% of the difference in credit accumulation between Black, Hispanic, and White versus Asian/PI students, respectively. Compared to Asian/PI students, Black, Hispanic, and White students earned 1.7, 1.6, and 0.7 fewer credits on average for the term, respectively. After controlling for nondiscretionary time, this was reduced to 1.3, 1.2, and 0.2 fewer credits, respectively. In comparing Black/Hispanic versus White students, time poverty explained 14.0% and 6.8% of the differences in credit accumulation, respectively. On average compared to White students, Black and Hispanic students earned 1.0 and 0.9 fewer credits, respectively; this was reduced to 0.9 and 0.8, respectively, after controlling for time poverty. On average, assuming this rate of credit accumulation persists over time, Asian students would need about 11 semesters to finish a bachelor’s degree, whereas White students would need about 12 terms, and Black and Hispanic students would need 13 terms. After controlling for time poverty, this gap narrows, with White students needing just a bit over 11 terms, and Black and Hispanic students a bit over 12 terms.
Thus, time poverty significantly mediated the relationship between race/ethnicity and college outcomes, but it did not completely explain all differences, which makes sense because there are other factors that have been identified in previous research that contribute to inequitable outcomes (e.g., quality of K–12 education, particular types of cultural and social capital that are required to navigate existing educational institutions, economic resources for college [e.g., Joint Economic Committee, 2020; Jury et al., 2017]). This study establishes that time poverty is another factor (and importantly, a malleable one) that may need to be addressed if progress is to be made in closing these gaps. Further, comparing outcomes from base versus full models, we see that while control variables (age, GPA, income, first-generation status, enrollment in online courses) did explain some of the relationship between race/ethnicity, time poverty and outcomes, they did not completely explain the gap in any of them. This suggests that other factors, beyond these control variables, likely contribute to time poverty, and need to be explored by future research. At the same time, the correlation between time poverty and the control factors such as age, GPA, income, first-generation status, and enrollment in online courses may be an important relationship to explore in future research, as these may be important explanatory variables that explain some of the relationship between time poverty and inequitable outcomes.
However, exploring the relationship between time poverty and college outcomes such as retention and credit accumulation may not tell the whole story: One factor that may limit the “impact” of time poverty on academic outcomes is that students with less discretionary time may sacrifice more of their free time in an attempt to make up for their time poverty, with the aim of obtaining the same outcomes as their peers who have more time for college. To the extent that students of color are doing this, the gaps in the mediation models that we have presented above would underestimate the “effect” of time poverty on academic outcomes. In this case, the “effect” of the inequitable availability of time as a resource for college would be that Black and Hispanic students would have to sacrifice other things (e.g., sleep, healthcare, exercise) to maintain college outcomes despite being underresourced.
Inequitable Distribution of Free Time by Gender and Race/Ethnicity
Academic outcomes may underestimate the actual negative impact of time poverty if students with higher time poverty made up for their lower time resources by spending a higher proportion of their (already reduced) discretionary time on their education. We explore that possibility in this section. In service of that goal, we define free time in this context as the time left over after both nondiscretionary and education time. As presented in Figure 2 in the Conceptual Framework, there are different approaches that students might take when faced with time poverty. We now consider to what extent our observational data align more with a model in which less-time-privileged groups appear to be aiming to equalize free time versus education time. We begin by considering patterns in the data that can be summarized in Figure 4.
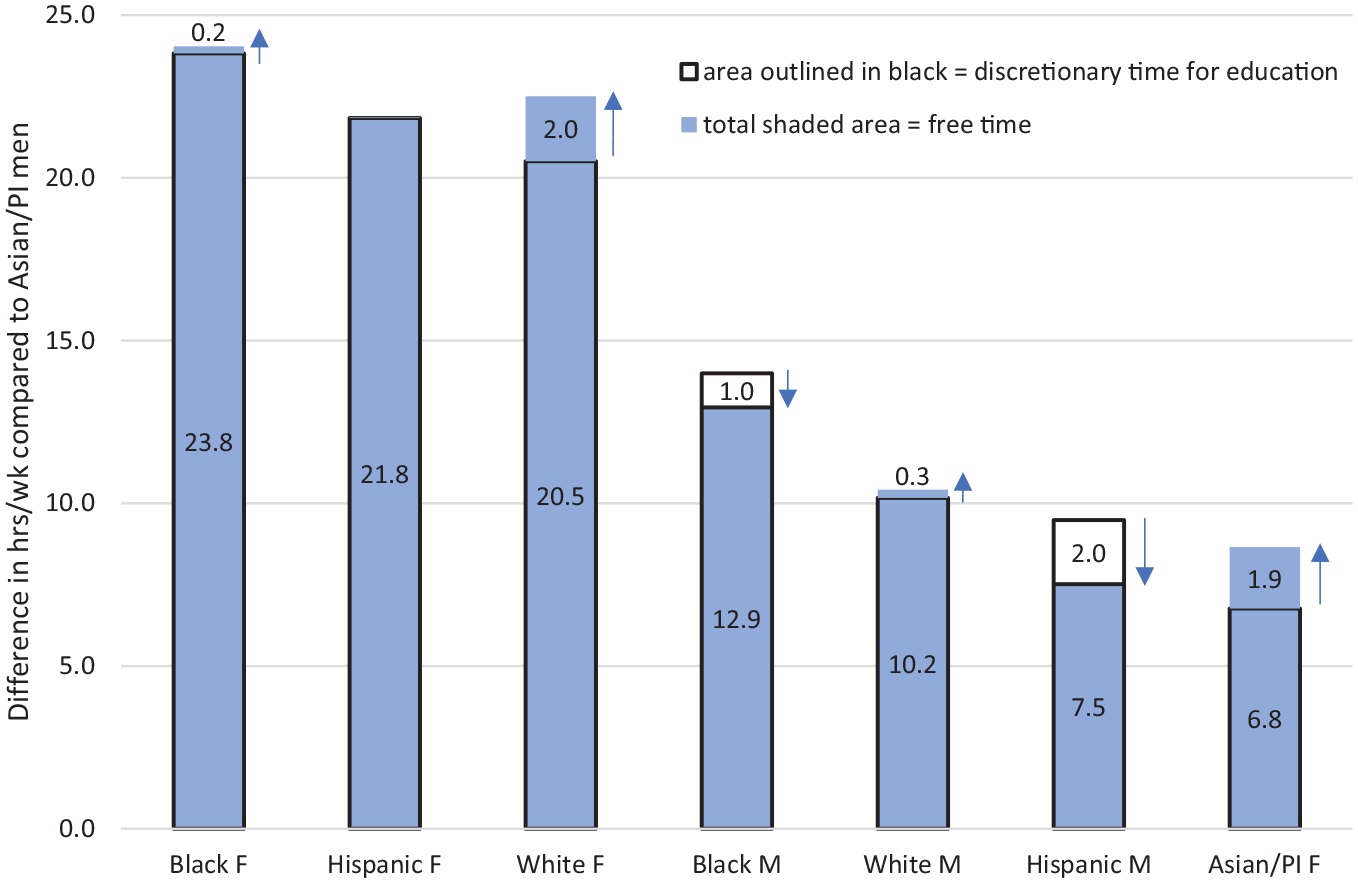
Difference in discretionary time for education and free time (hours/week) by gender and race/ethnicity, relative to Asian/PI Men (from weighted, imputed linear regression model).
Figure 4 shows several things at once. Because the bars represent the
Thus, groups aiming to
Some groups did slightly reduce the time that they spent on education, but not by much. For example, only two of the seven groups with lower discretionary time (Black men and Hispanic men) actually spent less time on their education compared to Asian/PI men, and students in these two groups that reduced relative time on education did so by only 15.0% on average. The remaining differences in free time by group in Figure 4 (compared to Asian/PI men) is statistically significant for all groups, and the differences between each group and any group directly to its right or left is also statistically significant
We could also measure this as the proportion of discretionary time that each group spent on education. If students equalized free time, then students with more initial discretionary time would spend a greater proportion of it on their education. Consider the theoretical situation in which groups A and B had 100 and 80 hours, respectively, of discretionary time, and group A spent 40 hours on education. Equalizing free time would mean group B would spend 20 hours on education, (resulting in group A spending 40% and group B 25% of discretionary time on education). On the other hand, equalizing education time would mean group B would spend 40 hours on education (resulting in group A spending 40% and group B spending 50% of discretionary time on education). In this study, we see the latter: In weighted linear regression models, the more time-poor a student was on average, the higher the proportion of their discretionary time they spent on their education
Table 5 shows that there is a significant indirect “effect” of total nondiscretionary time on the relationship between gender or race/ethnicity and the proportion of discretionary time that students spent on college, in both base and full models. Eighty-eight percent of the difference in the proportion of discretionary time spent on college studies by gender was explained by the higher time poverty of women who then spent a higher proportion of their already limited discretionary time on their college work, presumably in an attempt to make up for their time poverty; adding controls made almost no difference to model coefficients. For Black, Hispanic, and White versus Asian/PI students, and Black and Hispanic versus White students, increased time poverty explained 100% of the difference in the proportion of discretionary time spent on college work
Mediation Analysis (KHB Method) Of the Extent to Which Total Nondiscretionary Time Explains the Relationship Between Gender or Race/Ethnicity and Proportion of Discretionary Time Spent on College Studies

Note. Full model includes control variables: gender, ethnicity, age, GPA, income, first-generation status, and whether the student chose to enroll in any online courses. Proportion of discretionary time spent on education: linear regression coefficients reported (coef.), percentage points.
This is an important finding that has not been discussed in prior literature: Students who were underresourced with respect to time had worse college outcomes on average, but also worked “harder,” by reducing their already smaller amounts of free time even further to spend more time on education. This finding could have broader impacts, as students may have to forgo time spent on other activities such as sleep, exercise, socializing, and leisure that are critical to health/mental health, safety, and which impact the quality of time that they spend on their studies (e.g., Booth et al., 2012; Chattu et al., 2019; Haworth & Veal, 2004).
Limitations
Time poverty likely has a strong yet complex relationship with financial need. Student household income was included as a factor in all of the full models in our analysis. However, we did not attempt to further break down the link between time and income poverty because of limitations in existing data and because the complex and nuanced relationship between time and income poverty necessitates a separate study. Because income can have both a positive (i.e., the more hours students work, the more time poverty time they have) as well as a negative (i.e., someone more financially secure can afford to work less or to hire outside help to reduce their time poverty) relationship with time poverty, these two effects can confound one another such that it is impossible to interpret average effects. While a more equitable comparison would be to utilize calculations of financial need, accurately calculating this has been shown to be highly challenging, particularly for minoritized college students (Goldrick-Rab, 2016). For example, current federal calculations of financial need in the U.S. do not consider that (a) many lower-income students must contribute financially to their families (Goldrick-Rab, 2016); (b) student parents must pay for food, shelter, and healthcare for their families (Wladis et al., 2018); and (c) students with disabilities often pay more in health costs (Mitra et al., 2017). Thus, using measures of income or federal calculated financial need to explore the link between time and income poverty would likely be inaccurate and misrepresent the real financial needs of many students (particularly those from traditionally underrepresented groups). 8 However, potential interventions to address inequitable distributions of time poverty will likely need to account for and/or consider financial poverty, and thus, this relationship should be the focus of future research.
Further, the time measures utilized in this study are self-reported and retrospective, so it is possible that other data collection methods such as time diaries or the experience sampling method (ESM) could result in more precise time use data (e.g., Sonnenberg et al., 2012), although they are subject to their own limitations. Time diaries (where subjects are asked to fill out a diary describing how much time they spent on various activities at regular intervals for a set period of time) and the related ESM (where subjects are cued through electronic devices to report on what they are doing at certain times of day—the frequency and timing of these cues may be regular or random) are some of the most common alternatives. While research in this area is still inconclusive, a number of studies have shown that retrospective reporting of time use can provide very similar information to time diary and ESM approaches (Lucas et al., 2021; Schulz & Grunow, 2012; Sonnenberg et al., 2012), particularly for activities that are long-lasting and frequent (such as the activities that are the focus of this study, like work and childcare). Further, time diary and ESM approaches have limitations; they are significantly more intrusive, requiring subjects to repeatedly record what they are doing at frequent intervals throughout the day. Thus, these methods may be biased towards conscientious individuals (who may be more likely to volunteer for or complete the experience sampling logs) or individuals with more discretionary time (who have the time to complete logs throughout the day); additionally, repeatedly recording time use in the moment may influence subject’s decisions about how to spend their time, thus altering results (Lucas et al., 2021; Napa Scollon et al., 2009; Sonnenberg et al., 2012). We also note that because of the intrusive and time-intensive nature of time diary and ESM methods, studies that use these methods typically have small sample sizes (e.g., George et al., 2008; Ketonen et al., 2018; Lucas et al., 2021; Xie et al., 2019), which is insufficient for many of the analyses conducted here. Survey questions assessing time use, like the approach used here, can thus be conducted for much larger numbers of research subjects, and have lower time costs, making them particularly desirable for potentially time-poor populations.
Additionally, CUNY is more diverse than the average U.S. college; while this may limit the generalizability of this research in more homogenous contexts, it did allow us to provide information about time poverty for a diverse population. There are also limitations in the available gender/race/ethnicity categories because of how data is recorded for federal reporting guidelines; thus, these variables may not fully represent how students self-identify. 9
In addition, New York State provides a higher proportion of on-campus childcare than 47 other U.S. states (Eckerson et al., 2016), offers universal pre-kindergarten, and New York City spends more on public benefits than any other U.S. municipality. Thus, some of the patterns found in this study may actually underestimate national trends. Further, our measure of nondiscretionary time commitments did not include non-childcare caretaking, or healthcare. These categories are similarly nondiscretionary, and both are also inequitably distributed. Thus, nondiscretionary time as measured in this study may underestimate the inequitable distribution of time poverty and its potential power in explaining differences in college outcomes. These measures have been added to nondiscretionary time calculations in ongoing research.
Further Discussion, Implications, and Directions for Future Research
Overall Patterns
Time poverty was strongly correlated in this study with lower college retention and lower rates of credit accumulation. Controlling for time poverty revealed hidden inequities by gender and explained some existing outcome gaps by race/ethnicity. While on the surface men and women appeared to have comparable college retention, after controlling for time poverty, women had significantly lower rates of both retention and credit accumulation compared to men, revealing a suppressor “effect.” These patterns existed because women on average had less discretionary time than men but had better college outcomes on average than men who had the same discretionary time, perhaps because women spent on average higher proportions of that discretionary time on college work.
Time poverty also partially but significantly explained differences in college retention and credit accumulation for Black, Hispanic, and White versus Asian/PI students, as well as between Black and Hispanic versus White students. As with gender, Black and Hispanic students both spent a higher proportion of their discretionary time on their studies compared to White and Asian students, and this was largely explained by their higher amount of nondiscretionary time commitments. Findings suggest that if colleges wish to address gender- and race/ethnicity-based inequities, interventions that address inequitable distributions of time poverty may require critical consideration.
Students who were more time-poor sacrificed a higher percentage of their discretionary time, perhaps in an attempt achieve comparable outcomes despite being underresourced in terms of time. This may mean that any observed academic impacts of time poverty actually hide much of the negative impacts of time poverty on marginalized students, as they sacrifice ever-increasing proportions of their free time to make up for their lower stores of time as a resource that can be spent on college. Women spent 1.6 hours/week more on their education than men, despite having 10.2 fewer hours available each week for their education. While White, Black, and Hispanic students all spent less time on their education compared to Asian/PI students, this reduction comprised on average only 15% of the discretionary time gap. For example, while Black students had 17.8 fewer hours/week available for college compared to Asian/PI students, they only reduced time on education by 1.3 hours/week, at a cost of 16.5 fewer hours of free time compared to Asian/PI students (or time that could have been spent on activities such as healthcare, exercise, leisure, eating, and sleeping).
Necessary Cultural Shifts in Higher Education
This research suggests that certain cultural and structural changes to higher education institutions may be critical if we are to address inequities related to time poverty. Most students in this sample had very limited time available to invest in college; yet notwithstanding this, many of them sacrificed increasing amounts of their free time for their education and still made progress towards their degrees despite these structural barriers. On one hand, it is important to equalize these time inequities and give every student who wants it the opportunity to spend more time on college (e.g., by providing financial and structural resources for students who need it in order to work less or to obtain more outside help for family caretaking). Nonetheless, the results here raise important questions about how we conceptualize time in higher education, and what messages we send students about which kinds of time use are compatible with college. It is common in higher education institutions to treat time as an individual good free from constraint, where “good” students prioritize their education above all else and invest as much time as possible as early as possible in college: for example, many policies tie resources to full-time enrollment (i.e., federal financial aid, childcare and development fund programs, etc. [Pingel et al., 2018), and many initiatives intended to improve student outcomes push students to enroll in more credits without providing any supports that increase student’s available time for their studies (e.g., “Keep on Moving On” 2018; Isserles, 2021). However, this may not be possible or even desirable for all students. Such structures disproportionately benefit students with the most time capital and can stigmatize students with lower time capital as not a “good fit” for college. Yet some students may legitimately choose to prioritize family or community responsibilities over attending school full-time, and higher education structures could be better designed to support these students, for example, by providing better financial aid options for students who wish to attend part-time, and providing more flexible types of courses and college services (e.g., online and off-hours appointments, asynchronous and synchronous online courses, and mastery-based or self-paced courses with flexible deadlines). But in addition to these practical changes, it is important to rethink the messages that we send students about which kinds of time use are compatible with college. Stigmatized messages about time use may be one way in which race/ethnicity- and gender-based marginalization may be perpetuated within higher education structures. Existing college cultures typically do not reflect the complex realities of the majority of students who attend college while working and attending to family responsibilities (Goldrick-Rab, 2018; Wladis et al., 2018). Colleges may need to think carefully about how to adapt their norms, policies, and practices to the time needs and resources of the students who currently enroll in higher education, if they wish to promote equity.
Future Research to Test Interventions That Could Reduce Time Poverty Gaps
This was not a causal study, so we cannot determine which interventions would reduce racial/ethnic and gendered gaps in time poverty. However, the higher time poverty of women and Black and Hispanic students is highly correlated with age, parenthood, and access to childcare, and these factors explain significant differences in time poverty by gender and race/ethnicity among college students (Wladis et al., 2023). Working more hours for pay also contributed to inequitable distribution of time poverty, among a population where most students who work do so to pay for living expenses (Wladis et al., 2023). However, current U.S. federal financial aid formulas often do a poor job of estimating the financial need of nontraditional and low-income students (Goldrick-Rab, 2016; Wladis et al., 2018).
For example, while a student’s individual living expenses are considered a cost of attendance, the living expenses of a student’s dependents (e.g., food, housing, healthcare for a student’s children) are not (U.S. Department of Education, 2023). This ignores the time costs that students have when they must work for pay to cover these expenses while enrolled in college; many students with dependents work to cover the living expenses of their families (Institute for Women’s Policy Research, 2017), which takes away from time that could otherwise be spent on college. Further, while childcare costs can be included in a students’ cost of attendance, students must request this on a case-by-case basis (U.S. Department of Education, 2023), and this information is often not readily accessible to students (U.S. Government Accountability Office, 2019). In fact, the Federal Student Aid Handbook refers to childcare as an “exceptional” expense (U.S. Department of Education, 2023, “Academic Calendars, Cost of Attendance, and Packaging section,” para. 31), reflecting problematic norms about what characteristics (and by extension financial aid needs) a “typical” student should have. Both the additional time costs needed to petition for childcare to be included in cost of attendance (because it is not automatic) and the “exceptional” language used in aid documents send students stigmatized messages that may make student parents feel like they do not “belong” in college. But even if federal calculations of students’ cost of college attendance were revised to better reflect the needs of more time-poor students, more aid in general is needed if we are to cover students’ actual financial need—currently only 37.5% of students’ need is covered by financial aid (NCES, 2020). When financial aid is insufficient to cover students’ actual need, they may need to work more hours or forgo formal childcare to make up the gap (To, 2019), thus cannibalizing time that they need to spend on their studies, and undermining the purpose of financial aid in the first place—to provide students with the resources that they need to complete (and not just enroll in) a college degree.
Thus, good candidates for future interventions to reduce time poverty that could be tested with causal methods would be improved access to childcare and supports that allow students to work less. This could include increasing on-campus childcare, which has been shrinking in the United States (e.g., Gault et al., 2014), and improving federal financial aid funding and policies to allow students to work fewer hours earning the funds necessary to support their families. Findings from this study indicate that these may be important interventions to pursue in future causal research, and point to the need for future research to explore the complex relationship between time and income poverty and how they interact to impact academic and nonacademic college outcomes, both generally and for specific college student groups.
Considering Time Poverty as a Possible Approach to Addressing Other Inequities
One interesting question for future research might be the extent to which increasing time as a resource for less privileged groups might not only address inequities in time as a resource, but might also be a potential approach to compensating for other past resource inequities. For example, a student might be able to compensate for poorer quality K–12 schooling if they had extra time to spend on their studies. Research shows that people of color and women face structural racism and gender bias that results in resource disparities in comparison to White Americans and men that negatively impact their K–12 academic preparation (e.g., Joint Economic Committee, 2020); thus, in some cases, they may need additional time to make up for these prior inequities.
Because models in this study showed a linear relationship between nondiscretionary time and college outcomes, we pursue a brief thought experiment to consider what would happen if reducing nondiscretionary time for different groups actually did produce changes in outcomes similar to the patterns shown in these models. 10 For example, if the models from this study turned out to be a good representation of actual causal relationships and future interventions were able to equalize nondiscretionary time of Black and Hispanic students so that it were equal to White students, then gaps in retention by race/ethnicity would be reduced by 38% and 100%, respectively, and gaps in credit accumulation by 13% and 7%, respectively. Using the same model assumptions, if the nondiscretionary time commitments of Black and Hispanic students were reduced to 26.9 hours/week and 36.8 hours/week, respectively, while White students’ nondiscretionary time remained the same (35.5 hours/week), Black and Hispanic students would have identical retention rates to White students. This thought experiment is intended only as a brief illustration of the possible potential of time poverty interventions to address gaps in college outcomes by race/ethnicity, even when other factors (such as weaker K–12 educational experiences) may be part of the cause. Again, the models in this study are not causal ones; therefore, they cannot prove that increasing discretionary time for students in a particular group would improve outcomes. However, results from this study do suggest that interventions that reduce time poverty are strong candidates for future testing with causal methods.
For example, if all students who placed into developmental math courses 11 (where women, Black, and Hispanic students are significantly overrepresented [e.g., Preston, 2017]) were given supports that provided them more discretionary time, this might significantly improve racial/ethnic and gender inequities in outcomes by targeting students who have a reason for needing more time (i.e., students who need time to develop certain “college-level” skills before enrolling in credit-bearing courses, to make up for prior inequitable access to quality K–12 educational resources). Similarly, it is well known that there are race/ethnicity and gender gaps in the STEM pipeline (National Science Foundation, 2017), and some of this gap can be explained by inequitable access to high-quality college preparatory math and science instruction (Tsoi-A & Bryant, 2015). For example, many students of color have less access to higher-level high school math courses that are often prerequisites for STEM majors (National Science Board, 2016), which can delay or prevent them from majoring in STEM fields in college. However, if these students were given additional time to make up for these differences in prior STEM education access, this might help to address this gap.
More research is needed, not only to consider how to equalize the unequal distribution of time as a resource for college, but also to consider how time as a resource for college could be more equitably allocated. Future causal research could explore the potential impact on outcomes of providing supports that equalize discretionary time available for college among different student groups (e.g., increased financial aid to allow students to work less, access to affordable on-campus childcare, etc.). But it may also be fruitful to pursue research that explores in more detail how much time different groups may need to be successful in college, and that tailors time resources (e.g., targeted financial aid) to individual student needs, providing students who need more time for academic study in college (e.g., those enrolled in intensive STEM [science, technology, engineering, and mathematics] majors, those with inadequate access to prior academic preparation who need more time to acquire skills necessary for college degrees) additional time as a resource for college to address unique needs that are often the result of other structural inequities (e.g., access to prior educational resources).
Time Poverty as an Equity Issue in Its Own Right
We note that inequitable distribution of time as a resource for college is a serious equity issue in its own right, which can have many negative consequences beyond academic outcomes. This study showed that students who were more time-poor spent a significantly greater percentage of their already reduced discretionary time on college work, which suggests that students who are time-poor pay a significantly higher price for the time that they spend on college. Overwork and lack of leisure time has been linked to serious negative psychological and physical health outcomes (Booth et al., 2012; Chattu et al., 2019; Kuroda & Yamamoto, 2018). Thus, the relationship between time poverty and other sources of inequity such as mental and physical health, stressors, and financial poverty is likely strongly interrelated, and should also be investigated further. Regardless of the direction future research takes, if we truly hope to provide equal opportunities for every student to succeed in college, and at the same time, help them maintain equitable levels of well-being, it is critical that time poverty be considered in models and interventions aimed to address inequities in higher education.
Conclusion
In this study, we found that time poverty explained significant proportions of differences in academic outcomes by both gender and ethnicity. This suggests that it is critical for us to explore interventions in future research to determine if (a) they reduce time poverty of the most time-poor groups, such as women, Black, and Hispanic students; and (b) whether reduction in time poverty improves academic outcomes for these groups. Potential candidates for these interventions include those that give student parents access to free, convenient high-quality childcare, and improvements to financial aid that allow students to work less. College cultures and structures also need to become more inclusive, by supporting students with a diversity of time resources. For example, colleges may need to reconsider their messaging around time use and consider offering more flexible options for both courses and college services, in order to provide better access to students with work and family commitments.
In addition, the most time-poor students sacrificed significantly greater proportions of their free time for college; thus, more time-poor groups worked even “harder,” presumably to make up for their time disadvantage. Even though they often had significantly less time available for college, the most time-poor often spent similar amounts of time on their education compared to their more time-rich peers, at the cost of their “free” time, which included time for sleep, healthcare, exercise, and leisure. This sacrifice may have significant nonacademic life costs for these students that should be further explored.
Footnotes
Acknowledgements
We would like to thank Zun Tang and the whole staff at the CUNY Institutional Research offices for their invaluable help in obtaining the data for this research. In addition, we would like to thank Chris Rhoads for his extensive and helpful feedback on the manuscript during its preparation.
Declaration of Conflicting Interests
The author(s) declared no potential conflicts of interest with respect to the research, authorship, and/or publication of this article.
Funding
The author(s) disclosed receipt of the following financial support for the research, authorship, and/or publication of this article: This research was supported by grants from the National Science Foundation (Grant Nos. 1431649 and 1920599). Opinions reflect those of the authors and do not necessarily reflect those of the granting agency.
1.
This sample was chosen because it was part of a larger study that was investigating how environmental factors, such as time poverty, may relate to course medium enrollment choice and college outcomes. It is possible that this may bias the sample towards students who choose to take at least one course online; however, comparison of sample frame characteristics to the CUNY population as a whole shows that the same frame and the CUNY population appear to be largely comparable (see ![]() ).
).
2.
We note that there are other ways of measuring time use that do not ask subjects to recall prior time use and, therefore, may be subject to less recall bias; however, these other methods also have limitations (see the limitations section for a more detailed discussion of the pros and cons of common ways of measuring time use).
3.
We note this was with respect to five of the most common measures used in survey research in higher education; these included all of the measures that were the focus of the study.
4.
We note that students who graduated were also coded as retained if they graduated from CUNY before the start of the subsequent spring/fall term.
5.
Significance levels taken from weighted imputed regression base models (nondiscretionary time as the dependent variable and retention [a] or credits earned [b] as the independent variable for each model), not reported here due to space constraints. Similar patterns and significance were also found for full models with covariates.
6.
Students spent on average 2.6 hours per week on each successful credit earned, suggesting that more time may be needed for successful versus unsuccessful course completion. However, many students may not be able to spend more time on their studies—summing nondiscretionary time commitments and time spent on college yielded a mean of 63.3 hours/week, roughly equivalent to 1.9 full-time jobs.
7.
National data shows that on average, women’s time to degree completion is slightly faster (52 vs. 55 months for men) (NCES, 2019). Our sample is more “nontraditional” and, thus, may be more time-poor (e.g., Ross-Gordon, 2011).
8.
We did explore some preliminary models including unmet need (as measured by the Free Application for Federal Student Aid [FAFSA] ) for the subset of students (63% of students for one term for which FAFSA data was made available by CUNY) who completed the FAFSA. However, these initial analyses only reinforced our concerns about the validity of this measure: For example, unmet need was significantly positively correlated with credits completed that term (checking whether this was typical, we found the same trend with national data using NCES BPS 2012/2017 [Bryan et al., 2019]), suggesting potential validity issues with this measure that require further investigation. Further, including unmet need in analysis would require this study to be limited to only those students who completed the FAFSA (since FAFSA data are not missing at random, imputation is not appropriate), which is not the population of interest for this study. Further research on how financial need should be measured and operationalized is clearly needed.
9.
We explored more nuanced categories of gender and race/ethnicity, including national origin, through survey questions. However, we did not find that this additional information allowed for useful analysis beyond institutional variables, and survey items on these topics had more missing responses than the institutional data. One of the major issues with using more nuanced data categories was that this produced insufficient numbers within subgroups for the type of quantitative analysis performed here. For example, only 89 students reported a gender that was neither male nor female. Further, while there are limitations to the federal categories for race/ethnicity and gender, they do reflect to some extent the socially and politically constructed categories that are often the basis of structural marginalization and discrimination. As the Organization for Economic Co-operation and Development (OECD) describes, categories used for collecting race and ethnicity-related data are chosen because they “represent a social-political construct designed for collecting data on the race and ethnicity of broad population groups in this country, and are not anthropologically or scientifically based” (Balestra & Fleischer, 2018, p. 23). Thus, we felt that the federal categories are a useful first step in identifying ways that structural marginalization and discrimination may impact broad population groups.
10.
Again, we are not claiming causality, just exploring some hypothetical scenarios about what might happen if there were a causal relationship, as a way of illustrating the potential power of testing time poverty interventions in future causal research.
11.
These are noncredit courses that focus on math content that is typically classified by the institution as “not college level.”
Authors
CLAIRE WLADIS, PhD, is the director of the CUNY Equity Through Education Research Group, professor of mathematics at the Borough of Manhattan Community College of the City University of New York (CUNY) and urban education at the CUNY Graduate Center, 199 Chambers St., New York, NY 10007; email:
ALYSE C. HACHEY, PhD, is the cochair of the Teacher Education Department, Division Director of BELSS (Bilingual Education, Early Childhood Education, Literacy Education and Sociocultural Studies), professor and lead faculty for Early Childhood Education at The University of Texas at El Paso, 500 W. University Ave., El Paso, TX 79968; email:
KATHERINE M. CONWAY, PhD, is a professor in the Business Management Department at Borough of Manhattan Community College of the CUNY, and she is also past Chair of the University Faculty Senate and ex-officio member of the CUNY Board of Trustees, 245 Greenwich St., New York, NY 10007; email: