
Abstract
This study uses data from the Early Childhood Longitudinal Study, 2010–2011 to better understand the rates of grade retention during elementary school and the factors associated with this grade retention. Using matched student–teacher and student–principal data, I examine the student-, teacher-, and school-level factors associated with a student’s probability of being retained. I then apply within-student comparisons to examine the extent to which students with a teacher or principal of the same race/ethnicity had a lower probability of being retained. No evidence of a relationship is found between student–teacher and student–principal racial/ethnic matching and reduced grade retention for Black, Latinx, or White students.
Despite grade retention rates decreasing over the past couple of decades (Warren et al., 2014), the practice remains controversial, given the persistence of racial/ethnic disparities in grade retention (Frey, 2005; Greene & Winters, 2009; Warren et al., 2014), the unclear benefits of retention (Allen et al., 2009; Goos et al., 2021), the increasing prevalence of state-level mandatory retention policies (Weyer, 2019; Workman, 2014), and the stronger evidence base of early reading interventions (Gersten et al., 2009; Wanzek & Vaughn, 2007). Data from the Current Population Survey from 1995 to 2010 point to stark racial disparities in grade retention rates, with Black students retained at almost twice the rate of White students (3.8% vs. 2.0%), with 2.8% of Latino/a students retained annually (Warren et al., 2014). Under Florida’s mandatory retention policy, Greene and Winters (2009) report that students who identify as Black were 4% more likely to be retained than White students, even when controlling for academic achievement and other background characteristics. Students who identify as Latino/a were 9% more likely to be retained than White students. Black and Latino/a students’ higher retention rates have generally been attributed to a number of structural risk factors for grade retention, including academic achievement, student health, disability status, age for grade, socioeconomic status (SES), and language spoken at home (Alexander et al., 2001; Jimerson et al., 1997; Xia & Kirby, 2009).
Recent meta-analytic evidence of rigorous studies indicates that, on average, grade retention is associated with neither an academic benefit nor harm for students (Goos et al., 2021). Yet there is notable variation in the relationship between grade retention and student achievement based whether or not the retention decision was mandated by a district or state policy, when in school a student was retained, and whether or not retention was accompanied by remedial supports. Researchers have found evidence that Florida’s third grade mandatory reading retention policy has a positive effect on reading achievement, which persist through tenth grade (Greene & Winters, 2007; Schwerdt et al., 2017; Winters & Greene, 2012). In Chicago, mandatory retention resulted in small short-term effects on student achievement for third but not sixth graders who were retained (B. A. Jacob & Lefgren, 2004). Other quasi-experimental studies have generally shown a null or slightly negative relationship between grade retention and student achievement (Gottfried, 2012; G. Hong & Raudenbush, 2005; Y. Hong & Hong, 2021; Hwang & Cappella, 2018).
Even if students do in fact receive more developmentally appropriate content after being retained, the experience might be related to social stigmatization and lower expectations, which may have negative effects on student success (Anagnostopoulos, 2006; Huddleston, 2014). Evidence substantiates this claim, as grade retention is detrimental to students’ social adjustment (Jimerson & Ferguson, 2007; Martin, 2009), behavior in school in the initial years after being retained (Özek, 2015), and long-term outcomes, including credit accumulation, persistence through school, and college attendance (Eren et al., 2017; B. A. Jacob & Lefgren, 2009; Mariano et al., 2018; Ou & Reynolds, 2010).
Even with an inconsistent evidence base for the benefits of retaining students and statements decrying the practice from professional organizations (National Association of School Psychologists, 2011), 17 states and Washington, DC, have adopted policies requiring that students who do not meet certain exemptions be retained when they have not demonstrated reading proficiency by third grade (Weyer, 2019). The potential efficacy of these policies stems not only from any benefits received by the students who are retained in their grade but also from the accountability pressures faced by school staff (Allensworth, 2005). Such pressure can spur the implementation of early interventions that lead educators to better monitor and support emergent readers or even retain them in the early grades, when the negative effects are thought to be minimized (Fruehwirth et al., 2016; Ou & Reynolds, 2010). Importantly, at the same time as mandatory retention policies have grown in popularity, a strong evidence base has emerged regarding alternative remediation strategies that can be implemented in early grades to improve literacy (R. T. Jacob et al., 2015; Ransford-Kaldon et al., 2011; Sirinides et al., 2018).
A key feature of mandatory grade retention policies is that they are envisioned as reducing teacher and administrator discretion in grade retention decisions. When school stakeholders have considerable discretion in the allocation of school resources, including grade retention, understanding how they recommend retention is critical. Teachers’ and administrators’ beliefs regarding the academic and socioemotional competencies that students need to demonstrate to progress to the next grade and any perceived benefits of grade retention are informed by their own class-based values and beliefs (Bovin et al., 2008; Ford, 1998; Huddleston, 2014; Ready & Wright, 2011). For Black and Latino/a students who are retained at the highest levels, teachers’ and administrators’ appraisal of a student’s academic potential may be informed by underlying prejudices due to racial/ethnic differences between students and their predominately White teachers (Easton-Brooks, 2019; Redding, 2019). Given that teacher and administrator discretion in grade retention can contribute to racial inequities in educational opportunities, it is critical to better understand the conditions shaping when students are retained in elementary school.
To address this research purpose, I draw on data from the Early Childhood Longitudinal Study, kindergarten class of 2010–2011 (ECLS-K:2011). In addition to the rich set of variables related to student development and matched student–teacher and student–principal data, this study benefits from annual data collection throughout elementary school. Unlike studies of grade retention using the ECLS-K:1998 cohort that could only confidently measure retention between kindergarten and first grade (Fruehwirth et al., 2016; G. Hong & Raudenbush, 2005; G. Hong & Yu, 2007), the current data allows me to examine retention patterns throughout elementary school, making it one of the first nationally representative longitudinal examinations of elementary school retention patterns for a single cohort of students.
In addition to an updated understanding of the structural risk factors associated with elementary school grade retention, I extend the literature on student–teacher and student–principal racial/ethnic matching in three important ways. First, this literature has examined the relationship between student–teacher racial/ethnic matching and a variety of student outcomes, including achievement (Dee, 2004; Egalite et al., 2015; Joshi et al., 2018; Yarnell & Bohrnstedt, 2018), disciplinary infractions (Lindsay & Hart, 2017), assignment to gifted and talented programs (Grissom & Redding, 2016), and graduation rates (Gershenson et al., 2017). Evidence of how student–teacher or student–principal racial/ethnic matching is associated with differences in elementary grade retention among students of color would provide an important addition to this literature, given that elementary students likely to be retained are some of the most academically vulnerable children.
Second, this literature has focused either on the relative influence of a teacher or principal of the same race as the student, but rarely merging the two (Grissom et al., 2017). As grade retention decisions rely on input from both these school stakeholders (Bovin et al., 2008; Renaud, 2013; Witmer et al., 2004), it marks an important case to understanding the relative influence of both teachers and administrators on retention decisions. Third, few studies in this literature have considered how contextual factors moderate the relationship between student–teacher and student–principal racial/ethnic matching and student outcomes. I examine three such moderators: region, the presence of a reading retention policy, and student gender. Given that teacher and administrator discretion in high-stakes decisions can contribute to racial inequities in educational opportunities (Donovan & Cross, 2002; Grissom, Kalogrides, & Loeb, 2015; Grissom, Kern, & Rodriguez, 2015), it is critical to better understand the conditions shaping the grade retention of elementary students.
Discretion in Student Retention Decision Making
Teachers tend to make the initial recommendations regarding whether a student should be retained or promoted. The final judgement regarding which students are retained in a given year is made by school administrators, which can be shaped by pressure from the parent (Schnurr et al., 2009; Witmer et al., 2004). When retention decisions are left to school personnel, the decision is shaped by teachers’ and administrators’ beliefs about the extent to which grade retention is an effective strategy for remediation and their own assessments of the potential benefits to a specific student repeating a grade (Bovin et al., 2008; R. T. Jacob et al., 2004; Renaud, 2013; Witmer et al., 2004). Grade retention decisions may also bump into practical considerations for school administrators, including cost, anticipated class sizes in a grade, and the school’s capacity to offer meaningful remediation (Bali et al., 2005; Larsen & Akmal, 2007).
With discretion over student retention decisions, teachers’ beliefs about whether a student should be retained are subject to teachers’ racialized biases. As a result, a White teacher may recommend retaining a Black or Latino/a student with the goal of promoting better academic performance and socioemotional maturity (Renaud, 2013), but their decision making may be susceptible to implicit or explicit biases. For instance, Harber et al. (2012) show that White teachers give Black and Latino/a students’ less critical feedback, possibly underchallenging these students. Teachers’ biases toward stereotyped groups, including students of color and female students, may result in teachers underestimating these students’ academic potential (Copur-Gencturk et al., 2019).
Retention decisions, then, likely differ depending on whether or not a student is assigned to a teacher of the same race/ethnicity. The literature suggests three mechanisms by which student–teacher racial/ethnic matching can shape student outcomes: shared cultural understanding, role modeling, and high academic expectations (Easton-Brooks, 2019; Egalite & Kisida, 2018; Redding, 2019). When a student and teacher share cultural values rooted in their racial/ethnic identity, there is the possibility that the teacher will offer fairer or more equitable appraisal of the students’ classroom behavior or academic performance than teachers lacking this shared cultural understanding. A shared cultural understanding could also shape other classroom decisions made by the teacher, including the adoption of culturally relevant pedagogy, pushing students to work harder in class, and the formation of caring, protective relationships with students (Easton-Brooks, 2019; Egalite & Kisida, 2018; McKinney de Royston et al., 2020; Redding, 2019). Same-race teachers can also serve as role models for their students, which has the potential to increase motivation and engagement with their coursework (Egalite et al., 2015; Egalite & Kisida, 2018). To the extent to which these changes result in higher levels of student performance, student–teacher racial/ethnic matching might decrease grade retention rates among Black and Latino/a students. Additionally, a teacher may advocate for the promotion of a student of the same race/ethnicity if she believes the student will receive the necessary remediation in the next grade or that retaining them will negatively affect the student’s self-esteem.
Yet, unlike other domains of schooling, student–teacher racial/ethnic matching may result in higher retention rates. A Black teacher might be concerned about a Black student’s academic progress and feel that they would benefit more by repeating the grade, regardless of any social stigmatization that occurs as a result of their retention. This view is confirmed by surveys of teachers, the overwhelming majority of whom describe support for grade retention, feeling that repeating a grade helps students develop stronger academic skills and improves their long-term chances of success (R. T. Jacob et al., 2004).
Two studies on grade retention help illustrate the role of both teacher discretion and racial/ethnic representation on grade retention. Under Florida’s mandatory test-based retention policy, LiCalsi et al. (2019) find that third grade students who read below grade level are retained at lower levels when their mothers have higher educational attainment. Notably, students whose mother has a bachelor’s degree or higher are retained at lower rates under two conditions: (1) when the student is assigned to a teacher of the same race/ethnicity and (2) the teacher completes subjective exemptions, such as a teacher portfolio. Bali et al.’s (2005) study of grade retention in Texas provides evidence of how racial/ethnic minority representation at the district level might be related to retention rates. Their results show that districts with more Latino/a students, Latino/a teachers, and a Latino/a superintendent had lower retention rates. Notably, the opposite relationship is found in terms of Black students and superintendents. Yet, by focusing on aggregate district data, these observed relationships are susceptible to aggregation bias and may not be manifest within schools themselves. Still these studies give reason to believe that student–teacher racial/ethnic matching may be associated with student grade retention, although the direction of this relationship is less clear.
Student retention decisions do not only depend on teachers, but administrators as well (Jimerson et al., 1997). Conventionally, teachers submit recommendations for the students to be retained, although principals make the final decision (McCombs et al., 2009; Schnurr et al., 2009). In fact, in some states, the decision to retain a student is primarily the responsibility of the principal (Workman, 2014). A principal’s influence on grade retention may stem from their broader influence on the school climate (Hallinger & Heck, 1998). Principals shape expectations for student learning, local policies and practices, such as those related to grade retention, and may promote racial inclusivity in a school, possibly reducing racial disparities in grade retention (Khmelkov & Hallinan, 1999). Principals, who tend to view grade retention somewhat less favorably than teachers (R. T. Jacob et al., 2004), might also engage in “discretionary insubordination,” whereby they fail to retain students because of the perceived antieducational consequences (Larsen & Akmal, 2007, p. 49). Alternatively, principals’ elevated role in retention decisions may stem primarily from the input or pressure they receive from parents (Witmer et al., 2004). Overall, it may only be when a student has a teacher and principal of the same race/ethnicity that an association is found with grade retention. In addition, for students who do not have a teacher of the same race/ethnicity, a principal may equalize the increased risk of retention for these students.
Finally, this hypothesized relationship between student–teacher and student–principal racial/ethnic matching and grade retention may be influenced by state policy conditions or regional differences. Until the late 1990s, states typically relegated retention decisions to school personnel. The introduction of test-based retention policies shifted this dynamic (R. T. Jacob et al., 2004), with an increasing number of states requiring reading proficiency for progression through elementary school. While the use of test-based retention remains controversial, one arguable benefit would be the limitation to local subjectivity around retention decisions (Penfield, 2010), particularly to the extent to which teachers’ and administrators’ racial/ethnic biases and prejudices influence retention decisions. As a result, it may be that states that have adopted test-based accountability policies have a weaker relationship between student–teacher racial/ethnic matching and grade retention. However, the presence of such policies can create accountability pressures for educators who may be more likely to monitor and support emergent readers or even retain students in the early grades. In addition to these policies themselves, unobserved contextual factors that vary by region may shift the relationship between student–teacher and student–principal racial/ethnic matching and grade retention.
Summary and Research Questions
In this study, I first document the rates of racial/ethnic disproportionalities in grade retention and the student, teacher, school, and principal characteristics associated with grade retention. I then examine the extent to which student–teacher and student–principal racial/ethnic matching is related to elementary school grade retention, as well as possible moderators of this relationship. This study aims to answer four research questions:
Method
Data for this study come from the ECLS-K:2011 cohort. Administered by the National Center for Educational Statistics (NCES), ECLS-K:2011 followed a nationally representative cohort of students who began kindergarten in the 2010–2011 school year. Students were surveyed annually as they progressed through elementary school, the phase in students’ schooling in which they are most likely to be retained (Planty et al., 2009; Warren et al., 2014). I draw on data collected in the fall and spring of kindergarten, and the spring of first, second, third, fourth, and fifth grades.
The initial ECLS-K:2011 includes 18,170 students. However, the need to observe a student in subsequent school years to measure grade retention and differential nonresponse patterns for students, parents, teachers, and principals reduce the size of the analytic sample. 21,620 cases are missing the dependent variable and excluded from the sample. The analytic sample is restricted to students attending public schools, resulting in dropping an additional 8,890 students. To account for the approximately 20% of values that are missing for some independent variables, I use multiple imputation to account for this missing data. 1 When applying longitudinal student–teacher survey weights, the analytic sample includes 33,420 student-year observations and 7,590 unique student observations. All sample sizes are rounded to the nearest 10 in accordance with NCES reporting standards.
Measures
The dependent variable for this analysis is the student’s retention in their current grade. This variable is measured based on the student’s progression through early elementary school. To illustrate, if a student is observed in kindergarten in year t and again in year t + 1, the grade retention measure would indicate that the student was retained in year t. If another student is observed in kindergarten in year t and in first grade in year t + 1, the grade retention measure would indicate that the student was not retained. As students are observed annually, retention is observed in kindergarten, first, second, third, and fourth grades.
There are two independent variables of interest in this study. First, student–teacher racial/ethnic matching is measured by congruence between the student’s and teacher’s racial/ethnic identity. Data on student racial/ethnic identity come from parent interviews during the initial wave of data collection. Data on the racial/ethnic identity of a student’s classroom teacher is self-reported by the teacher during each survey. The second independent variable is whether the student and principal identify as the same racial/ethnic group. Similar to teachers, principals self-report their race/ethnicity during each survey. For each group, an indicator is created for whether respondents identify as White, Black, Latino/a, Asian, or other race (American Indian/Alaska Native, other, or two or more races). Binary variables are then created to indicate whether or not a student and teacher or student and principal share the same racial/ethnic identity.
I also include a rich set of student, teacher, principal, and school characteristics in the analysis. Student-level covariates include student demographic and background characteristics, including race/ethnicity, gender, and a scale measure of SES. SES is a continuous measure created by NCES that includes mother’s education, father’s education, mother’s occupational prestige, father’s occupational prestige, and household income (Tourangeau et al., 2019). Given the correlation between student achievement and retention, models control for the item response theory–based test scores for reading and mathematics taken each year by the student. The reliability of the reading assessment ranged from .86 to .95, depending on the round of data collection. For mathematics, the reliability ranged from .92 to .94 (Tourangeau et al., 2019). For comparability over time, test scores are standardized within each year. Models also include other previously identified predictors of grade retention, including disability status, an indicator for whether or not English is the primary language spoken at home, parent’s rating of their child’s health on a 5-point scale, age in months at the start of kindergarten (i.e., September 2010), whether or not the student is a first-time kindergartner or they are repeating kindergarten, and teacher-reported scales related to students’ self-control, interpersonal skills, internalizing problem behaviors, externalizing problem behaviors, and approaches to learning (Alexander et al., 2001; Xia & Kirby, 2009). The reliability of these social rating scales varies by measure and grade level, with reliability coefficients ranging from .73 to .92 (Tourangeau et al., 2019). Similar to test scores, these measures are standardized by year.
At the teacher level, models include controls for teacher race/ethnicity, gender, teaching experience, and whether or not the teacher has a master’s degree or higher, an education degree, and certification. Models also control for class size. At the principal level, models include controls for principal race/ethnicity, gender, and principal experience. School characteristics include indicators for whether the school is located in a city, suburb, or town (with suburb as the omitted category); region of the country (Midwest, South, and West; East is the omitted category), a categorical measure of total student enrollment, and the fraction of students eligible for free or reduced-price lunch (FRPL).
In supplementary analysis, an indicator for whether the student lives in a state with a reading-based retention policy. The 16 states with mandatory retention in 2012 were Arizona, Arkansas, California, Connecticut, Delaware, District of Columbia, Florida, Georgia, Iowa, Maryland, Missouri, North Carolina, Ohio, Oklahoma, Tennessee, and Texas (Rose, 2012).
Data Analysis
To document racial/ethnic disparities in grade retention and the student, teacher, school, and principal characteristics associated with elementary school grade retention (Research Questions 1 and 2), I begin with a basic linear probability model (LPM). Equation 1 presents the general form of this model:

where the probability of grade retention for student i in classroom j in school s at time t is a function of a vector of characteristics for student i in year t (
To empirically assess the extent to which students with a same-race or same-ethnicity teacher or principal are less likely to be retained (Research Question 3), I extend Equation 1:

where the probability of grade retention is a function of the racial/ethnic matching between student i and the teacher in classroom j in year t (
The primary parameters of interest in Equation 2 are
To answer the fourth research question, the final set of analyses tests for possible heterogeneity in these relationships by examining contextual factors that may moderate the relationship between student–teacher and student–principal racial/ethnic matching and grade retention. Specifically, region, the presence of a reading retention policy, and gender are all examined as possible moderators of the relationship between student-teacher and student-principal racial/ethnic matching and grade retention.
Results
Racial Disproportionalities in Grade Retention
To answer the first research question on the extent to which there are differences in elementary retention rates by race/ethnicity, the first row of Table 1 reports racial/ethnic differences in grade retention throughout elementary school. On average throughout elementary school, only 1.1% of White students are retained annually. Black students are retained at the highest rates of any racial/ethnic group, with an average of 2.2% of Black students being retained annually. The average retention rate is 1.4% for Latino/a students, 1.1% for Asian students, and 2% for students of another race (i.e., American Indian/Alaska Native, other, or two or more races).
Conditional Means, by Race/Ethnicity

Note. Author’s calculations from the Early Childhood Longitudinal Study, 2011 Kindergarten cohort. National Center for Education Statistics. Estimates adjusted for probability weights. SES = socioeconomic status; FRPL = free- or reduced-price lunch.
While the average retention rates throughout elementary school are low, Figure 1 shows meaningful differences over the course of elementary school. Following kindergarten, an average of 2.8% of students are retained, with the greater racial/ethnic parity likely attributable to redshirting, whereby parents delay their child’s progress to the next grade to encourage their academic or behavioral development (Bassok & Reardon, 2013). In first grade, an average of 1.8% of students are retained, roughly half of the first-grade retention rate reported by Warren and saliba (2012) using Current Population Survey data. In second through fourth grade, students who identify as White and Asian are retained at very low rates. At most, 0.04% of White and Asian students are retained following these grades. Approximately 2% of students who identify as Black are retained following second and third grade. Among Latino/a students, 1.5% were retained following second grade and 1.2% were retained following third grade. Only 0.1% of students were retained following fourth grade, almost all of whom identify as Black or Latino/a.

Elementary school grade retention by grade and student race/ethnicity.
Explaining Disproportionalities in Grade Retention
The remaining results in Table 1 begin to address the second research question regarding the student, teacher, school, and principal characteristics related to disproportionalities in grade retention. Table 1 shows sharp differences in the previously identified structural risk factors for grade retention. Black students score 44% of a standard deviation lower on the reading test and 77% of a standard deviation lower on the math test than White students. Black students’ parents are more likely to describe their child’s health as poor, fair, or good compared with White students. Black students’ teachers are more likely to describe the student as having poor classroom behavior, as evidenced by lower ratings of their self-control, interpersonal skills, and externalization of problem behaviors. Compared with White students, Black students are, on average, a month younger when they start kindergarten, but a smaller fraction are first-time kindergarteners. Latino/a students also score lower on standardized tests than White students and have worse ratings of their classroom behavior compared to White students, although the differences are smaller in magnitude. Latino/a parents are more likely to describe their child’s health as poor, fair, or good compared with White students and speak a language other than English at home.
Relevant to this study is the rates of student–teacher and student–principal racial/ethnic matching. Through kindergarten through fourth grade, Black students are assigned to a teacher who identifies as Black 26% of the time. Latino/a students are assigned to a teacher who identifies as Latino/a 30% of the time. Black students are more likely to attend a school with a Black principal than Latino/a students are to attend a school with a Latino/a principal (39% vs. 22%). White students are the least likely to live in state with a third-grade reading retention policy. Whereas 38% of White students live in a state with such a policy, 47% of Black students and 65% of Latino/a students live in a state with a third-grade reading retention policy.
To understand the extent to which these differences across racial/ethnic groups are associated with grade retention in elementary school, in Table 2, I report the probability of retention with student, school, teacher, and principal characteristics. Column 1 reaffirms the results reported in Table 1. Compared with White students, the probability of Black students being retained is 1.1 percentage points higher, the probability of Latino/a students being retained is 0.3 percentage points higher (p = .06)., and the probability of other race students being retained is 0.8 percentage points higher (p = .09).
Predicting Grade Retention, Linear Probability Model
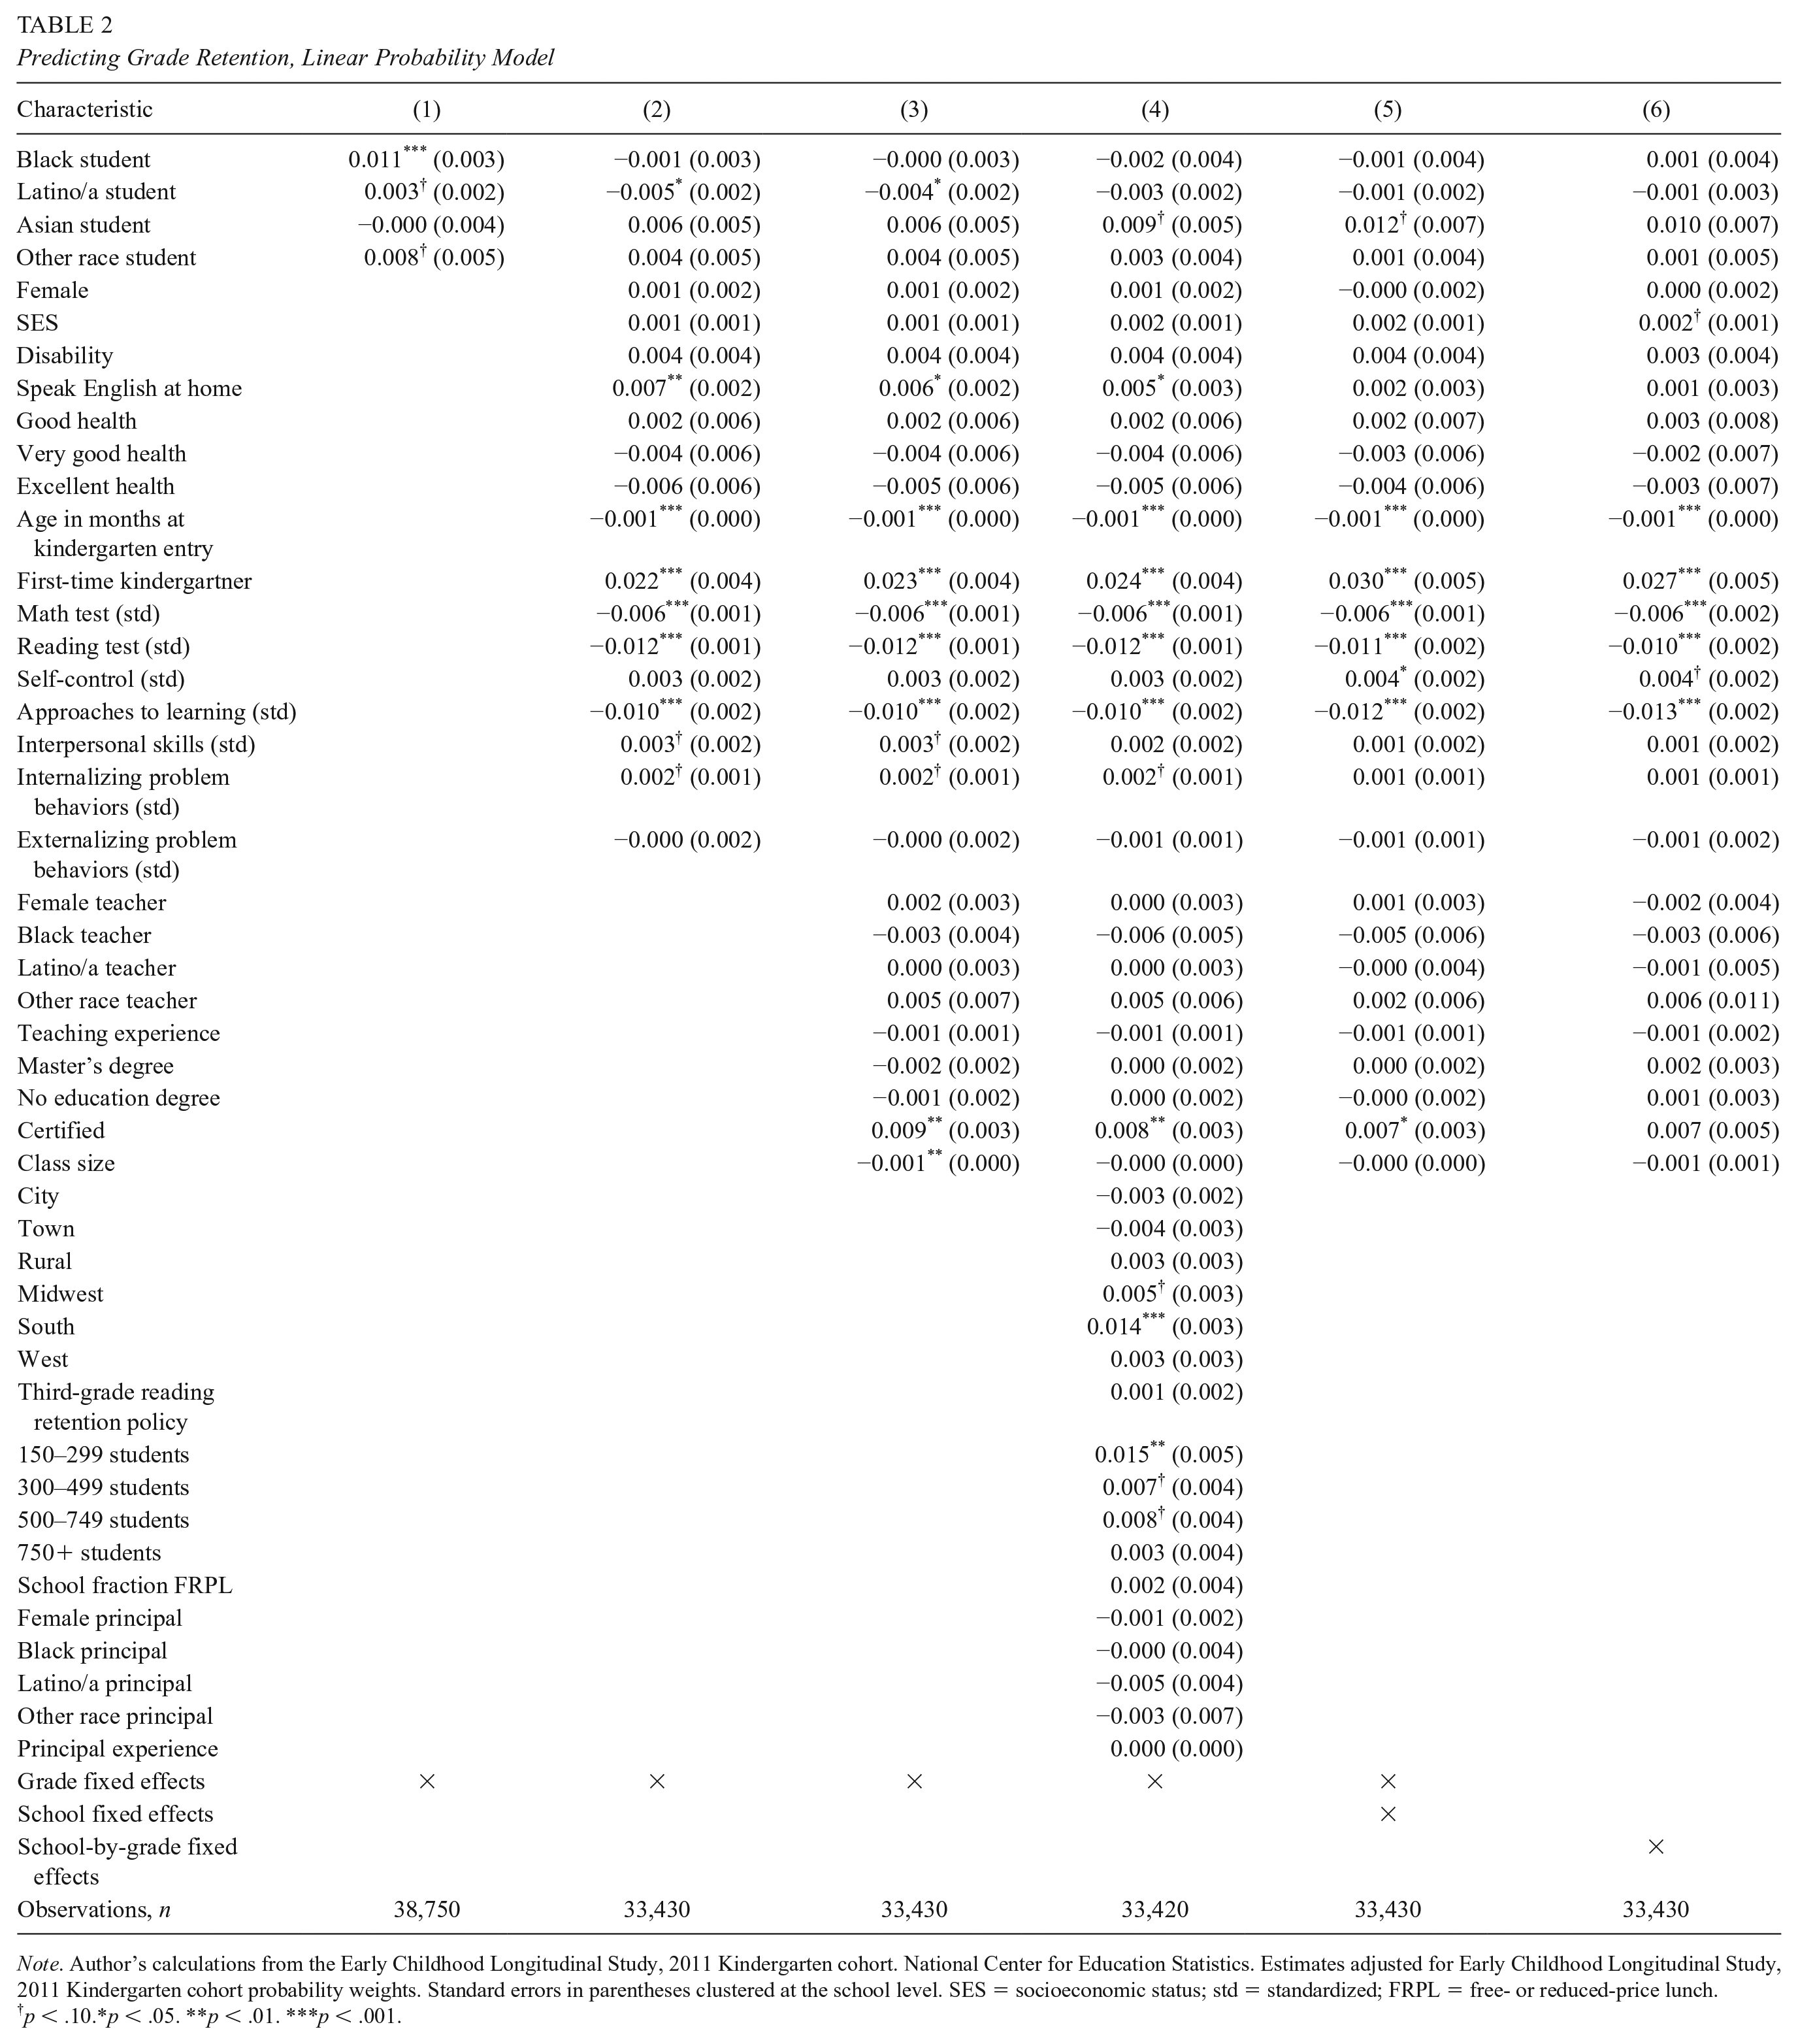
Note. Author’s calculations from the Early Childhood Longitudinal Study, 2011 Kindergarten cohort. National Center for Education Statistics. Estimates adjusted for Early Childhood Longitudinal Study, 2011 Kindergarten cohort probability weights. Standard errors in parentheses clustered at the school level. SES = socioeconomic status; std = standardized; FRPL = free- or reduced-price lunch.
p < .10.*p < .05. **p < .01. ***p < .001.
When controlling for observable student characteristics in Table 2, estimates show that the higher probability of grade retention for Black students compared with White students disappears. The predicted probability that Latino/a students are retained is lower than White students. In other words, Black and Latino/a students’ higher rates of grade retention can be explained by measurable factors, such as test scores, background characteristics, and teacher-reported classroom behavior.
The student-level controls negatively associated with grade retention are age at kindergarten entry, test score performance, and teacher reports of students’ approaches to learning. An additional month in a child’s age at kindergarten entry is associated with a 0.1 percentage point decrease in grade retention probability. Lower scores on the reading test were more strongly associated with grade retention than math test scores. On the reading test, a standard deviation increase was associated with a 1.2 percentage point decrease in the probability of being retained.
Less consistent evidence is found for positive student-level correlates with elementary school grade retention. Whether or not the student was a first-time kindergarten student when they entered the study strongly predicts that they will not be retained again, holding all else constant (0.022, p < .001). In contrast to previous work, student health is not associated with an increased risk of retention and speaking English at home is positively correlated with grade retention, holding all else constant.
Adding teacher-level controls to the model in column 3 does little to change these observed relationships. The only teacher covariate with a meaningful association with grade retention is teacher certification. The probability of retention is 0.9 percentage points higher for students assigned to certified teachers compared to uncertified teachers, controlling for other variables in the model. In the next column, characteristics of the school and principal are added to the model. The school characteristics associated with increased probabilities of retention are being located in the southern United States (compared with schools in the East) and enrolling 150 to 749 students (compared with schools with fewer than 150 students).
To test for the extent to which these differences are driven by unobserved time-invariant school-level factors correlated with a student’s probability of being retained, in columns 5 and 6, I replace the school and principal covariates with school and school-by-grade fixed effects, respectively. Holding all else constant, there is no evidence of racial/ethnic differences in elementary school grade retention. When making these within-school comparisons, the relationship between other student-level covariates and grade retention remain consistent with prior estimates.2,3
Student–Teacher and Student–Principal Racial/Ethnic Matching and Grade Retention
The results in Table 3 help answer the third research question regarding the relationship between student–teacher and student–principal racial/ethnic matching and grade retention. The literature review describes how grade retention decisions are subject to the influence of both the classroom teacher and principal. Given the role of discretion in this process, I argued that this decision is likely sensitive to the racial/ethnic matching of students and their teachers and principals, with the expectation that a stronger relationship will be found between student–principal racial/ethnic matching and grade retention than student–teacher racial/ethnic matching. In Table 3, I empirically test this hypothesis in columns 1, 3, and 5. If the coefficient on teacher or principal of the same race/ethnicity is negative and significant, it would indicate that students have a reduced probability of being retained when their classroom teacher or principal identifies as the same racial/ethnic group as the student, holding other variables in the model constant. No evidence is found to support this hypothesis for White, Black, or Latino/a students.
Predicting Grade Retention With Student–Teacher and Student–Principal Racial/Ethnic Matching

Note. Author’s calculations from the Early Childhood Longitudinal Study, 2011 Kindergarten cohort. National Center for Education Statistics. Estimates adjusted for Early Childhood Longitudinal Study, 2011 Kindergarten cohort probability weights. Models include controls for time-varying student characteristics, teacher characteristics, school characteristics, and principal characteristics. Standard errors in parentheses clustered at the student level.
p < .10. *p < .05. **p < .01. ***p < .001.
Yet, since teachers and principals are both involved in retention decisions, it could be that the benefits of representation only arise when both the teacher and principal identify as the same race as the student. With this complementary hypothesis, a Black teacher may only be less likely to suggest retaining a student when their principal also identifies as Black. The marginally significant coefficient for the interaction between Black teachers and principals in column 4 provides suggestive evidence for this hypothesis. Yet the marginally significant coefficient for student–teacher racial matching overshadows the interaction. 4 To aid in the interpretation of this relationship, Figure 2 plots the predicted probabilities of grade retention for White, Black, and Latino/a students by student–teacher and student–principal racial/ethnic matching, holding other variables in the model at their mean. This figure shows variation in the predicted probabilities of grade retention by student, teacher, and principal race/ethnicity—particularly for Black students—but that these predictions are estimated with little precision and thus not significantly different from one another. 5

Predicted probabilities of grade retention, by student race/ethnicity.
To answer the fourth research question, the final set of analyses examines the extent to which the racial matching between Black students, their teachers, and principals is moderated by region, the presence of a reading retention policy, and student gender. Results are presented for Black students in Table 4. 6
Predicting the Heterogeneity of the Moderating Effect of Grade Retention for Black Students
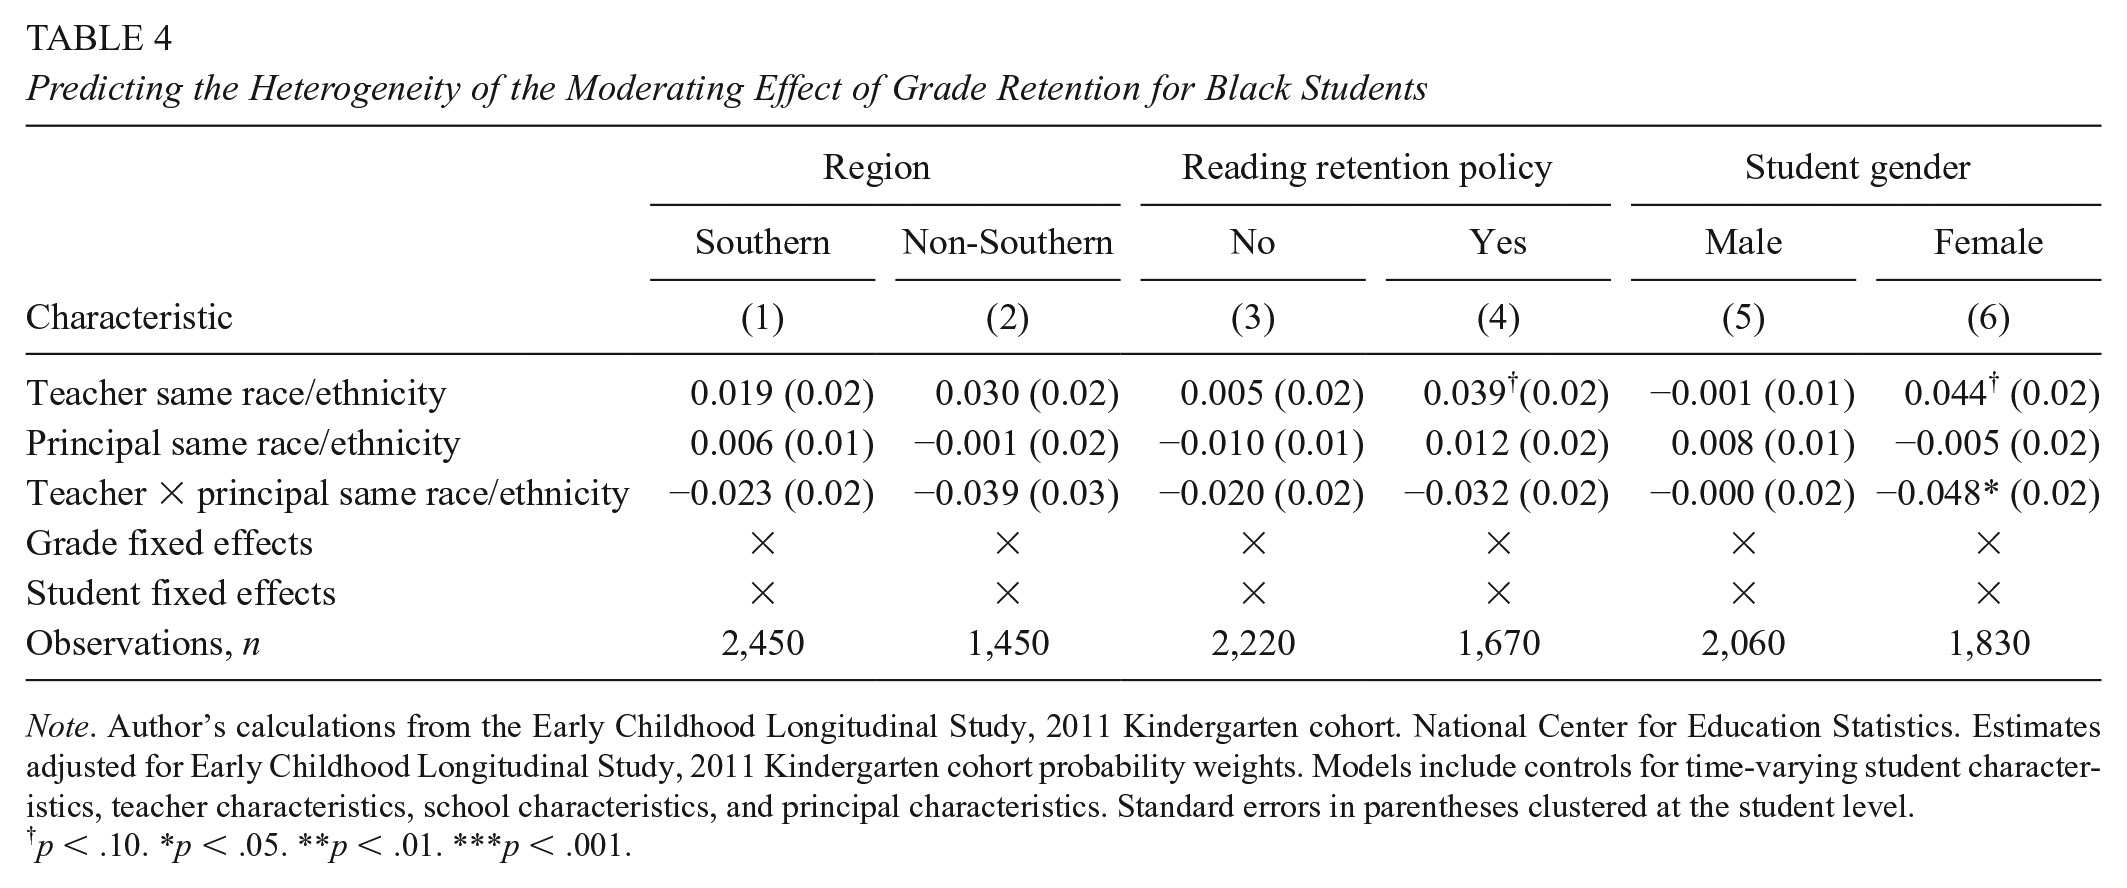
Note. Author’s calculations from the Early Childhood Longitudinal Study, 2011 Kindergarten cohort. National Center for Education Statistics. Estimates adjusted for Early Childhood Longitudinal Study, 2011 Kindergarten cohort probability weights. Models include controls for time-varying student characteristics, teacher characteristics, school characteristics, and principal characteristics. Standard errors in parentheses clustered at the student level.
p < .10. *p < .05. **p < .01. ***p < .001.
Student–teacher–principal matching may have the strongest relationship in the southern United States, where two thirds of Black students in the sample attend school and grade retention levels are highest. No evidence is found to suggest that the relationship between student–teacher and student–principal matching and grade retention varies depending on whether or not the student lives in the South.
Next, results are separated for states with third-grade reading retention policies. Although the specific design of these policies varies, including the degree of teacher and principal influence in the decision, the presence of these policies likely shapes both the levels of student grade retention and local decision making related to which students are retained (LiCalsi et al., 2019). Descriptively, retention rates are slightly higher in states with a third-grade reading retention policy (1.1% vs. 1.7%), although this average difference is driven by retention after kindergarten and first grade as opposed to third grade (see Table A5). Yet the exact relationship between student–teacher–principal racial matching and grade retention in states with reading retention policies is somewhat ambiguous. On the one hand, states such as Florida that have rigid retention policies may reduce teacher and principal discretion in the retention decision, thereby weakening the relationship between racial matching and grade retention. On the other hand, the presence of a reading-based retention policy may increase educators’ scrutiny of students’ reading proficiency throughout early elementary school, which could lead to earlier remediation and grade retention. In states with a reading retention policy, a marginally significant and positive relationship is found for Black students with Black teachers (without Black principals).
The final set of analyses examine the extent to which there are gender differences for Black male and female students with Black teachers and principals. Results in the final column of Table 4 indicate that the observed relationship in Table 3 is driven primarily by female students. Black female students with Black teachers and principals have a lower probability of grade retention, but that the direct effect of student–teacher matching makes this difference substantively insignificant.
Discussion
In this study, I used nationally representative data from a cohort of kindergarten students to better understand the rates of grade retention in elementary school and the factors associated with this grade retention. Descriptive results suggest that grade retention rates continue to drop compared with previous cohorts of students (Warren & saliba, 2012), although racial/ethnic disproportionalities in grade retention persist. From kindergarten through fourth grade, 1.1% of White students, 2.2% of Black students, and 1.4% of Latino/a students are retained annually. Retention rates are highest in kindergarten and first grade, particularly in states with third-grade reading retention policies. When controlling for a rich set of student, teacher, principal, and school characteristics, evidence of significant racial/ethnic disparities in grade retention disappear. This finding aligns with previous research that has found racial/ethnic disparities in grade retention can largely by explained by prior student achievement (Reynolds, 1992; Tavassolie & Winsler, 2019; Winsler et al., 2012).
Results from this study build on the evidence base regarding the structural risk factors associated with elementary school grade retention. Many of the predictors of grade retention in this study are consistent with prior research (Alexander et al., 2001; Jimerson et al., 1997; Xia & Kirby, 2009). Age at entry to kindergarten, standardized test scores, and teacher reports of students’ proacademic skills and behaviors were all negatively associated with grade retention. First-time kindergarteners had increased odds of being retained. Yet no consistent evidence is found for other factors. In particular, when controlling for other variables in the model, no evidence was found of a relationship between the following variables and student grade retention: student disability status, parental ratings of health, and a composite measure of SES, which includes mother’s education, father’s education, mother’s occupational prestige, father’s occupational prestige, and household income.
This study also extends the literature on student–teacher and student–principal racial/ethnic matching. While an extensive literature base documents how student–teacher racial/ethnic matching is associated with improved academic and behavioral outcomes for Black and, to a lesser degree, Latino/a students (Redding, 2019), previous research has not examined the relationship with grade retention. In this study, I find no evidence of such a relationship for White, Black, or Latino/a students. One explanation for this finding is that teachers generally hold a favorable view toward grade retention (R. T. Jacob et al., 2004), suggesting that retention decisions are mediated by these beliefs. That is, there may be instances where a teacher recommends retaining a same-race student because she feels the student would benefit the most from remediation in their current grade. Since principals are also involved in grade retention decisions, it was hypothesized that retention rates may only be lower when students have a teacher and principal of the same race/ethnicity. Regression analysis indicated that the reduced probability of retention for Black students with Black teachers and principals was overshadowed by the increased odds of retention by Black teachers. Some suggestive evidence showed that for Black students, this pattern was strongest in states with a test-based retention policy and for female students. No significant evidence was found for Latino/a students.
Limitations and Future Research
This study models the ways in which student–teacher and student–principal racial/ethnic matching are associated with the high-stakes educational decision of grade retention. While the teacher and principal are likely the key school stakeholders in making retention decisions, other staff may also be involved, including school psychologists, reading specialists, special education teachers, and assistant principals. Mixed methods research may be of particular utility in understanding how school stakeholders decide which students to retain, with particular attention to the ways in which this decision challenges or affirms stakeholders’ racial attitudes and how it interfaces with broader policy considerations. This research could also probe how the beliefs of various school stakeholders inform grade retention decisions.
Administrative data could also help better identify the relationship between student-teacher and student-principal racial/ethnic matching on grade retention. While Black students were retained at lower rates when in a school with a Black teacher and principal, this relationship was not estimated with sufficient precision to determine if it was statistically meaningful. Replicating this study with administrative data would allow researchers to estimate the interactive relationship between racial/ethnic matching between students, teachers, and principals with greater precision. Using administrative data could also allow for the use of teacher and school fixed effects to account for other sources of bias that may affect the observed relationship between student–teacher and student–principal racial/ethnic matching and grade retention. That said, such a study would likely have to occur in a district or state with student achievement data available in the early grades when students are most likely to be retained.
Finally, examining differences in retention rates in states with and without third-grade reading retention policies yields some interesting descriptive findings, namely, that students in these states are more likely to be retained in kindergarten and first grade. As these observed differences reflect both the effect of these policies on student retention and unique features of states with third-grade reading retention policies, they point to an important area for more rigorous research. Now that over a third of states have adopted third-grade retention policies, future research should more carefully examine not only how these policies affect the students that are retained (Greene & Winters, 2007; Schwerdt et al., 2017), but the broader effects in the early grades (Y. Hong & Hong, 2021). It may be that threat of retention in third grade has led to other outcomes in early elementary school, including the increased adoption of evidence-based reading interventions or grade retention. In other words, the broader impact of third-grade reading retention policies, positive or negative, may be overlooked by only focusing on students identified for mandatory retention.
Implications
Evidence that the rates of grade retention continue to drop compared with earlier cohorts is promising, given the mixed evidence of a relationship between grade retention and students’ academic performance and negative relationship with students’ social adjustment and educational attainment (Eren et al., 2017; Goos et al., 2021; Hwang & Cappella, 2018; B. A. Jacob & Lefgren, 2009; Mariano et al., 2018; Ou & Reynolds, 2010; Schwerdt et al., 2017; Winters & Greene, 2012). Yet grade retention remains a focus of policy makers, given the number of students who do not develop foundational reading skills in early elementary school and the appeal of rigid accountability policies aimed at remediation. Regardless of broader controversies surrounding the use of test-based retention policies (Huddleston, 2014; Penfield, 2010), results from this study suggest that the timing of retention decisions may shift in these states, preserving local discretion over most grade retention decisions. On the one hand, this finding is positive, in that it suggests that even when state policy makers try to remove significant discretion from local school stakeholders, the complexity of schools’ educative mission precludes policies from undermining teachers’ and administrators’ professional expertise.
Yet grade retention is a domain in which teachers’ and administrators’ beliefs about the efficacy of the practice are in weak alignment with the research evidence (Penfield, 2010). Insofar as their beliefs about the efficacy of grade retention increase the likelihood of holding back low-performing students—students disproportionately more likely to be racialized minorities—school-based grade retention will continue to contribute to diminished educational opportunities for Black and Latino/a students. Unlike other domains of schooling, student–teacher and student–principal racial/ethnic matching are not found to be a mechanism for ameliorating Black and Latino/a students’ higher grade retention rates.
Footnotes
Appendix
Elementary School Grade Retention Rates, by State-Level Third-Grade Reading Retention Policy

| Characteristic | Third-grade reading retention policy | |
|---|---|---|
| No | Yes | |
| All grades | 0.011 | 0.017*** |
| Kindergarten | 0.024 | 0.034* |
| 1st grade | 0.014 | 0.022* |
| 2nd grade | 0.008 | 0.012 |
| 3rd grade | 0.008 | 0.011 |
| 4th grade | 0.001 | 0.001 |
| Observations, n | 19,800 | 18,960 |
Note. Author’s calculations from the Early Childhood Longitudinal Study, 2011 Kindergarten cohort. National Center for Education Statistics. Estimates adjusted for probability weights.
p < .10. *p < .05. **p < .01. ***p < .001.
Acknowledgements
I wish to thank Jael Gattle for assisting in the preparation of this manuscript.