
Abstract
Prior work has shown that students’ self-reported levels on social-emotional measures predict achievement levels and gains, but we have little evidence on whether within-student changes in self-reports on social-emotional surveys are predictive of changes in theoretically related academic and behavioral outcomes. We use large-scale data from the California CORE districts to examine whether changes in individual reports on social-emotional measures from one school year to the next predict changes in state math and English language arts test scores and attendance. We show that changes in self-reported social-emotional measures predict changes in both achievement and attendance. These results are robust across model specifications. Moreover, the relationships between SEL and achievement and attendance outcomes are consistent across student subgroups.
Introduction
Recent evidence shows that social-emotional learning (SEL) is strongly predictive of educational and career success, even after controlling for differences in students’ experiences and achievement (Deming, 2017; Duckworth et al., 2010; Farrington et al., 2012; Kautz et al., 2014; Yeager & Dweck, 2012). As a consequence, school systems are increasingly seeking ways to measure students’ SEL. The most common approach to measurement, given its administrative ease and low cost, is the use of self-report student surveys. Yet questions remain about the validity of using students’ responses to these surveys to track their social-emotional development.
It is well documented that student self-reports on SEL surveys do predict theoretically related academic and behavioral outcomes (Claro & Loeb, 2019a, 2019b; Duckworth et al., 2010; Soland, 2019; West et al., 2020). Although these correlations, in theory, could reflect other factors that predict both students’ responses and their other outcomes, research provides some evidence that these responses do capture differences across students in the assessed constructs (Gehlbach & Hough, 2018). At the same time, studies have not comprehensively assessed the validity of changes in student responses over time for monitoring student social-emotional development. Changes over time could measure real changes in student SEL, or they could simply be noise with students selecting responses based on their daily mood or level of concentration. If changes in reports were noise, we would not expect them to predict changes in other valued outcomes, such as achievement. But if changes in reported SEL were capturing real changes in students, those changes could provide useful information to schools and districts. School improvement decisions require making sense of data in real time to guide interventions at a variety of levels, from individual students or entire organizations (Schildkamp, 2019). Changes in reported SEL could be used to evaluate the efficacy of programs or interventions or for monitoring student well-being.
In this paper, we use data from five school districts to examine whether changes in individual students’ self-reported SEL from one school year to the next predict changes in state test scores and attendance. The districts are members of the CORE districts, a collaborative of California school districts that since 2014–15 has administered a common set of surveys to all students in Grades 4 through 12. Our results provide evidence of the relationship between within-student changes in levels of self-reported social-emotional constructs and within-student changes in attendance and academic achievement. Our measures of academic achievement are state standardized tests, thereby extending previous work done studying the relationship between within-student changes in self-management (Duckworth et al., 2010) and self-efficacy (Soland, 2019) and other measures of achievement. To our knowledge, our study is the first to examine the relationship between changes in multiple SEL constructs and changes in outcomes simultaneously.
The CORE SEL survey seeks to measure four aspects of students’ social-emotional development: (a) growth mindset, the belief that one’s abilities can improve with effort (Dweck, 1999); (b) social awareness, the ability to take the perspective of and empathize with others from diverse backgrounds and cultures, to understand social and ethical norms for behavior, and to recognize family, school, and community resources (Collaborative for Academic Social and Emotional Learning [CASEL], n.d.); (c) self-efficacy, the belief in one’s own ability to succeed in achieving an outcome or reaching a goal (Bandura, 1997); and (d) self-management, the ability to regulate one’s emotions, thoughts, and behaviors effectively in different situations, such as managing stress, delaying gratification, motivating oneself, and setting and working toward personal and academic goals (CASEL, n.d.).
Although the importance of SEL is well established, validity evidence surrounding the use of self-report survey measures of SEL to monitor students’ social-emotional development is still emerging. Known limitations of self-report measures (Duckworth & Yeager, 2015; Melnick et al., 2017; Soland et al., 2013) raise doubts about their ability to inform practitioners and policymakers about students’ development. Students may lack sufficient knowledge to evaluate themselves accurately, their responses may be skewed by social desirability bias, and their reference points for evaluating themselves may depend on their classroom or school environment (Duckworth & Yeager, 2015; Soland, et al., 2013; West et al., 2016). Duckworth and Yeager (2015) hypothesize specifically that students’ responses may be insensitive to short-term changes, preventing self-report ratings from capturing changes over time.
However, since 2017, the CORE-PACE Research Partnership has produced a number of studies exploring the measurement properties and use of the SEL surveys. This research has shown that the survey items were developed based on research evidence and that they have broad buy-in from school and district leaders (Allbright & Marsh, 2020; Krachman et al., 2016; West et al., 2018) and, further, that the items are generally reliable measures of their respective constructs (Meyer et al., 2018). The SEL survey scores have also been shown to be predictive of measures of student achievement and behavior such as test scores, grade point average, attendance, and suspensions (Claro & Loeb, 2019a, 2019b; West et al., 2020). In addition, although SEL growth varies widely within schools and classrooms (Fricke et al., 2019; Soland et al., 2019), recent research provides initial evidence that teachers and schools may contribute to students’ growth in SEL measures over time, as student SEL growth varies systematically across schools and across classrooms within schools (Fricke et al., 2019; Meyer et al., 2019).
Although the extant body of work makes strides toward establishing the validity and reliability of the CORE SEL measures for monitoring students’ SEL development, the question of whether students’ academic outcomes improve alongside increases in their SEL is yet unanswered, particularly for SEL dimensions such as growth mindset and social awareness. Establishing this connection is useful for two reasons. First, districts will benefit from appropriately sensitive measures of change in addition to levels if they aim to use the collected data to assess students’ social-emotional development over time. Second, districts will be better served by measures of SEL development that predict achievement gains or attendance if they aim to implement SEL interventions as a means to improve these other outcomes. Assessing the predictive validity of SEL measures based on levels alone leaves open the possibility that student SEL is correlated with unobserved student characteristics. In contrast, assessing whether changes in SEL are predictive of changes in other academic outcomes within students accounts for the influence of unobserved factors that are fixed over time.
Other studies using the CORE data indicate that grade-to-grade changes in students’ responses to the CORE SEL survey do not simply reflect measurement error around a stable student-specific mean. In particular, studies have shown that the SEL measures vary systematically across grades and that this variation differs across constructs. For example, West et al. (2020), using 2 years of the CORE districts’ student surveys, document that students’ self-reported scores on self-efficacy and social awareness decline markedly between Grades 4 and 12, whereas growth mindset scores increase over time. Self-management appears to increase between Grades 4 and 6, decline between Grades 6 and 8, and then increase slightly during high school. Fahle and colleagues (2019) show that the decline in self-efficacy over time is observed among all major demographic groups within the CORE districts and is especially pronounced for girls. These papers speak to the measures’ internal consistency but do not assess their ability to predict distal outcomes.
In this study, we consider the changes in students’ relative position in growth mindset, self-efficacy, self-management, and social awareness in the distribution of their peers and their relationship with the changes in the student’s relative position in the distribution of their peers for math achievement, English language arts (ELA) achievement, and attendance rate. To our knowledge, only two studies have assessed the relationship between within-student changes in SEL and changes in other student-level outcomes. The first focused specifically on self-management skills and grade point average (GPA; Duckworth et al., 2010) and the second on self-efficacy and scores on a district-administered standardized test (Soland, 2019). We are not aware of studies documenting the relationship between changes in self-reported growth mindset and social awareness and changes in other student outcomes. Moreover, because three of these four SEL constructs are highly correlated with each other (Meyer et al., 2018), estimating the relationship between each SEL construct’s change and other outcomes independently may result in omitted-variable bias. As such, it is important to consider all four of these focal constructs simultaneously while also recognizing that this may not fully solve the omitted-variable problem. We found no prior work assessing the relationship between SEL and achievement changes that takes into account changes in other SEL constructs. It is likely, however, that individual stakeholders may examine and interpret changes in SEL measures over time, making the collection of validity evidence around the interpretation of these changes paramount for sound decision making. Although this study cannot establish causal relationships between SEL constructs and other outcomes, it lays the groundwork for causal analyses and the evaluation of specific interventions that seek to build SEL schools as a means to support students’ academic and behavioral success.
The present study uses administrative data and self-reported social-emotional measures for middle school students enrolled in the CORE districts between 2015 and 2017. We address two specific questions: Are within-student changes in self-reported social-emotional measures, measured relative to other students in same grade cohort, predictive of changes in academic and behavioral outcomes? Do the relationships between SEL changes in self-reported social-emotional measures and changes in other outcomes vary by student characteristics such as gender, race, economic disadvantage, prior academic achievement, and prior levels on self-reported social-emotional measures?
Method
Sample and Measures
We used longitudinal data from students in the CORE districts for school years 2014–15 (SY15), 2015–16 (SY16), and 2016–17 (SY17). The CORE districts together serve over 1 million students and represent 20% of all students in California. We constructed our analytic sample based on the requirements of our most restrictive model. We began with the 218,851 students who were in fourth to sixth grade during SY15 and were enrolled in the school districts of Fresno, Long Beach, Los Angeles, San Francisco, and Santa Ana. After filtering out students not observed in all three study years, we were left with 109,335 unique students. We dropped students who appeared in more than one school in a given year, who were missing one or more of the four SEL measured constructs in any of the years analyzed, or for whom we did not have each of the outcomes available each year. This process resulted in retaining 45% of students observed for 3 years, leaving an analytical sample of 49,216 unique students and 147,648 individual observations. Ensuring that each model was fit to the same sample of students was key, as the results of all three of our model specifications were meant to be interpreted alongside each other, and we wanted to remove the possibility that interpretations across models were driven by data availability differences. Table 1 provides a demographic summary of the students included in the main analysis. The sample was predominantly Latinx (73%) and eligible for free or reduced-priced lunch (85%).
Demographic Summary of Students in the Analytical Sample

Note. The sample consisted of fourth to sixth grade students in SY15 who completed social-emotional learning (SEL) surveys and had available achievement and attendance data between SY15 and SY17.
The CORE districts began fielding surveys of students to collect information on SEL in spring 2015. The surveys, conducted each spring, aim to measure four SEL constructs by asking students to rate themselves on a series of items in five-level Likert scales. The four SEL measures are the following:
Growth mindset, adapted by Transforming Education from Farrington et al. (2013) and Dweck (1999), measures the extent to which students believe their intelligence is malleable (as opposed to fixed). Students rate how true is each of four statements using a 5-category Likert scale (5 = very true, 1 = not at all true).
Social awareness, adapted by Transforming Education (2016) from the American Institutes for Research (AIR) and the Collaborative for Academic, Social, and Emotional Learning (CASEL) tool “Student Self-Report of Social and Emotional Competencies,” measures perceived interpersonal abilities such as empathizing with others and listening to others’ points of view. Each item has its own 5-category scale.
Self-efficacy, adapted from Farrington et al. (2013), measures how students perceive their abilities to perform academic tasks and succeed in classes. Students rate how confident they are with statements such as “I can do well on all my tests, even when they are difficult” using a 5-category Likert scale (5 = completely confident, 1 = not at all confident).
Self-management represents the “ability to regulate one’s emotions, thoughts, and behaviors effectively in different situations” (Transforming Education, 2016, p. 5), measured through nine items adapted from Park et al. (2017). Students rate how often they behaved as the item described “during the past 30 days,” using a 5-category Likert scale (5 = almost all the time, 1 = never or almost never).
Following Meyer et al. (2018), we used SEL scores constructed by fitting a polytomous item response theory (IRT) model called the generalized partial credit model. Using this method, Meyer et al. (2018) show that the four measures have relatively high reliability, with the exception of growth mindset at lower grades where reliability is lower and there is possible rating scale confusion due to negatively worded items (Bolt et al., 2019). Meyer et al. also provide evidence that the instruments measure distinct constructs.
We focus on three main student outcomes: math and ELA scores from the Smarter Balanced Assessment Consortium (SBAC), a standardized computer-adaptive test administered in Grades 3 through 8, and attendance percentage (days attended divided by days enrolled). The SBAC is also scaled using IRT, with scores placed on a vertical scale. We focus on test scores and attendance percentage because of their availability, importance to practitioners, and interpretability. Table 2 reports mean scores and standard deviations of each SEL construct and outcome by year and cohort. As a shorthand, we refer to growth mindset, social awareness, self-efficacy, and self-management as
Score Means (Standard Deviations) by Cohort-Year

Note. SY = school year; SEL = social-emotional learning; GM = growth mindset; SA = social awareness; SE = self-efficacy; SM = self-management; SBAC =Smarter Balanced Assessment Consortium; ATT-P = attendance percentage. Low sample size within some grade-year cells is due to students retained in the same grade over 2 years.
Table 3 shows correlations between SEL constructs and outcomes. Note that social awareness, self-efficacy, and self-management are highly intercorrelated (r = .44–.54), whereas growth mindset is moderately correlated with the other three constructs (r = .20–.34). Additionally, SBAC ELA and SBAC math are correlated with each other (r = .80), whereas attendance percentage is not well correlated with any of the other measures (r < .2).
Correlations Between SEL Constructs, SBAC Scores, and Attendance Percentage

Note. SEL = social-emotional learning; SBAC =Smarter Balanced Assessment Consortium; GM = growth mindset; SA = social awareness; SE = self-efficacy; SM = self-management; ELA = English language arts; ATT-P = attendance percentage. All correlations were significant at the p < .01 significance level.
The SEL change and achievement change constructs are measures of the change in students’ position in their peer distributions over time. To create these measures, we standardize each SEL measure and outcome variable to have a mean of zero and a standard deviation of one within each grade-year, converting our SEL measures to standard deviations from the cohort mean for a given year. Within-grade-year standardization is essential, as West et al. (2018) document large differences across grades in the average change in SEL scores within the CORE districts. Students’ growth in academic achievement as measured on the SBAC vertical scale also varies systematically across grades, as do average changes in attendance rates. Across-grade differences in SEL could in part reflect differences in student response styles or contexts across grades, whereas differences in outcomes could be influenced by characteristics of the school system unrelated to social-emotional development (e.g., more effective teachers in a given grade). Rather than attempt to link these two phenomena, we take the more conservative approach of relating changes in students’ relative position within the distribution of social-emotional measures among their grade-level peers to changes in their outcomes—also measured relative to their peers.
Figure 1 illustrates the density of the distribution of year-to-year changes in position relative to the peer distribution across all SEL constructs and outcome variables. With the exception of growth mindset, the modal change in each distribution is zero. For growth mindset, the modal change is slightly negative. All measures have year-to-year changes beyond 2½ SD, and changes at or above 1 SD are not uncommon in any measure. Overall, we see that the SEL change distributions have slightly longer tails than the SBAC change distributions. The attendance percentage change distributions have extremely long tails, but most observations are also clustered around zero.

Distributions of year-to-year changes in SEL and outcome measures. SEL, social-emotional learning; SBAC, Smarter Balanced Assessment Consortium; ELA, English language arts.
We use student demographic variables, such as indicators for economic disadvantage, special education, English learner (EL) status, homelessness, and race/ethnicity, to assess the heterogeneity of results. Table 1 gives the proportion of students in these demographic categories.
Analysis
Our goal is to describe the relationship between changes in SEL and changes in other student outcomes. To provide a benchmark for our preferred estimates, we begin by modeling the relationship between SEL levels and student achievement changes as described by Equation 1:

where
To address this concern, we exploit the panel structure of our data (i.e., the ability to connect observations of the same student across years) to estimate a second model that uses within-student variation to assess whether outcomes change when SEL changes. Equation 2 describes this second model:

where
Equation 2 models the within-student relationship between changes in SEL and changes in outcomes, but we might also be interested in the relationship between changes in SEL and higher order trends in outcomes. That is, how does the change in SEL predict differences in student learning (as measured by test score gains) across years? To address this question, we present a third model:

where
We choose the models represented in Equations 2 and 3 instead of structural equation model (SEM) or hierarchical linear model (HLM)-based approaches (e.g., Soland, 2019, and Duckworth et al., 2010, respectively), because specifying a SEM requires making significant assumptions about causal pathways between variables and the items used to measure them and because HLM approaches treat the individual student intercepts as random variables, only estimating their mean and variance. Our sample was large enough that the efficiency gains from estimating random effects were outweighed by the flexibility of estimating individual student fixed effects. We are agnostic about the directionality of the causal relationships between changes in the four SEL constructs and changes achievement. Additionally, SEL constructs in the CORE districts survey appear to follow diverse and changing growth trajectories along school grades (West et al., 2018).
We estimate all models using the plm package v2.2-0 (Croissant & Millo, 2008) in R v3.6.1 (R Foundation, n.d.). We estimate standard errors using cluster-robust variance estimators (Millo, 2017). Additionally, because the correlation between same-period changes in growth mindset are not well correlated with changes in the other three constructs (
Results
Overall, we find positive and statistically significant associations between the SEL constructs and the outcome variables across all three model specifications. In all tables for all models, we report robust standard errors clustered by student. Our figures display 95% confidence intervals constructed from robust standard errors adjusted for student-level clustering. In general, we observe that changes in growth mindset and self-management are the strongest predictors of test performance. Additionally, growth mindset, along with self-efficacy, is a predictor of changes in individual attendance percentage.
SBAC ELA
Table 4 presents the results for each of the three models for SBAC ELA. We first look at Columns (a) through (e) under Model 1. Because we control for the previous period’s outcome, this model uses 3 years of data to produce two observations per student in the sample. Results demonstrate that, controlling for prior ELA scores, SEL is related to current ELA scores. Taken individually, a difference of 1 SD in SEL is associated with an expected ELA score from .044 SD (for social awareness) to .098 SD (for growth mindset) higher, controlling for previous SBAC ELA achievement. When combining all four SEL constructs, growth mindset and self-management dominate (b = .083, SE = .002 and b = .073, SE = .002, respectively). The coefficient on self-efficacy becomes trivial in magnitude (b = .009, SE = .003), whereas the coefficient on social awareness becomes negative (b = –.009, SE = .002). This may suggest that social awareness and self-efficacy are predictive of achievement when examined independently only due to their correlations with growth mindset and self-management.
Relationship Between Changes in SEL and Changes in ELA Test Scores, Diverse Models

Note. SEL = social-emotional learning; ELA = English language arts; SBAC =Smarter Balanced Assessment Consortium; FE = fixed effects; GM = growth mindset; SA = social awareness; SE = self-efficacy; SM = self-management. Standard errors clustered by student are shown in parentheses.
p < .1. **p < .05. ***p < .01.
Results for Model 2 are presented in the next set of Columns (a) through (e). This model predicts SBAC ELA including student fixed effects. The inclusion of student fixed effects removes time-invariant student characteristics and, as a result, estimates the relationship between within-student changes in SEL and ELA. Thus, we interpret Model 2 as describing the relationship between changes: Positive coefficients show that upward movement in SEL is accompanied by concurrent upward movement in ELA. The coefficient estimates from Model 2 are smaller than those for Model 1, ranging between .019 and .032. Associations in the four-construct model are, once again, dominated by self-management and growth mindset (b = .031, SE = .002 and b = .028, SE = .002, respectively).
Overall, we take this to show that within students, positive changes in SEL constructs are significantly associated with same-period positive changes in SBAC ELA performance. Additionally, note that for all Model 2 specifications, the sample size is reported as 50% larger than in Models 1 and 3. This occurs because it does not include a lagged outcome, which, from the model’s perspective, allows it to see three observations per student, compared with two per student in the other models. Despite the difference in reported observations, all models are estimated using the same pool of students. Of note are the negative values for the adjusted
Finally, the third set of Columns (a) through (e) present results for Model 3, where the outcome variable is change in SBAC ELA, and we include student fixed effects. Similar to Model 2, Model 3 focuses on changes within students over time. It differs from the specification in Model 2 in that it relates changes in SEL to changes in the changes in SBAC ELA. Here, positive coefficients describe a situation where a positive change in SEL from time
SBAC Math
Results for SBAC math are similar to those for ELA. Table 5 presents results for each of the three models with both single-construct and four-construct specifications. The estimates presented in the first set of Columns (a) through (e) show the results for Model 1. They demonstrate that controlling for previous SBAC math, students’ position in the SEL distribution of their grade cohort is related to their position in the SBAC math distribution. As with ELA, the four-construct model results in attenuation of estimated coefficients, and social awareness becomes negatively associated with SBAC math achievement. Coefficients in the single-construct models range from .040 to .084, and the four-construct model is dominated by growth mindset and self-management (b = .069, SE = .002 and b = .060, SE = .002, respectively).
Relationship Between Changes in SEL and Changes in Math Test Scores, Diverse Models

Note. SEL = social-emotional learning; SBAC =Smarter Balanced Assessment Consortium; ELA = English language arts; FE = fixed effects; GM = growth mindset; SA = social awareness; SE = self-efficacy; SM = self-management; ATT-P = attendance percentage. Standard errors clustered by student are shown in parentheses.
p < .1. **p < .05. ***p < .01.
The second set of Columns (a) through (e) in Table 5 report results for the individual fixed effects Model 2). Here again, Model 2 is a model describing the relationship between changes: Positive coefficients show that upward mobility in the SEL distribution is accompanied by concurrent upward mobility in the SBAC math distribution. Here again, the associations for social awareness and self-efficacy reduce in magnitude in the four-construct model, and growth mindset and self-management are the dominant SEL constructs (b = .029, SE = .002 and b = .026, SE = .002, respectively), although positive changes in any of the SEL constructs have significant positive associations with changes in SBAC performance. Table 5 presents the results for Model 3 in the third set of Columns (a) through (e). Recall that positive coefficients indicate that positive SEL changes are associated with increased SBAC math gains.
Each single-construct model shows a significant positive relationship between the change in SEL and the change in SBAC math achievement over time. In the four-construct model, the same three constructs are positively associated with improving math achievement, but the association with self-efficacy is not significantly different from zero. This result is qualitatively similar to the observed relationship between self-efficacy and SBAC ELA from the same model, where the coefficient was also not significantly different from zero. Increases in growth mindset (b = .032, SE = .004) dominate this model, but changes in social awareness and self-management are positively associated with increasing math achievement gains across time with similar magnitudes (b = .016, SE = .004 and b = .022, SE = .004, respectively).
Attendance
We also look at the behavioral outcome of attendance. We standardize attendance rate (percentage of days attending) within cohort-year, so all changes are again relative to their peer distribution. In Table 6, the first set of Columns (a) through (e) show attendance regressed on SEL and lag attendance. Coefficients on SEL in the single-construct models are similar in magnitude to those in the SBAC models, ranging from .024 to .035. The coefficient on social awareness is no longer significantly different from zero in the four-construct model, and self-efficacy and self-management, instead of growth mindset and self-management, emerge as dominant (b = .025, SE = .003 and b = .033, SE = .003, respectively).
Relationship Between Changes in SEL and Changes in Attendance Percentage, Diverse Models

Note. SEL = social-emotional learning; ATT-P = attendance percentage; FE = fixed effects; GM = growth mindset; SA = social awareness; SE = self-efficacy; SM = self-management. Standard errors clustered by student are shown in parentheses.
p < .1. **p < .05. ***p < .01.
The second set of Columns (a) through (e) in Table 6 present Model 2 with individual fixed effects. Here, coefficients on SEL are generally smaller than those observed in the SBAC models, ranging from .013 to .021. In the four-construct model, self-efficacy is the dominant construct (b = .015, SE = .003) and self-management takes a back seat to growth mindset, whereas the coefficient on social awareness is again not significantly different from zero. Here we see that increasing self-efficacy is associated with the largest increases in attendance.
The final set of Columns (a) through (e) in Table 6 show the results for Model 3. The estimated coefficients for the individual SEL construct models are lower in magnitude than those for the SBAC models (.013–.027). In the four-construct model, growth mindset and self-efficacy dominate (b = .016, SE = .005 and b = .023, SE = .006, respectively).
Taking the three sets of results together, we observe that changes in SEL are less strongly associated with changes in attendance than they are with changes in achievement. This pattern holds even though SEL levels are more strongly associated with attendance levels than are SBAC scores. One possible explanation is that students’ relative position in the attendance distribution is less stable year to year than relative position in the SBAC distributions (as evidenced in Figure 1). Overall, we find that changes in self-management and growth mindset are stronger predictors of changes in test performance, whereas changes in self-efficacy and growth mindset are stronger predictors of changes in attendance. Changes in self-management also predict changes in attendance, but the estimates for this construct are less consistent.
Heterogeneity
The relationship between changes in SEL and achievement may differ depending on students’ learning opportunities (Yeager et al., 2019), academic level (Yeager et al., 2019), previous levels of SEL, or other student characteristics. We explore heterogeneity in three primary ways: by demographic subgroups, by previous achievement and attendance, and by starting SEL.
Demographic Subgroups
We fit models within each subgroup to assess heterogeneity in the relationship between SEL and outcomes by subgroup. By plotting coefficients from these models side by side, we can visually diagnose heterogeneity. Heterogeneity here may be an indication of different relationships between changes in SEL constructs and outcomes of interest for different subgroups or differences in what the SEL survey items are measuring in different groups. Figure 2 shows the coefficient on each SEL construct from a model that regresses SBAC ELA on all four SEL measures under the fixed-effects specification from Model 2. The figure displays the 95% confidence intervals from cluster-robust standard errors (clustered at the individual level). The logic of this approach is that by looking for where confidence intervals do (and do not) overlap with each other, we have a visual indicator of observed heterogeneity. All four constructs in Figure 2 display overlapping confidence intervals, indicating that the estimates may not be distinguishable from each other at traditional significance levels. One exception is that students who are eligible for free or reduced-price lunch (FRL) appear to have a larger association between changes in growth mindset and changes in SBAC ELA scores than do students who are not eligible for subsidized lunch (non-FRL). However, this finding may be spurious given the considerable number of subgroups examined. Overall, the relationship between improving relative position in the SEL distribution and improving relative position in the distributions of academic and behavioral outcomes is roughly the same for all groups of students. (For details, see Table A1 in the supplemental materials.)
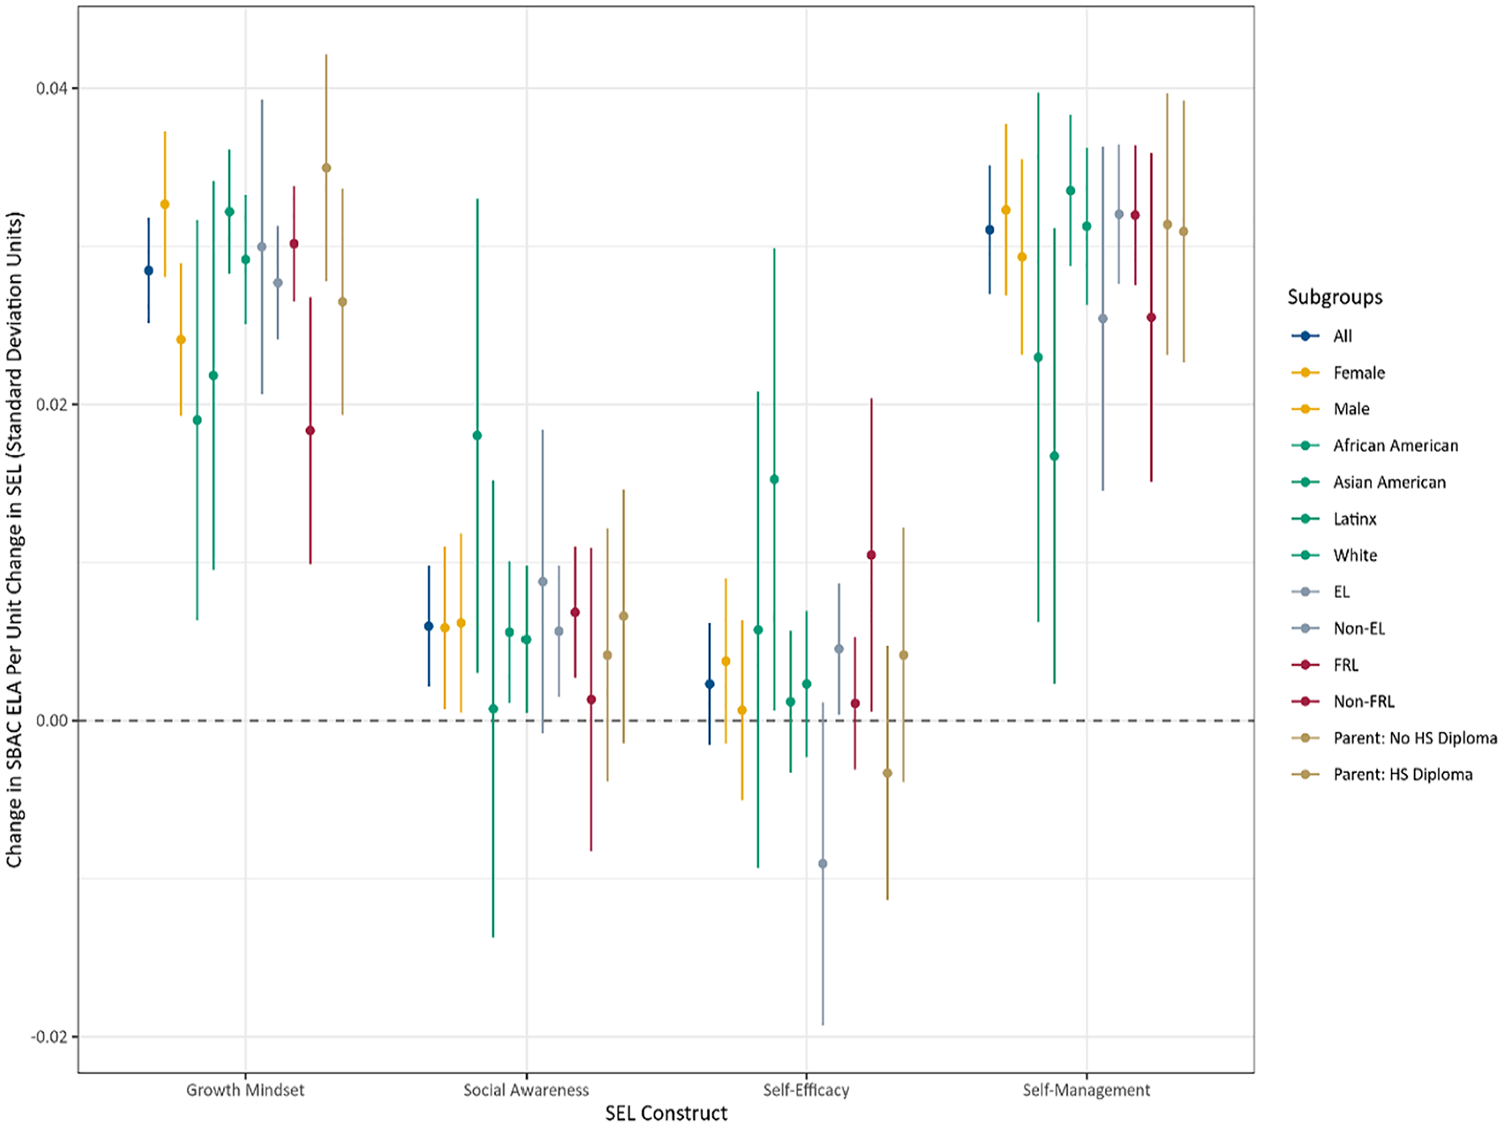
Change in SBAC ELA per unit change in SEL by subgroup and construct. SBAC, Smarter Balanced Assessment Consortium; ELA, English language arts; SEL, social-emotional learning; EL, English learner; FRL, free or reduced-price lunch; HS, high school.
Figure 3 shows the coefficient on SEL under Model 2 when the outcome variable is SBAC math performance. Here, we see overlapping confidence intervals within each construct across all subgroups, but EL students seem to have a lower association between changes in self-management and changes in math achievement than non-EL students, which may be spurious due to the large number of comparisons being conducted. (For details, see Table A2 in the supplemental materials.)
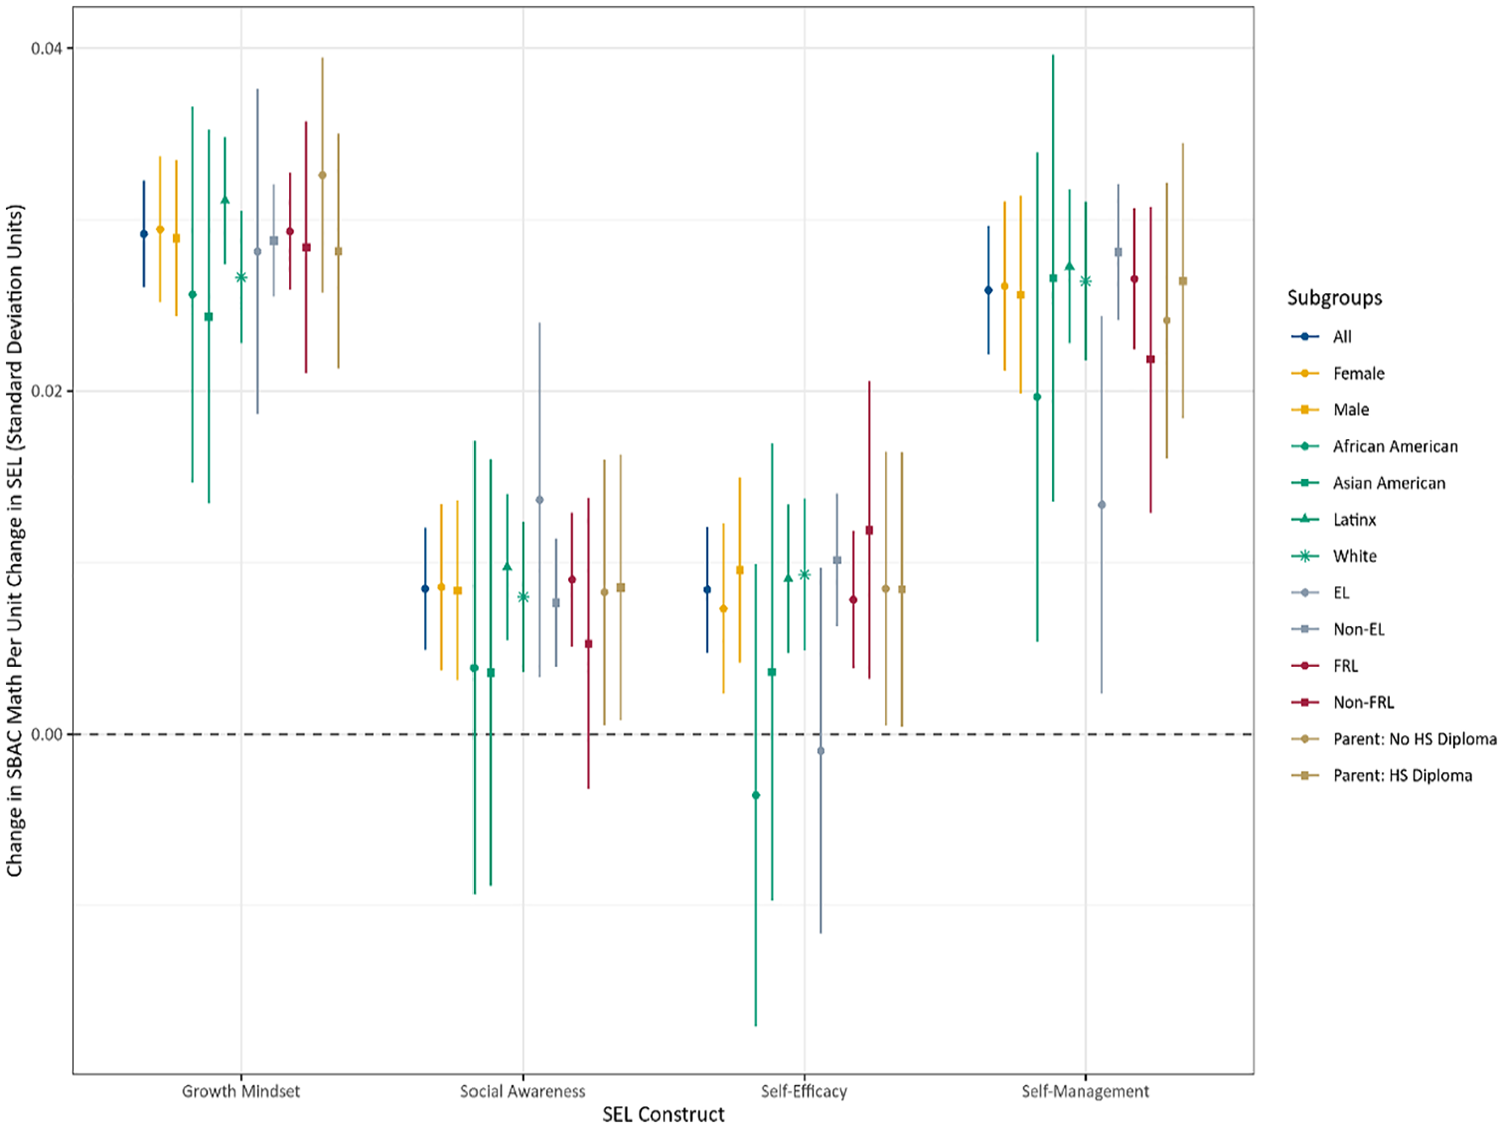
Change in SBAC math per unit change in SEL by subgroup and construct. SBAC, Smarter Balanced Assessment Consortium; SEL, social-emotional learning; EL, English learner; FRL, free or reduced-price lunch; HS, high school.
Figure 4 shows the coefficient on SEL under Model 2 for change in attendance percentage. Although there are generally overlapping confidence intervals across all subgroups and constructs, we see that students classified as English language learners (EL) have a significantly lower association between change in self-efficacy and change in attendance when compared to their non-EL peers. (For details, see Table A3 in the supplemental materials.)

Change in attendance percentage per unit change in SEL by subgroup and construct. SEL, social-emotional learning; SBAC, Smarter Balanced Assessment Consortium; ELA, English language arts; EL, English learner; FRL, free or reduced-price lunch; HS, high school.
Heterogeneity by Previous Achievement and Attendance
Figures 5 and 6 present the estimated change in outcome per unit change in SEL, binned by quintile of the starting (SY15) value of the outcome, using the fifth specification of Model 2. Results from the earlier models suggest that self-management and growth mindset will likely be the dominant SEL constructs. Overall, we observe that self-management and growth mindset improvements predict higher achievement for all students on both outcomes, but their relative magnitude and ordering vary by achievement quintile.

Change in SBAC ELA per unit change in SEL by SBAC ELA quintile. SBAC, Smarter Balanced Assessment Consortium; ELA, English language arts; SEL, social-emotional learning.

Change in SBAC math per unit change in SEL by SBAC math quintile. SBAC, Smarter Balanced Assessment Consortium; SEL, social-emotional learning.
Figure 5 shows the estimated change in SBAC ELA per unit change in SEL, binned by quintile of ELA. We see that growth mindset and self-management dominate across all SBAC quintiles. The coefficient on self-efficacy is low across all quintiles except the highest, where the point estimate for the coefficient on self-efficacy edges out that of growth mindset, although they are not significantly different. Finally, we observe that with the exception of the lowest quintile, the association between change in growth mindset and change SBAC ELA decreases as starting SBAC ELA increases, whereas the relationship between change self-management and change SBAC ELA increases as starting SBAC ELA increases. (For details, see Table A4 in the supplemental materials.)
Figure 6 shows the same analysis for SBAC math. Here, we see a similar pattern for growth mindset and self-management as observed in Figure 5, whereas social awareness and self-efficacy are now more often significantly different from zero. Again, self-efficacy trumps growth mindset for students starting in the highest SBAC math quintile (although these estimates are, again, not significantly different), whereas increases in social awareness distribution are associated with increases in SBAC math across the middle three starting SBAC math quintiles. (For details, see Table A5 in the supplemental materials.)
Figure 7 shows this analysis for attendance percentage. This sheds some light on why we may have observed attenuated coefficients compared with our SBAC models. All of the action, perhaps not surprisingly, is in the lowest quintile of attendance. This is because there is a hard ceiling on attendance rate, and most of the density in change in attendance percentage is near zero (see Figure 1). The association between changes in social awareness and changes in attendance is small across the distribution. From the second quintile onward, the estimated change in attendance per unit change in the other three SEL constructs is on the order of half the magnitude observed in the first quintile and often is not significantly different from zero. (For details, see Table A6 in the supplemental materials.)

Change in attendance percentage per unit change in SEL by mean attendance quintile. SEL = social-emotional learning.
Heterogeneity by Starting SEL
In our final analyses, we assess differences in the relationship between changes in SEL and other outcomes across quintiles of SEL. Figures 8, 9, and 10 show the association between change in SEL and change in SBAC performance and attendance percentage, broken out by quintile of starting (SY15) student SEL. Using starting SEL to create the quintiles ensures that individual students remain in the same quintile across all three observation years. The plots use the individual fixed-effects specification from Model 2, fitting single-construct models within each of the 20 construct-quintiles. We run single-construct models instead of including all SEL constructs in the same model because an individual student can appear in different quintiles for different constructs. For example, within each of the growth mindset quintiles, we run a separate regression of the outcome of interest on growth mindset with individual fixed effects. The figures allow comparisons of the estimated change in the outcome per unit change in SEL across the quintiles. Thus, each figure summarizes 20 independent model fits and includes 95% confidence intervals computed using cluster-robust standard errors clustered at the individual level.

Change in SEL and SBAC ELA by starting SEL quintile. SEL, social-emotional learning; SBAC, Smarter Balanced Assessment Consortium; ELA, English language arts.

Change in SEL and SBAC Math by starting SEL quintile. SEL, social-emotional learning; SBAC, Smarter Balanced Assessment Consortium.

Change in SEL and attendance percentage by starting SEL quintile. SEL = social-emotional learning.
Students in the lowest quintile show a stronger relationship between SEL changes and ELA and math changes, particularly for self-management and social awareness. The relationship decreases the higher the average SEL of a student but remains significantly different from zero, with the exception of self-efficacy for students with high self-efficacy. Changes in self-management and growth mindset appear to be the most predictive of changes in achievement for the majority of students. Differences across groups defined by average SEL are less clear when predicting attendance. In what follows, we describe each outcome in more detail.
Figure 8 shows the relationship between change in SEL and change in SBAC ELA across SEL construct-quintile. With two exceptions, we observe a fairly consistent association between upward mobility in the SEL distribution and upward mobility in the SBAC ELA distribution. First, the association between self-management and SBAC ELA is of the largest magnitude closer to the middle quintile, and second, associations for all constructs except growth mindset are generally smaller in the highest quintile. (For details, see Table A7 in the supplemental materials.)
Figure 9 shows the relationship between change in SEL and change in SBAC math by SEL quintile. We see approximately the same pattern observed for ELA—consistent magnitudes across the SEL quintiles with self-management cresting at the middle quintile but without the general drop-off in coefficient magnitude in the highest SEL quintiles. (For details, see Table A8 in the supplemental materials.)
Figure 10 presents the same analysis for change in attendance. The coefficients on each of the constructs are more tightly grouped across the quintiles. The clear overlap of the confidence intervals shows that the ordering of the magnitudes of the associations is less clear-cut than with the SBAC figures. This overlap is, in part, a function of the overall smaller coefficients for these models. The lowest SEL quintile has all constructs except self-management not significantly different from zero and a slight decline in coefficient magnitude as starting SEL increases. (For details, see Table A9 in the supplemental materials.)
Discussion
In this paper, we use large-scale data from California to examine whether changes in individual students’ reports on social-emotional measures from one school year to the next, relative to other students in the same grade cohort, predict relative changes in theoretically related academic and behavioral outcomes. Although the importance of SEL is well established, the understanding of survey-based measures of social-emotional constructs collected at scale is still emerging. Prior work has shown that self-reported SEL levels predict student achievement levels as well as student achievement gains. However, prior work had not investigated whether changes in student reports of SEL predict changes in other factors. These analyses are useful because districts need appropriately sensitive measures of change in SEL if they are to use the data to assess students’ social-emotional development over time. Moreover, districts will be better served by measures of SEL development that predict achievement gains if they aim to use social-emotional interventions as a means to improve these other outcomes.
Our analyses confirm that changes in a student’s self-reported SEL predict changes in both their ELA and their math achievement. These associations are strongest for growth mindset and self-management. Although the estimated effects are modest, they are educationally meaningful and robust across model specifications. It is important to note from Table 2 that we observe a mean year-to-year increase in SBAC scores that varies between grade levels and by cohort. Additionally, 1 SD in the grade-year SBAC distribution varies from year to year and cohort to cohort. Putting this in context, a student experiencing a 1 SD increase in growth mindset as she moved from fourth to fifth grade in SY16 increased her SBAC score by .028 SD, the equivalent of 2.56 points, a 4.66% higher increase than the mean annual growth in SBAC that year for that cohort (which was 54.87 points). Depending on the year and cohort, we find that a 1 SD change in growth mindset is associated with additional SBAC ELA gains from 4.66% to 11.58% of average annual learning gains and additional SBAC math gains from 7.97% to 25.06% of average annual learning gains. A 1 SD change in self-management is associated with SBAC ELA gains from 5.16% to 15.63% of average annual learning gains and SBAC math gains from 7.15% to 22.47% of average annual learning gains. As expected, gains associated with social awareness and self-efficacy are much smaller, ranging from 0.33% to 3.03% of average annual learning gains for SBAC ELA and 2.2% to 6.91% of average annual learning gains for SBAC math. Taking a typical school year to be 180 days, we find that a 1 SD increase in SEL is associated with attending between .03 and .11 additional days of school, depending on the construct and cohort-year.
In summary, assuming (naively) that learning is uniformly distributed across the 180 days of school, we find that a 1 SD change in growth mindset or self-management is associated with SBAC gains the equivalent of between 8 and 45 days of learning. Additionally, these estimates may underreport the true effects of SEL given that the measures are likely to be measured with some error and therefore suffer from attenuation bias (Loeb et al., 2019; Meyer et al., 2018). Although the sample in which we observe these trends is diverse across multiple demographic characteristics, including socioeconomic status, race, and language status, the relationships between SEL and both achievement and attendance outcomes are stable across groups. Even when grouping students by SEL quintile and performing the analysis within these groups, we estimate positive point estimates that are statistically significant across a wide range of SEL quintiles.
These results complement previous research on the relationship between within-student changes in SEL constructs and academic measures (Duckworth et al., 2010; Soland, 2019), by adding an analysis for growth mindset and social awareness as well as outcomes such as attendance and state tests. In addition, we estimate the relationship between SEL constructs and achievement using all four SEL constructs simultaneously. This multiple-measures model is an important distinction from previous work, because the SEL constructs correlate with one another, which invites the possibility of omitted variable bias in models that do not take all four into account. This study also complements recent evidence showing that the average changes in student SEL scores relative to grade-level peers vary substantially across schools (Jackson et al., 2020; Loeb et al., 2018). Loeb et al. (2018) estimate that variation across schools on SEL outcomes can range from .09 to .24 SD for the four constructs examined in this study. Our results suggest that these changes may be associated with improved learning (especially in the case of self-management and growth mindset) and better attendance (especially in the case of growth mindset and self-efficacy).
Despite the large size of our sample and associated statistical power, this study has limitations. In particular, our approach does not allow us to convincingly estimate causal relationships. Although we go further than prior studies in controlling for other factors that could mask the relationship between SEL changes and changes in other outcomes, we are not able to eliminate all possible biases. Causal inference is challenging due to issues of reverse causality and timing. Although we document a robust relationship between changes in SEL and changes in other outcomes, we do not know the causal pathway.
We also lean heavily on linear models and individual fixed-effects specifications. These specifications have two specific drawbacks. First, they make assumptions about functional forms that may not, in practice, be true. For example, there may be heterogeneity in the magnitude of associations across the SEL bands or by direction of change. Second, fixed-effects estimators only control for time-invariant features of the individual. Time-varying factors, like changes in mental health or cognitive ability and interventions at the school or district level, may confound results. Fortunately, our data were all collected prepandemic and thus are free from pandemic-related exogenous shocks. Additionally, researchers may be interested in heterogeneity in associations at the school, district, or cohort level. These questions are better answered using an HLM specification and present a good line of inquiry for future work with these data.
Our sample is limited, and we advise caution when attempting to generalize these findings. We consider only students in the middle grades, preventing us from generalizing more broadly to elementary and high school students. The CORE districts are demographically unlike many districts across the United States, and the samples we use from these districts are also heavily restricted to only retain complete cases. Because of this, they may not be accurate representations of their own districts, as there may be systematic patterns in the students who were excluded from the final sample. We only have SEL measurements that were conducted once yearly, in the spring of each school year, so further work would be needed to understand the relationship between within-student changes in self-reported SEL on much shorter time scales (such as from fall to spring) and academic outcomes.
Even with these limitations, this study provides additional validity evidence for the use of the CORE SEL measures to monitor students’ improvement on SEL dimensions and may serve as an impetus to expand survey-based data collection on SEL. Our analytic approach of looking at changes of position within grade-year distributions is also a promising foundation for the analysis of data collected from other districts or age groups, as this approach controls for changes in the saliency of the SEL constructs and the individual items used to measure them as students mature. This can allow both researchers and practitioners to observe individual trajectories and better connect them to other outcomes, academic and otherwise.
Supplemental Material
sj-docx-1-ero-10.1177_23328584241233277 – Supplemental material for Are Changes in Reported Social-Emotional Skills Just Noise? The Predictive Power of Longitudinal Differences in Self-Reports
Supplemental material, sj-docx-1-ero-10.1177_23328584241233277 for Are Changes in Reported Social-Emotional Skills Just Noise? The Predictive Power of Longitudinal Differences in Self-Reports by Klint Kanopka, Susana Claro, Susanna Loeb, Martin West and Hans Fricke in AERA Open
Footnotes
Acknowledgements
Hans Fricke worked on this project before joining Amazon.
Declaration of Conflicting Interests
The author(s) declared no potential conflicts of interest with respect to the research, authorship, and/or publication of this article.
Funding
The author(s) received no financial support for the research, authorship, and/or publication of this article.
Supplemental Material
Supplemental material for this article is available online.
Authors
KLINT KANOPKA is an assistant professor of applied statistics in the Steinhardt School of Culture, Education, and Human Development at New York University, 246 Greene St, Floor 3, New York, NY 10003; email:
SUSANA CLARO is an assistant professor in the School of Government at Pontificia Universidad Católica de Chile, Vicuña Mackenna 4860, Edificio Mide UC, 3rd floor, Macul, Santiago, Chile; email:
SUSANNA LOEB is a professor at the Stanford University Graduate School of Education, 482 Galvez Mall, Stanford, CA 94305; email:
MARTIN WEST is academic dean and Henry Lee Shattuck Professor of Education at the Harvard Graduate School of Education, 13 Appian Way, Cambridge, MA 02138; email:
HANS FRICKE is an economist at Amazon, 410 Terry Ave. N Seattle, WA 98109; email:
References
Supplementary Material
Please find the following supplemental material available below.
For Open Access articles published under a Creative Commons License, all supplemental material carries the same license as the article it is associated with.
For non-Open Access articles published, all supplemental material carries a non-exclusive license, and permission requests for re-use of supplemental material or any part of supplemental material shall be sent directly to the copyright owner as specified in the copyright notice associated with the article.