
Abstract
This quantitative, nonexperimental study addressed the gap between research-established benefits and outcomes of social/emotional learning (SEL) implementation as compared to actual instances of implementation. Focusing on SEL and the specificity of use of CASEL SELect programs, the research questions of this study explored differences between implementation and usage, length of implementation, poverty classification, student growth composite (as measured by TVAAS composite), and attendance in elementary schools in Tennessee. I discuss specific implications for school counseling practice and consider the implementation of SEL as an intervention for holistic student success.
The integrative process of social/emotional learning (SEL) has found increased credence in recent years as a mechanism necessary for holistic student learning and success. The American School Counselor Association (ASCA) holds the position that all school counselors “implement strategies and activities to help all students enhance their social/emotional development” (ASCA, 2023). A summary of research indicated that participation in SEL provides positive outcomes into adulthood, and improves student academic achievement, behavior, self-efficacy, and executive functioning (e.g., Durlak et al., 2011; Jones & Kahn, 2017; Lemberger et al., 2018).
This study explored outcomes in analyzing the relationship between SEL implementation and attendance, and SEL implementation and poverty. Outcomes of this study may allow school counselors to anticipate when students could begin to experience academic growth and improved attendance based on SEL implementation practices. This research may also influence administrators and decision makers in understanding the relationship between evidence-based SEL initiatives and improved individual student academic growth and school composite ranking.
Literature Review
The Collaborative for Academic, Social and Emotional Learning
The modern era of SEL emerged as an offshoot of Goleman’s (1995) theorization of emotional intelligence (Elias et al., 2007). Goleman’s work led to both the development of a series of clusters for SEL and the formalization of the Collaborative for Academic, Social and Emotional Learning (CASEL), originally named the Collaborative to Advance Social and Emotional Learning (Elias et al., 2007). Although Dewey (1910) first proposed that the skills of empathy and interpersonal functioning were skills to be taught in the educational setting, in its early years, CASEL focused on establishing a strong research base for support of SEL in schools, collaborating with the Association for Supervision and Curriculum Development (ASCD) to publish the first research-based book on SEL.
While this research-focused work continues, CASEL has also transitioned to providing guidelines and support works for states, schools, and districts implementing SEL initiatives (CASEL, 2007). The current mission of CASEL is to support the implementation of SEL so that by the year 2025, 50% of pre-K–12 schools have social/emotional program implementation (Weissberg, 2019). The aspect of this research that addresses evidence-based programming is supported by CASEL’s work in extensively evaluating SEL programs and initiatives based on a rigorous framework rubric. All programs that meet these strict rubric requirements, known as CASEL SELect Programs, are evidence-based initiatives and are rated in comparison to one another in CASEL’s program guide (2020a).
Social/Emotional Competencies
Goleman worked with his newly co-founded organization, CASEL, to define five clusters of skills definitive of social and emotional learning. Although social/emotional competencies are often considered a wide range of qualitative, subjective, noncognitive abilities, CASEL’s (2020b) five core competencies, based on Goleman’s initial clusters of skills, serve to provide the basis of the CASEL SEL Framework: 1. Self-Awareness: The abilities to understand one’s own emotions, thoughts, and values and how they influence behavior across contexts. 2. Self-Management: The abilities to manage one’s emotions, thoughts, and behaviors effectively in different situations and to achieve goals and aspirations. 3. Social Awareness: The abilities to understand the perspectives of and empathize with others, including those from diverse backgrounds, cultures, and contexts. 4. Relationship Skills: The abilities to establish and maintain healthy and supportive relationships and to effectively navigate settings with diverse individuals and groups. 5. Responsible Decision Making: The abilities to make caring and constructive choices about personal behavior and social interactions across diverse situations. (p. 2)
These five competencies also served as a resource in development of the ASCA Student Standards: Mindsets & Behaviors for Student Success (ASCA, 2021). Thus, a knowledge of CASEL’s core competencies and SEL Framework may be considered a foundational source of understanding for school counselors.
Benefits of Social/Emotional Learning
The holistic benefits of SEL implementation are well documented and research based, although initial research largely focused on the relationship between SEL and test scores and academic achievement (Belfield et al., 2015). Mahoney and Weissberg (2018) relayed gains up to 13 percentile points in achievement. The National Association of State Boards of Education (National Association of State Boards of Education, 2017b) reported that SEL participation increased student test scores 11%–17%.
A 2017 meta-analysis of SEL implementation suggested that the benefits gained from participation can last 18 years beyond completion of an initiative (Durlak & Mahoney, 2019). Mahoney et al. (2018) provided evidence that gains attributed to SEL afford the most benefit when the learning is implemented over time. SEL in early childhood has been shown to have influence into later school years, including in emotional regulation, positive peer interactions, positive adult interactions, and in school and academic behaviors including attendance (Jones & Kahn, 2017). Other longer term associations include the public health element of better mental and physical health, engagement as a citizen, decreased likelihood for criminality, increased likelihood of collegiate participation and graduation, and career success (Jones & Kahn, 2017–2018). Positive reporting of adult marital status has also been linked to individual participation in school-based SEL (Domitrovich et al., 2017).
Absenteeism
In the United States, 7% percent of students are absent from school 30 or more days in a school year (Santibañez & Guarino, 2020). Students in elementary schools are absent an average of 7 days per year, while those in middle and high schools are absent an average of 6–9 days per year; most vulnerable are those in grades 10–12, who miss an average of 10.8 days a year (Santibañez & Guarino, 2020). Students representing minority populations are especially at risk for attendance issues (Knoster, 2016), as are students who are transient, involved in the juvenile justice system, and from high-poverty homes (National Association of State Boards of Education, 2017a). Further, students have more difficulty exiting the cycle of chronic absenteeism the longer it is perpetuated (Knoster, 2016).
Santibañez and Guarino (2020) found that attendance is positively related to the social/emotional skills of growth mindset, social awareness, self-efficacy, and self-management, with the greatest relationships found between attendance and social awareness, and attendance and self-efficacy. Bacon and Kearney (2020) reasoned that SEL practices are a key component of mitigating absenteeism. They observed that social/emotional competency was linked to severity of absenteeism, with some skills positively associated with attendance (i.e., ability to emotionally regulate oneself) and others negatively associated with attendance (i.e., perseverance).
Poverty
Children raised in poverty are at increased risk for behavioral, developmental, mental health, and academic decline. As described below, behavioral outcome data has connected participation in SEL to improvements in behavior and decision making in students of high poverty. Of additional importance is that these behavioral improvements were sustained over time (Calhoun et al., 2020). West et al. (2020) found that poverty-based discrepancies in social/emotional skills that were observed in Grade 4 narrowed significantly by high school, particularly concerning self-management. Conversely, Kendziora and Yoder (2016) reported that the competencies gained through exposure to SEL were even among poverty demographics and school location. O’Conner et al. (2017) relayed that outcomes for students of poverty are dependent on programming variables. The notion of the compensatory hypothesis, that children of poverty have the most to gain from SEL, has been shown in research to be the more demonstrated perspective. English language learners have shown positive outcomes similar to those of students of poverty related to participation in SEL (McClelland et al., 2017).
Educator Perspectives
Most educators (88%) reported some level of occurrence of SEL within their school, but less than half (44%) reported that this learning is program based or school wide (Bridgeland et al., 2013). Atwell and Bridgeland (2019) reported that 83% of principals affirmed SEL and skills to be very important within the school. Their report stated that although 71% of principals reported visioning work and/or planning on SEL, 57% reported actual implementation within their school, with reports of actual implementation lower in middle and high schools, and in small and rural towns. Principals overwhelmingly (87%) relayed that state standards for SEL should be established (Atwell & Bridgeland, 2019). In another study, 100% of principals recognized the value of SEL, and principals reported that implementation of SEL improves the following: student engagement, student feelings of safety, relationships among students, amount of bullying within the school, relationships between staff and students, school climate, movement through K–12 to graduation, academic achievement, and rates of absenteeism (Jones & Cater, 2020). Principals of schools serving low socioeconomic populations reported that school climate, movement through K–12 to graduation, academic achievement, and rates of absenteeism are especially benefited by SEL within their schools (Atwell & Bridgeland, 2019).
Teachers similarly have recognized the benefits of SEL, with 87% reporting that social/emotional competencies or skills are of benefit to individuals in the workplace (Committee for Children, 2016) and 93% reporting that social/emotional skills are important as part of the school experience (Bridgeland et al., 2013). Moreover, 97% of teachers posited that these skills are inherently teachable to even those with little or no social/emotional skill foundation (Committee for Children, 2016). Further research has reported a reciprocal nature in SEL: For those implementing SEL, a negative correlation exists between teachers’ comfort level in implementing SEL and stress related to student behavior and discipline, and a positive correlation exists between teaching efficacy and job satisfaction. Implementation of SEL has been shown to be negatively related to teacher burnout (Collie et al., 2012). Relatedly, Rivers et al. (2012) found that implementation of SEL improved teacher esteem for student perspectives. ASCA’s (2023) position statement on social/emotional development charges the school counselor with collaborating with teachers in the extension and integration of SEL in the classroom.
Demographic Considerations
Socioeconomic, demographic, and familial factors influence all aspects of an individual’s development and functioning. Research has demonstrated that children raised in poverty are more likely to begin school with fewer social/emotional skills; however, a longitudinal study showed that SEL participants made gains in academics regardless of socioeconomic status (McCormick et al., 2015). In regard to SEL implementation, hesitance may often emerge from the belief that overcoming these obstacles via classroom-based practices may not be feasible (Snyder, 2014). Eighty percent of principals of low socioeconomic status schools cited lack of at-home reinforcement of competencies and skills as a major barrier to implementation (Atwell & Bridgeland, 2019). However, the most effective SEL implementation, as an agent of systemic change, furthers learning within the school body by incorporating families and community (Snyder, 2014).
SEL is often conceptualized in a White cultural and English-language framework. Social/emotional programming must account for culture, discrepancies, and power imbalances between those developing and implementing initiatives and those marginalized within society. Equitable delivery of programming may not reflect inequity in political landscapes (and other systems), discipline processes, or discriminatory biases and practices (Gregory & Fergus, 2017). SEL curricula may, in fact, perpetuate inequality through delivery framework. Programs, those delivering services, and those developing curriculum are under increased scrutiny to address the inherent biases within these processes (McCall et al., 2023). Conversely, several states have considered recent legislation limiting SEL due to politicization of the skill sets (Abrams, 2023).
Purpose and Research Questions
The purpose of this study was to examine the relationship between length of time of implementation of SEL and student academic growth, school poverty classification, and school rate of absenteeism. This research further explored the relationship between use of CASEL SELect programming and student academic growth. The first, second, and third research questions addressed aspects of Tennessee Value-Added Assessment System (TVAAS) composite (measuring student academic growth) and implementation: 1. Of Tennessee elementary schools implementing SEL frameworks, is there a significant difference in TVAAS school composite scores between schools having implemented a framework for 4–6 years and 7+ years? 2. Of Tennessee elementary schools implementing SEL frameworks, is there a significant difference in TVAAS school composite scores between schools using CASEL SELect programs and those not using CASEL SELect programs? 3. Is there a significant difference in TVAAS composite between elementary schools in Tennessee that implement an SEL framework and schools that do not implement an SEL framework?
Research Questions 4–7 focused on nonacademic outcomes and implementation: 4. Of Tennessee elementary schools implementing SEL frameworks, is there a significant relationship between poverty classification (Title I funding or not) and type of SEL framework (SELect or non-SELect)? 5. Is there a significant difference in attendance between elementary schools in Tennessee that implement an SEL framework and schools that do not implement an SEL framework? 6. Of Tennessee elementary schools implementing SEL frameworks, is there a significant difference in attendance between schools using CASEL SELect programs and those not using CASEL SELect programs? 7. Among elementary schools in Tennessee, is there a significant difference in attendance between schools that are classified as Title I and those that are not?
The study also noted the frequency of high-poverty Tennessee elementary schools (those receiving Title I funding) using a CASEL SELect program.
Research Method
This descriptive, nonexperimental, quantitative study used several methods of data analysis to examine the seven research questions focused on SEL implementation. In this study, I explored relationships between variables using multiple measures of student and school success. The study investigated statistical significance and effect but does not establish a causal relationship between SEL implementation and outcomes.
Population and Sample
The population of this study is all public schools in Tennessee that include Grades 4 and 5 and implement a SEL program. Of the 1759 public schools in Tennessee at the time of the study, 835 met the definition of elementary schools for the purpose of this study, as determined by publicly accessible data via the state report card website (https://reportcard.tnedu.gov/schools). Using email sent to the school-level lead administrator for each of those 835 schools, I collected information on school-level use of SEL programs and years of implementation. I also gathered publicly available information regarding SEL programming and years of implementation from district, stakeholder, and vendor websites. The study sample (N = 317) was generated from school-level lead administrator responses to the email communication and the information I gathered from websites representing those public elementary schools in Tennessee that serve Grades 4 and 5 and implement an SEL program.
Data Source
Value-added models (VAMs) use student test data to forecast what students would achieve in a single year if taught by an average teacher; when this achievement is compared to prior year data, it represents a growth model (Tennessee Department of Education, 2015). TVAAS is a version of the Education Value-Added Assessment System (EVAAS), the oldest VAM in use in the United States. The TVAAS model utilizes a multivariate response model and uses the intra-year reliability approach, in which reliability is determined based on a student’s predicted scores if the assessment were to be taken multiple times (SAS, 2019). EVAAS, the parent framework of TVAAS, has demonstrated validity similar to other VAMs and reliability slightly better than other VAMs. The system also has demonstrated significantly high correlations (r = .70 to r = .80) among year-to-year teacher value-added estimates and evaluation data (Amrein-Beardsley & Geiger, 2020). This correlation is noteworthy in reference to TVAAS validity and reliability, as TVAAS is considered a measure of teacher effect (Kupermintz, 2003).
The American Statistical Association specified that “value added measures are only as good as the data fed into them” (Tennessee SCORE, 2014, p. 6). Because TVAAS data reflects Tennessee Comprehensive Assessment Program (TCAP) testing data, a major element of the reliability and validity of TVAAS lies in the reliability and validity of TCAP. Since the state’s first use of TCAP in the 1989–1990 school year, TCAP has leaned on norm-referenced, nonrepeating test questions (Sanders & Horn, 1994) and has been assessed to have good content validity and reliability (Bratton et al., 1996). Validity and reliability of test questions are established through a field-testing process involving the Tennessee Department of Education, teachers, and the test developer (Tennessee Department of Education, 2021). Test security regarding breaches is enforced by state law (Tennessee Department of Education, 2019). The reliability and validity of TVAAS scoring is further supported by the dissociation of TVAAS/EVAAS with any testing company. However, TVAAS does require that tests must meet the following requirements in order for TVAAS scoring to be considered reliable and valid: • Must be designed to assess the academic standards. • Must be reliable and valid (usually related to the number of test questions). • Must demonstrate sufficient stretch at the extremes. (SAS EVAAS, 2015, p. 11)
TCAP meets these standards.
Data Collection
Prior gathering or analyzing data, I submitted a proposal of this research to East Tennessee State University’s Institutional Review Board. The board determined that the research met neither the FDA nor the DHHS definition of research involving human subjects. Data were gathered from existing sources, the public TVAAS website (https://www.tn.gov/education/data/tvaas.html), and the public state report card website (https://reportcard.tnedu.gov/schools). School-level categorical information was gathered electronically via email (including a written statement of informed consent) from building-level lead administrators of Tennessee public schools containing Grades 4 and 5; I also gathered categorical information from district, stakeholder, and vendor websites. This school-specific information (use of SEL framework including years of implementation, indication of CASEL SELect program use, and Title 1 status in the 2018–2019 school year) was then matched to the school-specific data included in the TVAAS website and State Report Card website. Due to then-current TVAAS composite scores being those of the 2018–2019 school year, the years of implementation ranges gathered from schools were set to more accurately reflect implementation duration and those composite scores. Ranges of current-year SEL initiative implementation were 1–3 years, 4 years, 5 years, 6 years, and 7+ years, because these ranges aligned with back-dating to TCAP testing resulting in calculations of TVAAS composite scores for the 2018–2019 school year. The year ranges were further condensed to 1–3 years, 4–6 years, and 7+ years to provide a more robust sample size for each grouping. In alignment with these ranges and current TVAAS data, I collected attendance data from the state report card site that represented the 2018–2019 school year. The collection of data from both the TVAAS composite scores and the state report card purposefully preceded the COVID-19 school year of 2019–2020 to allow for consecutive growth years in TVAAS data.
Data Analysis
I used the IBM Statistical Package for Social Sciences (SPSS) program for statistical analysis of data. All data were analyzed at the 0.05 level of significance. A frequency distribution was used to assess the number of high-poverty schools using a CASEL SELect program. I used independent t tests to analyze the data related to Research Questions 1, 2, 3, 5, 6, and 7. In analyzing Research Question 1, I omitted the group corresponding to 1–3 years of implementation due to lack of analogous TVAAS composite score. Years of implementation were grouped into 4–6 years and 7+ years to allow for more appropriate sample size. In analyzing Research Questions 5, 6, and 7, I measured attendance by the percent of students chronically absent and the subsequent percent of students chronically attending, and represented by that number. As in Research Question 1, I did not include schools having implemented SEL for 1–3 years in the analysis of data related to Research Questions 2, 3, 5, and 6, because the related and current measures for those points of research (TVAAS composite and attendance) do not correspond to those school years. A chi square analysis was used to analyze the data related to Research Question 4. Because both program implementation and Title I status were current to the 2020–2021 school year (considered Year 1 of implementation), schools having implemented SEL for 1–3 years were included in statistical analysis of Research Question 4.
Results
Research Question 1
I conducted an independent samples t test to evaluate whether the mean TVAAS composite scores differed between elementary schools in Tennessee that have implemented an SEL framework for 4–6 years and schools that have implemented for 7+ years (RQ1: Of Tennessee elementary schools implementing SEL frameworks, is there a significant difference in TVAAS school composite scores between schools having implemented a framework for 4–6 years and 7+ years?). TVAAS composite score was the test variable and the grouping variable was length of implementation. The test results were not significant, t(85) = .325, p = .746. Therefore, the null hypothesis was retained. The η2 index was less than .01, which indicated a small effect size. Tennessee elementary schools having implemented SEL for 4–6 years (M = 3.10, SD = 1.83) tended to have approximately the same TVAAS composite scores as schools implementing SEL for 7+ years (M = 3.21, SD = 1.48). The 95% confidence interval for the difference of means was −.837 to .602.
Research Question 2
I conducted an independent samples t test to evaluate whether the mean TVAAS composite scores differed between elementary schools in Tennessee that implement a CASEL SELect SEL program and schools that implement a SEL program that is not CASEL SELect. TVAAS composite score was the test variable and the grouping variable was type of program (CASEL SELect or not). RQ2 was: Of Tennessee elementary schools implementing SEL frameworks, is there a significant difference in TVAAS school composite scores between schools using CASEL SELect programs and those not using CASEL SELect programs? The test results were not significant, t(85) = .121, p = .904. Therefore, the null hypothesis was retained. The η2 index was less than .01, which indicated a small effect size. Tennessee elementary schools that use a CASEL SELect SEL program (M = 3.14, SD = 1.7) tended to have approximately the same TVAAS composite scores as schools implementing an SEL program that is not CASEL SELect (M = 3.18, SD = 1.6). The 95% confidence interval for the difference of means was −.841 to .745.
Research Question 3
I conducted an independent samples t test to evaluate whether the mean TVAAS composite scores differed between elementary schools in Tennessee that implement an SEL program and schools that do not implement an SEL program. TVAAS composite score was the test variable and the grouping variable was implementation or no implementation (RQ3: Is there a significant difference in TVAAS composite between elementary schools in Tennessee that implement an SEL framework and schools that do not implement an SEL framework?). The test results were not significant, t(118) = .409, p = .683. Therefore, the null hypothesis was retained. The η2 index was less than .01, which indicated a small effect size. Tennessee elementary schools that implement an SEL program (M = 3.17, SD = 1.61) tended to have approximately the same TVAAS composite scores as schools that do not implement an SEL program (M = 3.30, SD = 1.43). The 95% confidence interval for the difference of means was −.762 to .501.
Research Question 4
I conducted a cross-tabulation analysis to evaluate whether type of SEL framework being implemented depended on poverty classification. The two variables were type of SEL framework (CASEL SELect or not) and poverty classification (Title I or not). RQ4 was: Of Tennessee elementary schools implementing SEL frameworks, is there a significant relationship between poverty classification (Title I funding or not) and type of SEL framework (SELect or non-SELect)? Type of SEL framework and poverty status were found to be significantly related, Pearson’s χ2 (1, N = 136) = 14.47, p < .001, Cramer’s V = .326. Therefore, the null hypothesis was rejected. In general, type of SEL framework used was significantly different depending on poverty classification. The observed count of high-poverty schools using a CASEL SELect program in this analysis was 36 (expected count = 26.2). In summary, Tennessee elementary schools that are classified as Title I (high poverty) are significantly more likely to use a CASEL SELect program than a program that is not CASEL SELect. Figure 1 displays counts of type of SEL framework compared to poverty classification. Type of framework implementation chartered with poverty classification.
Research Question 5
I conducted an independent samples t test to evaluate whether the mean level of attendance differs between elementary schools in Tennessee that implement an SEL framework and schools that do not implement an SEL framework (RQ5: Is there a significant difference in attendance between elementary schools in Tennessee that implement an SEL framework and schools that do not implement an SEL framework?). Attendance was the test variable and the grouping variable was implementation or no implementation. The test results were not significant, t(118) = .134, p = .894. Therefore, the null hypothesis was retained. The η2 index was less than .01, which indicated a small effect size. Tennessee elementary schools not implementing SEL (M = 91.07, SD = 4.47) tended to have approximately the same attendance as schools implementing SEL (M = 90.93, SD = 5.43). The 95% confidence interval for the difference of means was −2.24 to 1.96. Figure 2 shows the distributions for the two groups, noting three outliers in the group implementing SEL. Attendance for implementing and non-implementing schools.
After removing the outliers, I re-analyzed the data, conducting an additional independent samples t test to evaluate whether the mean level of attendance differed between elementary schools in Tennessee that implement an SEL framework and schools that do not implement an SEL framework, excluding the three outliers. Attendance was again the test variable and the grouping variable was again implementation or no implementation. The test results remained not significant, t(115) = .476, p = .635. Therefore, the null hypothesis was again retained. The η2 index was less than .01, which indicated a small effect size. In this analysis excluding the three outliers, Tennessee elementary schools not implementing SEL (M = 91.07, SD = 4.47) tended to have about the same attendance as schools implementing SEL (M = 91.51, SD = 4.52). The 95% confidence interval for the difference of means was −1.39 to 2.27. Figure 3 shows the distributions for the two groups, excluding the three outliers in the group implementing SEL. Attendance for implementing and non-implementing schools, excluding outliers.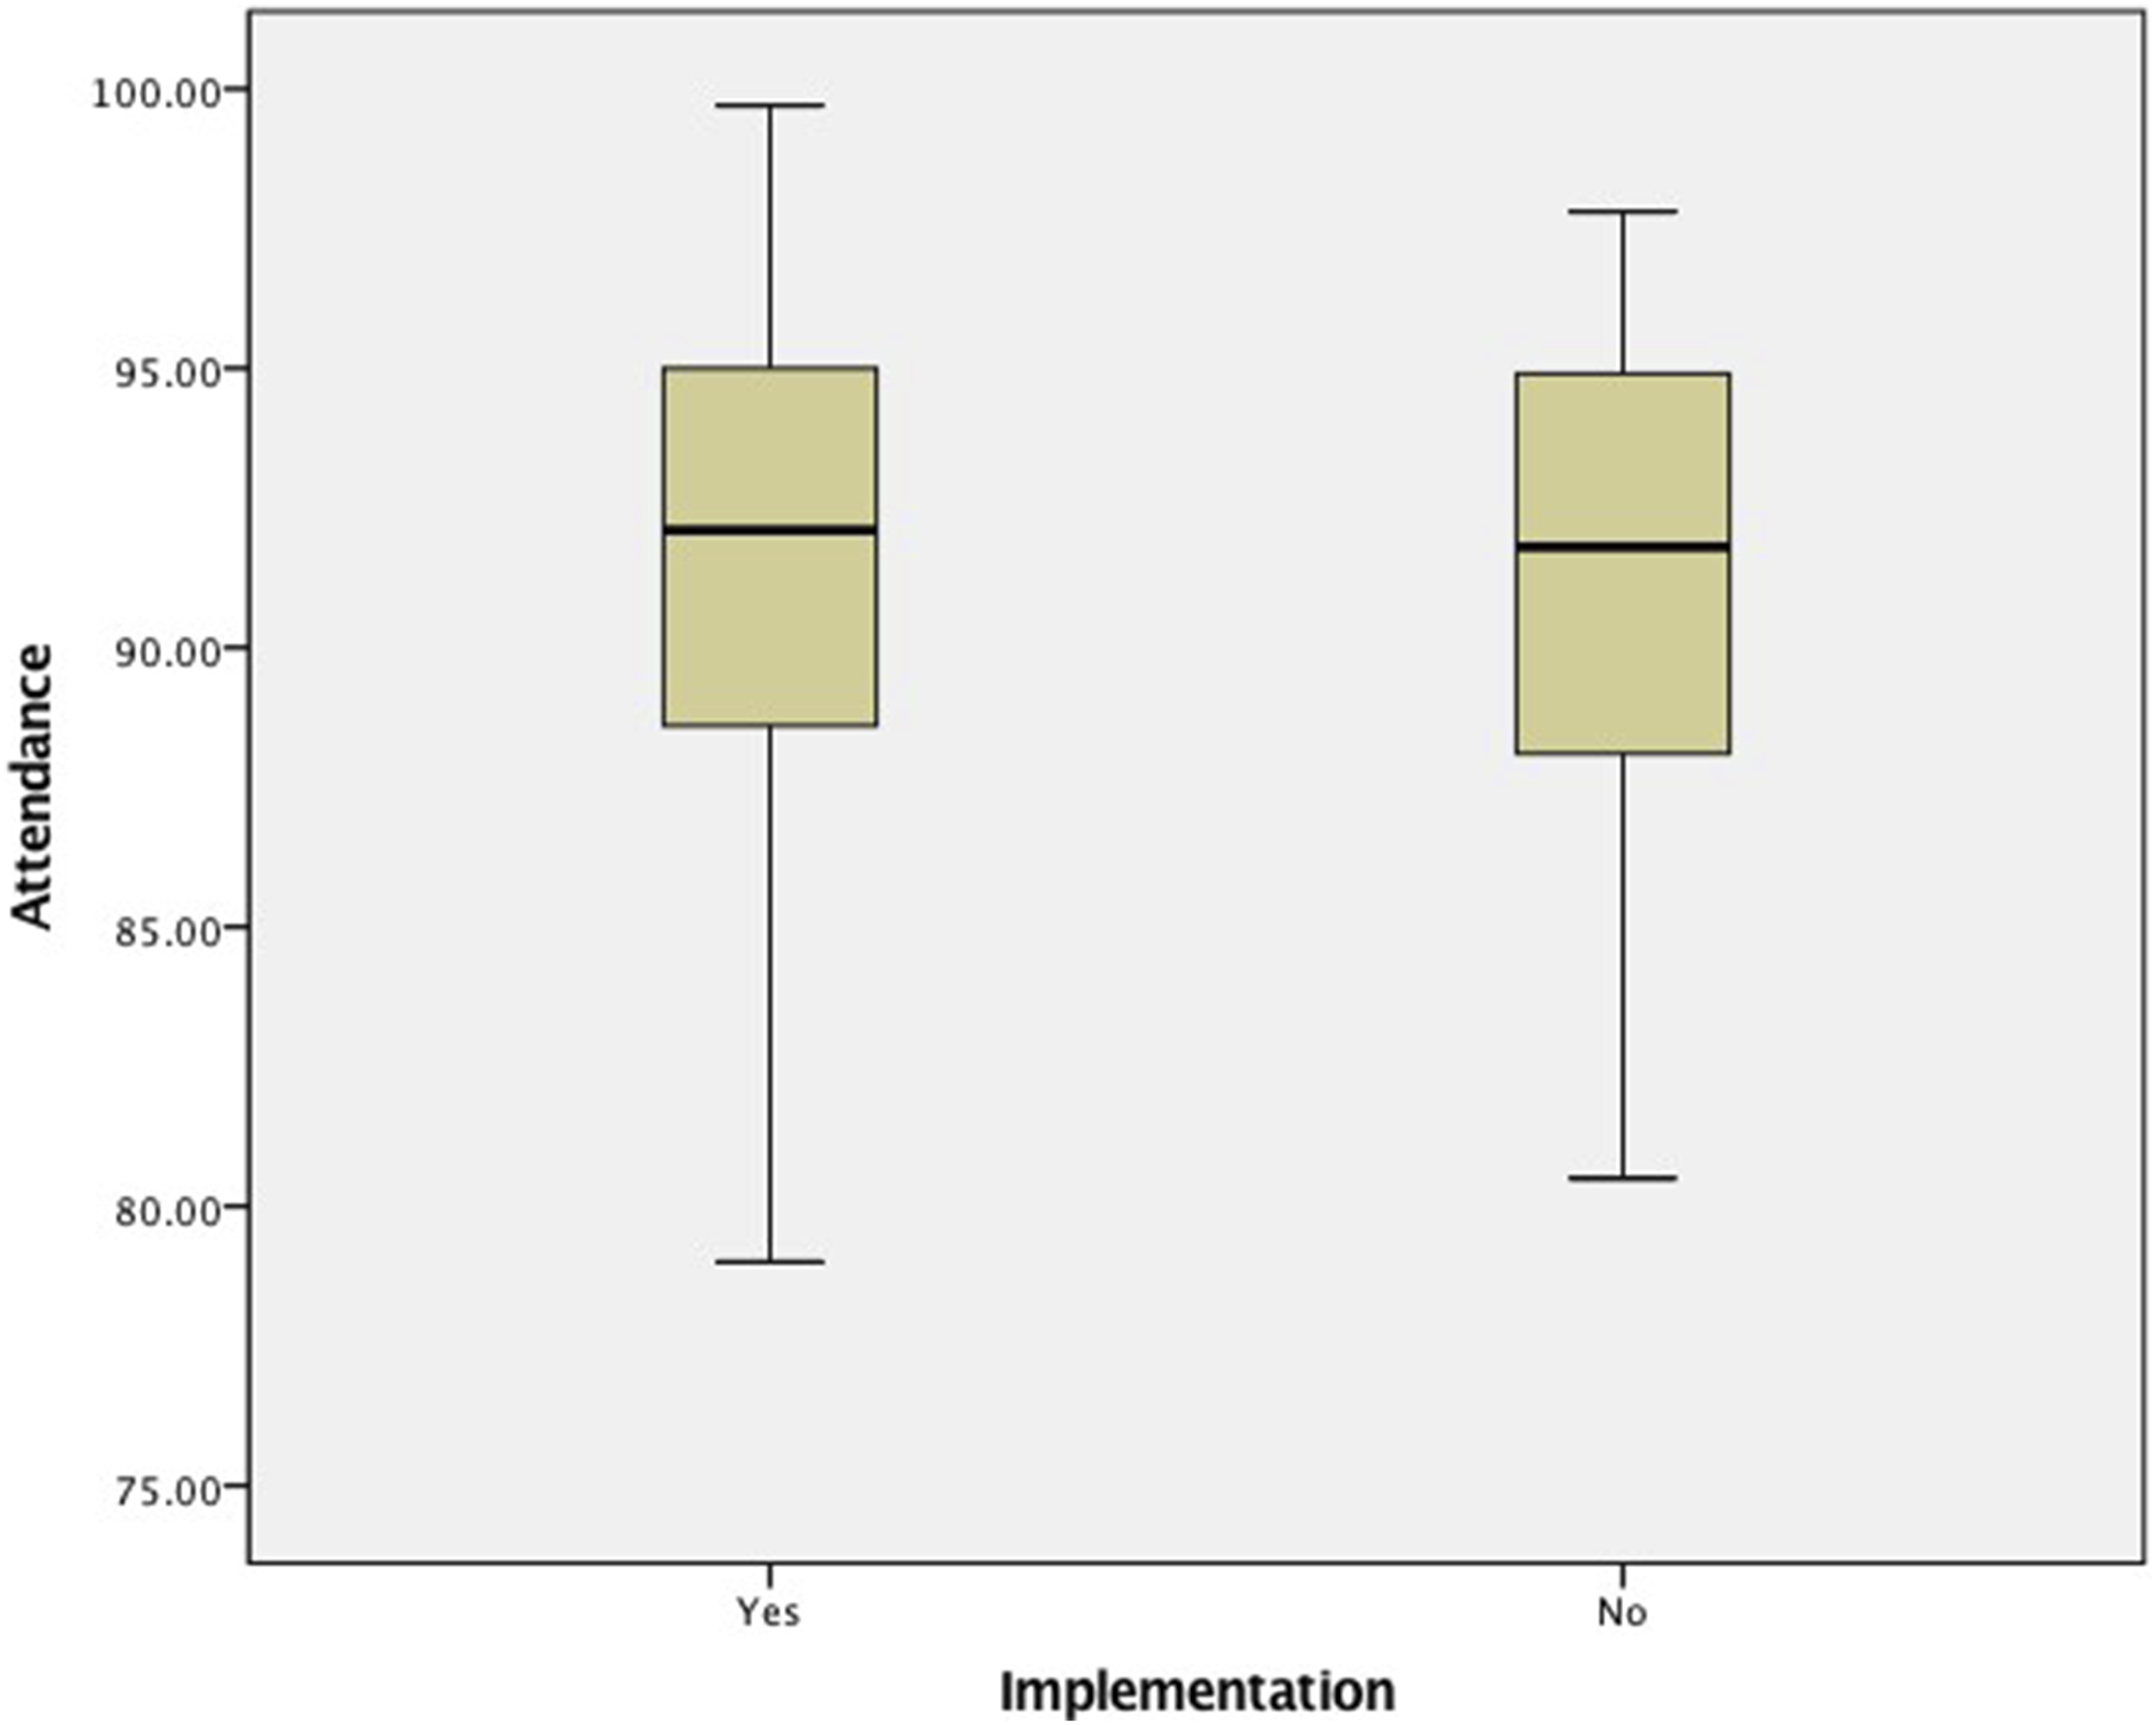
Research Question 6
I conducted an independent samples t test to evaluate whether the mean attendance differed between elementary schools in Tennessee that implement a CASEL SELect SEL program and schools that implement a SEL program that is not CASEL SELect (RQ6: Of Tennessee elementary schools implementing SEL frameworks, is there a significant difference in attendance between schools using CASEL SELect programs and those not using CASEL SELect programs?). Attendance score was the test variable and the grouping variable was CASEL SELect or not. The test results were significant, t(85) = 3.417, p = .002. Therefore, the null hypothesis was rejected. The η2 index was .11, which indicated a medium to large effect size. Tennessee elementary schools that do not implement a CASEL SELect SEL program (M = 91.95, SD = 4.04) tended to have significantly higher attendance than schools that do implement a CASEL SELect program (M = 87.91, SD = 7.65). The 95% confidence interval for the difference of means was −.6.57 to −1.50.
Research Question 7
I conducted an independent samples t test to evaluate whether the mean attendance differed between elementary schools in Tennessee that are classified as Title I and those that are not (RQ7: Among elementary schools in Tennessee, is there a significant difference in attendance between schools that are classified as Title I and those that are not?). Attendance score was the test variable and the grouping variable was Title I or not. The test results were significant, t(117) = 6.33, p < .001. Therefore, the null hypothesis was rejected. The η2 index was .36, which indicated a large effect size. Tennessee elementary schools that are not classified as Title I (M = 95.1, SD = 2.92) tended to have significantly higher attendance than schools that are classified as Title I (M = 89.31, SD = 4.92). The 95% confidence interval for the difference of means was −.7.59 to −3.98. I conducted a second independent t test with removal of outliers, with similar results and significance.
Discussion
Limitations
A limitation of this study, and of any study utilizing state testing data, are the issues the State of Tennessee faced in the late 2010s in regard to standardized testing. This time frame included vendor scoring issues impacting some grade levels in the 2018–2019 testing year and no standardized testing taking place in the 2019–2020 school year due to the COVID-19 pandemic resulting in statewide school closures. Although the schools assessed in this study represent a state-wide sample, this study was limited to public schools in Tennessee, all of which are ultimately governed by the same legislative and department mandates. The study did not explore non-public or non-Tennessee schools, because TVAAS data represents public Tennessee schools. In this study, TVAAS composite was limited to a composite score based on fourth and fifth grades, due to second-grade testing being optional in Tennessee and thus not allowing for equitable assessment of third-grade growth scoring. TVAAS and other value-added models face some scrutiny for their statistical lens. This limitation disallows a systemic focus because it is unable to account for various student factors that may impact performance (Paige et al., 2019). TVAAS is limited in focus to just a few academic outcomes (Prior et al., 2021).
Due to my professional training and history as a licensed school counselor and clinical therapist, and my former professional experience with a CASEL SELect program, I may have inherent bias toward the practice of evidence-based SEL as being of benefit. To mitigate this potential, the electronic communication I designed focused on collection of school-level demographic information was piloted by a variety of professional educators. Although the electronic communication was sent to administrators representing all public elementary schools in Tennessee, as defined by this study, responses may not be equally dispersed among region, setting, or other demographic definers. Thus, outcomes and conclusions may not be representative of individual schools or settings. Similar bias also may be present in those responding on behalf of their school. Incomplete submissions were not included in data analysis. The communication was sent electronically via email, and a limitation of the study includes accessibility and receipt of the electronic correspondence. Further limitations of technology use include varying degrees of public availability of website information regarding schools’ SEL initiatives and time frames of use.
Duration of Implementation
Research Question 1 addressed duration of implementation and TVAAS composite. Although the analysis of data did not result in a significant difference, both groups (4–6 years and 7+ years) implemented an SEL framework and had mean TVAAS composites indicating maintenance rather than learning loss. The 7+ years group had a more even distribution of composite scores than the 4–6 years group. The 7+ years group also had higher numbers of 3+ composite scores as compared to the 4–6 years implementation group. When considering back-dating of these implementation year groups to coincide with the then-current TVAAS data (2018–2019 school year), a relevant consideration is that the 4–6 years group TVAAS composite scores are reflective of their first years of SEL implementation. Because the 4–6 years group had a considerably higher number of TVAAS composite 5 scores, it is reasonable to suggest that SEL implementation may spur academic growth in the early years of implementation. Further, because the 7+ years group had lower occurrences of TVAAS composite 1 and 2 scores, it is reasonable to suggest that longer term implementation may have an impact on mitigating learning losses.
The idea of settling in, as suggested by the leveling of scores and lower occurrences of TVAAS composite 5 scores in the 7+ years groups as compared to the 4–6 years group, coincides with Fullan’s (2001) idea of the implementation dip, a common phenomenon associated with change initiatives. Within the implementation dip, excitement and energy once directed toward change (e.g., the implementation of a new SEL framework) wanes as implementers settle into maintenance and routine. Conversely, the 4–6 years group demonstrated a larger number of TVAAS composite scores of 1 and 2. This could be a sign of implementation resistance, a notion that should be anticipated with any new initiative (Shirley & Noble, 2016). With these concepts in mind, educators need to be aware of the potential for stagnancy in later years of framework implementation and the potential for resistance to change in earlier years. Each educator is responsible for ensuring purposeful action to promote programming, renew commitment, and deliver SEL with fidelity. Educators may benefit from assurance of the common occurrences of both resistance and the implementation dip so that these matters can be more easily recognized and proactively addressed.
Implementation Practices and TVAAS Composite
Research Question 2 provided specificity of implementation; the analysis reviewed type of programming (CASEL SELect or not) in relation to TVAAS composite, while Research Question 3 reviewed SEL implementation (or not) and TVAAS composite. I did not find a significant difference between type of programming and TVAAS composite, nor between implementation (or not) and TVAAS composite. The percentages of each TVAAS composite score for both types of programming (CASEL SELect or not) are similar. This suggests that the implementation of programming, rather than the type of programming, may be of basic importance.
Analysis of Research Questions 1 and 2 demonstrated a higher percentage of high and low TVAAS composite scores for those schools implementing CASEL SELect frameworks and those schools implementing any SEL framework, as compared to their opposing group. I found that nearly one third of schools not implementing SEL demonstrated performance maintenance (TVAAS composite 3). Although this is certainly desirable compared to learning loss, the more desirable outcome of significant growth is evidenced by one third of the schools implementing SEL having a TVAAS composite of 5. This finding prompts exploration of the idea of high risk/high reward thinking: Are schools that have demonstrated learning loss (TVAAS composite 1 or 2) implementing SEL as a risk, striving for higher reward? I further discuss potential reasoning for this in connection to Research Question 4, examining the poverty classification of schools and their framework usage.
Implementation Practices and Implications for Practice
Findings of this study indicated that high-poverty schools are significantly more likely to implement a CASEL SELect program. The findings of Research Question 6 further demonstrated that schools using CASEL SELect programs likely have lower attendance than schools not using CASEL SELect programs. This yields the potential conclusion that high-poverty schools have lower attendance and use CASEL SELect programs, more so than non-Title I schools. The findings of Research Question 7, added later in the study to substantiate this conclusion, supported this conclusion and demonstrated that schools with high poverty were more likely to have lower attendance. Research also substantiates this outcome: National Association of State Boards of Education (2017a) reported that students from high-poverty homes are more likely to have issues with absenteeism. It stands to reason, then, that the most at-risk schools implemented SEL and were more likely to use a CASEL SELect program, with attendance being more connected to poverty classification than to SEL implementation. Although the findings of Research Question 5 were not significant, removing outliers demonstrated a slightly higher mean in attendance for implementers as compared to nonimplementers. As Bacon and Kearney (2020) detailed, attendance gains are related to the social/emotional competencies developed through implementation of SEL frameworks.
Of utmost importance for the school counselor’s practice is retaining the idea that all students, regardless of economic status, have potential for personal and academic growth. Many high-poverty schools in Tennessee are using CASEL SELect programs as a means of supporting student growth, and likely as a mitigating resource for absenteeism. However, the implementation of SEL does not appear to have negative outcomes directly related to student growth or attendance; rather, those outcomes tend to be more associated with poverty classification. Thus, implementation of SEL may very well serve to support improved outcomes for students and the school.
Summary and Future of the Work
The purpose of this study was to explore possible linkage between the use and duration of implementation of SEL frameworks and multiple measures of student outcomes. The research questions of this study guided explorations of relationships between SEL implementation; its duration and type; and student academic growth, attendance measure, and school poverty classification. Although not all analyses resulted in significant differences, the discussion of themes generated by the research questions provides context for understanding the results, especially in connection to one another. Further, the implications for practice yield a framework for conceptualizing the results as they may be applied to the practice of education. Because nonexperimental quantitative research does not establish causation, one cannot assume from the findings that the implementation of SEL or lack thereof causes a specific academic composite score or attendance percentage. Likewise, one cannot assume that the type of SEL program implemented causes these outcomes. It is important for school counselors and administrators to consider the impact of the outcomes of this research on the implementation practices of SEL within their school.
Outcomes of this study may allow school counselors and administrators to forecast when students could begin to experience academic growth and attendance gains based on the school’s and/or school counseling program’s SEL implementation processes. Those educators also may be able to forecast when that growth may plateau, and how Tier 1, 2, and 3 interventions (attendance and academic) may be adjusted in anticipation of that plateau. Of importance is the study’s potential influence in conceptualizing the relationship between evidence-based SEL initiatives and multiple measures of school and student success. School counselors, in particular, may benefit from using the results of this study in advocating for selection of a CASEL SELect SEL program.
Future study of both qualitative and quantitative design may serve to deepen understanding of the impact of SEL on student outcomes and school health. Specific research could include educator implementation practices, the impact and influence of COVID-19, and schools that have discontinued SEL implementation. Kendziora and Yoder (2016), through their work with CASEL and the American Institutes for Research, recommended that all districts should study prioritizing SEL as a district policy and best practice. Systemic implementation of SEL requires the alignment of practice, policy, and standards. In an educational era in which equitable access is at the forefront of thought, availability of SEL is seen as an avenue to an equitable learning environment (Mahoney et al., 2020).
Footnotes
Declaration of Conflicting Interests
The author(s) declared no potential conflicts of interest with respect to the research, authorship, and/or publication of this article.
Funding
The author(s) received no financial support for the research, authorship, and/or publication of this article.