
Abstract
Interdisciplinarity has the potential to lead to more innovation and advances in knowledge than are possible from a single discipline. Yet, little is known about interdisciplinary collaborations and the perceptions of those involved. This quantitative study investigated the perceptions of U.S. faculty, staff, postdocs, and graduate students involved in education and science/engineering collaborations. Exploratory factor analysis was conducted for two modified scales, Collaboration Perceptions (CP; n = 117; 17 items; α = .923) and Interdisciplinarity Perceptions (IP; n = 119; 11 items; α = .852). Participants’ perceptions of collaboration and interdisciplinarity were strongly positive and did not significantly differ based on demographic factors (e.g., gender, discipline, role). Perceptions were influenced by collectivist orientation; the high collectivism group had significantly more positive perceptions of collaboration and interdisciplinarity, and collectivist orientation was positively and significantly correlated with CP and IP scores. Implications and recommendations for interdisciplinary collaborations will be discussed.
Keywords
Introduction
Some of the most complex challenges in society lie at the intersection of multiple disciplines (Why Interdisciplinary Research Matters, 2015). Addressing these issues requires experts across academic disciplines to work together. Interdisciplinary collaborations form when multiple and sometimes disparate disciplines are brought together by shared goals or tasks (Amey & Brown, 2004), ideally to spark ideas and generate novel approaches, such as a science or engineering faculty member who collaborates with an education faculty member on a grant-funded project.
Interdisciplinarity between the natural and social sciences has reportedly increased since the 1980s (Van Noorden, 2015) and is encouraged by various stakeholders (e.g., Lyall et al., 2013; National Academy of Sciences, National Academy of Engineering, and Institute of Medicine, 2005; NSF, 2017). As an exemplary case, the National Science Foundation (NSF) in the United States had an annual budget of $8.5 billion in 2021, which funded nearly one-quarter of all U.S. federally funded research conducted at institutions of higher education (NSF, n.d.). Numerous NSF grant programs encourage “transformative” interdisciplinary research (NSF, 2017, p. 29). A 2015 survey revealed that NSF reviewers perceived proposals for interdisciplinary work to have greater potential for broader impacts than proposals submitted from a single discipline (NSF, 2016).
Universities have made moves to increase collaboration and interdisciplinarity (Holley, 2009). Some universities have established cluster hire programs to bring together faculty from different disciplines, clustered around a common research thematic area, to promote interdisciplinary collaborations that better align faculty members’ research with “federal funding priorities” (Bloom et al., 2020, p. 755). However, a recent survey of 199 cluster faculty members across twenty different universities reported that “cluster hire groups are often loosely organized, and members do not typically spend much time collaborating with others in their group” (p. 755). The “paradox of interdisciplinarity” asserts that the persistence of disciplinary, siloed practices and systems historically have guided research and publications and act as a major barrier to realizing the full potential of interdisciplinarity (Bromham et al., 2016; Weingart, 2018). As Weingart wrote, “Interdisciplinarity . . . is proclaimed, demanded, hailed, and written into funding programs, but at the same time specialization in science goes on unhampered” (p. 26).
Interdisciplinary Collaborations Between STEM and Education
There have been specific calls for university STEM and education departments to collaborate to secure funding and improve STEM and educational programs (Bouwma-Gearhart & Adumat, 2011; Eckman et al., 2016). It has been argued that “the current reality for many postsecondary STEM faculty is that if they wish to compete for federal funding in the current economic climate, they need to demonstrate involvement in K-20 STEM education improvement endeavors” (Bouwma-Gearhart & Adumat, 2011, p. 208). Eckman et al. (2016) found that a collaboration between STEM and education departments enhanced the ability of STEM teacher preparation programs to promote teachers’ content knowledge and pedagogical skills.
Research on STEM and education interdisciplinary collaborations is scant overall (McCance, 2021). Large-scale bibliometric analyses and meta-analyses have documented trends in interdisciplinary scholarship (e.g., grant proposals, authorship, and citations on journal articles) between science/engineering and education/social science disciplines (e.g., Mutz et al., 2015; Porter & Rafols, 2009; Van Noorden, 2015). By examining article citations between science and other disciplines (e.g., biomedical sciences, computer sciences, engineering sciences, and social/psychological sciences), Porter and Rafols (2009) found that articles tended to reference work from closely related fields and found only modest increases in interdisciplinarity between 1975 and 2005. In an analysis of 35 million journal articles, Van Noorden (2015) documented upward trends in the interdisciplinarity of natural and social sciences from 1980 to 2010, while references to work in the same discipline slightly declined.
A qualitative study involving STEM and STEM education faculty, chairs, deans, and other leaders of STEM reform projects at five large U.S. public research universities investigated factors that promote successful higher education collaborations between STEM and education (Bouwma-Gearhart et al., 2014). Key characteristics included recognizing the value of collaborators’ disciplines and expertise, understanding that everyone is on a unique journey in engaging in interdisciplinary work, and incorporating a “broker” to bridge gaps between disciplines. Tinnell et al. (2019) used a grounded theory approach to investigate four ongoing faculty learning communities (FLCs) between science teacher education and engineering faculty and graduate students. Successful interdisciplinary collaborations involved each group’s interdependence, expectations being met, supportive leadership team, and enjoyment of the collaborative experience. A recent study of an interdisciplinary team of science education and science/engineering faculty and graduate students reported the importance of having shared goals and delegating work based on disciplinary expertise and knowledge (McCance et al., 2023).
Study Purpose
This quantitative study aimed to validate two instruments that measure perceptions of collaboration and interdisciplinarity and analyze participants’ responses in order to understand the perceptions of scientists, engineers, and educators who are engaged in interdisciplinary collaborations at universities across the United States.
Frameworks
Continuum of Disciplinarity and Interdisciplinarity
Davies and Devlin (2010) examined interdisciplinarity in higher education and developed a continuum to describe and distinguish varying degrees of disciplinarity and interdisciplinarity (Figure 1).

Continuum of disciplinarity and interdisciplinarity (adapted from Davies & Devlin, 2010).
At the least integrated level, disciplinarity describes disciplines that are discrete, autonomous, and do not cross boundaries to engage with members from other disciplines. Multiple disciplines may work on a shared project but lack coordination, relying on their own knowledge and skills to accomplish their work (multidisciplinary) or perform a task related to a different discipline without coordinating with a person from that discipline (cross-disciplinary) (Davies & Devlin, 2010).
Interdisciplinarity requires the integration of multiple disciplines’ knowledge and skills and has different levels of integration (Davies & Devlin, 2010). For example, a scientist and science educator might meet to discuss a potential grant proposal and solicit different perspectives but not learn anything new about the other discipline or integrate other perspectives (relational interdisciplinarity). Greater coordination and integration of disciplines can result in a change of perspectives; a scientist may realize that they must modify their development of student-centered activities once they better understand how students learn and which state standards are connected (modification interdisciplinarity). Transdisciplinarity is a theoretical upper limit of interdisciplinarity and differs from other types of interdisciplinarity because it results when disciplinary boundaries dissolve to create, for instance, a new area of study (Davies & Devlin, 2010). Transdisciplinarity moves beyond merely integrating knowledge and skills from disciplines; it leverages disciplinary differences to develop new products or frameworks at the intersection of disciplines, greater than the sum of their parts. An example of transdisciplinarity might be that a group of paper scientists and science educators create a new field that specifically focuses on paper science educational research. An interdisciplinary approach to curriculum development may involve science and science education collaborators who frequently meet to discuss ideas and work on shared products but sometimes work independently to create separate course modules. Using a transdisciplinary approach, the collaborators may discuss and work together on every aspect of the course, with no independent work, to create a new, fully integrated product.
Collectivist and Individualist Orientations
Research on science/engineering and education collaborations has lacked explicit links to theory (McCance, 2021). The collectivist-individualist orientations framework may provide insight into the workings of interdisciplinary teams, as these orientations are known to impact team performance (Wagner III et al., 2012) and motivation in the workplace (Wagner & Moch, 1986). Collectivism and individualism can be group-level variables (e.g., an individualist-oriented country or team) as well as individual-level variables (Gundlach et al., 2006). In the current study, the constructs are treated as individual-level variables. Individualism is guided by satisfying personal interests and goals and seeing oneself as independent and autonomous from a group (Singelis et al., 1995). Individualists may exert more effort on tasks that are solitary in nature (Wagner et al., 2012). Collectivists value being part of a team and prioritize group interests, “even if these pursuits sometimes conflict with members’ immediate personal desires” (Wagner & Moch, 1986, p. 282). Individualistic team members are less likely to cooperate when working in groups, may be resistant to teamwork, and can negatively impact team performance (Gundlach et al., 2006). In contrast, collectivism is considered integral to team performance.
Research Questions
This study addresses the following research questions:
1. To what extent are the Collaboration Perceptions (CP) and Interdisciplinarity Perceptions (IP) scales valid and reliable instruments?
2. What are participants’ perceptions of collaboration and interdisciplinarity, and what factors influence their perceptions?
3. What role, if any, does a collectivist orientation play in individuals’ perceptions of collaboration and interdisciplinarity?
Methods
Research Design
This quantitative study used a cross-sectional survey design (Lavrakas, 2008) and administered a survey at one point in time. Two scales were developed and validated (Hinkin, 1998; see Appendix A for the full survey). Then, responses were analyzed to understand how a national sample of scientists, engineers, and science educators (including faculty, graduate students, postdocs, and staff) perceived their interdisciplinary projects. This study was approved by the university’s Institutional Review Board.
Instrument Development
A three-step process was followed to validate the CP and the IP scales separately: (1) item generation, (2) instrument administration, and (3) item reduction (Hinkin, 1998).
Step 1: Item Generation
CP and IP items were modified from existing, validated instruments (Mâsse et al., 2008) that used factor analysis to validate scales that measured perceptions of collaboration and transdisciplinary integration with a sample of 216 researchers, students, and other professional staff at seven health research centers in the United States. The size of each center ranged from 17 to 49 individuals. The original instrument included an 18-item Collaboration scale with three subscales: (1) satisfaction with collaboration, (2) impact of collaboration, and (3) trust and respect. In the same study, a one-factor, 15-item Transdisciplinary Integration scale was also validated. The scales were determined to be effective at measuring participants’ perceptions of collaboration and transdisciplinary integration and found statistically significant differences between subgroups.
Once the decision was made to use the interdisciplinarity framework (Davies & Devlin, 2010), a scale was needed to measure these constructs. The items were modified to better fit the academic and interdisciplinary focus of the current study. Examples of the original and modified items are listed in Table 1. For example, “transdisciplinary” was replaced with “interdisciplinary” to match this study’s focus (e.g., “My transdisciplinary collaborations are sustainable over the long haul” was modified to “My interdisciplinary collaborations are sustainable over the long haul”). Items also were modified to reflect a research or project team rather than a research center (e.g., “Involvement of collaborators from outside the center” was modified to “Involvement of collaborators from outside the project/research team”). Due to these essential changes to the nature and focus of the items, targeting a different population than the one recruited in the original validation (Mâsse et al., 2008), and the potential for these modifications to alter the instruments’ factor structures, exploratory factor analysis (EFA) was an appropriate method to validate the modified items rather than confirmatory factor analysis (Orçan, 2018). To conduct EFA, principal axis factoring (PAF) was performed (UCLA Institute for Digital Research and Education, n.d.) with promax rotation (Yong & Pearce, 2013). The EFA procedures are explained in further detail in the following sections.
Sample Survey Items That Were Modified From Mâsse et al. (2008)
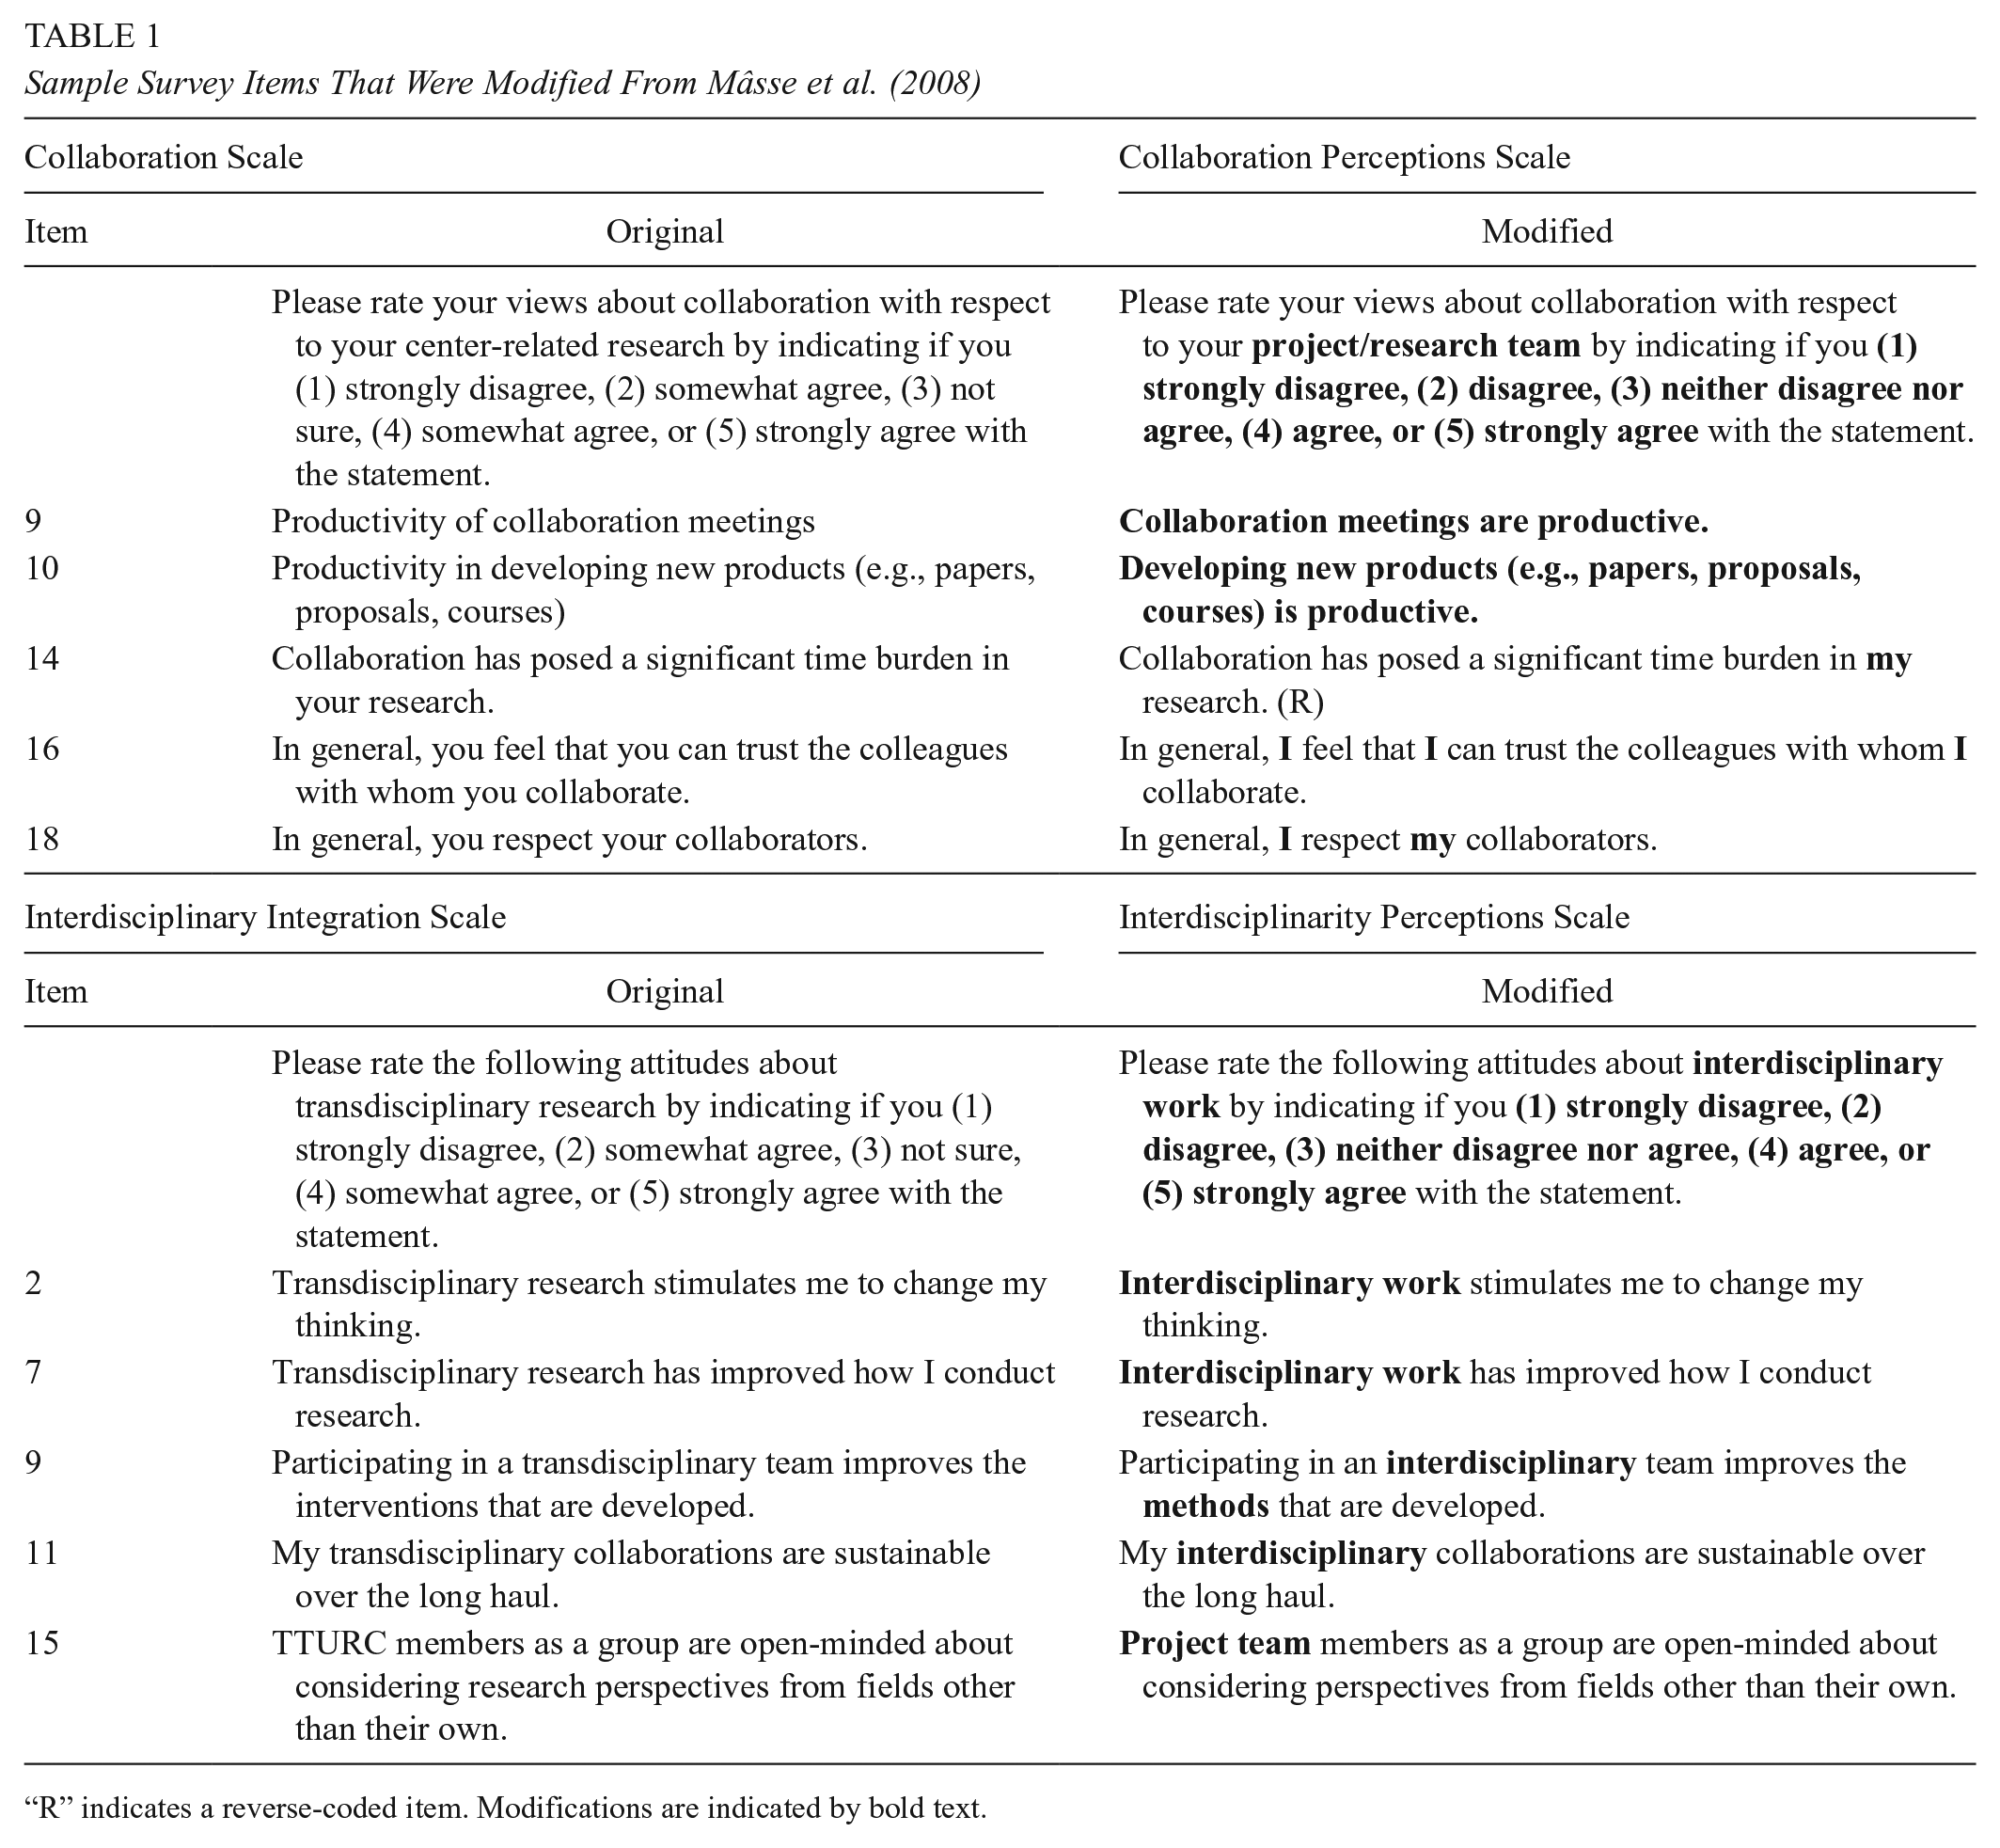
“R” indicates a reverse-coded item. Modifications are indicated by bold text.
To assess the modified items’ content validity (Hinkin, 1998), they were piloted with five individuals (three faculty, one postdoc, one graduate student) who were science education and science/engineering members of an interdisciplinary team. They provided feedback on items that were unclear and suggested additional modifications. It was recommended to instruct participants to respond to the survey with one interdisciplinary project in mind to aid with response consistency. This is because these individuals expressed that their responses would vary substantially depending on which project they focused on and that it was challenging to answer the survey while taking into consideration multiple interdisciplinary projects due to different experiences from project to project. Much like avoiding double-barreled items (Hill et al., 2022), the survey was designed to prevent participants from being unsure about how to respond if they were involved with multiple projects. All items used a five-point Likert scale (1 = strongly disagree, 2 = disagree, 3 = neither disagree nor agree, 4 = agree, and 5 = strongly agree). Values for reverse-coded items were inverted (5 = strongly disagree, 1 = strongly agree).
To understand the role of collectivist orientation, eight items from an existing validated instrument (Singelis et al., 1995; Triandis & Gelfland, 1998) were administered in the Qualtrics survey with the CP and IP items (Table 2). The items used a five-point Likert scale (1 = strongly disagree, 5 = strongly agree). Values for reverse-coded items were inverted (5 = strongly disagree, 1 = strongly agree), such that higher scores indicated a more collectivist orientation. Construct validity for the collectivism items was established and is further described in the section “Data Analysis.”
Final 4 Survey Items to Measure Collectivist-Individualist Orientations, From Singelis et al. (1995) and Triandis and Gelfland (1998)

R indicates a reverse-coded item.
Step 2: Instrument Administration
An email invitation containing study details, eligibility criteria, and the Qualtrics link was sent to potential participants through several methods. Individuals were eligible to participate if they were currently involved with (or had ended within the last year) an interdisciplinary project that included members from education and science/engineering disciplines, including computer science. Because individuals may have different interpretations of the word “interdisciplinary,” the survey and consent form included clarifying statements. For instance, this prompt was provided at the beginning of the survey: “You are invited to take this survey because of the interdisciplinary collaboration project with education and science/engineering disciplines in which you are involved (or were involved in the last year).” Additionally, the consent form stated that individuals were eligible for the study if they were “a member of an interdisciplinary collaboration project in the US that includes people from education and people from science/engineering disciplines.” Faculty, postdocs, graduate students, undergraduate students, and other project members (e.g., researchers and program coordinators) were eligible. Most individuals (n = 320) were identified through internet searches for interdisciplinary programs (e.g., Scientists Engaged in Education Research and UTeach programs) and national funding agencies’ databases (e.g., NSF and USDA) for projects that listed principal investigators (PIs) and Co-PIs from education and science/engineering disciplines. Separate emails were also sent to individuals who were personal and professional contacts of the researcher and research team and who were believed to be engaged in interdisciplinary work (n = 152). Using snowball sampling (Noy, 2008), invited participants were asked if they had recommendations for additional potential participants, which yielded 64 more individuals who were invited. Finally, the survey was distributed through email listservs of science education and science organizations, including the National Association for Research in Science Teaching (NARST), a regional chapter of the Association for Science Teacher Education (ASTE), Bridging Interdisciplinary Gaps in Education Sciences (BRIDGES), and a “Public Science” email listserv. A reminder email was sent two to four weeks after the initial invitation. Survey responses were anonymous and did not collect names; therefore, it was not possible to know who responded. However, 80 individuals personally replied to the researcher, stating they would consider taking the survey or had already completed it; 49 individuals indicated they would not complete the survey (e.g., not eligible, not interested).
The dataset was cleaned to remove respondents who did not meet the study’s inclusion criteria. First, individuals were excluded if they were not located in the United States (n = 2) and if they completed the demographic questions but did not begin the quantitative items (n = 33). The quantitative items were part of a larger survey that included open-ended questions, which asked about the nature of participants’ interdisciplinary collaborations. Responses to these open-ended questions also were used to screen participants. For instance, four individuals were excluded because their interdisciplinary team did not include members both from education and from science/engineering disciplines; the open-ended question “What fields/disciplines are involved in your interdisciplinary project/team?” was used to screen for this criterion. Five individuals were excluded because they responded about multiple collaborations rather than focusing on a single collaboration; the open-ended question “Please briefly describe the purpose or goal of your project” was used to screen for this criterion. Next, individuals were excluded from analyses if they did not complete all CP items (n = 4) or all IP items (n = 2). Those who had less than 100% completion on either scale skipped one to five items. After considering all eligibility criteria, 48 and 46 individuals were eliminated from CP and IP analyses, respectively. A total of 117 respondents were retained for EFA for the CP scale and 119 respondents for the IP scale. The two samples were almost identical, as all 117 participants who were retained for the CP were also retained for the IP. The estimated response rate of those who were contacted directly (n = 536) was 22%, based on the number of respondents (n = 117 CP; n = 119 IP) who were retained in the final analysis.
Participant Demographics
A total of 117 participants completed all items on the entire survey. Participants represented 61 universities and two educational research organizations in 31 U.S. states. Participants were mostly female (66.7%) and White/non-Hispanic (77.8%) (Table 3). Most were faculty (70.1%), followed by graduate students (13.7%), staff (8.5%), and postdocs (6.8%). Participants belonged to education (54.7%; e.g., science or STEM education, education research), science (27.4%; e.g., biology, chemistry), and engineering (8.5%; e.g., materials science and engineering, sustainability engineering). Some participants identified with both disciplines (6.8%; e.g., biology and education). Most were involved with grant-funded projects (89.7%). Participants’ reported team size ranged from 3 to 30 members (M = 8 members). Participants’ collaborations were at various stages, mostly in their second year (25.6%); several were ongoing or beyond their fifth year (12.0%), and some had ended recently (9.4%). Most respondents had been involved with their collaboration for two or more years (82.1%) and worked less than 10 hours/week on their collaboration project (60.7%). Most participants conducted interdisciplinary research with their team (82.9%) and had previous experience with an interdisciplinary team (85.5%).
Demographics of Participants Who Completed the Survey (n = 117)

For the CP scale, 48 participants each belonged to different institutions (41% of all respondents), and the remaining 69 participants (59%) represented 15 different institutions (M = 4.6 individuals per institution). The demographics for the IP scale were almost identical, with 48 participants who each belonged to different institutions and 71 participants who represented 16 different institutions. Even with this low number of participants from the same institutions, it is possible that individuals from the same team completed the survey (although the method of data collection, to ensure confidentiality, can’t confirm whether individuals worked on the same team). Approximately 85% of participants indicated they had previous experience with an interdisciplinary project. Therefore, it is possible that participants from the same team completed the survey, but individuals who may have been involved with more than one project decided to respond to different projects than a collaborator. In this case, data dependency would not be an issue. Additionally, even if participants were on the same team, they may not interact (depending on the size and nature of the team), and their experiences may be very different from and not dependent on one another.
Step 3: Item Reduction
EFA was conducted (SPSS 26; IBM, 2019) to independently determine each scale’s factor structure. Principal axis factoring (PAF) was performed (UCLA Institute for Digital Research and Education, n.d.) with promax rotation (Yong & Pearce, 2013). PAF is common and more conceptually aligned with social and behavioral science research than other techniques, like principal components analysis (Warner, 2012). Promax rotation allows factors to be correlated (Yong & Pearce, 2013). EFA analyses are further presented in the results section.
Data Analysis
Average scores were calculated for the CP and IP scales (DiStefano et al., 2009). They were not normally distributed, based on Kolmogorov–Smirnov test results (p = 0.009 and p < 0.001, respectively). A p-value less than 0.05 indicates a nonnormal distribution (Mishra et al., 2019). Therefore, nonparametric analyses were conducted.
Demographic Factors
To analyze participants’ perceptions and the influence of demographic factors, a Wilcoxon signed rank test was conducted to compare average CP and IP scores for the whole sample. The Mann-Whitney U test, similar to the parametric independent samples t-test (UCLA Institute for Digital Research and Education, 2020), was used to compare two demographic groups (e.g., males and females). The Kruskal-Wallis H test, similar to a one-way analysis of variance (ANOVA), with pairwise comparisons and Bonferroni correction for multiple comparisons (UCLA Institute for Digital Research and Education, 2020), was used to compare scores for three or more groups (e.g., faculty, staff, postdocs, graduate students). A p-value less than 0.05 indicated statistical significance.
Collectivist Orientation
Because the collectivist orientation items were not modified and have been used with adults and in team contexts (e.g., Arpaci, 2016), Cronbach’s alpha was calculated to determine the internal consistency of the items for this sample. Three collectivism items (4, 7, and 8) were excluded due to poor fit (α = 0.473). The remaining items (1, 2, 3, 5, and 6) had a Cronbach’s alpha of 0.642, comparable to previous research that yielded alphas of 0.67 to 0.74 for these collectivism-individualism items (Singelis et al., 1995). To further assess the construct validity of the collectivism items, SPSS Amos was used for confirmatory factor analysis (CFA) on the remaining five items. CFA is an acceptable method for assessing construct validity when there is a strong existing theoretical model (DiStefano & Hess, 2005), as was the case with the collectivism items. CFA with five items produced an acceptable model that met goodness of fit indices (χ2 = 0.884, CFI = 1.00, RMSEA = 0.00, SRMR = 0.0141; Hu & Bentler, 1999). However, one item (item 3) did not fit with the model due to low factor loading and r2. CFA conducted on four items (items 1, 2, 5, and 6) resulted in an improved model that met all criteria (χ2 = 0.298, CFI = 0.99, RMSEA = 0.027, SRMR = 0.0151), and all items had sufficient loadings and r2. These four items had a Cronbach’s alpha of 0.631, which was determined to be sufficient and comparable to previously reported values (Singelis et al., 1995).
Because participants’ perceptions may differ by collectivist orientation (e.g., Eby & Dobbins, 1997; Ning et al., 2015), an average collectivism score was calculated for each participant using the four collectivist orientation items. The sample was then split into two groups, guided by Eby and Dobbins (1997): a high collectivism group (n = 68; M ≥ 4.00) and a moderate group (n = 49; M < 4.00). Average collectivism scores were not normally distributed (Kolmogorov-Smirnov test, p < 0.001). Therefore, the Mann-Whitney U test was used to compare high and moderate groups’ CP and IP scores. Pearson correlation was calculated to explore the relationship between collectivist orientation and CP and IP scores.
Results
Instrument Validity and Reliability
The Kaiser-Meyer-Olkin (KMO) Measure of Sampling Adequacy and Bartlett’s Test of Sphericity were performed to determine whether the data were suitable for EFA (IBM, n.d.). The KMO statistic should be greater than 0.5, and Bartlett’s test statistic should be significant (p < 0.05). Both tests indicated the CP data (KMO = .885; p < .001) and IP data (KMO = .796; p < .001) were acceptable for EFA.
Validation of the Collaboration Perceptions Scale
A rotated PAF was performed on the 18 modified CP items to determine the number of factors to extract. Based on the eigenvalue-greater-than-one rule (Kaiser’s criterion; Kaiser, 1960), at least one factor was present, explaining 43.5% of variance (see McCance, 2021, for all EFA details). Eigenvalues for factors two and three were close to one and explained 5.9% and 5.3% of total variance, respectively. Items’ initial communalities, which represent the item variance accounted for by the common factors (Yong & Pearce, 2013), were within an acceptable range, from .303 to .759 (values less than .200 should be considered for removal).
A scree plot was also inspected because Kaiser’s criterion has been reported to overestimate factors (Yong & Pearce, 2013). The scree test was inconclusive due to two potential bends: at Factor 2 (suggesting one factor) and at Factor 4 (suggesting three factors). Given the relatively small sample size (n < 200; Yong & Pearce, 2013), two additional methods, Velicer’s Minimum Average Partial (MAP) test and Parallel Analysis (PA), were conducted using SPSS syntax (O’Connor, 2000) to help clarify the factor structure. MAP and PA approaches are less common but considered more reliable than Kaiser’s criterion and scree plots (Hayton et al., 2004). Both methods pointed toward three-factor solutions. Because the four methods (Kaiser, scree plot, MAP, and PA) yielded different results, and due to the exploratory nature of this study, one-, two-, and three-factor solutions were compared to determine the best factor structure.
Selection of the one-factor solution
One factor was determined to be the best structure for the CP scale. All 18 items loaded onto one factor; all but two items were strong loaders (greater than .5). Cronbach’s alpha (α = .923) was greater than the alphas for the two- and three-factor models. In the two-factor model, the factors were strongly correlated (.727), and multiple items cross-loaded, suggesting that the two factors were too similar and not distinct. The three-factor model was problematic due to multiple cross-loaded items and two items that did not load onto any factors. Additionally, Factor 3 contained the only two items that were focused on conducting research (items 12 and 13) and may have been sorted together due to their wording.
One-factor extraction and final item retention
Item 15 (“I am comfortable showing limits or gaps in my knowledge to those with whom I collaborate”) was removed because its communality was less than the recommended .200 (Yong & Pearce, 2013). A one-factor extraction was conducted on the remaining 17 items. The factor explained 44.5% of variance. Factor loadings ranged from .449 to .855. The extracted communalities were greater than .200, ranging from .202 to .731. Cronbach’s alpha for the 17 items was .923, inter-item correlations were all less than .800, and removing items would not substantially improve alpha. This factor was named Collaboration Perceptions (CP). Although the individual items cover a range of collaboration aspects, including satisfaction (e.g., satisfaction with communication among collaborators) and their perception of collaboration impacts (e.g., collaboration meetings are productive), CP is representative of all retained items (Table 4).
Final 17 Collaboration Perceptions Items, One-Factor Solution

R indicates a reverse-coded item.
Validation of the Interdisciplinarity Perceptions Scale
PAF with promax rotation was performed on the 15 modified IP items. Using Kaiser’s criterion (Kaiser, 1960), one factor was present that explained 30.2% of variance, and a possible second factor explained 6.5% of variance (see McCance, 2021, for all EFA details). The items’ initial communalities also were acceptable, ranging from .297 to .677. A bend at Factor 2 in the scree plot indicated one factor. Results from the MAP test also indicated a one-factor solution. One- and two-factor solutions were compared to determine the best structure.
Selection of the one-factor solution
One factor was determined to be the best structure for the IP scale because ten items had strong loadings (greater than .500; Costello & Osborne, 2005). The two-factor solution was problematic because Cronbach’s alpha for Factor 2 was .585, well below the recommended .7 minimum, and the alpha did not improve if any items were removed. Additionally, the items in Factor 2 were the only reverse-coded items in this scale, which has been found to impact factor structure (Zhang et al., 2016); the reverse-coded items formed a separate factor, even though the original scale intended to measure a single construct.
One-factor extraction and final item retention
Items 4 (“Interdisciplinary work interferes with my ability to maintain knowledge in my primary area”) and 6 (“In an interdisciplinary group, it takes more time to produce new products (e.g., papers, proposals, courses”) were removed because their factor loadings were less than .4 and communalities were less than .2 (Yong & Pearce, 2013). When a one-factor, 13-item structure was investigated, items 1 and 5 did not meet the factor-loading and communality criteria. After removing these two items, the final 11-item scale explained 35.9% of variance. Factor loadings (ranged from .474 to .683) and item communalities (ranged from .225 to .467) were acceptable. Cronbach’s alpha was .852; removing additional items would not improve alpha. This factor was titled Interdisciplinarity Perceptions (IP) to represent the factor’s range of items related to interdisciplinarity (Table 5).
Final 11 Interdisciplinarity Perceptions Items, One-Factor Solution

Sample-Size Considerations
Recommendations for sample size when conducting factor analysis vary greatly. Small subsample sizes (e.g., a subsample of 48, with 16 variables, resulting in a ratio of 3:1) have produced solutions that were consistent with full-sample solutions, indicating that small sample sizes might be sufficient under certain conditions (MacCallum et al., 1999). Two important criteria are communality values (.2 to .8) and overdetermination of factors (i.e., a factor that has several variables with high factor loadings). The current study met MacCallum’s et al. (1999) criteria for sample size, variable-to-factor ratio, acceptable communalities, and overdetermination. Thus, the sample sizes were determined to be sufficient. The one-factor, 17-item CP scale (~17:1 ratio) had a sample size of 117. Factor loadings were greater than .5 for 15 CP items, and communalities after extraction ranged from .246 to .732. The one-factor, 11-item IP scale (~11:1 ratio) used a sample size of 119. Factor loadings were greater than .5 for 10 items, and communalities were acceptable, ranging from .225 to .467.
Overall Perceptions of Collaboration and Interdisciplinarity
Perceptions of collaboration (CP) and interdisciplinarity (IP) were strongly positive; the average CP score for the whole sample was 4.18 (SD = 0.60). The average IP score was 4.42 (SD = 0.43). Nonparametric Mann-Whitney U and Kruskal-Wallis H analyses were conducted on CP and IP scores for demographic groups (e.g., gender, race/ethnicity, discipline, role, length of involvement), and no significant differences were found (Table 6).
Collaboration Perceptions and Interdisciplinarity Perceptions Scores by Demographic Factors

Role of Collectivist Orientation
The average collectivism score for the whole sample was 3.94 (SD = 0.54). After splitting the sample based on collectivism scores, the high collectivism group’s average collectivism scores ranged from 4.00 to 5.00 (M = 4.31, SD = 0.27), and the moderate group’s scores ranged from 2.50 to 3.75 (M = 3.42, SD = 0.37). Pearson correlation results indicated that collectivism was significantly and positively correlated with average CP scores (r = 0.220; p = 0.017) and IP scores (r = 0.285; p = 0.002). Average CP and IP scores were significantly and positively correlated with one another (r = 0.684; p < 0.001). As noted in the previous section, CP and IP scores did not differ by demographic groups. However, CP and IP scores differed based on collectivist orientation (Figure 2), which is further described in the following sections.

Average Collaboration Perceptions and Interdisciplinarity Perceptions scores for the high and moderate collectivism groups.
Collaboration Perceptions of the High and Moderate Collectivism Groups
The high collectivism group’s average CP score (M = 4.27, SD = 0.61) was significantly greater than the moderate group’s (M = 4.05, SD = 0.58; p = 0.020; Figure 2). Item analyses were conducted to further elucidate how the two groups' perceptions differed (Table 7). Of the 17 CP items, four items indicated significant differences between the high and moderate collectivism groups (CP items 4, 9, 17, 18).
Comparison of Collaboration Perceptions Item Scores for the High and Moderate Collectivism Groups

Note. Statistically significant differences are indicated by shading and an asterisk. R indicates a reverse-coded item.
For both the high and moderate groups, CP items 16 and 18 had the highest means and were related to trust (“In general, I feel that I can trust the colleagues with whom I collaborate”) and respect (“In general, I respect my collaborators”). The high group reported significantly more positive perceptions of respecting their collaborators (CP item 18; p = 0.025) and collaborators being open to criticism (CP item 17; p = 0.010) than the moderate group. The two groups had similar perceptions of productivity associated with collaboration (CP items 10, 11, 12), except the high collectivism group perceived that meetings were more productive (CP item 9; p = 0.032). The two groups also had similar perceptions of various research-related impacts of collaboration (CP items 12, 13, 14). Item 14 had the lowest mean for both groups (“Collaboration has posed a significant time burden in my research”), which was somewhat in agreement for the high group (M = 3.54) and neutral for the moderate group (M = 3.08). Comparing the eight items that related to satisfaction with collaboration (CP items 1 through 8), the high collectivism group reported greater satisfaction for only one item, “Organization or structure of the collaborative team” (CP item 4; p = 0.008).
Interdisciplinarity Perceptions of the High and Moderate Collectivism Groups
The average IP score for the whole sample and averages for all individual items were strongly positive and greater than 4.00. The high collectivism group’s average IP score (M = 4.51, SD = 0.41) was significantly greater than the moderate group’s (M = 4.30, SD = 0.43, p = 0.007; Figure 2). Five IP items had significantly different scores between the high and moderate collectivism groups (IP items 2, 9, 10, 13, 15; Table 8).
Comparison of IP Item Scores for the High and Moderate Collectivism Groups
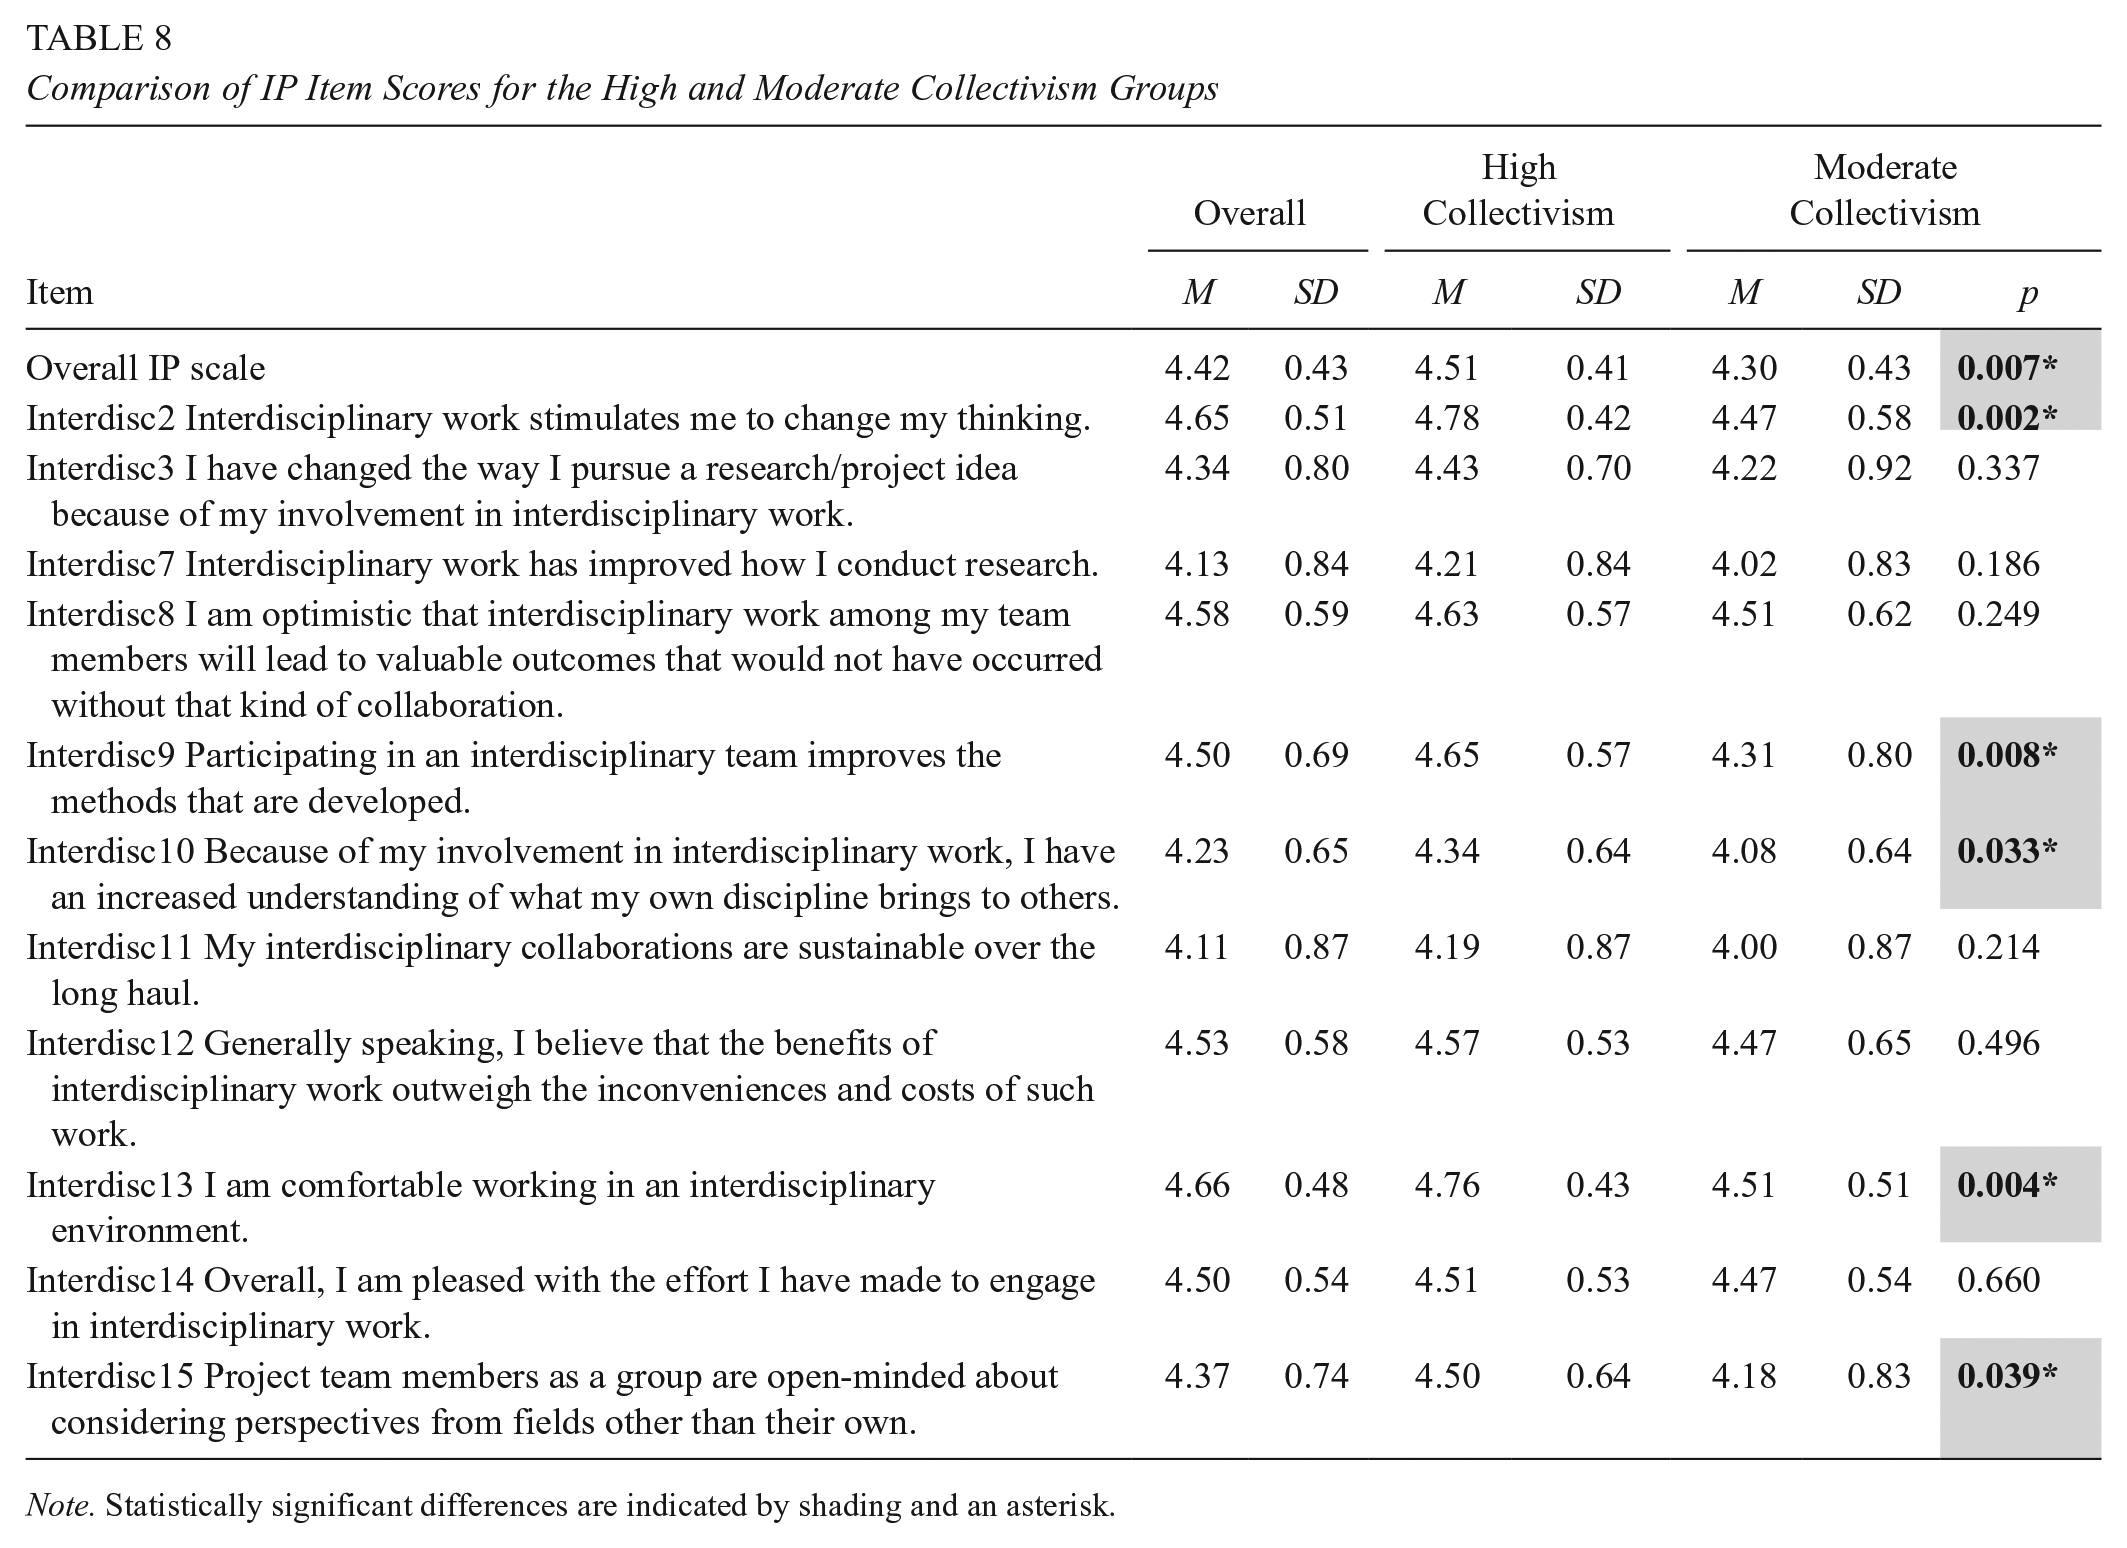
Note. Statistically significant differences are indicated by shading and an asterisk.
For the high collectivism group, items with the highest scores were “Interdisciplinary work stimulates me to change my thinking” (IP item 2) and “I am comfortable working in an interdisciplinary environment” (IP item 13), whose mean scores were significantly greater than the moderate group’s scores for those two items (p = 0.002 and p = 0.004, respectively). Item 13 also had the highest score for the moderate group. The lowest item means for both groups were “My interdisciplinary collaborations are sustainable over the long haul” (IP item 11) and “Interdisciplinary work has improved how I conduct research” (IP item 7), yet they were still 4.00 or greater.
The high and moderate collectivism groups both reported that the outcomes of interdisciplinary work were valuable, and they were pleased with their interdisciplinary efforts (IP items 8, 12, 14). Both groups also responded similarly that interdisciplinary work improved how they conducted research and how they pursued research/project ideas (IP items 3 and 7). The two groups’ perceptions differed in that the high collectivism group tended to perceive that interdisciplinary work had greater impacts on aspects such as changing their thinking (IP item 2; p = 0.002), improving methods that were developed (IP item 9; p = 0.008), and gaining a greater understanding of one’s own disciplinary contributions (IP item 10; p = 0.033). The high group also reported feeling more comfortable working in an interdisciplinary environment (IP item 13; p = 0.004) and that their colleagues were more open-minded about considering different perspectives (IP item 15; p = 0.039) than the moderate group.
Limitations
Due to sampling methods and the sample size, this study may capture the views of a select group of those involved in these interdisciplinary collaborations. A different sample or sampling of this population at a different point in time may have led to different results. Therefore, this study’s results may not be generalizable beyond the sample. Additionally, this study does not capture or investigate all possible variables or factors, such as institution type (e.g., R1/R2, public/private) or the composition of participants’ collaborations (e.g., team size, gender, and racial/ethnic makeup of the team). Participants may have rated the survey items more positively due to social desirability bias (Gaia, 2020); however, the survey was anonymous to encourage forthright responses. Because data collection overlapped with the beginning of a global pandemic, it is possible this may have impacted the nature of participants’ interdisciplinary collaborations and their survey responses.
Discussion
This study was spurred by a desire to understand the perceptions of U.S. scientists, engineers, and educators who were engaged in interdisciplinary collaboration projects involving both education and science/engineering disciplines. Therefore, this research purposely solicited the participation of academics across the United States who reported to be involved in interdisciplinary collaborations. Faculty, staff, postdocs, and graduate students from over 60 universities and research organizations in 31 U.S. states participated.
Validity and Reliability of the Collaboration Perceptions and Interdisciplinarity Perceptions Scales
Due to a lack of research published on this topic (McCance, 2021), existing validated scales that measure collaboration and related constructs (e.g., transdisciplinarity; Mâsse et al., 2008) were located and underwent a complete validation process to develop items that would be relevant for this study’s participants and measure constructs of interest (Hinkin, 1998). The essential changes to the nature and focus of the items and their potential to alter the original factor structure of the instruments led to a decision to use EFA (Burnett & Dart, 1997). EFA with this sample resulted in a one-factor, 17-item CP scale with very good internal consistency (Cronbach’s α = .923). A separate one-factor, 11-item IP scale also had very good internal consistency (α = .852). Compared to the original three-factor collaboration instrument, the CP items in this study performed as a single factor. The IP scale was valid and reliable, with a reduced set of 11 items compared to the original 15-item factor (Mâsse et al., 2008).
The moderately strong correlation between CP and IP scales (r = 0.684) indicates that as perceptions increase on one scale, they are also expected to increase on the other scale. The correlation has implications for researchers who administer these scales. The CP and IP scales were validated separately; therefore, they can be administered separately or together. However, because CP and IP are strongly correlated, it is possible that they measure constructs that are too similar for inclusion of both variables in certain analyses, like regression (UCLA Advanced Research Computing, n.d.).
Overall Perceptions of Collaboration and Interdisciplinarity
It was anticipated that participants’ experiences with their interdisciplinary projects would greatly vary. Funding agencies have pushed for interdisciplinary teams to address some of the grand challenges of society (NSF, 2017). Therefore, it was expected that participants may have decided to join their interdisciplinary collaborations primarily to secure grant funding rather than interact with interdisciplinary team members, leading to highly positive or negative responses. Yet, this was not the case. Participants had strongly positive responses, with overall averages of both the CP scale and IP scale exceeding 4.00. This study’s findings compare with Mâsse et al.’s findings (2008), in which the average scores of three collaboration subscales were 4.05, 4.00, and 4.41, and the average score of Mâsse’s Transdisciplinary Integration scale was 4.05. The average scores in the current study were slightly greater than those found by Mâsse. One possible explanation is that participants in the current study likely interacted more closely with their collaborators in smaller, more intimate teams than did those involved in larger research centers in Mâsse’s study.
There are several possible explanations for the strongly positive CP and IP results. First, it is likely that the individuals who worked in interdisciplinary collaborations did so by choice. In fact, 85% of participants stated that they had previous experience working with an interdisciplinary team. Regardless of what their prior experiences had been, when participants selected one interdisciplinary collaboration to focus on for this study, they responded to the items in mostly positive ways. When soliciting participants, it was anticipated that some individuals would report negative experiences and perceptions, but the findings of the current study suggest this was not the case. Despite representing over 60 universities in 31 U.S. states, participants had positive perceptions overall about a wide range of aspects of interdisciplinarity and collaboration. Although the survey collected data at one point in time, it captured individuals at the beginning to the late stages of their projects, and no significant differences were found based on how long they had been involved in their projects. Therefore, the results suggest that participants found a wide range of positive aspects of working on an interdisciplinary team at all stages of their projects.
Examination of Demographic Factors
It was anticipated that participants’ perceptions of collaboration and interdisciplinarity would differ by demographic factors, such as between those from science/engineering and those from education. Yet, no significant differences were found. Next, gender and race/ethnicity were explored. Again, there were no significant differences. This lack of significance was also evident when comparing different roles (e.g., faculty, staff, postdocs, and graduate students). This contrasted with the findings of Mâsse et al. (2008), in which significant differences existed by role and research center; for instance, the principal investigators’ “Trust and Respect” factor scores (collaboration scale) were significantly greater than those of other research staff. Additionally, in the Mâsse et al. study, students’ “Trust and Respect” factor scores were significantly greater than those of support staff and other research staff. Approximately two-thirds of participants were female, and nearly three-quarters were White (these demographic data were not reported in the Mâsse et al. study). It is possible that the experiences of these participants would have differed from a different sample that included more males and a more diverse group of participants.
Our results add to the mixed results reported in the literature. Gender has been found to play a role in faculty members’ work, reporting that women participate in more interdisciplinary science collaborations than men, and years of work experience is also associated with participation in more interdisciplinary collaborations (van Rijnsoever & Hessels, 2011). In contrast, it has been found that demographic variables, such as gender, race/ethnicity, academic position and rank, and years since earning a Ph.D., do not significantly predict faculty members’ satisfaction with collaboration with an interdisciplinary cluster hire group (Bloom et al., 2020). Similarly, a recent study on interdisciplinary collaborations found that perceived barriers to interdisciplinary research did not differ across variables, such as gender and level of experience, for learning scientists and discipline-based educational researchers from STEM fields (Daniel et al., 2022).
Role of Collectivism
Collaboration Perceptions
The high and moderate collectivism groups had statistically different responses on several CP scale items. The high collectivism group reported having greater respect for their collaborators and that their collaborators were open to criticism. The high group also reported greater satisfaction with the productivity of collaboration meetings and the organization or structure of their team than the moderate group. These results resonate with prior research. Collectivists see themselves as part of a group and prioritize group goals and relationships (Singelis et al., 1995). They value being a member of a team (Gundlach et al., 2006), which may help explain the high collectivism group’s greater affinity toward collaborative group meetings and team structure. Those who had significantly lower collectivism scores (i.e., the moderate group) may be more comparable to individualists, who can be described as valuing independence and autonomy, prioritizing personal over group goals, and being less open to opinions or perspectives that differ from their own (Singelis et al., 1995). Those in the moderate group may identify and see themselves as separate from their group and feel less connected or engaged with collaborators (Gundlach et al., 2006). Collectivist orientation scores were positively and significantly correlated with CP scores, which also met our expectations that the closer one identified as collectivist, the more positive one might feel toward collaboration. Previous research on primary and secondary teachers (Ning et al., 2015) also found a relationship between collectivism and collaboration perceptions; higher collectivism positively influenced perceptions of team collegiality (including perceived trust and respect among collaborators), and team collegiality positively predicted perceived team collaboration.
Both collectivism groups were satisfied with most collaboration aspects, and they had similar perceptions of various research-related impacts of collaboration. There was not a significant difference between the high and moderate groups’ responses to the CP item “Collaboration has posed a significant time burden in my research,” which had the lowest mean after reverse coding. Despite the clear benefits that most participants found in their interdisciplinary collaboration, this finding indicates that interdisciplinary collaboration requires more time. Previous research supports this finding and has reported that collaborative and interdisciplinary approaches pose additional time constraints for those involved (Bouwma-Gearhart & Adumat, 2011; Daniel et al., 2022).
Interdisciplinarity Perceptions
For the IP scale, participants reported similar perceptions of the value of interdisciplinary work and positive impacts on research, regardless of their orientation toward collectivism. Yet, the high collectivism group was significantly more likely to feel comfortable working in an interdisciplinary environment. Research has reported the challenges of working with an interdisciplinary team, including navigating fundamental differences between disciplines, their methods, and communication (Daniel et al., 2022). Collectivists aim to cooperate with others in a group despite differences and may sacrifice their personal needs (Gundlach et al., 2006), which may explain why the high collectivism group felt more comfortable in an interdisciplinary environment, even if it was challenging at times. Given the barriers of interdisciplinarity, it is somewhat surprising that this item was nearly the highest-rated item for both groups, but it also is a promising sign for interdisciplinary work. The item with the lowest mean for both groups focused on sustaining interdisciplinary collaborations over time. This result may be due to the fact that 90% of the participants reported being involved in grant-funded collaborations, which are by their nature limited by their funding cycle.
The high collectivism group was more likely than the moderate group to report that interdisciplinary work had greater impacts on aspects such as changing their thinking, improving their methods, colleagues being open to other perspectives, and understanding how one’s discipline contributes to others. These results resonate with collectivists’ orientation toward interdependence and value toward group interests and goals (Gundlach et al., 2006; Singelis et al., 1995). Those with a more individualist orientation are more likely to focus on personal goals and may exert more effort and attention on tasks that are individual in nature and less attention on shared tasks (Wagner et al., 2012). Therefore, it is possible that participants in the moderate group spent less time interacting or had lower-quality interactions with collaborators and fewer opportunities to experience impacts like changes in one’s thinking or increased understanding of one’s disciplinary contributions. Collectivist orientation scores were also positively and significantly correlated with IP scores. These results met our expectations that one’s collectivist orientation would relate to one’s perceptions of collaborating across disciplines.
Figure 3 summarizes the ways the high and moderate collectivism groups were similar and differed in their perceptions of collaboration and interdisciplinarity.
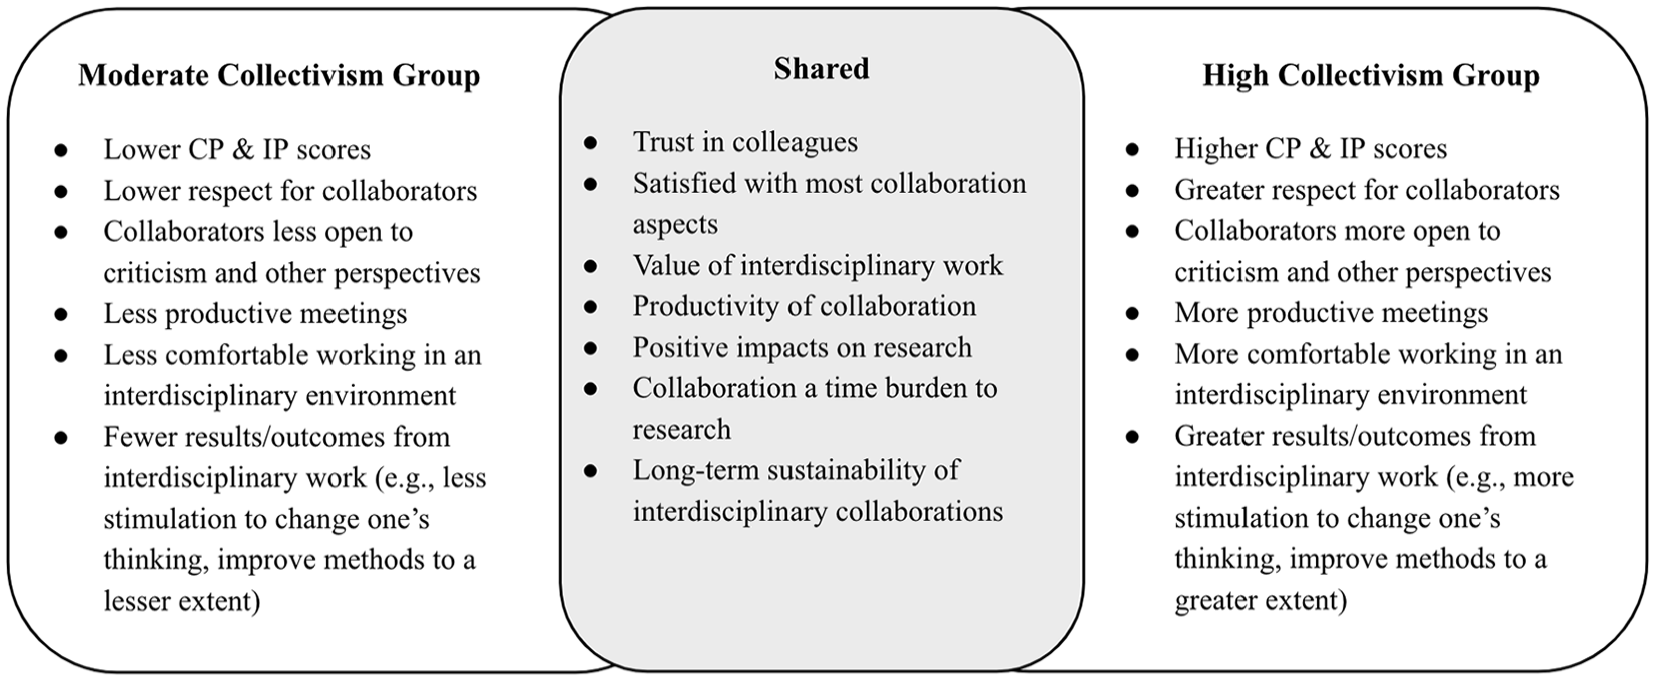
High and moderate collectivism similarities and differences.
Conclusions and Recommendations
The results of this study support these assertions and recommendations:
The CP and IP scales were valid, reliable tools to measure the perceptions of U.S. faculty, staff, postdocs, and graduate students who were involved in interdisciplinary collaborations between education and science/engineering disciplines.
Perceptions of collaboration and interdisciplinarity did not differ by demographic factors (e.g., gender, race/ethnicity, content area, discipline, role).
Collaboration and interdisciplinarity perceptions differed based on collectivist orientation; high collectivism participants had more positive perceptions of collaboration and interdisciplinarity than those in the moderate group.
Collectivism orientation was significantly and positively correlated with CP and IP scores.
Measuring participants’ collectivist orientation was useful to better understand factors that influence perceptions of collaboration and interdisciplinarity.
Recommendations for Interdisciplinary Teams
Invite collaborators from science, engineering, and education disciplines (including faculty, staff, postdocs, and students) who are interested in being involved in an interdisciplinary team.
Situate more interdisciplinary teams beyond the context of grant funding to increase the potential for sustainable, continued collaborative work.
Have early and ongoing discussions about collaboration and interdisciplinary work to promote open discussion and respect and to enhance the quality/quantity of work that is shared and produced.
Recommendations for Future Research
Apply the validated scales to study interdisciplinary teams over time (e.g., a multiyear grant-funded project) or to compare different interdisciplinary teams.
Explore how collaborators may develop more collectivist mindsets by designing and studying an intervention to prepare collaborators for engaging in interdisciplinary work.
Administer the survey to a more diverse sample in terms of gender, race/ethnicity, discipline, and role.
Collect qualitative responses to explain and elaborate on the quantitative results.
This study aimed to understand the perceptions of interdisciplinary collaborations of U.S. scientists, engineers, and educators. To do so, a valid way of measuring the constructs of interdisciplinarity and collaboration was developed and assessed. The resoundingly positive response from participants across U.S. universities may encourage others to engage in interdisciplinary collaborations. The validated scales have the potential to spark conversations on how to foster more productive and inclusive collaborations. With time, these interdisciplinary collaborations may lead to outcomes beyond the scope of individual disciplines, attaining the goals of national funding agencies.
Footnotes
Appendix A: Full Survey
The following questions concern your perceptions of and experiences with collaboration and interdisciplinary integration. When responding, please
Please evaluate your satisfaction with the collaboration within your project/research team by indicating if you are (1) very dissatisfied, (2) dissatisfied, (3) neither satisfied nor dissatisfied, (4) satisfied, or (5) very satisfied.
Please rate your views about collaboration with respect to your project/research team by indicating if you (1) strongly disagree, (2) disagree, (3) neither disagree nor agree, (4) agree, or (5) strongly agree with the statement.
Please rate the following attitudes about interdisciplinary work by indicating if you (1) strongly disagree, (2) disagree, (3) neither disagree nor agree, (4) agree, or (5) strongly agree with the statement.
Please rate the following by indicating if you (1) strongly disagree, (2) disagree, (3) neither disagree nor agree, (4) agree, or (5) strongly agree with the statement.
The researchers would like to conduct follow-up interviews with individuals to better understand their experiences with collaboration and interdisciplinarity. If you are willing to be interviewed, please provide your name and contact information.
Declaration of Conflicting Interests
The author(s) declared no potential conflicts of interest with respect to the research, authorship, and/or publication of this article.
Funding
The author(s) disclosed receipt of the following financial support for the research, authorship, and/or publication of this article: This research was supported by the United States Department of Agriculture (award number 2017-67009-26771).
Authors
KATHERINE MCCANCE is a STEM education postdoctoral fellow at The University of Texas at San Antonio, One UTSA Circle, San Antonio, TX 78249;
MARGARET BLANCHARD is a professor of science education and university faculty scholar at North Carolina State University, 2310 Stinson Dr., Raleigh, NC 27695;