
Abstract
Some researchers have questioned whether there is a causal connection between Advanced Placement (AP) STEM coursetaking and the choice of a STEM college major and a STEM occupation. Their research findings strongly suggest that if prior interest in STEM as well as other possible confounders are taken into account, the relationships of taking AP mathematics to expecting to be in a STEM major and/or a STEM occupation are small to nonexistent. Results from the current study, which uses data from a national longitudinal sample—actual measures of who majors in STEM—and prior interest in STEM along with other possible confounders, indicate that taking AP mathematics and AP science courses is significantly related to majoring in STEM and/or expecting to be in a STEM occupation at age 30—the sole exception being the taking of AP statistics.
Keywords
For years, the United States has worked to increase the number of students who major in science, technology, engineering, and mathematics (STEM) fields in college with the goal of also increasing the number who choose a STEM occupation. The reason for this emphasis is that STEM education is seen as a major driver of moving the country forward both in terms of technology innovation and economic growth (National Science Board, 2007). Efforts to increase the number of majors in STEM continue. As recently as November 2022, the U.S. Bureau of Labor Statistics predicted that in spite of having roughly 10 million employed in STEM occupations in 2021, this total will need to grow by nearly 11 percent (about a million new jobs) to meet the likely demand by 2031, a growth that is roughly twice that needed for non-STEM occupations. 1
Advanced Placement (AP) coursetaking in high school has been seen as an important lever in STEM education through the role it may play in the choice of a STEM major in college and the choice of a STEM occupation after college. Indeed, several studies have found a positive relationship between AP coursetaking and choosing a STEM major in college (Ackerman et al., 2013; Jewett, 2019; Mattern et al., 2011; Morgan & Klaric, 2007; Robinson, 2003; Tai et al., 2010). However, recent research by Warne et al. (2019) and Sadler et al. (2014) found that when prior interest in STEM and other preexisting differences are taken into account, the relationship between AP coursetaking and students’ reported likelihood of choosing a STEM major in college or expecting to be in a STEM career is greatly attenuated or disappears entirely.
The current study further examines the importance of AP coursetaking in mathematics and science in the choice of a STEM major in college and the expectation of being in a STEM career at age 30. The examined research question follows: Is AP STEM coursetaking related to choosing a STEM major in college and to the expectation of being in a STEM occupation, taking into account prior experience with and interest in science, technology, engineering, and mathematics along with other relevant covariates, or not? This question is examined (a) using a data set that is stronger in several regards than those used in previous studies and (b) employing propensity score methods to account for the effect of a large set of potentially confounding variables. The results are quite different from those found by Warne et al. (2019) and Sadler et al. (2014) and instead more closely align with those reported by Tai et al. (2010), who found that taking AP mathematics and AP science courses showed a significant net effect either on majoring in STEM, expecting to be in a STEM occupation at age 30, or both. Although our nonexperimental research design precludes drawing causal conclusions, the results are consistent with the hypothesis that taking AP calculus and AP science courses are differentially and meaningfully related to choosing a STEM major in college and expecting to be in a STEM occupation at age 30.
Background
Origins of the AP Program
The AP program originated as a response to the Cold War between the United States and the Soviet Union that developed after World War II. In response to the concern that the United States was not preparing enough students for college and postgraduate work, the Ford Foundation established the Fund for the Advancement of Education (FAE) in 1951. 2 A central purpose of FAE was to better integrate high school and university curricula as a way of strengthening the transition from high school to college. Based on its own research, which showed that elite colleges and universities needed to teach material to students in their first year that they should have learned in high school, FAE developed a model curriculum in 10 subject areas that would prepare high school students for rigorous college work. In addition, FAE developed a set of tests (called Advanced Placement tests) to assess whether high school students had sufficiently mastered the materials to be ready for college-level coursework.
The AP program was taken over in 1955 by the not-for-profit College Board, which has administered it ever since. Because AP coursework was seen by many colleges and universities as an indication of college preparedness, there has been a tremendous growth in the number of AP courses offered in high schools. According to the College Board, in 2018 more than 1.24 million students (about the population of New Hampshire) in the class of 2018 took over 4.22 million AP exams. Furthermore, nearly 40% of that class took at least one AP exam, compared to 25% 10 years earlier. 3
Possible Benefits and Costs Associated With AP Coursetaking
The research literature suggests that there are many benefits to AP coursetaking. Research has documented that AP coursetaking is associated with a higher likelihood of enrollment in a four-year college (Morgan & Klaric, 2007) and higher grade-point averages in college (Flowers, 2008; Scott et al., 2010). Using a propensity score analysis, Warne et al. (2015) found that students who completed AP examinations in English had net positive differences of about 2.8 to 4.1 on their ACT composite score, and the net increase for those completing AP calculus was between 1.0 and 2.7 points on the ACT composite score. Smith et al. (2017), using a regression-continuity design, found that the higher the AP score across a number of subjects, the greater the likelihood of college completion. Shaw and Barbuti (2010) also found that students who had not taken any STEM-related AP courses were much more likely to switch from STEM to non-STEM majors (with the exception of computer and information sciences) than students who had taken STEM-related AP courses. Furthermore, the more STEM-related courses taken, the greater the likelihood that they persisted in being a STEM major. Tai et al. (2010) found that students who successfully took AP calculus and science courses were more likely to earn an undergraduate degree in a STEM field than those who did not.
But not all studies have come to the same conclusion about the role of AP mathematics and science coursetaking in these various outcomes. For example, Geiser and Santelices (2004) found that there was no relationship between the number of AP courses taken and college first-year GPA. Klopfenstein and Thomas (2009) also found that when a broad range of student, college, and other factors were taken into account, AP coursetaking was unrelated to first-semester college grades as well as to continuation to a second year of college. Klopfenstein (2010) also found that performance on AP examinations was unrelated to time to college graduation.
Some researchers have also noted the costs associated with taking AP tests. Conger et al. (2019), using an experimental design, found that while those students who were randomly assigned to take an AP science course had an increased skill level and interest in science, it came at the cost of having less confidence in their ability to be successful in college science than those who were not assigned to take an AP science course. They also experienced higher levels of stress and lower grades, although the lower grades could have been due to having taken a more rigorous science course than those not assigned to take an AP science course. 4
Theoretical Explanations for the Importance of STEM AP Coursetaking
As noted previously, several studies have found a positive relationship between AP coursetaking and choosing a STEM major in college (Ackerman et al., 2013; Jewett, 2019; Morgan & Klaric, 2007; Mattern et al., 2011; Robinson, 2003; Tai et al., 2010). One theoretical explanation for this relationship is that talented individuals need “stretch” opportunities to reach their potential. Wai (2015), in a review of studies on the impact of an accelerated education for gifted children, found that children whose educations were accelerated realized both greater educational and occupational success as adults than those whose educations were not accelerated. Relatedly, Warne et al. (2019) note that an AP course or set of courses could provide an important component of a high “educational dose” to boost one’s potential. They further note that in the case of STEM, talented students in science, mathematics, or technology might perceive AP courses in mathematics and science as providing the educational dose needed to pursue a STEM degree in college that might otherwise be out of reach.
Another theoretical perspective suggests that AP coursetaking leads to and reinforces student interest in a field (Rossman et al., 2015). Creating interest in high school is important because research shows that those who expect to major in a STEM field in college have often made that decision in high school (Sadler et al., 2012). But the relationship between interest in high school and majoring in STEM in college is far from a perfect one. As a result, Warne et al. (2019) point out the importance of maintaining interest in STEM in high school, given that there is “a leaky pipeline” in which initial interest in STEM often wanes and students end up in non-STEM fields. That noted, a retrospective cohort study by Sadler et al. (2014) found that taking regular science and math courses in high school was positively related to an interest in a STEM career and that this relationship was especially strong when a second year of calculus, physics, or chemistry was taken. Although there was also a significant zero-order relationship between taking AP calculus, chemistry, or physics and interest in a STEM career, none of these relationships were statistically significant when coursework in those areas was taken into account.
Possible Noncausal Explanations Behind the Relationship
Setting aside the theoretical reasoning of why AP coursetaking is important in one’s expecting to have a STEM major or career, recent research has shown that when prior STEM interest and other possible confounding variables are taken into account, the relationship between AP coursetaking and interest in or expectations for a STEM major or occupation is greatly attenuated or disappears entirely. The explanation for this finding is that prior interest in STEM (e.g., participation in a science club and/or science fair) as well as other preexisting differences between those who do or do not opt to take AP science or mathematics (e.g., middle school math or science grades, one or both parents with a STEM occupation) are what likely account for the positive correlations between AP STEM coursetaking and choosing a STEM major or expecting to be in a STEM occupation rather than there being a causal connection between the two.
In support of this explanation, Sadler et al. (2014) found that when prior interest in STEM (especially early in high school) and the number of years of calculus, chemistry, and physics are considered, coursetaking in AP calculus and science is insignificant in its relationship with one’s stated intention for a career in STEM. Similarly, Warne et al. (2019) found that relationships between students’ AP mathematics coursetaking and intended STEM career outcomes were negligible when prior STEM interest was considered, the sole exception being that students who took AP calculus showed a very small increase in the likelihood of a career in engineering or mathematics/computer science.
Issues of Generalizability
While one might conclude, based on the studies by Warne et al. (2019) and Sadler et al. (2014), that AP coursetaking in mathematics and science plays no more than a supporting role in students’ interest in or expectation to have a STEM major or occupation (for example, by sustaining an interest in STEM), it is worth noting that both studies relied on nonrandom or otherwise specialized samples of students—a criticism that is detailed later. For example, in Warne et al. (2019), the dependent variables were whether students see themselves as an engineer now or in the future and/or the likelihood of choosing a STEM career in the future but measured when they were enrolled in an introductory English course in college. That is, the vast majority were freshmen in college. In the case of Sadler et al. (2014), the dependent variable, whether one expected to have a career in a STEM field, was also measured when the students in the sample were enrolled in an introductory college English class. That is, the studies were prospective but not longitudinal.
However, there are two studies (Jewett, 2019; Tai et al., 2010) that examined the role of AP STEM coursetaking and the choice of a STEM major using nationally representative longitudinal samples; furthermore, both measured whether or not students actually chose a STEM major when in college. Using a sample of nearly 4,000 students in the National Education Longitudinal Study of 1988 (NELS:88) who had completed their baccalaureate degree by 2000—and whose majors were coded as either physical science or engineering, life science, or nonscience and whose previous interest in STEM and other preexisting differences was taken into account—Tai et al. (2010) found evidence of an association between taking AP examinations in mathematics and science and choosing a STEM major.
More precisely, the odds associated with getting a degree in the physical sciences or engineering (compared to a nonscience degree) were about four times higher for those who took the AP calculus examination than for those who did not take it. However, taking the AP calculus examination was unrelated to completing a degree in the life sciences. In contrast, the odds associated with earning a degree in the life sciences (compared to a nonscience degree) were only about two times higher for those who took an AP science examination (biology, chemistry, physics, or mechanics) than for those who did not take one. However, taking an AP science examination was not associated with completing a degree in the physical sciences or engineering.
The limitations of Tai et al.’s (2010) study are twofold: first, the number of students in the sample who took the AP calculus and/or AP science examinations and majored in either the physical science/engineering or life science subject areas was small, ranging in size from 31 to 83; second, the data were collected at a time before the huge growth of AP coursetaking occurred and, as the researchers note, “these findings might simply no longer be reflected in the current population of students participating in the AP Program” (p. 117).
Jewett (2019) used data from the High School Longitudinal Study of 2009 (HSLS:09) to examine the effects of a number of STEM-related variables on the odds of choosing a STEM major in college. The variables examined included educational aspirations, measures of mathematics and science self-efficacy, the number of STEM courses taken, and the number of AP STEM courses taken. Logistic regression models were run with sociodemographic controls included. The results showed statistically significant odds ratios for all of the variables listed previously. Most relevant for the current study was the finding that the odds of choosing a STEM major increased by 1.31 for each additional AP STEM course taken. The range of the number of AP STEM courses taken was from 0 to 9 with a weighted mean of 0.77. The mean number of AP STEM courses taken by those who majored in STEM was 1.41 compared to 0.57 for those not choosing a STEM major.
Two Competing Models
The various findings examining the role that AP coursetaking plays in the choice of STEM-related outcomes suggest two possible models: one is where prior experience and interest in STEM account for the correlation between AP STEM coursetaking and the choice of a STEM major and/or a STEM occupation (see Model A in Figure 1). This model is consistent with the findings of Warne et al. (2019) and Sadler et al. (2014). The alternate model (see Model B in Figure 1) posits a causal path between prior experience and interest in STEM and AP coursetaking (which, in turn, has a causal link to the choice of a STEM major and/or a STEM occupation) as well as a causal path between prior experience and interest in STEM and the choice of a STEM major and/or STEM occupation. This model is consistent with the findings of Tai et al. (2010) and Jewett (2019).

Two implied causal models—Model A and Model B.
Importantly, these two models are statistically indistinguishable in that both are just identified. This means that there are three correlations to estimate exactly three parameters with no degrees of freedom. For Model A, the first two parameters are the causal parameters from prior experience and interest in STEM to (1) AP coursetaking and (2) majoring/choosing an occupation in a STEM subject. The third parameter is the residual correlation between the two. For Model B, the first two parameters to be estimated are the same as for Model A, but the third is a causal path from AP coursetaking to majoring/choosing an occupation in STEM. Given that both models are just identified, the only test that can be done to distinguish between the two is whether there is a significant relationship between AP coursetaking and majoring/choosing an occupation in STEM after taking prior experience and interest in STEM into account. If the value is zero, the data are consistent with Model A. However, if the value is nonzero, the data are consistent with Model B. That noted, in the absence of a randomized controlled design, causality cannot be assumed.
There are four studies that are most relevant for testing whether the results are better explained by Model A (no direct effect of AP STEM coursetaking on expecting to be in or actually choosing a STEM major or STEM occupation) or Model B (a direct effect of AP STEM coursetaking on expecting to be in or choosing a STEM major or STEM occupation). These studies are listed in Table 1, along with (a) whether the sample is random and nationally representative of the student population from which it is drawn, (b) whether the dependent variable (e.g., STEM major) is actually measured or whether it is measured prospectively, and (c) whether the results suggest evidence of a direct effect of AP STEM coursetaking on the dependent variable (as in Model B in Figure 1) or do not suggest evidence of a direct effect (as in Model A in Figure 1).
Summary of the Four Most Relevant Studies

Details about the samples used in each of the studies can be found in Appendix A. Only two of the studies use nationally representative samples of U.S. students. Tai et al. (2010) used a nationally representative sample of eighth graders in 1988, and Jewett (2019) used a nationally representative sample of ninth graders in 2009. These are the same two studies that also measured whether students actually chose a STEM major in college rather than using prospective measures (an expectation of majoring in STEM) as Warne et al. (2019) and Sadler et al. (2014) used in their studies.
The Current Study
Given that there are four studies that have taken prior interest in STEM into account (as well as other covariates that are likely related to preexisting differences) and that two of them find evidence for Model A and two find evidence for Model B, further research on the importance of AP STEM coursetaking and its relationship to STEM college and occupational outcomes seems clearly warranted.
As noted previously, the central research question examined is whether or not AP STEM coursetaking is related to choosing a STEM major in college and to the expectation of being in a STEM occupation, taking into account prior experience with and interest in science, technology, engineering, and mathematics along with other relevant covariates. That is, does the data support Model B or Model A?
The current study contributes to research examining the role of STEM AP coursetaking and its relationship to choosing a STEM major and expecting to be in a STEM occupation at age 30 in three important ways. First, we use a nationally representative dataset—HSLS:09—the data of which are considerably more recent than those by any of the other investigators. Recall that Tai et al. (2010) expressed concern about the validity of their findings given that they used the NELS:88 dataset. Second, our key study variables were collected longitudinally—for example, measures of prior career interest and mathematics achievement were collected when students were actually in ninth grade—rather than being based on college students’ recollections of their ninth-grade career interest and achievement, and coursetaking data were based on school-provided transcripts rather than student self-reports, providing for increased reliability and less recall bias than in cross-sectional studies. Finally, we needed a method that could mitigate or eliminate the bias due to possible confounding factors (factors that affect both course selection and our outcomes) and therefore employed propensity scoring methodology (PSM) with covariate balancing. In using this methodology, we included variables that we believed could account for prior interest in STEM as well as other relevant covariates. Nonetheless, there is no way with a nonexperimental design to be certain that bias has been totally eliminated. As a result, and as indicated previously, we cannot make claims of causality.
Methods
Data
The data for the current study come from the National Center for Education Statistics (NCES) restricted-use data files of HSLS:09, which was based on a nationally representative sample of first-year high school students. 5 A key goal of HSLS:09 is to enable researchers to examine “the nature of the paths into and out of science, technology, engineering, and mathematics (STEM) curricula and occupations; and the educational and social experiences that affect these outcomes, decisions, and experiences.” 6 The data used in this study come from four data collections of HSLS:09: the base-year collection; the 2013 update, high school transcript data; and the second follow-up in 2016. The base-year study sampled approximately 950 high schools and approximately 25,200 eligible students. 7 The base-year data were collected in 2009 when the students in the study were in grade 9; the 2013 update also includes student transcripts, which were collected from high schools after most students had graduated in 2013; and the second follow-up data were collected in 2016, when most students attending four-year colleges were in their third year. Data from the first follow-up were not used in this study.
In addition to extensive survey data collected from students in 2009 (including data on prior activities related to STEM), students also completed algebra assessments at grades 9 and 11. However, not all students completed both the survey and the algebra test, thus reducing the base-year sample to about 23,320 students. Of these, 79% participated in the first follow-up in 2012, 83% had high school transcripts, and 75% participated in the second follow-up in 2016. The students who participated in the second follow-up in 2016 were asked if they were enrolled in college and, if so, what their major was as well as their likely occupation at age 30. The sample size for this set of students is about 13,430. Analyses that focus on whether students majored in a STEM subject included only those who were enrolled in a 2- or 4-year college at the time of the second follow-up in 2016, yielding a sample size of about 10,130 students. 8
Dependent Variables
The study has eight dependent variables that capture four categories of the various STEM majors and four categories of the various expected STEM occupations. The HSLS:09 second follow-up recorded detailed information on college major chosen as well as occupational categories for students’ expected occupations at age 30. This information allowed us to develop the four analytical categories for STEM majors and expected STEM occupations: medicine and health; biology, life science, and agriculture; physical science and engineering; and mathematics and computer science. Appendix Tables B1 and B2 display the coding used for the four HSLS:09 STEM occupational and four STEM major variables, respectively. Tables 2 and 3 show the observed percentages and frequencies for each of the four categories of STEM majors and expected STEM occupations, respectively.
Weighted Percentages and Frequencies of STEM Major Choice in 2016
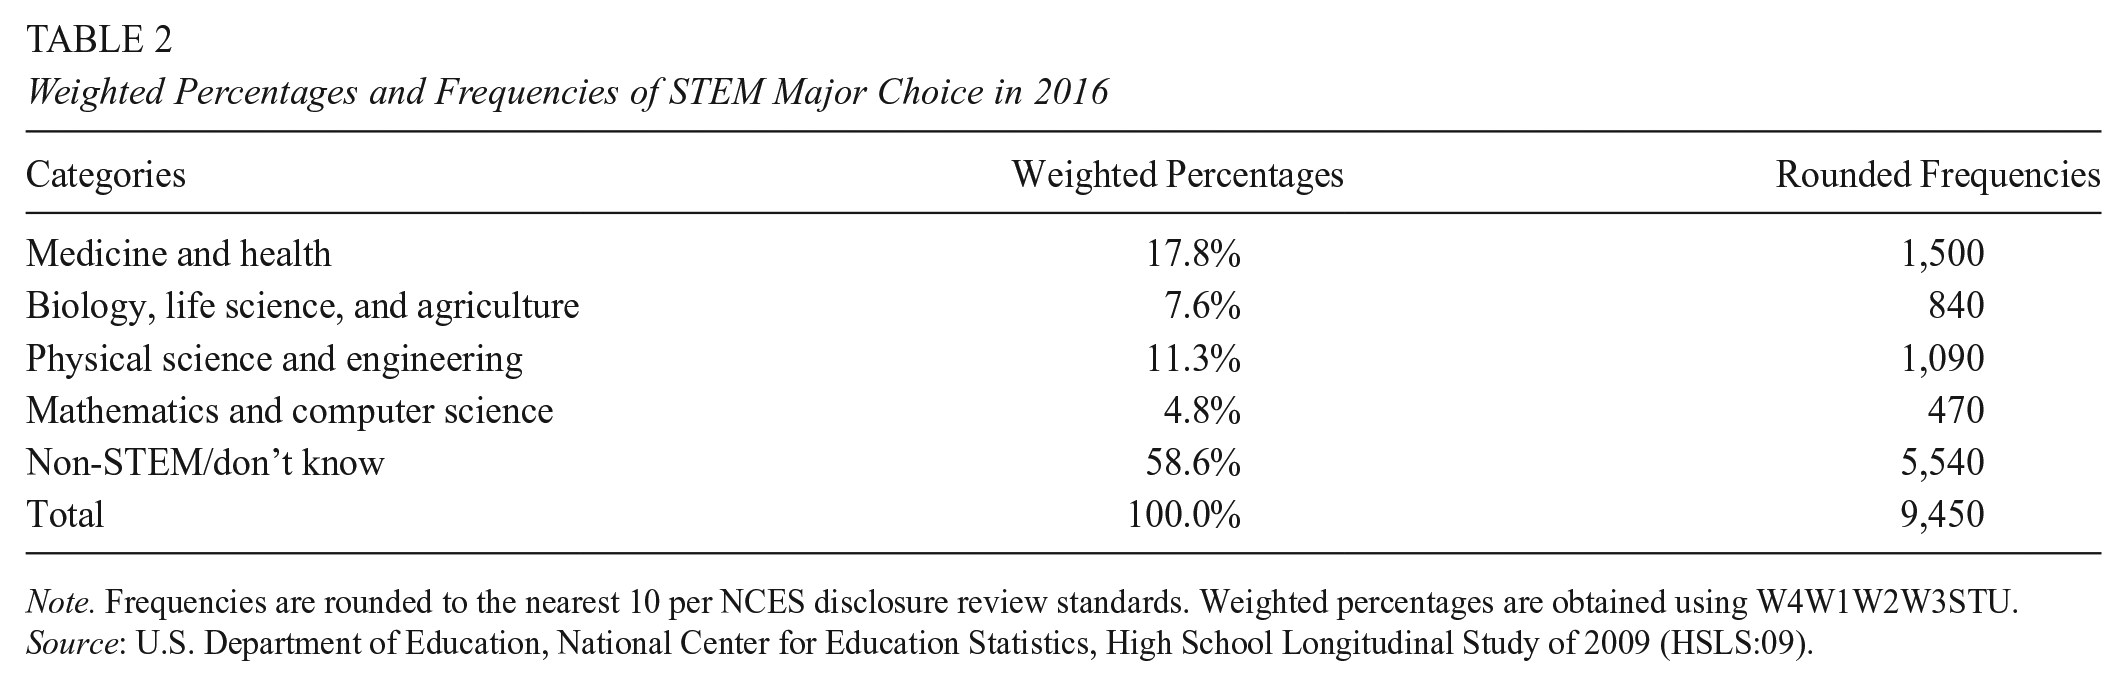
Note. Frequencies are rounded to the nearest 10 per NCES disclosure review standards. Weighted percentages are obtained using W4W1W2W3STU.
Source: U.S. Department of Education, National Center for Education Statistics, High School Longitudinal Study of 2009 (HSLS:09).
Weighted Percentages and Frequencies of Expected STEM Occupation at Age 30 in 2016

Note. Frequencies are rounded to the nearest 10 per NCES disclosure review standards. Weighted percentages are obtained using W4W1W2W3STU.
Source: U.S. Department of Education, National Center for Education Statistics, High School Longitudinal Study of 2009 (HSLS:09).
Independent Variables
There are five independent variables—two of which represent taking an AP mathematics course (AP calculus and AP statistics) and three of which are for AP science courses (AP biology, AP chemistry, and AP physics)—that were coded using school-provided transcript data from the HSLS:09 2013 update. HSLS:09 classified the courses that students took using the NCES School Courses for the Exchange of Data (SCED) system, thereby providing a uniform classification of courses across schools. Using the SCED codes for classes identified as AP mathematics or AP science, we created five AP coursetaking variables. 9 It should be noted that the HSLS:09 coding combines AP and International Baccalaureate (IB) courses. However, since IB courses represent only about 0.5% of the courses taken, we labeled all five of the independent variables as “AP.” Dummy variable coding was applied to the five independent variables, with values coded as 1 if a student took the AP/IB course and 0 if not.
Possible Confounders (Control Variables)
To estimate the impact of AP coursetaking, it is important to consider possible prior experiences with and interest in STEM as well as other variables that might capture important preexisting differences between those who take AP mathematics or science courses and those who do not. We labeled these variables as “possible confounders” since they could be assumed to be related to both coursetaking and selecting a STEM major or occupation. Examples of two such possible confounders are an expressed interest in a STEM career in grade 9 and student performance on the HSLS:09 grade 9 algebra assessment. The former is a direct measure of prior interest in STEM, and the latter is important because many STEM courses require strong mathematics skills. For example, Chen (2009) found that students pursuing a STEM career are more likely to have taken advanced mathematics in high school. Rose and Betts (2001) and Cribbs et al. (2015) also note that career success in science, technology, and engineering depends upon one’s mathematics skills.
We also included other measures of science and mathematics interest, self-efficacy, utility, and identity—components of expectancy value theory (Eccles, 2005; Eccles et al., 1983; Wigfield & Eccles, 2000) as well as social cognitive theory (Bandura, 1977, 1986, 1994, 1997). All have been shown to be related to STEM outcomes (Lent et al., 2010) and all were measured as part of the HSLS:09 student survey. Each of these variables can be thought of as an important motivator or a motivational belief that could lead to choosing to take AP mathematics or science courses and, as such, are possible confounders to be taken into account in our analyses.
HSLS:09 constructed eight indices with satisfactory internal consistency reliabilities as measured by Cronbach’s alpha (Cronbach, 1951): mathematics interest (α = 0.75), science interest (α = 0.73), mathematics self-efficacy (α = 0.90), science self-efficacy (α = 0.88), mathematics utility (α = 0.78), science utility (α = 0.75), mathematics identity (α = 0.84), and science identity(α = 0.83). All were measured in the fall of students’ first year in high school, prior to completing any courses at the high school level.
Also included were measures of prior participation in a mathematics or science club or a mathematics or science competition, attendance at a mathematics or science camp, and whether students had a mathematics or science tutor prior to high school attendance. Each of these activities can be thought of as proxies for having a prior interest in STEM, because exposure to nonformal mathematics and science activities (both inside and outside of school) has been shown to be related to the choice of a STEM-related career (Gottfried & Williams, 2013; Williams & Gottfried, 2010). Also included as a possible confounder was whether the student’s father, mother, or both were in STEM occupations, a variable that has been shown to be related to the choice of a STEM major (Tilbrook & Shifrer, 2022).
Finally, students’ sociodemographic backgrounds were also taken into account by including controls for gender, race/ethnicity, family socioeconomic status (SES), and family poverty. A 2021 report from the National Science Foundation shows that the percentage of scientists, engineers, and other skilled workers varies significantly by gender, race, and ethnicity (National Science Foundation, 2021), and a longitudinal study by Betancur et al. (2018) shows how gaps in children’s science achievement vary by parental education and income. Finally, using data collected in Australia, a study by Cooper and Berry (2020) shows that low SES is the most significant barrier to having a STEM career.
Table 4 contains a list of all of the covariates along with a full description of each and the percentage of missing data associated with each.
Description of the Covariates

Source: U.S. Department of Education, National Center for Education Statistics, High School Longitudinal Study of 2009 (HSLS:09).
Multiple Imputation
To address the issue of missing data, multiple imputation using chained equations (MICE) was employed to simultaneously impute missing values, taking into account the types of variables (e.g., binary, multinomial, ordinal, or continuous) in the sample (Little & Rubin, 2019). 10 A total of five datasets was generated and used for the study’s analyses. The effects of multiple imputation on the means and standard deviations of the variables used for the prediction of choosing a STEM major and a STEM occupation can be seen in Appendix B, Tables B3 and B4.
Propensity Score Modeling
A student’s decision to take an AP course is often based on characteristics and factors that are related to academic proficiency and academic-related outcomes, including the choice of a college major. Failing to account for factors that are related both to coursetaking and achievement-related outcomes can result in biased estimates when examining the relationship between the two. For example, high mathematics ability or motivation at the start of high school may increase both the likelihood of enrolling in an AP course and the likelihood of choosing a STEM major or profession for many students.
That is, students who took AP courses are likely to differ on average from students who did not take AP courses with respect to factors that are also related to student outcomes. To deal with this, we employed propensity score methods (Rosenbaum & Rubin, 1984) designed to reduce selection bias in comparing outcomes by identifying and accounting for such similarities to the extent that they are observable in the data. A propensity score (e.g., the probability of STEM AP coursetaking) was computed for each student for each of the AP courses based on the possible confounders shown in Table 5—variables that are likely related to both AP coursetaking and student outcomes—using the following statistical model:

where
Mean Differences in Standardized Covariates Before and After Covariate Balancing

Note. Analyses are weighted using W4W1W2W3STU.
Source: U.S. Department of Education, National Center for Education Statistics, High School Longitudinal Study of 2009 (HSLS:09).
The propensity scores computed from this model were used as the foundation for inverse probability of treatment weighting (IPTW) (Austin & Stuart, 2015; Dehejia & Wahba, 2002; Joffe & Rosenbaum, 1999; Rosenbaum & Rubin, 1984; Rubin, 2006). When the weights created in IPTW are used, the treatment and the comparison conditions are on average similar in their observables. Compared to classical propensity score-matching methods, the propensity score-weighting approach used here is particularly attractive because it retains the original sample size (Guo et al., 2020). This is important because the original sample represents the target population, and the loss of sample observations due to matching or resampling would affect the sample’s representativeness. Therefore, for our purposes, we computed average treatment-on-treated (ATT) weights that allowed for the computation of the effect of students taking a given AP course (i.e., AP calculus or science) on a given outcome (e.g., majoring in medicine or health) compared with students who did not take the AP course. The treated students were given a weight of 1, whereas the comparison students had a weight of

where
Because the data were collected through a survey sampling methodology, the IPTW weights were multiplied by the HSLS:09 survey weights to create the final weights:

where
To test for the differences in outcomes between students who took a given AP course and those who did not, a separate logistic regression model of the following form was run for each of the eight dependent variables:

Covariate Balancing
Using the methodology mentioned previously, we tested the differences between students who took a specific AP course (e.g., AP calculus) and those who did not before and after covariate balance weighting. We standardized the differences between these two groups for each of the observable characteristics that were used in the propensity score model. The results from these analyses are shown in Table 5. Across all AP courses, we found that the preexisting differences between those students who took the AP course and those who did not diminished substantially after weighting. After weighting, all the differences were lower than two-tenths of a standard deviation, and nearly all were below one-tenth of a standard deviation. Therefore, we expect the effects of confounding associated with these variables to be substantially reduced, if not eliminated, in our weighted estimates.
This approach, of course, can only account for observed variables. Unobserved confounders may still bias our estimates, to the extent that they are uncorrelated with our observed confounders.
Results
Table 6 shows the relationships between enrollment in AP mathematics and science courses for all eight dependent variables where the outcomes are expressed as odds ratios.
Odds Ratio Estimates of the Relationship Between AP Coursetaking and STEM-Related Outcomes, With Propensity Score Adjustment
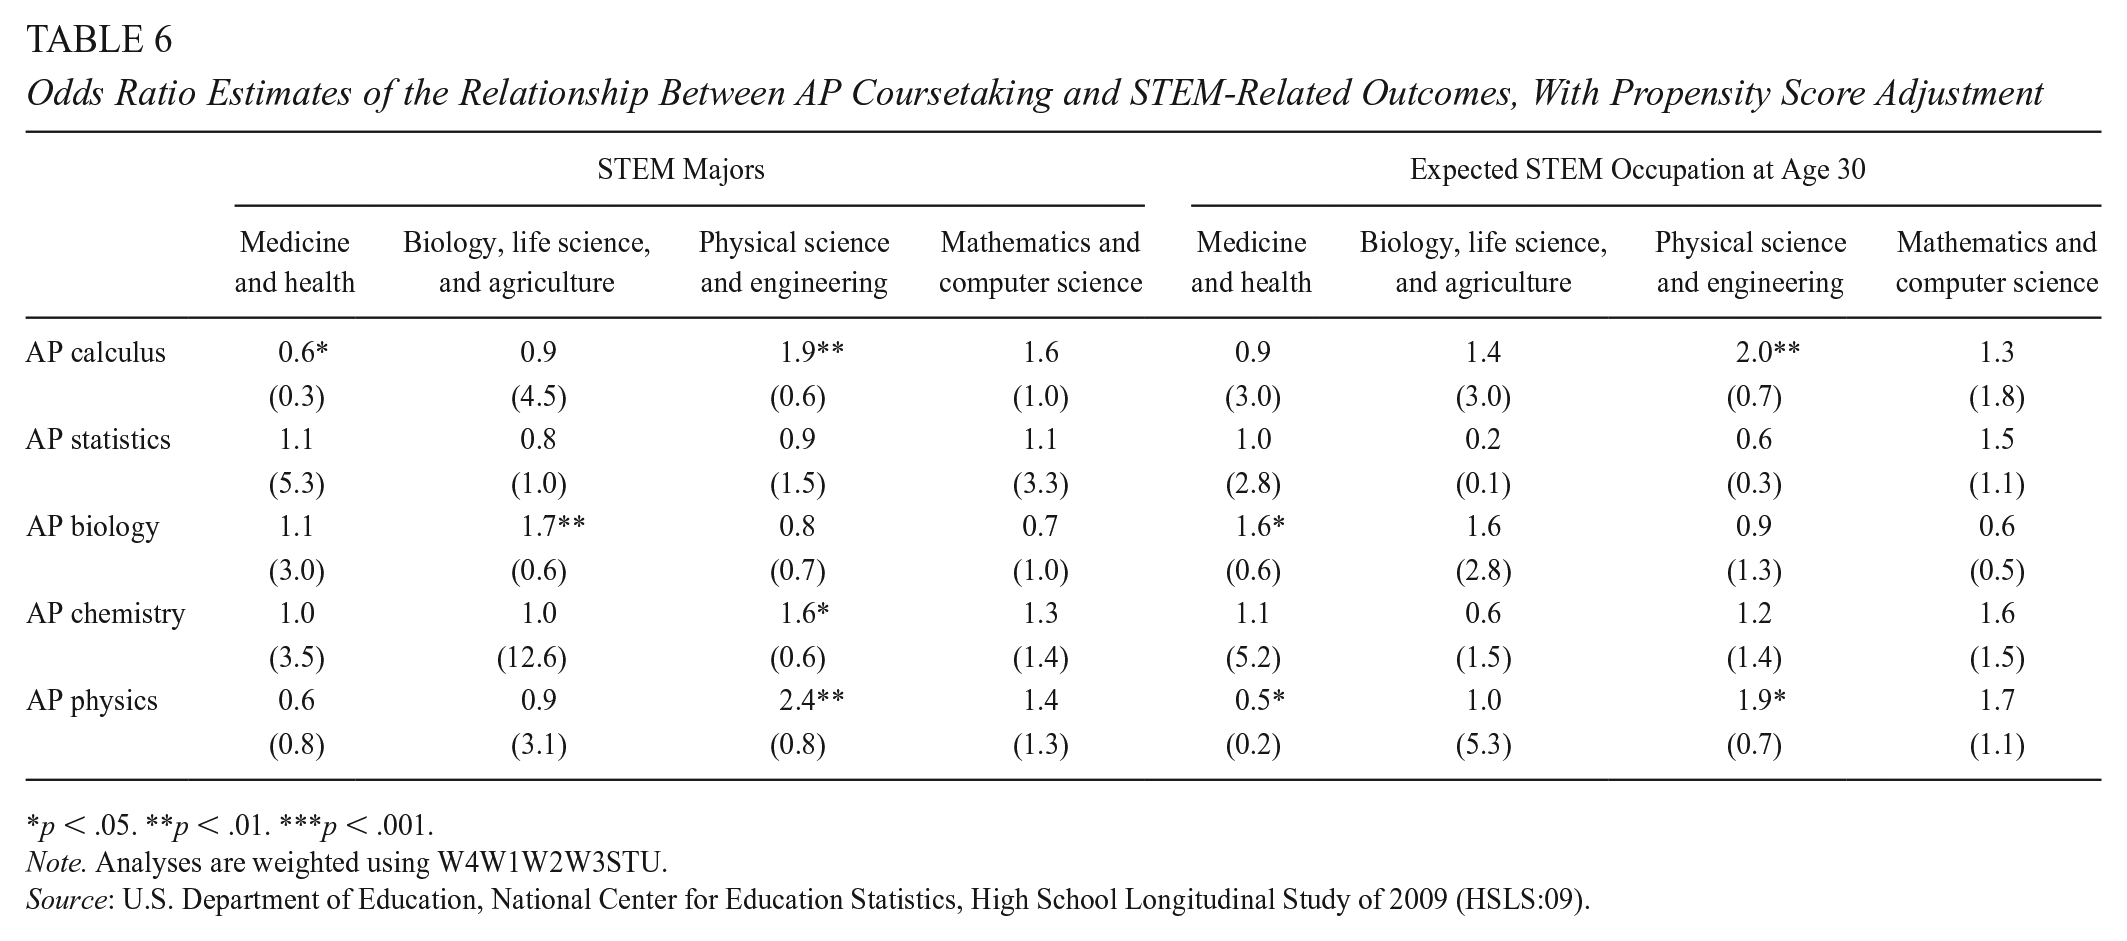
p < .05. **p < .01. ***p < .001.
Note. Analyses are weighted using W4W1W2W3STU.
Source: U.S. Department of Education, National Center for Education Statistics, High School Longitudinal Study of 2009 (HSLS:09).
AP Calculus
Concentrating first on the relationships between taking AP calculus and choosing a STEM major or expecting to be in a STEM career at age 30, meaningful relationships were seen with both choosing a major in the physical sciences or engineering and/or expecting to be in a career in one of these fields. More specifically, the odds of choosing a major in either of these fields for a student taking AP calculus, taking into account prior background interest and other potential confounders via propensity score adjustment, are about twice as great (1.9) as they are for a student not taking AP calculus. Similarly, the odds of expecting to be in a career at age 30 in either the physical sciences or engineering for a student taking AP calculus are roughly twice as great (2.1) as they are for a student not taking AP calculus. The other significant relationship is with choosing a major in medicine or health, where the relationship is negative, though not particularly strong. The odds of choosing a major in either of these fields if one has taken AP calculus are 0.6, meaning that the odds are greater for choosing one of these fields if one has not taken AP calculus (1.4).
The relationships between taking AP calculus and choosing a major or expecting to be in a career by age 30 in biology, the life sciences, or agriculture or in mathematics or computer science were not statistically significant, nor was taking AP calculus significantly related to expecting to be in a career in medicine or health by age 30.
AP Statistics
The second row in Table 6 shows the relationship between AP statistics and majoring in or expecting to be in a career in a STEM field. As can be seen, none of the relationships were statistically significant. Because statistics as a major is not measured in the dataset, the import of taking AP statistics for majoring in statistics is best thought of as untested in this study.
AP Biology
The results for taking AP biology are shown in the third row of Table 6. Two statistically significant results were found. First is its relationship to majoring in biology, the life sciences, or agriculture, where the odds of doing so are 1.7 times greater than for those students not taking AP biology, taking into account prior background interest and other potential confounders. Second is its relationship to choosing an occupation in medicine or health, where the odds of doing so are 1.6 times greater than for someone who did not take AP biology. That taking AP biology should have a net positive relationship with majoring in biology, the life sciences, or agriculture makes sense as does its relationship with expecting to be in a career in medicine or health at age 30, given that medicine and health are based in biology and the life sciences. Finally, it makes sense that taking AP biology would be statistically unrelated to the other outcomes, such as majoring in or expecting to be in an occupation in the physical sciences, engineering, mathematics, or computer science, as was found.
AP Chemistry
As can be seen in the fourth row in Table 6, there was only one statistically significant relationship between taking AP chemistry and the various outcomes and that was with majoring in the physical sciences or engineering, where the odds of doing so are 1.6 times greater than for a student who did not take AP chemistry, again, taking into account prior background interest and other potential confounders. This finding also makes sense in that chemistry is a physical science and one of the fields in engineering is chemical engineering.
AP Physics
The effects of taking AP physics are similar to those associated with taking AP calculus, as can be seen from the last line in Table 6. Both the pattern of results and the size of the effects are similar as evidenced by the fact that taking AP physics is significantly related to majoring in the physical sciences or engineering and/or expecting to be in a career in one of those fields at age 30. The odds ratios are also quite similar: the odds of choosing a major in either the physical sciences or engineering are over twice as great (2.4) for a student taking AP physics than for a student not taking it. And the odds of expecting one will be in a career at age 30 in either the physical sciences or engineering, given that one has taken AP physics, are roughly two times greater (1.9) than for someone who has not taken AP physics. Finally, taking AP physics had a slightly negative but statistically significant relationship with expecting to be in an occupation in medicine or health at age 30.
Discussion
Recall that Model B implies a direct relationship between AP STEM coursetaking and majoring in a STEM field and/or expecting to be in a STEM career at age 30, whereas Model A does not assume a direct path from AP STEM coursetaking to majoring in a STEM field and/or expecting to be in a STEM career at age 30. Because in most cases there is a direct relationship between a given STEM AP course and its most closely affiliated major(s) and expected occupation (as well as to closely affiliated majors or occupations), the data favor Model B over Model A. Take AP biology as an example. Taking AP biology was found to be significantly related to choosing a major in biology, the life sciences, or agriculture and being in an occupation in medicine or health at age 30 but was not statistically significant in its relationship to other STEM majors and occupations. The relationship between taking AP biology and expecting to be in the medical or health fields at age 30 makes sense given that the foundations of both fields rely heavily on biology.
Similar results were found for AP calculus. When taking into account previous interest and other preexisting differences, taking AP calculus was significantly related to choosing a major in the physical sciences or engineering and expecting to be in an occupation in one of these fields at age 30 but was unrelated to choosing a major or expecting to be in an occupation in other STEM fields. Although the data from this study do not explain why AP calculus is important for majoring in the physical sciences or engineering, the most likely explanation has to do with the demands for mathematics knowledge needed to successfully major in either, because much of engineering and physics is based on mathematics models (see, e.g., Harris et al., 2015; Hirst et al., 2004). That is, this result also makes sense.
As further evidence favoring Model B, taking AP chemistry was found to be related to choosing a STEM major in the physical sciences, and taking AP physics was related to choosing a major in the physical sciences or engineering as well as expecting to be in an occupation in one of those fields at age 30. However, taking AP chemistry or AP physics was unrelated to choosing any other STEM major or occupation with the exception of a small negative relationship with expecting to be in an occupation in the medical or health fields at age 30 for those taking AP physics. These results also seem sensible since both chemistry and physics are physical sciences, and one of the subspecialties within engineering is chemical engineering.
Importantly as well, the results of the current study align quite well with those of Tai et al. (2010), who found that the odds of majoring in the physical sciences or engineering were about four times greater for someone taking AP calculus than for someone not taking it. They also found that the odds of majoring in the sciences were about twice as high for someone taking AP science (where AP biology, chemistry, physics, and mechanics were aggregated) than for someone not taking AP science. Although these odds are larger than those that were found in the current study, they are not implausible. Why? First, Tai et al.’s study predated the explosion in AP coursetaking, and the authors were explicit in noting that their results might not hold for more current populations. Second, besides student sociodemographics, there were only two other covariates in their model—academic achievement and whether students expected to be in a STEM occupation, as measured in the eighth grade—which might account for the larger odds.
Most important is the almost identical pattern of results from our study and Tai et al. (2010). Significantly, both Tai et al. (2010) and the current study were initially based on samples of students who were randomly chosen to be representative of U.S. eighth graders in the case of Tai et al. and ninth graders in the case of our study. And as noted previously, Jewett (2019)—who found that the number of AP STEM courses taken was related to choosing a STEM major—also used the HSLS:09 nationally representative sample of ninth graders. Furthermore, the current study as well as those of Tai et al. (2010) and Jewett (2019) measured actual majors chosen rather than relying on expected majors, as was the case in the Warne et al. (2019) and Sadler et al. (2014) studies.
Taken together, these results suggest that AP coursetaking is of substantial importance to the “STEM pipeline.” The odds of choosing a STEM major or expecting to be in a STEM occupation at age 30 are 1.6 and 2.4 times greater for someone taking an AP mathematics or AP science course compared to someone not taking one, taking into account previous interest in STEM and other relevant covariates. 11 Although the observed effects are nontrivial, there are several likely reasons why the effects were not larger than those observed. One, there are several reasons why students may take AP STEM courses in high school. One is access to better and more experienced teachers or to increase students’ self-confidence (as mentioned in Warne et al., 2019); another is trying to impress college and university admissions committees with one’s academic prowess. 12 Or students could be responding to parent, teacher, or peer pressure to take STEM AP courses. But none of these factors contradict the positive relationships observed between AP STEM coursetaking and majoring in a STEM discipline or expecting to be in a STEM occupation at age 30.
Conclusion
An important strength of the current study is that the results are based on HSLS:09—a nationally representative longitudinal study. A second strength of this study is that it combines (a) student-supplied survey data in the first year of high school and (b) high school transcript data that documents what STEM courses were taken as well as grades earned with (c) student-supplied survey data in what for most who have gone to college will be their junior year, by which time the vast majority will have had to have declared a major. That is, the current study relies on actual rather than prospective data, thereby increasing the validity of its results. Nevertheless, additional research is needed to determine whether the relationships observed hold for demographic characteristics such as sex, socioeconomic status, and race/ethnicity and their intersectionality.
But it is also important to repeat that in the absence of a true experimental design, the results cannot be claimed as demonstrating a causal relationship between AP STEM coursetaking and choosing a STEM major or expecting to have a STEM occupation at age 30. Although an effort was made to include a range of possible confounders that could have otherwise explained these relationships, it is possible that had other candidate confounders been included, the relationships could have either been attenuated or eliminated. But given the wide range of the confounders included in the model, any large-scale changes in the relationships observed seem unlikely. It also needs to be mentioned that one other threat to the validity of the findings reported here is that the relationships observed could change over time due to changes in policies related to AP coursetaking, the content of the AP courses, or the population of students taking them. These cautions suggest the need for continuing research with new data sets over time.
Finally, the findings from this study demonstrate the importance of replication for education research. As noted by Makel and Plucker (2014): “If education research is to be relied upon to develop sound policy and practice, then conducting replications on important findings is essential to moving toward a more reliable and trustworthy understanding of educational environments” (p. 313). We believe this study moves us toward that goal.
Footnotes
Appendices
Appendix B
Descriptive Statistics for the Covariates Used in the STEM Occupation Analysis Before and After Imputation

| Missing Rate | Before Imputation | After Imputation | |||
|---|---|---|---|---|---|
| Variable | Mean | SD | Mean | SD | |
| Poverty | 15.46 | 0.19 | 0.39 | 0.19 | 0.39 |
| Math/science club | 2.54 | 0.05 | 0.21 | 0.05 | 0.21 |
| Math/science competition | 2.54 | 0.06 | 0.23 | 0.06 | 0.23 |
| Math/science camp | 2.54 | 0.01 | 0.11 | 0.01 | 0.11 |
| Math/Science tutor | 2.54 | 0.06 | 0.24 | 0.06 | 0.24 |
| Female | 0.00 | 0.50 | 0.50 | 0.50 | 0.50 |
| Black | 0.00 | 0.14 | 0.34 | 0.14 | 0.34 |
| Hispanic | 0.00 | 0.22 | 0.42 | 0.22 | 0.42 |
| Asian | 0.00 | 0.04 | 0.19 | 0.04 | 0.19 |
| Multiple race | 0.00 | 0.08 | 0.27 | 0.08 | 0.27 |
| Other race | 0.00 | 0.01 | 0.11 | 0.01 | 0.11 |
| Read science books | 1.97 | ||||
| Never | 0.65 | 0.48 | 0.65 | 0.48 | |
| Rarely | 0.12 | 0.32 | 0.12 | 0.32 | |
| Hours of video games | 6.11 | ||||
| Less than 1 hours | 0.16 | 0.37 | 0.16 | 0.36 | |
| 1 to 2 hours | 0.20 | 0.40 | 0.20 | 0.40 | |
| No homework done | 2.26 | ||||
| Never | 0.70 | 0.46 | 0.70 | 0.46 | |
| Rarely | 0.18 | 0.39 | 0.19 | 0.39 | |
| No paper | 2.44 | ||||
| Never | 0.43 | 0.50 | 0.44 | 0.50 | |
| Rarely | 0.48 | 0.50 | 0.48 | 0.50 | |
| No books | 2.52 | ||||
| Never | 0.43 | 0.49 | 0.43 | 0.49 | |
| Rarely | 0.53 | 0.50 | 0.53 | 0.50 | |
| Late to class | 2.48 | ||||
| Never | 0.52 | 0.50 | 0.52 | 0.50 | |
| Rarely | 0.46 | 0.50 | 0.46 | 0.50 | |
| Occupation at age 30 in grade 9 | 5.74 | ||||
| Medicine/health | 0.21 | 0.41 | 0.21 | 0.40 | |
| Biology/life science/agriculture | 0.02 | 0.13 | 0.02 | 0.13 | |
| Physical science/engineering | 0.10 | 0.30 | 0.10 | 0.30 | |
| Mathematics/computer science | 0.02 | 0.13 | 0.02 | 0.13 | |
| Parent occupation STEM | 16.43 | ||||
| One parent | 0.18 | 0.38 | 0.18 | 0.38 | |
| Both parents | 0.03 | 0.16 | 0.02 | 0.15 | |
| Mathematics identity | 2.09 | 0.05 | 1.00 | 0.04 | 1.01 |
| Science identity | 2.20 | 0.03 | 0.99 | 0.03 | 0.99 |
| Mathematics efficacy | 11.80 | 0.04 | 1.00 | 0.02 | 0.99 |
| Science efficacy | 18.37 | 0.02 | 0.98 | 0.00 | 0.97 |
| Grade 9 algebra score | 1.04 | −0.01 | 0.95 | −0.01 | 0.95 |
| Socioeconomic status | 0.00 | −0.07 | 0.76 | −0.07 | 0.76 |
| Mathematics utility | 11.79 | 0.02 | 1.00 | 0.02 | 1.00 |
| Mathematics interest | 13.38 | 0.03 | 0.99 | 0.03 | 1.00 |
| Science utility | 18.25 | 0.01 | 1.00 | 0.00 | 1.00 |
| Science interest | 19.79 | 0.02 | 1.01 | 0.00 | 1.01 |
| X1SES | 0.00 | 0.59 | 1.25 | 0.59 | 1.25 |
| Occupation at age 30 in grade 9: Medicine/health | 5.74 | 0.16 | 0.37 | 0.16 | 0.37 |
| Occupation at age 30 in grade 9: Biology/life science/agriculture | 4.00 | 0.01 | 0.10 | 0.01 | 0.10 |
| Occupation at age 30 in grade 9: Physical Science/engineering | 4.00 | 0.08 | 0.27 | 0.08 | 0.27 |
| Occupation at age 30 in grade 9: Mathematics/computer science | 4.00 | 0.02 | 0.14 | 0.02 | 0.14 |
Source: U.S. Department of Education, National Center for Education Statistics, High School Longitudinal Study of 2009 (HSLS:09).
Acknowledgements
The authors thank the reviewers and the editors as well as Markus Broer, Michael Garet, and Alan Ginsburg for their useful comments on earlier drafts of the paper.
Correction (February 2024):
Article updated to correct an error in the introductory paragraph.
Notes
Authors
GEORGE W. BOHRNSTEDT is a senior vice-president and Institute Fellow at the American Institutes for Research. His recent research interests include understanding the role of academic identities on STEM educational outcomes and the effects of teacher-student racial match on student performance.
BURHAN OGUT is a principal researcher at American Institutes for research. His research focuses on utilizing quasi-experimental methods and predictive analytics to identify factors associated with the transition into postsecondary education.
DARRICK YEE is a senior researcher at American Institutes for Research. He has a broad background in policy-related research and methodological expertise in causal inference, multilevel modeling, and educational measurement.
YIFAN BAI is a researcher at American Institutes for Research. Her primary scholarly interests focus on understanding factors related to children’s achievement in the United States and other countries.