
Abstract
Arizona shifted to using current-year enrollment, instead of prior-year enrollment, as the basis for determining state aid for school districts following the passage of Arizona Education Finance Amendment (AEFA) in 2017. This study examines the short-term effects of AEFA implementation on school inputs—namely, expenditures and district personnel, particularly teachers. We find that the average district does not seem to respond to AEFA. However, our heterogeneity analyses reveal that the highest-income districts significantly reduce more inputs than the lowest-income districts in response to AEFA. The differential impact between these two groups is most evident in instructional expenditures, administration expenditures, total full-time equivalent teachers, and particularly teachers with 1–5 years of experience.
Keywords
Introduction
State aid plays a significant role in financing education for the majority of U.S. states, including Arizona. According to the most recent data from the Digest of Education Statistics (DES), state education aid comprised an average 50.1% of local school districts’ total revenue in 2019, with Arizona’s share at 49.1%. 1 Since 1980, Arizona has based its education aid on district enrollment. Before 2017, state education aid to school districts was based on their prior-year enrollment—a popular form of “hold-harmless” provisions in state education aid (Center for Public Education, 2021). Under the Arizona Education Finance Amendment (AEFA) since 2017, the state has used a school district’s current-year enrollment to determine its state aid. Although Arizona’s state education aid has always been based on current-year numbers in years of enrollment growth, AEFA removed the hold-harmless feature for districts with enrollment declines since 2018 (after a grace year with state backfill in 2017).
Figure 1 shows that public school enrollment in Arizona started to decline sharply at the beginning of the Great Recession in 2008 until 2012, when enrollment leveled off. The negative slope between 2012 and 2020 is much flatter than that between 2008 and 2011. Although 2012 is the start of a relatively steadier period of total enrollment in Arizona, 96.8% of school districts in our sample experienced annual enrollment declines at least once during this period of 2012–2020. Also, during the pre-AEFA (2012–2017) and post-AEFA (2018–2020) periods, the shares of enrollment decline occurrences are unchanged at 54% and higher than those of enrollment growth. This suggests state aid cuts in more than half of the postperiod district years. However, no study has ever been conducted to estimate the effects of AEFA on school districts’ expenditures and personnel. This study seeks to fill this gap in the literature.

Total state trend of enrollment in public schools during 2006–2020.
This study straddled two lines of inquiry. Studies in the first line of inquiry examined the effects of enrollment changes on school inputs. These studies were, however, published decades ago (Cavin et al., 1985; Edelman & Knudsen, 1990). The second line of inquiry examined the relationship between state aid and school expenditures. When state aid is largely determined by enrollment, school district expenditures may vary according to enrollment-induced fluctuations in state aid. Several studies have found that school districts with increased state aid spent more (Card & Payne, 2002; Lafortune et al., 2018; Nguyen-Hoang & Yinger, 2014; Roy, 2011).
This study makes three contributions to the literature on education finance and policy. First, this study is the first to examine the short-term effects of AEFA three years after its full implementation and thus supplements the scant literature on the effects of enrollment changes on school inputs. Second, this is the first study to examine not only the enrollment effects statewide on the average school district’s inputs but also the heterogeneity of the enrollment effects on different district groups. Third, to the best of our knowledge, our study is also the first to examine the enrollment effects on cuts to district personnel, particularly teachers, not only in terms of total numbers but also in terms of experience levels and educational credentials.
To make these three contributions, this study examines three research questions by using a difference-in-differences (DID) design. First, what are AEFA’s effects on school district expenditures, especially current expenditures, in both years of enrollment decline (decline years) and years of enrollment growth (growth years)? Second, do AEFA-induced effects on expenditures vary by income-based district types? Third, how does AEFA affect the dismissal of district personnel, particularly teachers, as a cost-saving measure? Of interest is how AEFA-induced effects are reflected in terms of teacher academic credentials and experience levels. Although we do not find evidence of AEFA’s impact on the average district, we find evidence of significant district group-specific variation in AEFA-induced cuts to instructional expenditures and teachers. For example, the highest-income districts cut instructional spending, total FTE teachers, and teachers with 1–5 years of experience significantly more than the lowest-income districts.
The remainder of this paper is organized as follows. The following section reviews the literature on how enrollment changes may affect education inputs—particularly in the context of state aid reforms—and provides background on the Arizona state aid policy and a framework for how enrollment changes affect state aid. Next, the paper presents the empirical strategies, data used in our analyses, and the results. Finally, the paper concludes with suggestions for future research.
Background
Related Literature
As indicated earlier, state aid—a major revenue source for K–12 education—has grown in importance over the past century. According to the data reported by DES, in FY1920, states contributed only 16.5% to school districts’ total revenue, whereas local sources accounted for 83.2%. State education aid rose significantly from 38% in 1972 to 49% in 1987, then fluctuated slightly in the 1990s before reaching 47% in 2004 (Murray et al., 2007). This average share of state aid to total revenue increased to over 50% in FY2018 and FY2019.
Given this important role of state aid, studies have estimated its effects on education expenditures. Many studies focus on increased state aid through school finance reform (SFR). For example, Steinberg et al. (2016) found that SFR in Pennsylvania did not increase school spending, especially among high-taxing districts; the authors argued that Pennsylvania school districts used state aid to provide property tax relief to their residents. However, studies of SFR in other states found that SFR-induced aid increases resulted in higher school spending and reduced interdistrict spending disparities, specifically in California (Fan & Liang, 2020), Massachusetts (Nguyen-Hoang & Yinger, 2014), and Michigan (Roy, 2011). Nationwide SFR studies have found evidence of the positive short-term effects of school expenditures (Lafortune et al., 2018).
In many states, state education aid changes with enrollment numbers, especially during growth years. In decline years, states may employ a hold-harmless provision under which state aid continues to be the same as that of the previous year despite the decline in enrollment. Scholars have argued that this hold-harmless provision competes with charter schools (Roza & Fullerton, 2013), violates the principle of horizontal equity (Fahy, 2011), and may produce racial disparities (Kelly, 2021). Gigliotti and Sorensen (2018) examined the effects of the hold-harmless provision in New York and found that this provision did not significantly affect instructional spending but did increase administrative spending.
In cases of state aid distribution without the hold-harmless provision, current-year, enrollment-based state aid per student to districts experiencing an enrollment decline is less than that of the previous year. Reduced aid puts fiscal pressure on these school districts because they can hardly reduce their input levels (and hence, their spending) quickly in the decline years. Therefore, state aid policies face the challenge of supporting school districts with enrollment declines while bolstering their motivation to adapt (Cavin et al., 1985).
Enrollment may have a direct effect on school spending in addition to its indirect state aid-induced effect. Enrollment has been a key variable in education cost studies (Duncombe & Yinger, 2011). Duncombe et al. (2015) showed that economies of size exist in education. In other words, when school district enrollment grows, expenditures per student can go down. Larger districts can save their fiscal resources by maintaining an administration system for a larger enrollment and taking advantage of mass procurement benefits (Duncombe et al., 2015).
Two studies examined how enrollment changes affected school spending directly (Cavin et al., 1985; Edelman & Knudsen, 1990). Cavin et al. (1985) showed a statistically significant negative relationship between enrollment changes and expenditures per student. Edelman and Knudsen (1990) argue that personnel layoffs necessary in decline years often affect less-experienced staff. Our third research question is to test whether AEFA induces school districts to cut less- vs. more-experienced teachers in decline years.
Financing K–12 Education in Arizona
Arizona’s current school funding system was developed based on a 1980 reform when the state aimed to equalize education funding among its school districts. Specifically, the amount of state aid a district receives for current use is the difference between an equalization base and its expected property tax effort. The equalization base consists of three components: base support level (BSL), transportation support level, and district additional assistance (mostly for capital spending purposes). The base support level is derived from the base level amount and a measure of enrollment referred to as the weighted student count (WSC). The base level amount is determined annually by the legislature and adjusted for inflation (Arizona Association of School Business Officials, 2017)—for example, $4,305.73 per pupil for FY2021. The WSC is derived by multiplying weighted student counts and enrollment determined by the average daily membership (ADM)—that is, the total enrollment of fractional (part-time) and full-time students, minus withdrawals of each day through the first 100 days of instruction. Weighted student counts vary depending on district size, distance to neighboring districts, grade ranges, English language learners (ELLs), and students with disabilities. 2
The second equalization base component, transportation support level, is based on approved average daily route miles driven in the district and its unweighted transportation-eligible student count. District additional assistance—the final element in the equalization base—is intended primarily for capital spending purposes but can be used for operational purposes. This assistance amount is determined by multiplying a district’s unweighted K–8 and 9–12 student counts with their respective annual set amounts.
The expected local tax effort is the product of a qualifying tax rate (QTR) set annually by the state and a school district’s assessed value. The QTR was $4,253 per $100 of taxable property for unified school districts in FY2018. While the state uses QTR to determine state aid, a district’s actual property tax rate may be higher or lower than the QTR. In addition, school districts can raise additional revenue from property taxes for transportation purposes up to the maximum of the transportation revenue control limit, which is equal to 120% of the transportation support level.
Enrollment is an important factor in the calculation of the three elements in the equalization base. Before the passage of AEFA in FY2017, the equalization base relied on prior-year enrollment. If a district experiences enrollment growth in the current year, additional state aid is provided in subsequent apportionments for the base support level but not for the transportation support level or district additional assistance (Arizona Department of Education, 2004). However, none of the three elements in the equalization base was adjusted downward for school districts with enrollment declines (Hunter & Gifford, 2000). This hold-harmless feature was intended to serve school districts experiencing either enrollment decline or growth.
Since AEFA’s passage in 2017, the state has continued to use previous-year enrollment to calculate district additional assistance. Yet, these other two elements—namely base and transportation support level—have been derived from current-year enrollment. However, in 2017, the state made a one-time backfill reservation of $31 million to compensate for the state aid loss of school districts with enrollment declines (Arizona Department of Education, 2017). In other words, the prior-to-current-year enrollment shift can be considered to have started in 2018. For ease of reference, we refer to the period starting in 2018 as the postperiod.
In addition to state aid, school districts in Arizona need to raise revenue locally, mostly from property taxes. Therefore, districts could raise local revenue to offset state aid cuts. We also examined if this is the case for districts in the state.
How Might AEFA Affect a District’s State Aid?
We assume, for simplicity, that the state aid a district receives in year
Effects of Enrollment Changes on Real Total State Aid

Notes:
Switching to current-year enrollment, AEFA might affect state aid in both decline and growth postperiod years. Under AEFA, school districts lose the previously described aid-stabilizing effect of prior-year enrollment (PYE), especially in cases of alternating enrollment changes. The aid a district receives in a postperiod decline year is always lower than the aid it received the previous year, regardless of whether the previous year was a growth or decline year (Cases 3a, 3b, and 5). State aid, especially the base support level, in growth years, is always based on current-year enrollment and thus should, in theory, not be affected by AEFA. Therefore, districts’ postperiod response to enrollment growth is plausibly expected to be similar to their preperiod response. However, their postperiod response to enrollment growth may be more muted than their preperiod response. Districts may go ahead with expenditure increases in a preperiod growth year because their state aid will stay unchanged in the case of enrollment decline the following year (Case 2a). This is not true in the postperiod because state aid will be immediately reduced in a decline year. Districts, therefore, may not want to increase as much spending in a postperiod growth year as in a preperiod growth year just to make a sizeable cut in the immediately following year of enrollment decline.
Empirical Strategy
We used a DID design on a panel of 190 Arizona school districts in our sample period of 2012–2020 to answer the three research questions. 3 Our DID estimation approach has three methodological challenges to a conventional DID design. First, while there tends to be a clear set of treatment and comparison units in a conventional DID design, AEFA—the treatment—applies to all school districts. All school districts in Arizona can therefore be considered treatment units. Second, a treatment in a conventional DID design usually occurs either once or multiple times but only in the postperiod. AEFA affects school districts through enrollment changes, and enrollment changes may occur both before and after AEFA was implemented. Third, while AEFA affects state aid in years of enrollment decline, state aid in growth years, especially the base support level, is based on current-year enrollment in both the pre- and postperiod. Therefore, one might consider decline years as treatment units and growth years as comparison units. However, as previously explained, growth years may not be entirely immune from the potential effects of AEFA. When districts lose the PYE-enabled aid-stabilizing buffer, they may increase inputs in postperiod growth years significantly less than in preperiod growth years. In other words, decline and growth years can plausibly be considered potential treatment units. Given these challenges, our empirical strategy is similar to an interrupted time-series design. The DID estimator captures the combined AEFA-induced effect on district inputs in both decline and growth years.
We employed various dependent variables for the research questions. In the following illustration, we show estimation equations for logged total school district current expenditures,
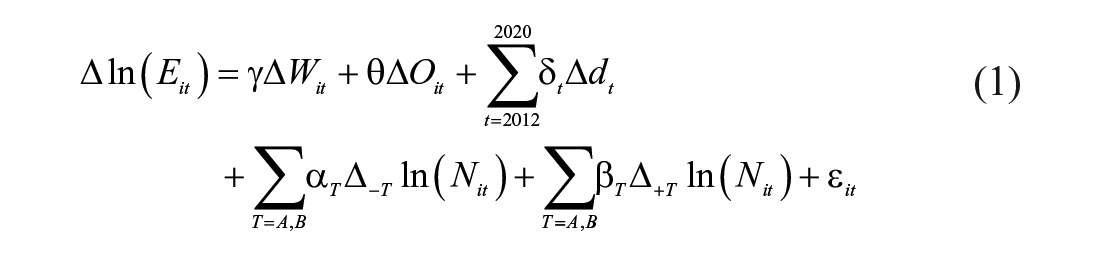
where subscript
Equation (1) includes a set of four key variables. For example,
Given these four variables (
Given the first differences (

where we switch the sign of
Valid causal interpretations of
The estimated elasticity coefficients of
Equation (2) is designed to find the combined AEFA-induced effect on the average school district in Arizona. However, we hypothesize that AEFA may induce differential effects depending on district types. For the second research question, we put districts into quartiles using each district’s average sample-period median household income (
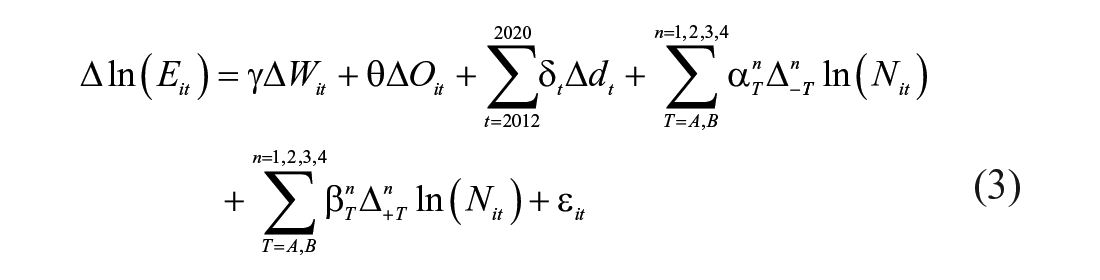
where superscript
Given that AEFA primarily affects state aid in decline years, we also conducted another series of postregression DID tests by comparing the post-pre decline differences of each group pair’s (
In addition to total current expenditures, we also employed other dependent variables—namely three categorical components of the current expenditures, capital spending, local revenue, and state aid. For the third research question, we employed the total number of full-time-equivalent (FTE) teachers, teacher aides (including paraprofessionals and short-term substitute teachers), and administrative personnel. Also, additional dependent variables are the total numbers of teachers with different experience levels and academic credentials (BA and MA degrees).
Summary Statistics
Table 2 provides the summary statistics and data sources we used for our estimations. The key dependent variable, namely total current expenditures (
Summary Statistics (2012−2020)

Notes: There are 190 school districts. Data sources are Arizona Department of Education (1), authors’ calculations (2), Small Area Income and Poverty Estimates (3), Common Core Data (4), and American Community Surveys (5). The Arizona Department of Education data on free and reduced-price lunch students, ELL students, and students with disabilities contain many missing observations. We, therefore, use data from source 3 as a proxy for the percentage of free and reduced-price lunch students. We also use data from source 4 for the percentage of ELL students and students with disabilities. The data from sources 1 and 4 on nonmissing observations of these two variables are similar. Additional summary statistics can be found in Table A1.
Fiscal-dependent variables are in millions of dollars. All financial variables (including median household income) are adjusted for inflation and in 2020 dollars using the Bureau of Economic Analysis government price indexes.
The annual enrollment change is
Enrollment is the key independent factor in our estimations. We used ADM as a measure of enrollment. In the previously discussed state aid formula, ADM captures the total enrollment of part-time and full-time students who attend schools within a school district’s boundary, minus any student withdrawals for each day through the first 100 days of instruction. The average enrollment of 4,706 does not reflect the substantial enrollment variation by income. The highest-income quartile’s average enrollment is four times larger than the average enrollment of the lowest-income quartile (9,158 vs. 2,275 in Table A1). Table 2 also shows that in both pre- and postperiods, the relative frequencies of enrollment decline and growth are consistently 53.9% and 46.1%, respectively. While the mean annual enrollment increase is 4% for both pre- and postperiods, the mean annual enrollment decrease in the postperiod is 3.5%, which is slightly less than 4.2% in the preperiod. Figure 2 shows the annual shares (relative frequencies) of school districts with enrollment decline. The share started at over 60.5% in 2013, dropped to 45.8% in 2015, and became stable at around 55% between 2016 and 2020. (Table A1 provides additional quartile-specific variations in mean annual enrollment decreases and increases.)

Annual shares of school districts with enrollment decline (2013−2020).
Table 2 shows that the average district has 256 FTE teachers, 77 FTE teacher aides, and nearly 17 FTE administrative people. Table A2 shows that teachers with 15 or more years of experience constitute the largest group (nearly 30%), followed by teachers with 1–5 years of experience (29%) and those with 6–10 and 11–14 years of experience (25.3% and 15.8%, respectively).
Results
Table 3 documents the main results for types of expenditures, local revenue, and state aid in total (Panel A) and per pupil (Panel B) terms. Expenditure and revenue items (columns 1–6) are basically within a school district’s control, while state aid (column 7) is not. Column 1 shows that school districts seem to cut total current expenditures (
Main Fiscal Results

Notes: As in equation (1), all the dependent variables are logged and first differenced. The results are estimated with all other independent variables reported in Table 2. The full results with all other independent variables and without any other control variable are reported in Tables A3 and A4, respectively.
0.10; **0.05; ***0.01.
As predicted, the changes in
Of all three current expenditure components, instruction expenditures
The insignificance of tests on first and second differences in Table 3 could result from averaging out heterogeneous district responses. Table 4 documents the results of estimating AEFA-induced responses in total current spending and its three components by district groups categorized by the mean sample-period median household income (
Fiscal Results of Heterogeneity Analyses for Four

Notes: There are 1,512 observations. The results are estimated with all control variables listed in Table 2. The results without any variables are similar to those reported in this table and thus not reported. Robust standard errors clustered at the school district level are in parentheses. Standard errors for postregression tests are in brackets. When a postregression test on a first difference (i.e.,
0.10; **0.05; ***0.01.
However, AEFA-induced effects on
Table 5 reports the results for the third research question on how AEFA may affect district personnel, especially teachers. Column 1 shows that districts are found to reduce 0.63% of their FTE teachers for a 1-percent decline in enrollment in both the pre- and postperiods. Also, teacher aides and administrative people are not significantly changed in decline and growth years in the pre-and postperiods (columns 2 and 3). Panel B shows that none of the DID estimators are statistically significant.
Main Results on District Personnel

Notes: The results are estimated with all other independent variables in Table 2. All dependent variables are logged. When a postregression test on a first difference (i.e.,
0.10; **0.05; ***0.01.
In a heterogeneity analysis, column 1 of Table 6 shows that the numbers of FTE teachers for districts in quartiles 2 and 4 are 1.7% and 1.4% lower, respectively, after a decline-growth postperiod than after a similar preperiod. The highest-income quartile’s combined reduction in FTE teachers is nearly 2% larger in absolute value than the lowest-income quartile’s combined reduction. These findings are consistent with the results on instruction spending reported in column 6 of Table 4. Column 1 also shows that AEFA has a significantly larger decline-aggravating effect on FTE teachers in the highest-income districts than on those in the lowest-income districts (
Postregression Test Results of Heterogeneity Analyses on District Personnel for Four

Notes: There are 1,509 observations. Table A7 provides the results on key variables used to compute postregression tests in this table. All dependent variables are logged with undefined values being replaced by 0s for columns 2–7. The shares of 0s for dependent variables in these columns are 1.4%, 1.1%, 6.6%, 6.1%, 8.3%, and 2.8%, respectively. The results without these logged undefined observations are similar to those reported in this table. In addition, the results without control variables are similar to those with control variables and thus not reported.
0.10; **0.05; ***0.01.
Conclusion
State aid has been a major funding source for most school districts across the United States, including those in Arizona. A measure of enrollment is a key factor in the formulas that states use to allocate education aid. Two key issues are related to determining student enrollment: count methods and, relatedly, which year of data to use in aid formulas. Regarding the former issue, Ely and Fermanich (2013) classify ten student count methods based on whether the count is done at a single time or multiple times and whether they use membership or attendance. Several scholars have examined the potential fiscal and academic consequences of different student count methods (Baker, 2014; Ely & Fermanich, 2013; Hahnel & Baumgardner, 2022; Knight & Olofson, 1918). Regarding the second issue of enrollment determination, states vary in whether they use student counts in prior or current years, or a combination of both (Barnard & Smith, 2021). Specifically, Table A9 in the appendix shows that 22 states (e.g., Kansas) fund schools based on prior-year student counts, and nine other states factor prior-year counts into the final enrollment for state aid. However, unlike the first issue of enrollment determination, no study has yet examined the potential consequences of using, or changing between, different enrollment years. This study, to the best of our knowledge, represents the first attempt to fill this literature gap by focusing on Arizona.
In Arizona, school districts experiencing annual enrollment growth have consistently received state aid based on their current-year enrollment measured by ADM. Prior to 2017, the state used prior-year enrollment (PYE) to calculate education aid for districts with annual enrollment decline. However, with the enactment of the Arizona Education Finance Amendment (AEFA) in 2017, the state has transitioned to using current-year enrollment for education aid allocation to enrollment-declining districts. This study offers significant contributions to the literature as it examines, for the first time, the short-term effects of AEFA three years after its full implementation. Specifically, it analyzes the potential impacts of AEFA not only on statewide average school district inputs but also on heterogeneous district types as well as on district personnel, including teachers with varying academic credentials and experience levels.
First, our theoretical analysis suggests that when the state aid formula switches from prior-year to current-year enrollment, this change may elicit school districts’ fiscal responses in both decline and growth years. Specifically, AEFA may have two primary effects on school districts—decline-aggravating and growth-dampening. The former refers to districts’ inclination to reduce inputs more in postperiod decline years than in preperiod decline years, whereas the latter pertains to their propensity to increase inputs less in postperiod growth years than in preperiod growth years. A combination of the two effects may result in lower inputs in the postperiod.
Using a DID design on a data panel of 190 Arizona school districts during 2012–2020, we find that the DID estimators for total current expenditures (and their expenditure components) and FTE teachers show expected signs but are not statistically significant. These results suggest that the AEFA has little effect on the average district of the entire sample during the three-year period of its implementation. Despite the lack of significant effects on the average district, we find strong evidence of heterogenous AEFA-induced effects on inputs. AEFA has significantly larger decline-aggravating and growth-dampening effects on the highest-income districts than on the lowest-income districts. These differential effects are most pronounced in instructional expenditures, administration expenditures, total FTE teachers, and particularly teachers with 1–5 years of experience. Specifically, during the three years of AEFA, the highest-income districts reduce instructional and administrative expenditures, as well as the number of teachers, especially less-experienced teachers, more than the lowest-income districts. A plausible explanation for the disparity in responses between the highest- and lowest-income districts is that the former districts are more likely to benefit from aid-stabilizing PYE in decline preperiod years, leading to a stronger response to AEFA.
Our empirical approach supports a causal interpretation of the AEFA effects, or lack thereof, on Arizona school districts. First, our findings largely align with theoretical predictions of how school districts would respond to AEFA. Second, the model controls for time-invariant and time-varying factors that may bias the estimated results. However, given that our DID design is not conventional, there may be potential bias in our estimates from contemporaneous time-varying omitted factors, especially those in the postperiod.
Our study provides valuable insights into the effects of AEFA on Arizona school districts’ inputs. While these insights cannot be generalized to other states, our study’s results might be intriguing for any of the 22 states using prior-year enrollment and contemplating a switch to current-year enrollment in their education aid formula. For example, Kansas’s House Bill 2040 in 2023 proposed to use current-year enrollment instead of the greater of the preceding or second preceding year’s enrollment. Finally, our study leaves some questions unanswered. For example, has the AEFA had any effect on student achievement, particularly when using student-level data? 13 Also, our sample period ends just before the pandemic, which has been shown to have a negative effect on school enrollment (Chatterji & Li, 2021; Dee & Murphy, 2021; Scafidi et al., 2021). Several states—for example, North Carolina (Fofaria, 2020), Delaware (Office of the Governor, 2020), and especially Arizona (Hernandez & Brodie, 2020)—provided temporary relief funding to help districts with declining enrollment. How does the combination of temporary relief funding and AEFA affect school districts in these states? What will be the medium- and long-term effects of the current-year-enrollment aid policy once the temporary funding ends? These questions warrant future research.
Supplemental Material
sj-docx-1-ero-10.1177_23328584231210281 – Supplemental material for The Short-Term Effects of the Shift From Prior-Year to Current-Year Enrollment on School Inputs in Arizona
Supplemental material, sj-docx-1-ero-10.1177_23328584231210281 for The Short-Term Effects of the Shift From Prior-Year to Current-Year Enrollment on School Inputs in Arizona by Phuong Nguyen-Hoang and Angie Nga Le in AERA Open
Footnotes
Acknowledgements
We would like to thank David Frisvold for his insights on empirical strategies and Alex Sukalski for his help with collecting the data on teachers.
Correction (January 2024):
This article has been updated with corrections in some of the Greek characters and equations under the Notes section since its original publication.
Declaration of Conflicting Interests
The author(s) declared no potential conflicts of interest with respect to the research, authorship, and/or publication of this article.
Funding
The author(s) received no financial support for the research, authorship, and/or publication of this article.
Supplemental Material
Supplemental material for this article is available online.
Notes
Authors
PHUONG NGUYEN-HOANG is associate professor at School of Planning and Public Affairs, University of Iowa, 334 Jessup Hall, Iowa City, IA 52242; email:
ANGIE NGA LE is a postdoctoral associate in the New Jersey State Policy Lab at Rutgers, the State University of New Jersey, 33 Livingston Avenue, New Brunswick, NJ 08901; email:
References
Supplementary Material
Please find the following supplemental material available below.
For Open Access articles published under a Creative Commons License, all supplemental material carries the same license as the article it is associated with.
For non-Open Access articles published, all supplemental material carries a non-exclusive license, and permission requests for re-use of supplemental material or any part of supplemental material shall be sent directly to the copyright owner as specified in the copyright notice associated with the article.