
Abstract
A growing quantitative literature finds evidence that student teaching placements predict later outcomes of teacher candidates and their students, but there is little large-scale quantitative evidence about the mechanisms for these estimated relationships. We used data from a survey of STEM teachers in Washington State to better understand how their perceptions of preparation were related to student teaching placements and current classroom environment. We found evidence that the composition of students in student teaching classrooms was predictive of STEM teachers’ perceptions of their preparation. For example, STEM teachers who student taught in classrooms with more English language learners and economically disadvantaged students reported feeling prepared to teach these specific student populations. Likewise, STEM teachers who student taught in high-poverty classrooms tended to report feeling better prepared to manage their current classroom, particularly if they were currently teaching in a high-poverty classroom.
Keywords
Teacher quality plays an integral role in student educational outcomes and has been found to be the most important school-based factor for improving student achievement. 1 Therefore, it is not surprising that the quality of the teacher workforce has been the focus of numerous reports and initiatives. The quality of teachers instructing students in science, technology, engineering, and math (STEM) areas has been called out as a particular concern. For example, according to the Obama administration’s Innovate to Educate Report, STEM education will determine whether the United States will remain a leader among nations (Council of Advisors on Science and Technology Policy, 2016). 2
Research across several states has estimated average differences in teacher effectiveness across teacher education programs (TEPs; Boyd et al., 2009; Gansle et al., 2012; Goldhaber et al., 2013; Henry et al., 2013; Koedel et al., 2015; Mihaly et al., 2013). Although the differences in teacher effectiveness across programs vary somewhat from state to state, a common conclusion is that there is far more variation in teacher outcomes within programs than across them. Several studies over the last decade have therefore investigated the extent to which specific teacher preparation experiences were related to the effectiveness and retention of in-service teachers. This literature has identified some aspects of candidate coursework, field experiences, and alignment between preparation and practice that are predictive of these later outcomes.
Preservice Coursework
A small literature has considered the relationship between preservice coursework and later candidate outcomes. Monk and King (1994) found that pedagogical coursework specific to math education was predictive of student achievement in math at the high school level, while Nguyen and Redding (2018) showed that STEM teachers without formal certification were more likely to leave their initial teacher assignment. In qualitative studies, research suggests that the more content education that teachers receive during their preparation, the greater their confidence in their abilities to teach STEM-related content (Nadelson et al., 2013).
Student Teaching Experiences
Another feature of teacher education that varies within TEPs is the specific field experiences or student teaching experiences of the teacher candidates. Anderson and Stillman (2013) suggested that “student teaching—as the component wherein preservice teachers are challenged most explicitly to put the educational theories and the specialized equity-minded goals of their TEPs into practice—plays a major role in preservice teacher learning” (p. 3). Although evidence is limited, the available literature suggests that teacher candidates become effective teachers when they are required to link their clinical experiences to their teacher training and when student teaching is done in a supportive environment (Boyd et al., 2006; Ronfeldt, 2012, 2015). Boyd and colleagues (2006), for instance, found that teachers were more effective (judged by their contribution to student achievement on standardized tests) when they were required to complete a capstone project that linked their student teaching to their TEP coursework and when their student teaching was well supervised. Ronfeldt (2012) found that student teachers tended to learn more and become more effective when their student teaching was done at a school where teachers wanted to stay (as measured by having a nonretirement attrition rate). 3
Consideration of cooperating teacher characteristics is motivated by teacher reports on the important role of their cooperating teachers in career development (e.g., Ganser, 2002). Indeed, recent evidence that gets at the nature of the mentor-mentee relationship specifically in science teacher preparation exemplifies the importance of alignment between the two: Windschitl and colleagues (2020) found that teacher candidates were more likely to co-plan with a mentor, take up lesson planning responsibilities, and report receiving useful feedback from mentors when they perceived their placement as congruent with the vision of good teaching in their TEP.
Literature is increasingly connecting cooperating teachers’ characteristics to later outcomes of the teacher candidates whom they have supervised. For example, Bastian and colleagues (2020), Goldhaber and colleagues (2020), and Ronfeldt and colleagues (2018) found that teacher candidates who were supervised by more effective cooperating teachers, as measured by their performance ratings and/or value added, were more effective once they had their own classroom responsibilities. These findings, which were based on observational data and thus were not causal in nature, were bolstered by two recent experiments that found that candidates randomly assigned to higher quality field placements (judged primarily on the attributes of cooperating teachers) tended to feel more prepared to teach (Ronfeldt, Bardelli, et al., 2020; Ronfeldt, Matsko, et al., 2020) and showed greater development of teaching skills during their clinical practice (Goldhaber, Ronfeldt, et al., 2022). On the other hand, these papers tended not to find that other observable measures of cooperating teachers (e.g., experience or degree level) were predictive of later candidate outcomes.
Our study builds most closely off prior work that has connected specific features of teacher preparation, including the length of student teaching (Ronfeldt & Reininger, 2012) and early field experiences (Kwok & Bartanen, 2022), to later perceptions of preparation. Most closely related to this study, Matsko and colleagues (2020) investigated which characteristics of cooperating teachers led to student teachers’ perceptions of their preparedness to teach. They found that student teachers felt better prepared for their classroom environment when their cooperating teacher received stronger observation ratings from formal performance evaluations in instruction and in the classroom environment. They also felt better prepared to take on their own teaching responsibilities when they self-reported better perceptions of cooperating teachers’ instructions. This prior work illustrates the importance of better understanding early-career teachers’ perceptions of preparedness; doing so is crucial because teachers’ perceptions predict their early-career retention (e.g., Bastian et al., 2017; Geiger & Pivovarova, 2018) and, in some cases, instructional readiness (Ronfeldt, Matsko, et al., 2020).
Alignment Between Preparation and Early-Career Experiences
Recent work in Washington State (Krieg et al., 2022) has provided direct motivation for a focus on alignment between preparation and early-career teaching experiences. Using data on teacher candidates from TEP samples, these papers suggest that teachers are more effective at improving student achievement in math and are more likely to stay in the teaching workforce when they teach in the same grade as, the same school level as, and a classroom with similar student demographics as their student teaching classroom. These findings are also consistent with evidence based on findings from survey data (Boyd et al., 2009) that teachers who see “congruence” between their current teaching position and their student teaching position are more effective at improving student achievement in math and reading as well as on recent work probing the mechanisms for these relationships in science teacher education, such as congruence between the “visions of good teaching” in different settings (Windschitl et al., 2021).
Research Questions
In this paper, we describe research that analyzed the surveys of early-career K–12 STEM teachers in public schools in Washington State. The survey asked teachers to describe how well their student teaching experiences prepared them for specific aspects of their current teaching positions. We linked survey responses to administrative data to investigate how STEM teachers’ perceptions of teacher preparation and student teaching and the alignment between preparation experiences and first job contexts were related to their feelings of preparedness. Perceptions of preparation are an important outcome variable to consider because some prior work (e.g., Bastian et al., 2021; Geiger & Pivovarova, 2018), although not all (e.g., Ronfeldt, Matsko, et al., 2020), has shown that they predict later outcomes. Moreover, they also tend to be available more quickly than workforce outcomes to inform policy decisions.
We asked three specific questions:
1) What types of preservice and current experiences are predictive of STEM teachers’ perceptions of how well their field experiences prepared them for teaching?
2) What specific characteristics of student teaching classrooms are predictive of these perceptions?
3) Do these relationships vary depending on the characteristics of the teacher’s current classroom?
Method
Administrative Data
This study combined four data sources to construct a longitudinal data set that described the district, school, and classroom characteristics for early-career STEM teachers in Washington State. Three data sets were provided by the Washington State Office of Superintendent of Public Instruction: the Washington State S-275 personnel report, the Comprehensive Education Data and Research System (CEDARS) database, and the Washington State eCert system. These three data sets could be linked through state-assigned teacher certification numbers. We linked these three (also by teacher certification numbers) to an original survey that we had administered to early-career STEM teachers, “The Washington STEM Teacher Survey” (WSTS), which is described in more detail in the following section.
The Washington State S-275 contains a record of all certified employees in public schools, their highest degree earned, teaching experience, demographic characteristics, and a range of other employment details. We used the position and full-time-equivalent (FTE) variables to eliminate any individuals with an instructional (i.e., classroom teaching) FTE of less than half time, and we used the measure of years of teaching experience to focus on “early-career” teachers—that is, those with 3 years or less of credited teaching experience. We also used the S-275 to identify observable measures of cooperating teachers, such as the cooperating teacher’s experience and degree level.
We used data from the 2017–2018 CEDARS database to identify the sampling frame for the WSTS. We restricted sampling to only teachers who were observed teaching in the Grades 1–12 in a Washington State public school in the 2017–2018 school year and who (a) had received a STEM teaching credential with 3 or fewer years of teaching experience (i.e., graduating after 2014) 4 or (b) were observed teaching at least one math or science course during the 2017–2018 school year. 5 We identified STEM courses from string searches within state course codes in the 2017–2018 Washington State Course Catalog. We derived teacher endorsement and credential information from the state’s eCert system. All endorsements that were identified as STEM were put into science, math, and technology “bins.” This information allowed us to eliminate any teachers who did not have a credential or endorsement in STEM. These restrictions resulted in a sample of 4,594 early-career STEM teachers in Washington State and was the sampling frame for the WSTS, which we describe in the next section.
We also used the CEDARS database to create measures of the classroom demographics of each STEM teacher’s classroom in the 2018–2019 school year (the year the survey was implemented) as well as their student teaching classroom, as identified from the cooperating teacher and the year of student teaching provided in the survey. The measures included such demographics as the percentage of students eligible for free or reduced-price lunch, henceforth called economically disadvantaged students (EDS), and the percentage of students receiving special education (SPED) or English language learner (ELL) services.
Washington STEM Teacher Survey
In the spring and early summer of 2019, we administered the WSTS to roughly 4,600 early-career STEM teachers who were identified as eligible to answer the survey. The survey asked teachers about their perspectives on their teacher preparation programs and STEM subject-specific preparation, with a focus on their student teaching experiences. 6 Consistent with the American Association of Public Research, we calculated the overall survey response rate by dividing the number of surveys returned (2,302) by the total number of surveys sent out to eligible STEM teachers (4,587), resulting in a response rate of 50.42%. 7 Our primary concern, then, was not whether our sample size was large enough to permit statistical inference but rather whether this sample of survey respondents was sufficiently representative of the population of early-career STEM teachers to permit inferences about this broader population.
As shown in Table 1, teachers who responded to the STEM survey varied from the nonrespondent teachers in terms of their personal characteristics and the characteristics of the classrooms and schools in which they taught. Responding teachers (Column 2) had higher licensure test scores (WEST-B) than did nonrespondents (Column 3), but they had fewer average years of teaching experience. There were also notable geographic differences between respondents and nonrespondents. For example, teacher candidates who completed their teaching preparation at an institution west of the Cascades were less likely to respond than those who had attended an institution east of the Cascades. Panel B of Table 1 focuses on the classroom and school characteristics of STEM survey respondents compared with those of nonrespondents. Here, the only significant differences between respondents and nonrespondents was school level: Teachers who taught at a middle or high school were more likely to respond than were those in elementary schools; teachers who taught a math class were also less likely to respond to the survey. These differences between survey respondents and nonrespondents suggest that we should use caution in generalizing inferences from this survey to the overall population of early-career STEM teachers in Washington.
Characteristics of the Washington STEM Teacher Survey Sample, Respondents, and Nonrespondents
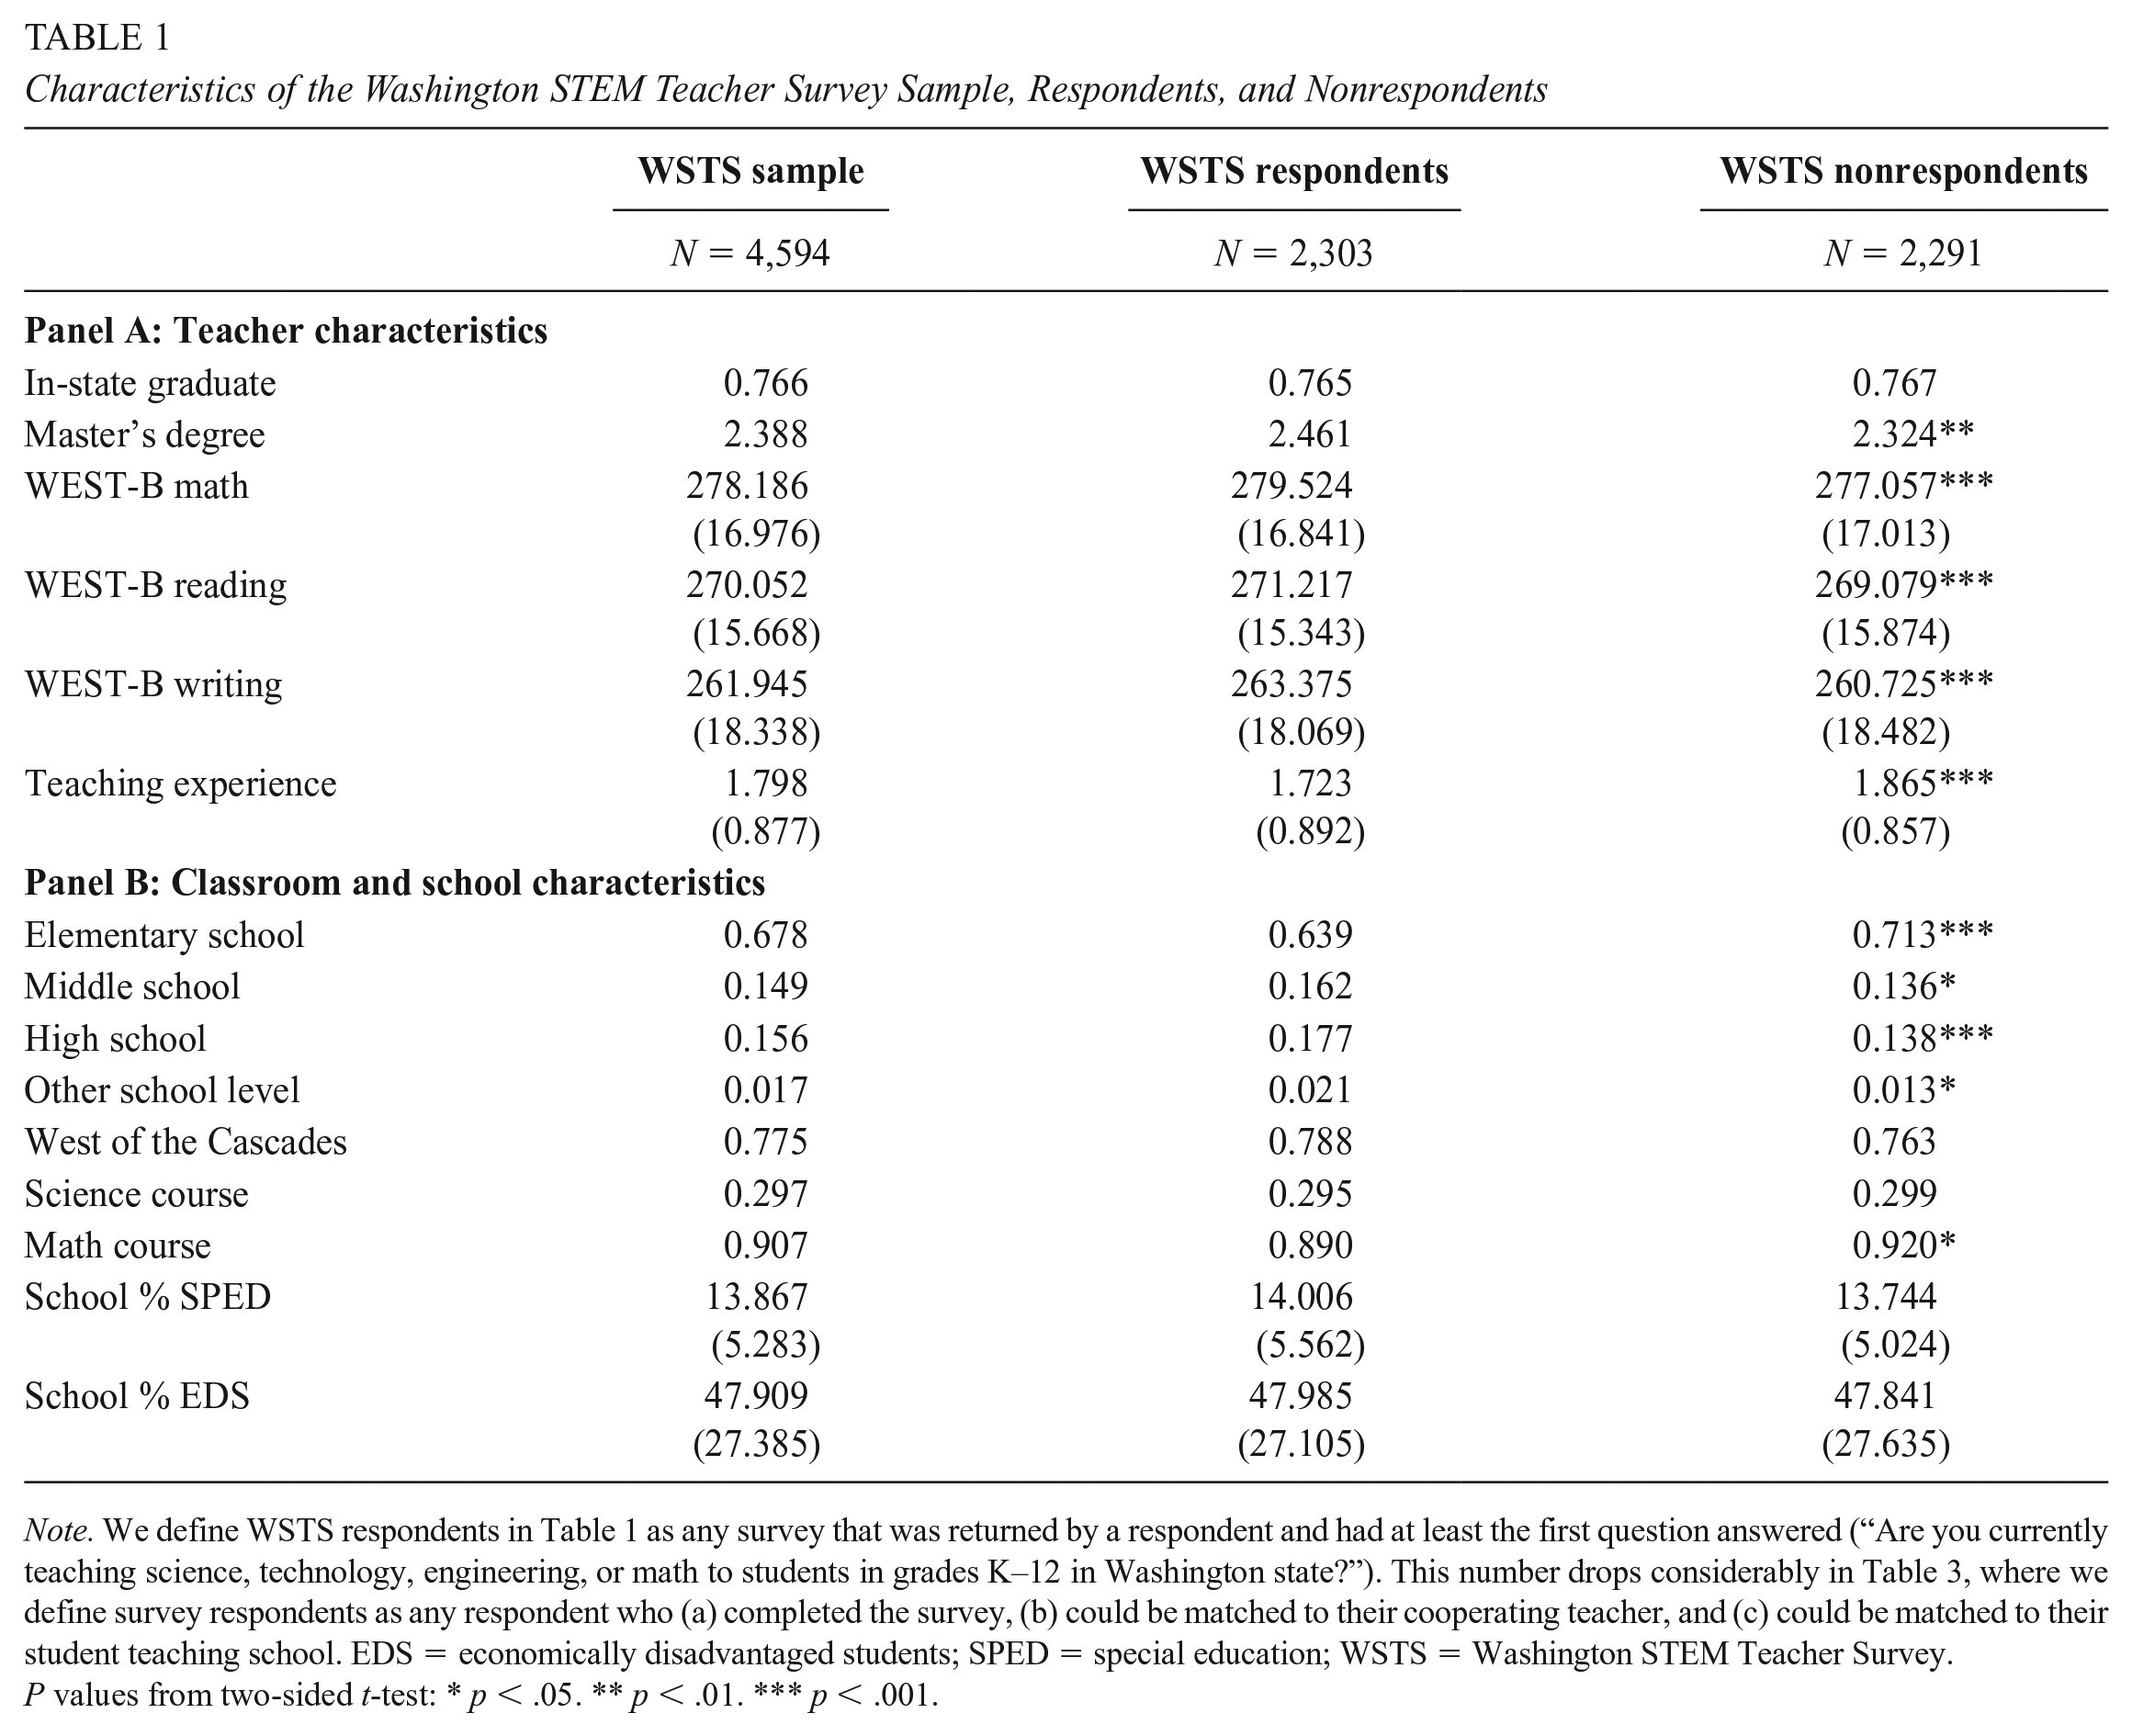
Note. We define WSTS respondents in Table 1 as any survey that was returned by a respondent and had at least the first question answered (“Are you currently teaching science, technology, engineering, or math to students in grades K–12 in Washington state?”). This number drops considerably in Table 3, where we define survey respondents as any respondent who (a) completed the survey, (b) could be matched to their cooperating teacher, and (c) could be matched to their student teaching school. EDS = economically disadvantaged students; SPED = special education; WSTS = Washington STEM Teacher Survey.
P values from two-sided t-test: * p < .05. ** p < .01. *** p < .001.
For the purposes of this paper, we focused on the subset of questions in the STEM survey that asked STEM teachers about their perceptions of their student teaching experiences, which we summarize in Figure 1. 8 Respondents were asked to respond to each question on a Likert scale, with responses ranging from “Strongly Disagree” to “Strongly Agree.” Figure 1 shows the distribution of responses for each question. One pattern is that early-career STEM teachers tended to feel more positive about the extent to which their student teaching experiences prepared them for managing the classroom, supporting ELL students, accelerating the learning for high-performing students, and facilitating group work than they did about how well their student teaching experiences prepared them to use a variety of instructional methods, support students with disabilities, teach in high-poverty settings, and address the needs of struggling students. The finding about preparation to serve ELL students differs from the finding by Boyd and colleagues (2008), who found that graduates had less opportunity to develop strategies to teach ELL students as part of their preparation than any other experience.
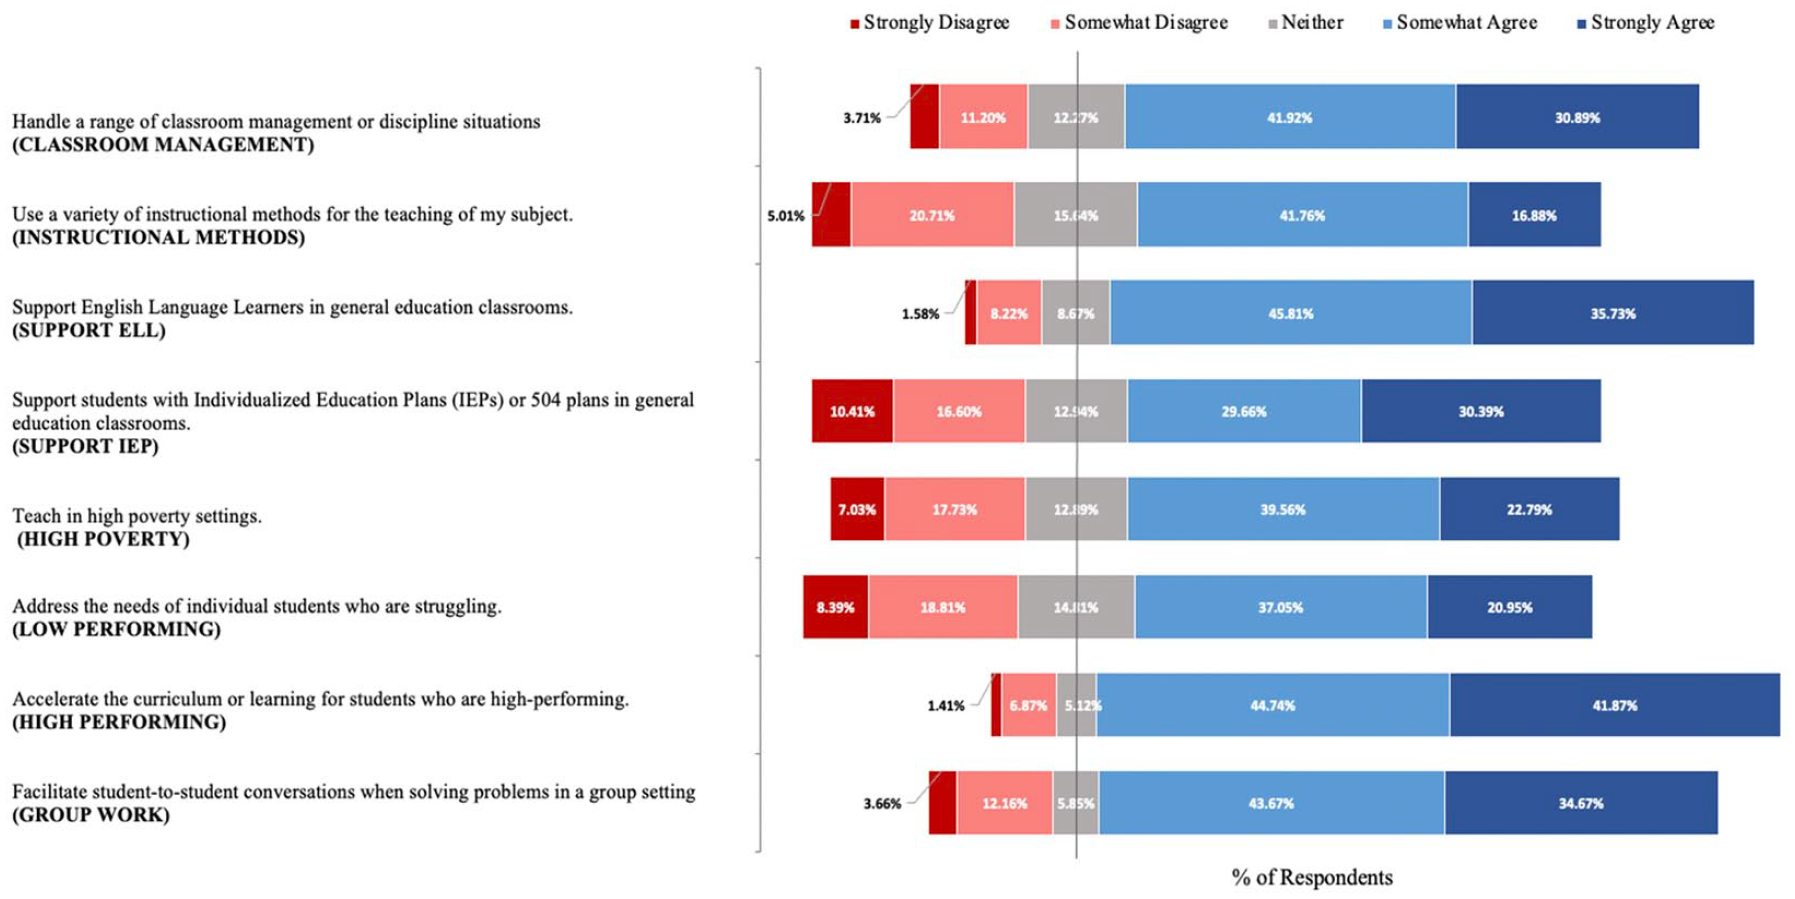
Distribution of student teaching responses to the question “Rate how well your student teaching experience prepared you to.”
Analytic Sample and Sample Statistics
For the remainder of the analysis, we focused on the 926 teachers from the 2,302 collected survey responses who (a) completed the entire survey, (b) could be matched to their cooperating teacher, and (c) could be matched to their student teaching school. This information was necessary to link to the cooperating teacher and student teaching classroom information. Table 2 summarizes statistics for the variables of interest described below and that were used as predictors in the models outlined in the next section. We considered five observable measures for the cooperating teacher of each STEM teacher: (a) teaching experience (CT Experience); (b) whether the cooperating teacher had a master’s degree (CT Master’s Degree) and three measures of homophily; (c) whether the cooperating and STEM teachers graduated from the same TEP (CT Same TEP); (d) whether the cooperating and STEM teachers had the same teaching endorsement (CT Same Endorsement); and (e) whether the cooperating and STEM teachers were the same gender (CT Same Gender). As shown in Table 2, the average teaching experience of cooperating teachers in the sample was more than 14 years, about 75% of cooperating teachers had a master’s degree, about 20% worked with a student teacher from the same TEP, more than 90% worked with a student teacher in the same endorsement area, and slightly more than 50% worked with a student teacher of the same gender. These trends were consistent with prior summary statistics reported from a different sample of cooperating teachers in Washington State (Krieg et al., 2022), with the notable exception that the proportion of cooperating teachers working with a student teacher of the same gender was much lower in the sample in this paper.
Summary Statistics of Student Teaching Variables (Analytic Sample Only)

Note. Analytic sample included any respondent from the 2,302 collected survey responses who (a) completed the entire survey, (b) could be matched to their cooperating teacher, and (c) could be matched to their student teaching school. CT = cooperating teacher; EDS = economically disadvantaged student; ELL = English language learner; ST = student teaching; SWD = student with disabilities; TEP = teacher education program.
We also considered five characteristics of each STEM teacher’s student teaching classroom: (a) the percentage of EDS (ST Class %EDS); (b) the percentage of students receiving SPED services (ST Class %SWD); (c) the percentage of ELL students (ST Class %ELL); (d) whether the STEM teacher was hired into the same school (ST Same School); and (e) the school level (ST Same Level) (e.g., elementary or middle school) in which they student taught. Again, these results were similar to summary statistics reported in prior work with a different student teaching data set in Washington State (e.g., Goldhaber et al., 2020).
Analytic Approach
Our basic analytic approach to each of the three research questions (RQs) outlined previously was the same: Let yit be the survey response to one of the questions summarized in Figure 1 for teacher i in year t (2018–2019 for all teachers). We used these responses to create a linear variable for which a 1-unit increase corresponded to one level higher on the Likert scale in Figure 1. We then estimated a series of linear regression models of the following form:

The model in Equation 1 controlled for a number of control variables that were available in the administrative data and that have been used in considerable prior research connecting preservice preparation to in-service outcomes (Bastian et al., 2020; Boyd et al., 2009; Goldhaber et al., 2017, 2020; Krieg et al., 2022; Matsko et al., 2020; Ronfeldt et al., 2018; Ronfeldt & Reininger, 2012). Given that our goal was to understand the relationships between student teaching experiences and perceptions of preparation, we attempted to control for as many potential confounders as possible. For example, the vector Pit included personal characteristics of teacher i in year t that included the respondent’s attendance in a Washington TEP, possession of a master’s degree or higher, and their STEM endorsement category. Sit were current school characteristics that included whether the respondent taught STEM at a middle school, high school, or other and whether they taught in Western or Eastern Washington. Cit were current classroom characteristics that included the percentage of EDS students in their current classroom, the percentage of SPED students, and the percentage of bilingual students. STi were student teaching classroom characteristics for teacher i that included the percentage of EDS students in their student teaching classroom, the percentage of SPED students, and the percentage of bilingual students. Finally, CTi were cooperating teacher characteristics for teacher i that included the cooperating teacher’s number of years of experience, whether the cooperating teacher had a master’s degree or higher, whether the cooperating teacher had attended the same TEP as the respondent, whether the cooperating teacher and respondent had the same endorsement, and whether the cooperating teacher and respondent were the same gender. All the coefficients in Model 1 can be interpreted as the expected change in a teacher’s survey response (on the Likert-point scale) to a given question associated with a 1-unit increase in each of these variables, all else equal.
In some specifications, we also added interactions that captured the similarity between the current and student teaching classroom placements of each teacher:

The interaction coefficients in this model in
We used the models above to address all three RQs. To investigate what types of preservice and current experiences were predictive of STEM teachers’ perceptions of how well their field experiences had prepared them for teaching, we simply tested whether each group of variables in Equations 1 and 2 was jointly predictive of STEM teachers’ survey responses. This allowed us to estimate a more parsimonious version of the models in Equations 1 and 2 to address RQ2 (What specific characteristics of student teaching classrooms are predictive of these perceptions?) and explore the extent to which specific characteristics of teachers’ student teaching placements were predictive of STEM teachers’ survey responses. Finally, we specifically considered the interaction terms in Equation 2 to investigate whether these relationships varied depending on the characteristics of the teacher’s current classroom (RQ3).
The analytic approach described was designed to disentangle the contributions of STEM teachers’ classroom placements to their perceptions of their preparation from other confounders (e.g., teaching experience) or mediators (e.g., their current classroom placements) in these relationships. But there are also several limitations that are important to acknowledge. First and foremost, our analyses were based on a survey that, although distributed to every early-career STEM teacher in the state, received a response from about only 50% of these teachers, and only a subset of whom provided the necessary information to connect survey responses to cooperating teacher and student teaching information. It is possible that the teachers who provided this information in their survey responses were not representative of all STEM teachers in the state; indeed, some comparisons we present suggest that more qualified teachers (as measured by licensure test scores) were more likely to respond, which raises questions about generalizability across the state. Another important caveat is that the findings were based on a single state (Washington) and may not generalize to other states with different preparation and K–12 environments.
Results
RQ1. What types of preservice and current experiences are predictive of STEM teachers’ perceptions of how well their field experiences prepared them for teaching?
Table 3 reports the results of a series of F-tests of whether each group of variables described in Equations 1 and 2 was jointly predictive of STEM teachers’ responses to different questions about their preparation. Columns in Table 3 correspond with the specific questions summarized in Figure 1 that served as the dependent variable in these regressions. The significance tests reported in Table 3 can be interpreted as tests of the null hypothesis that the relationships between the variables within each category and the survey responses were all zero.
F-Tests of Categories of Predictors of Early-Career STEM Teacher Survey Responses

Note. Personal characteristics included the respondent’s attendance of a Washington TEP, possession of a master’s degree or higher, and their STEM endorsement category. Current school characteristics included whether the respondent taught STEM at a middle school, high school, or other and whether they taught in Western or Eastern Washington. Current classroom characteristics included the percentage of EDS students, the percentage of SPED students, and the percentage of bilingual students. Student teaching classroom characteristics included the percentage of EDS students, the percentage of SPED students, and the percentage of bilingual students. Cooperating teacher characteristics included the cooperating teacher’s number of years of experience, whether the cooperating teacher had a master’s degree or higher, whether the cooperating teacher had attended the same TEP as the respondent, whether the cooperating teacher and respondent had the same endorsement, and whether the cooperating teacher and respondent were the same gender. Current and student teaching classroom/school alignment included whether the respondent’s current and student teaching school were the same, whether they were at the same grade level, whether they had the same percentage of EDS students, whether they had the same percentage of SPED students, and whether they had the same percentage of bilingual students. Column headers indicate dependent variables summarized in Figure 1. EDS = economically disadvantaged students; ELL = English language learner; IEP = individualized education plan; SPED = special education; TEP = teacher education program.
p < .10. *p < .05. **p < .01.
We can draw several conclusions from Table 3. First, there was little evidence that the personal characteristics of STEM teachers themselves (e.g., their degree level and endorsements) or the cooperating teachers’ characteristics (e.g., their experience or degree level) explained any variation in STEM teachers’ survey responses. On the other hand, teachers’ current school characteristics (e.g., their school level) and current classroom characteristics (e.g., the percentage of EDS or ELL students in their current classroom) appeared to explain some variation in their perceptions of their abilities to manage their classroom. This was important, as it suggested that these were potentially important control variables to include in our investigation of RQ2.
Perhaps more important, STEM teachers’ student teaching classroom characteristics were jointly predictive of their perceptions of their preparation to teach ELL and high-poverty students, and measures of the alignment between their current and student teaching classroom were jointly predictive of their perceptions of their preparation to teach ELL students and low-performing students. These measures became the variables of interest in our subsequent models, although for parsimony, we did not consider characteristics of cooperating teachers in subsequent models, because there was little evidence that such characteristics explained much variation in STEM teachers’ survey responses.
RQ2. What specific characteristics of student teaching classrooms are predictive of these perceptions?
Table 4 summarizes the estimates from the model in Equation 1, where the outcomes were survey responses about how well teachers’ student teaching experiences prepared them for specific aspects of their current job. As in Table 3, the column names are abbreviations that refer to specific questions in Table 1. Motivated by the trends in Table 3, we focused on three groups of variables (the percentage of EDS, SWD, and ELL in student teaching and current classrooms) and controlled for the personal and current school characteristics listed in the table footnote. The odd columns in Table 4 address the extent to which these variables in the teacher’s student teaching classroom (“ST Class”) or current classroom (“Current Class”) were predictive of STEM teachers’ perceptions. As discussed previously, these coefficients could be interpreted as the expected increase in STEM teachers’ survey responses associated with a 1 standard deviation increase in each of these variables.
Current Classroom Characteristics, Student Teaching Classroom Characteristics, and Alignment as Predictors of Survey Responses

Notes. Models also control for if the respondent attended a Washington TEP, had a master’s degree or higher, their STEM endorsement category, if they currently taught at a middle school, high school, or other, and if they currently taught in Western or Eastern Washington. Column headers indicate dependent variables summarized in Figure 1. EDS = economically disadvantaged students; ELL = English language learner; IEP = individualized education plan; ST = student teaching; SWD = students with disabilities; TEP = teacher education program.
p < .10. *p < .05. **p < .01. ***p < .001.
Focusing first on the current classroom characteristics, there was some clear evidence that STEM teachers in higher-poverty classrooms felt less prepared to manage their classrooms, support ELL students, and support low-performing students. Arguably, the more interesting relationships were for the student teaching variables in this table. One key finding was that in controlling for current classroom placements, the percentage of EDS students in the teacher’s student teaching classroom was positively and significantly predictive of their perceptions of their preparation to manage their classroom, support ELL students, and teach in high-poverty settings. Some of the coefficient magnitudes were striking. For example, as shown in the “high poverty” column, a 1 standard deviation increase in the percentage of EDS students in a STEM teacher’s student teaching classroom (e.g., an increase from 50% EDS to 75% EDS) was predictive of nearly a 0.8 increase in their predicted response to the question about the extent to which their student teaching placement had prepared them to teach in high-poverty settings. However, perhaps not surprisingly, being in a higher poverty classroom as a student teacher was significantly and negatively predictive of their perceptions of their abilities to differentiate instruction for high-performing students.
There were also some sensible relationships for the other measures of the student teaching classroom. For example, the percentage of students with disabilities in the student teaching classroom was positively predictive (in the interaction specification) of STEM teachers’ perceptions of how well their student teaching placement had prepared them to teach students with individualized education plans. Likewise, the percentage of ELL students in the student teaching classroom was positively predictive of STEM teachers’ perceptions of how well their student teaching placement had prepared them to teach ELL students, but it was negatively predictive of their perceptions of their preparation to teach high-performing students. To our knowledge, this is the first empirical evidence that the characteristics of student teaching classrooms (as measured by administrative data about these student teaching placements) are predictive of teachers’ perceptions of their preparation to teach specific populations of students.
RQ3. Do these relationships vary depending on the characteristics of the teacher’s current classroom?
An important question that arose from the results discussed for RQ2 is whether these relationships varied for teachers in different current teaching assignments. Therefore, we present estimates from the interaction models (Equation 2) in the even columns of Table 4. Several interactions between the percentage of EDS students in the student teaching classroom and current classroom were significant predictors of STEM teachers’ perceptions of their ability to manage their classroom, serve ELL students, and teach effectively in high-poverty settings. In other words, STEM teachers felt better prepared to manage their classrooms, serve ELL students, and teach in high-poverty settings if they had student taught in a higher poverty classroom, but particularly if they were currently teaching in a higher poverty classroom.
We illustrate the first of these relationships further in the contour plot in Figure 2, which plots the predicted response to teachers’ responses to the question “How well did your student teaching experience prepare you to handle a range of classroom management or discipline situations?” as a function of the percentage of EDS in their student teaching (x-axis) and current (y-axis) classrooms. 9 The shading represents the predicted value of the teacher’s response (see the legend on the right-hand side of the graph, centered so the mean response is zero): The regions denoted by “+” indicate regions where the predicted response was significantly greater than zero, and the regions denoted by “-” indicate regions where the predicted response was significantly less than zero.

Predicted response to classroom management question as a function of current and student teaching classroom %EDS.
Focusing on these statistically significant regions, teachers tended to feel better prepared to manage their current classroom (i.e., had a predicted response that was greater than the average teacher) when the percentage of EDS in their current classroom was similar to the percentage of EDS in their student teaching classroom (i.e., regions close to the y = x line in Figure 2). On the other hand, teachers tended to feel less prepared to manage their current classroom (i.e., had a predicted response that was lower than the average teacher) when the percentage of EDS in their current classroom was considerably greater than the percentage of EDS in their student teaching classroom (i.e., the upper-left region of Figure 2). This is consistent with prior evidence (e.g., Goldhaber, Krieg, et al., 2022; Krieg et al., 2022) that the alignment between teachers’ current and student teaching classrooms matters, in this case for teachers’ perceptions of their preparation to manage their current classrooms. 10 In fact, we interpreted the patterns in Figure 2 as one potential and plausible mechanism for the relationships found in these earlier papers; in other words, the importance of alignment for teacher effectiveness found in prior papers may, in part, be due to teachers who experienced alignment feeling better prepared to manage their classrooms, particularly in high-poverty settings.
Discussion
This is the first large-scale study, to our knowledge, that connects administrative data on student teaching placements of STEM teachers with their perceptions of their preparation to serve specific populations of students. This analysis provides the first empirical evidence that the characteristics of STEM teachers’ student teaching classrooms, as measured by administrative data about these placements, are predictive of their perceptions about teaching specific populations of students. The findings generally align with the commonsense notion that gaining more experience with particular types of students as a student teacher helps teachers prepare for teaching positions with those same types of students. Moreover, these findings support research showing that the alignment between student teaching and first teaching jobs predict in-service teacher performance and retention (Goldhaber et al., 2017; Goldhaber, Krieg, et al., 2022; Krieg et al., 2022). Specifically, the results, which are based on survey data in this study, highlight several potential mechanisms for prior findings that teachers are more effective and more likely to stay in the profession when they teach in a school or classroom with similar student demographics as their student teaching classroom.
The study has several limitations that are important to acknowledge. First, the evidence linking feelings of preparedness to in-service teacher performance is limited and mixed (e.g., Bastian et al., 2021; Ronfeldt, Bardelli, et al., 2020; Ronfeldt, Matsko, et al., 2020), so it is unclear from these results whether the relationships with feelings of preparedness would translate into relationships with teacher performance. Second, and as we discussed previously, the 50% response rate on the survey (as well as the significant differences between survey respondents and nonrespondents) raises concerns about the extent to which these findings can be generalized to all early-career STEM teachers in Washington. Finally, this study is exploratory in nature and cannot identify specific mechanisms for these relationships, so future mixed-methods work will be necessary to flesh out the mechanisms behind these relationships.
Despite these limitations, we believe that our findings have several potential implications. For example, the findings connecting student teaching classroom demographics to STEM teachers’ perceptions of their abilities to teach specific populations of students build on a growing evidence base suggesting that student teaching schools and classrooms matter for candidate development (e.g., Ronfeldt 2012, 2015). These findings, along with the finding that STEM teachers in high-poverty classrooms feel better prepared to manage their classrooms if they also student taught in a high-poverty classroom, add to a body of research (e.g., Boyd et al., 2009; Goldhaber et al., 2017; Krieg et al., 2022) suggesting that student teachers should be placed in settings to begin their careers that look like the classrooms in which they student taught. This suggests that policymakers and practitioners should strive to do a better job aligning the experiences of student teaching and early-career in-service responsibilities of early-career STEM teachers, perhaps by identifying schools with more persistent hiring needs (e.g., higher poverty schools) and ensuring that a disproportionate number of candidates are prepared in these settings.
It is important to acknowledge that this task is difficult because student teaching has historically occurred in the disproportionately advantaged classrooms near TEPs (Krieg et al., 2016), and there may be benefits (logistical and otherwise) to placements nearby to TEPs. But the task is certainly not insurmountable. For example, new remote supervision technologies necessitated by the COVID-19 pandemic may facilitate future placements in classrooms farther from TEPs that may be more representative of the types of classrooms candidates will face in their first year of teaching (Goldhaber et al., 2021).
One important null finding is that we did not find evidence that cooperating teacher characteristics were predictive of feelings of preparedness. This finding is somewhat surprising, given the growing evidence about the importance of this mentoring relationship for teacher candidate development and in-service teacher performance (e.g., Goldhaber et al., 2020; Ronfeldt et al., 2018). That said, these findings on STEM teachers are consistent with earlier work on a more general sample of teachers (Matsko et al., 2020) that found relatively weak relationships between candidates’ perceptions of their cooperating teacher and other observable data about these teachers.
Teachers have reported that the mentoring they received in student teaching was vital to their future success in the classroom (e.g., Ganser, 2002). This, combined with the aforementioned empirical evidence on the importance of mentoring, suggests that more work is necessary to identify what qualities in potential cooperating teachers, or the training they receive, might help ensure a productive mentoring experience for student teachers. Although we argue for the alignment of preservice student teaching and in-service classroom responsibilities, mentors could also play an even stronger role in training student teachers to work with different types of students through purposeful mentoring practices, particularly in science teacher preparation (Windschitl et al., 2020). Thus, a potentially fruitful line of future research could investigate the nature of the training that cooperating teachers receive for mentoring student teachers in science and whether this training predicts the same types of perceptions of preparation considered in this study.
Supplemental Material
sj-docx-1-ero-10.1177_23328584231190372 – Supplemental material for The Front End of the STEM Teacher Pipeline: Early-Career STEM Teachers’ Field Experiences and Perceptions of Preparation
Supplemental material, sj-docx-1-ero-10.1177_23328584231190372 for The Front End of the STEM Teacher Pipeline: Early-Career STEM Teachers’ Field Experiences and Perceptions of Preparation by Dan Goldhaber, Roddy Theobald, Kathryn Choate and Nate Brown in AERA Open
Footnotes
Funding
The author(s) disclosed receipt of the following financial support for the research, authorship, and/or publication of this article: This research was supported by the National Science Foundation (award number 1660948) and would not have been possible without the administrative data provided by the Washington Office of Superintendent of Public Instruction through data-sharing agreement 2015DE-030. We wish to thank Andrew Katz, Natsumi Naito, and Rain Ortega for outstanding research assistance; Kim Bahrenburg, Julie Hoff, Cindy Rockholt, Kathe Taylor, Kirk Walters, and Mark Windschitl for comments on the Washington STEM Teacher Survey and/or earlier drafts of this paper; and Sydney Payne, Nathaniel Marcuson, Seraphina Shi, and Wezi Phiri for their help in implementing the survey. The views expressed here are those of the authors and do not necessarily represent those of American Institutes for Research or the University of Washington. Any errors are attributable to the authors.
1.
See Nye and colleagues (2004) and Rivkin and colleagues (2005) on the importance and variation in teacher effectiveness on students’ test achievement, Jackson (2018) on the effects on short-run non-test outcomes, and ![]() on the effects of teachers on long-run outcomes.
on the effects of teachers on long-run outcomes.
2.
Large economic benefits tend to be associated with students who obtain STEM degrees (e.g., Dubina et al., 2020), and improvement in the quality of STEM teachers has been identified as one of the three overarching priorities to ensure that more students develop the skills needed to succeed in the STEM fields (White House, 2010).
3.
4.
Teachers were considered for the sample if they had received their teaching certification after January 2014; however, they were dropped from the sample if they had more than 3 years of teaching experience since that time. This accounted for teachers who may not have gotten a teaching job right after graduation as well as several other situational factors.
5.
For example, we generated the variable “engineering” by enlisting such variables as “cad design and software,” “drafting-architectural,” and “aerospace technology.” Once STEM courses were cleaned and organized by science, technology, engineering, and math, the data set was merged with the 2017–2018 Teacher Courses database by state course codes.
6.
Many of the included questions were derived from the Teacher Pathways Project Surveys (Boyd et al., 2006). See Appendix A for a full timeline for survey administration and ![]() for information about the entire WSTS.
for information about the entire WSTS.
8.
9.
10.
As in this prior analysis, the results are robust to dropping the 15% of candidates who were hired into the same school in which they had student taught.
Authors
DAN GOLDHABER is the director of the National Center for Analysis of Longitudinal Data in Education Research (CALDER), vice president at American Institutes for Research, and the director of the Center for Education Data and Research (CEDR) at the University of Washington, 3876 Bridge Way North, Suite 201, Seattle, WA 98103; email:
RODDY THEOBALD is the deputy director of CALDER and managing researcher at American Institutes for Research, 3876 Bridge Way North, Suite 201, Seattle, WA 98103; email:
KATHRYN CHOATE is a senior research associate at Committee for Children, 2815 2nd Ave., Seattle, WA 98121; email:
NATE BROWN is a research manager at the University of Washington. He is currently focused on projects related to teacher labor markets, teacher recruitment and development, and school pandemic recovery.
References
Supplementary Material
Please find the following supplemental material available below.
For Open Access articles published under a Creative Commons License, all supplemental material carries the same license as the article it is associated with.
For non-Open Access articles published, all supplemental material carries a non-exclusive license, and permission requests for re-use of supplemental material or any part of supplemental material shall be sent directly to the copyright owner as specified in the copyright notice associated with the article.