
Abstract
This study integrates an intersectional framework with data on 15,000 U.S. ninth graders from the High School Longitudinal Study of 2009 to investigate differences in ninth-grade math course placement at the intersection of adolescents’ learning disability status, race, and socioeconomic status (SES). Descriptive results support an increased liability perspective, with the negative relationship between a learning disability and math course placement larger for adolescents more privileged in terms of their race and/or SES. Adjusted results suggest that the lower math course placements of youth with learning disabilities are due to cumulative disadvantage rather than disability-related inequities in the transition to high school for youth of diverse racial and socioeconomic backgrounds. In addition to demonstrating the importance of intersectional perspectives, this study provides a roadmap for future studies by introducing the new perspective of increased liability to be used in conjunction with the widely employed perspective of multiple marginalization.
Keywords
Introduction
Learning disabilities are the most prevalent disability among K–12 youth, composing around half of the special education population (McFarland et al., 2019). The learning disability classification is used for youth who struggle, despite an average or high IQ, with reading (dyslexia), numeric calculation (dyscalculia), and/or writing (dysgraphia) (Fletcher et al., 2005). Intersectionality prioritizes consideration of individuals’ “multiple social locations” (Collins, 2002). Youth classified with learning disabilities are disproportionately Black (Office of Special Education Programs, 2018), and sometimes disproportionately Latinx, depending on the context (Klingner & Harry, 2006; Samson & Lesaux, 2009). Asian youth are underrepresented among youth with reported learning disabilities (Office of Special Education Programs, 2018). The population of youth classified with learning disabilities also has a much lower average socioeconomic status (SES) than that of the larger population (Shifrer, 2018; Zablotsky & Alford, 2020).
Disability, race, and SES intersect closely in the United States, but we lack a real understanding of how that intersection looks in relation to important life course benchmarks (Maroto et al., 2019; Naples et al., 2019). Math course attainment by the end of high school has implications not only for educational and occupational outcomes in young adulthood but even for financial and health outcomes in later life (Carroll et al., 2017; Long et al., 2012; Woods et al., 2018). Adolescents’ eighth- and ninth-grade math course placements link closely to their math outcomes at the end of high school (Roderick et al., 2014). Understanding how certain status markers operate differently depending on a person’s position along other axes of stratification is a primary aim of intersectional approaches (Hancock, 2007), with the dominant expectation being that persons with multiple marginalizing statuses experience the poorest outcomes (Choo & Ferree, 2010; Collins, 2015).
I used data on around 15,000 U.S. adolescents from the nationally representative High School Longitudinal Study of 2009 (HSLS) to, first, investigate whether unadjusted estimates of ninth graders’ math course placement at the intersection of their learning disability status, race, and SES suggest multiple marginalization or increased liability. With multiple marginalization, the negative relationship between a learning disability and math course placement would be exacerbated for youth who are lower status in terms of their race and/or SES. With increased liability, a term used in this study as a counterpoint for multiple marginalization, the negative relationship of a learning disability would be exacerbated for youth who are higher status in terms of their race and/or SES. Second, this study investigates whether adjusted and intersectional estimates of ninth graders’ math course placement suggest that differences by disability status are attributable to cumulative disadvantage or to disability-related inequities in the transition to high school (e.g., math course placements that are inconsistent with adolescents’ eighth-grade math performance). Research along these status markers is essential as the U.S. population diversifies (Kao & Thompson, 2003), childhood disabilities increase in prevalence (Visser et al., 2014), and inequalities in SES increase (McLanahan, 2004). Building on calls to integrate intersectional theory with quantitative methodology (Covarrubias & Vélez, 2013; McNair et al., 2020), this study’s findings provide a foundation for investigations into patterns in educational outcomes at the intersection of other status markers and into other outcomes at the intersection of disability, race, and SES.
Literature Review and Theoretical Framework
Marginalization Within Math
Youth perceived to have a learning disability may first experience marginalization in math because of their lower average achievement. Youth with learning disabilities are likely to struggle in math, regardless of their specific disability. Not only are reading and writing typically integral aspects of math curricula (e.g., word problems); youth with dyslexia, for instance, confuse numbers as well as letters (Boets & Smedt, 2015). All struggling learners experience some degree of marginalization in schools (e.g., ability grouping, low-level coursework), marginalization that may serve to reproduce their disadvantages despite functional intentions (Gamoran, 2010). In addition to being a marker of individual difference, learning disabilities are a social location and an axis of inequality (Shifrer & Frederick, 2019), such that youth with learning disabilities may also experience marginalization in math because of disability-related inequities (Jimenez & Graf, 2008). Whereas the learning struggles of youth perceived to have no neurodevelopmental disability may be interpreted as within the control of students and teachers, the learning struggles of youth perceived to have a learning disability may be attributed to immutable neurological difference(s) (Erevelles, 1996). Previous studies have found that teachers hold lower expectations for youth with a disability classification, even when compared to youth with similar behaviors and achievement levels (Allday et al., 2011; Ohan et al., 2011; Shifrer, 2013). Biases related to ability may be especially virulent in math spaces because of the tendency in the United States to perceive math aptitude as something innate rather than something attainable to all through hard work (Archer et al., 2010; Dweck, 2007). Youth with learning disabilities may end high school with poorer math outcomes than adolescents without a learning disability but similar levels of prior achievement (Shifrer, 2016; Shifrer et al., 2013), in part because of their marginalization within math.
Marginalization in academic spaces also occurs along the axes of SES and race (Kao & Thompson, 2003). Children’s family SES is a better predictor of their educational outcomes than any characteristics of their schools or teachers (Gamoran & Long, 2006; Hill, 2016). Lower SES youth are more often placed into lower level coursework that reproduces their disadvantages by limiting access to high-level curriculum, rigorous pedagogy, and engaged classmates (Desimone & Long, 2010; Mickelson, 2015). In addition to disadvantages related to their lower SES, Black and Latinx students experience extra marginalization within schools based on negative stereotypes related to their intellectual ability and work ethic (Lewis & Diamond, 2015). Asian youth, in contrast, are stereotyped as smart and hard-working, particularly in math spaces (Martin, 2019), potentially eclipsing their experiences with racism and nativistic discrimination (Lee & Zhou, 2015). Asian youth, like White youth, are also much less likely to live in poverty than are Latinx and Black youth (Wilson & Schieder, 2018).
These experiences of marginalization result in inequities by SES and race in math outcomes. Most studies focus on math course attainment by the end of high school, finding that lower SES students are less likely to complete calculus than are higher SES students (Domina & Saldana, 2012) or to be “ready for college math” (Long et al., 2009). Similarly, Asian youth are much more likely to take calculus than are youth of other races (Domina & Saldana, 2012), and much higher shares of Asian and White youth are “ready for college math” relative to Latinx and Black youth (Long et al., 2009). With disparities by SES and race in end-of-high-school math attainment entirely explained by lower levels of preparation in middle and early high school (Tyson & Roksa, 2016), this study’s focus on ninth-grade math is important. More intersectional approaches show that social capital increases the likelihood of enrollment in algebra and advanced math for higher SES Latinx youth, but not for lower SES Latinx youth (Valadez, 2002). Yet among students in advanced math courses, the math test scores of Latinx students benefit more from a higher family income than do the scores of White students, net of prior achievement (Riegle-Crumb & Grodsky, 2010). No previous studies have considered math outcomes for youth with disabilities in intersection with their race and SES.
Multiple Marginalization
Multiple marginalization, a dominant perspective within intersectionality, predicts that the negative impacts of a low status marker will be multiplied for persons with another low status marker (Collins, 2015). For instance, prior research has shown that the negative effect of learning disabilities appears to be larger for Black youth than for White youth in terms of restrictive placements (being educated in a separate classroom) and test scores (National Council on Disability, 2018; Schwartz et al., 2021). Black and Latinx youth with disabilities experience more exclusionary discipline (Annamma & Morrison, 2018; Cruz et al., 2021) and have poorer postsecondary educational and occupational outcomes than do White youth with disabilities (Newman et al., 2011). Multiple marginalization is also evident at the intersection of disability and SES. Postsecondary outcomes of youth with disabilities are better for those with higher incomes than for those with lower incomes (Newman et al., 2011). Because of stereotypes related to SES and academic potential (Cobb, 2017), educators may perceive a lower SES child reported to have a learning disability as less able, or as less amenable to intervention, than a higher SES child reported to have a learning disability. And then, with advantages in time and knowledge, higher SES parents may be better equipped to minimize the costs of special education and capitalize on the benefits (Lareau & Cox, 2011; Ong-Dean, 2009; Owens, 2020). From a multiple marginalization perspective, the negative relationship between a learning disability and math course placement will be larger for adolescents who are lower status in terms of their race (i.e., Black, Latinx) and/or SES (i.e., lower SES).
Increased Liability
Rather than multiple marginalization, learning disabilities may represent what I call an increased liability for those advantaged along other status markers, such that the negative relationship between a learning disability and math course placement is larger for adolescents who are higher status in terms of their race and/or SES. In a potential example of increased liability, although being Asian is typically considered a high status marker in academic settings (Martin, 2019), a recent study found that the negative relationship between a learning disability and test scores is larger for Asian youth than for White youth (Schwartz et al., 2021). This result may be because disability is more stigmatized in Asian cultures (Bui & Turnbull, 2003; Chen et al., 2004), such that the classification is reserved for Asian youth with the most severe learning struggles, or that Asian youth and their parents experience more psychosocial angst related to the learning disability than do others. In another potential example of increased liability, an attention-deficit/hyperactivity disorder (ADHD) classification relates negatively to youth’s externalizing behaviors and academic self-competence for middle and higher SES youth, but not for lower SES youth (Owens, 2020). ADHD shares many of the “symptoms” of learning disabilities, and many youth are diagnosed with both (Connor et al., 2010). It is possible that disability is more of a liability in higher SES contexts because of heightened academic pressures and disability stigma (King et al., 2014; Owens, 2020, 2021). Similarly, despite the extra resources they can access, higher SES parents experience their children’s “invisible disabilities” as more stressful and burdensome than do lower SES parents because of pressures to maintain appearances and to ensure that their children meet the educational and occupational expectations of their social class (Blum, 2015). From an increased liability perspective, the negative relationship between a learning disability and math course placement is larger for adolescents who are White, Asian, and/or higher SES.
Purpose of Study
This study investigates the relationship between a learning disability and ninth-grade math course placement, and whether that relationship varies depending on adolescents’ race or SES. Unadjusted intersectional estimates focus on whether the negative relationship between a learning disability and math course placement is exacerbated for youth who are lower status in terms of their race and/or SES (i.e., consistent with multiple marginalization perspectives), or whether the negative relationship is exacerbated for youth who are higher status in terms of their race and/or SES (i.e., consistent with an increased liability perspective). These unadjusted results will reflect adolescents’ individual differences and cumulative disadvantage related to those differences, including marginalization and related disability inequities that occur before transitioning into high school. Yes, these results are a contribution because we know very little, even at a descriptive level, about students’ outcomes at the intersection of disability, race, and SES.
I use adjusted estimates to investigate whether there is any evidence of potential disability-related inequities in the transition to high school, rather than the poorer ninth-grade math outcomes of students with learning disabilities being entirely attributable to cumulative disadvantage. Cumulative disadvantage describes how early advantages or disadvantages are critical to how groups become differentiated over time (Dannefer, 1987; Ferraro & Kelley-Moore, 2003). As described by DiPrete and Eirich (2006), the Blau-Duncan approach to cumulative disadvantage complements multiple marginalization by highlighting persisting direct and interaction effects of status markers. In the case of this study, a learning disability may represent a cumulative disadvantage because of direct and indirect effects on outcomes across the life course. In an example of the indirect cumulative disadvantage of a learning disability, the benefits of a higher SES or of being perceived as White may be reduced at multiple stages of life for youth with learning disabilities relative to youth without disabilities. I attempt to identify evidence of potential disability-related inequities in the transition to high school by adjusting models for a multitude of confounders and pre–high school mechanisms between adolescents’ intersectional identities and math course outcomes (i.e., adolescents’ outcomes that reflect prior opportunities to learn, adolescents’ educational attitudes, high school context, family characteristics). My ability to narrow in on potential disability-related inequities is facilitated by the standardized sequencing of secondary-level math coursework in the United States, with students typically progressing from pre-algebra into algebra I into geometry and so on (Riegle-Crumb, 2006). HSLS’s rich measures enable me to control for adolescents’ level of eighth-grade math and their performance in that course, which is key because equitable ninth-grade math course placements should be consistent with these more objective indicators of students’ math potential and preparation. Ninth-grade math course placements that are lower than those of other students with comparable levels of eighth-grade math achievement raise the possibility of lowered expectations or marginalization related to students’ learning disability classifications.
Data and Methods
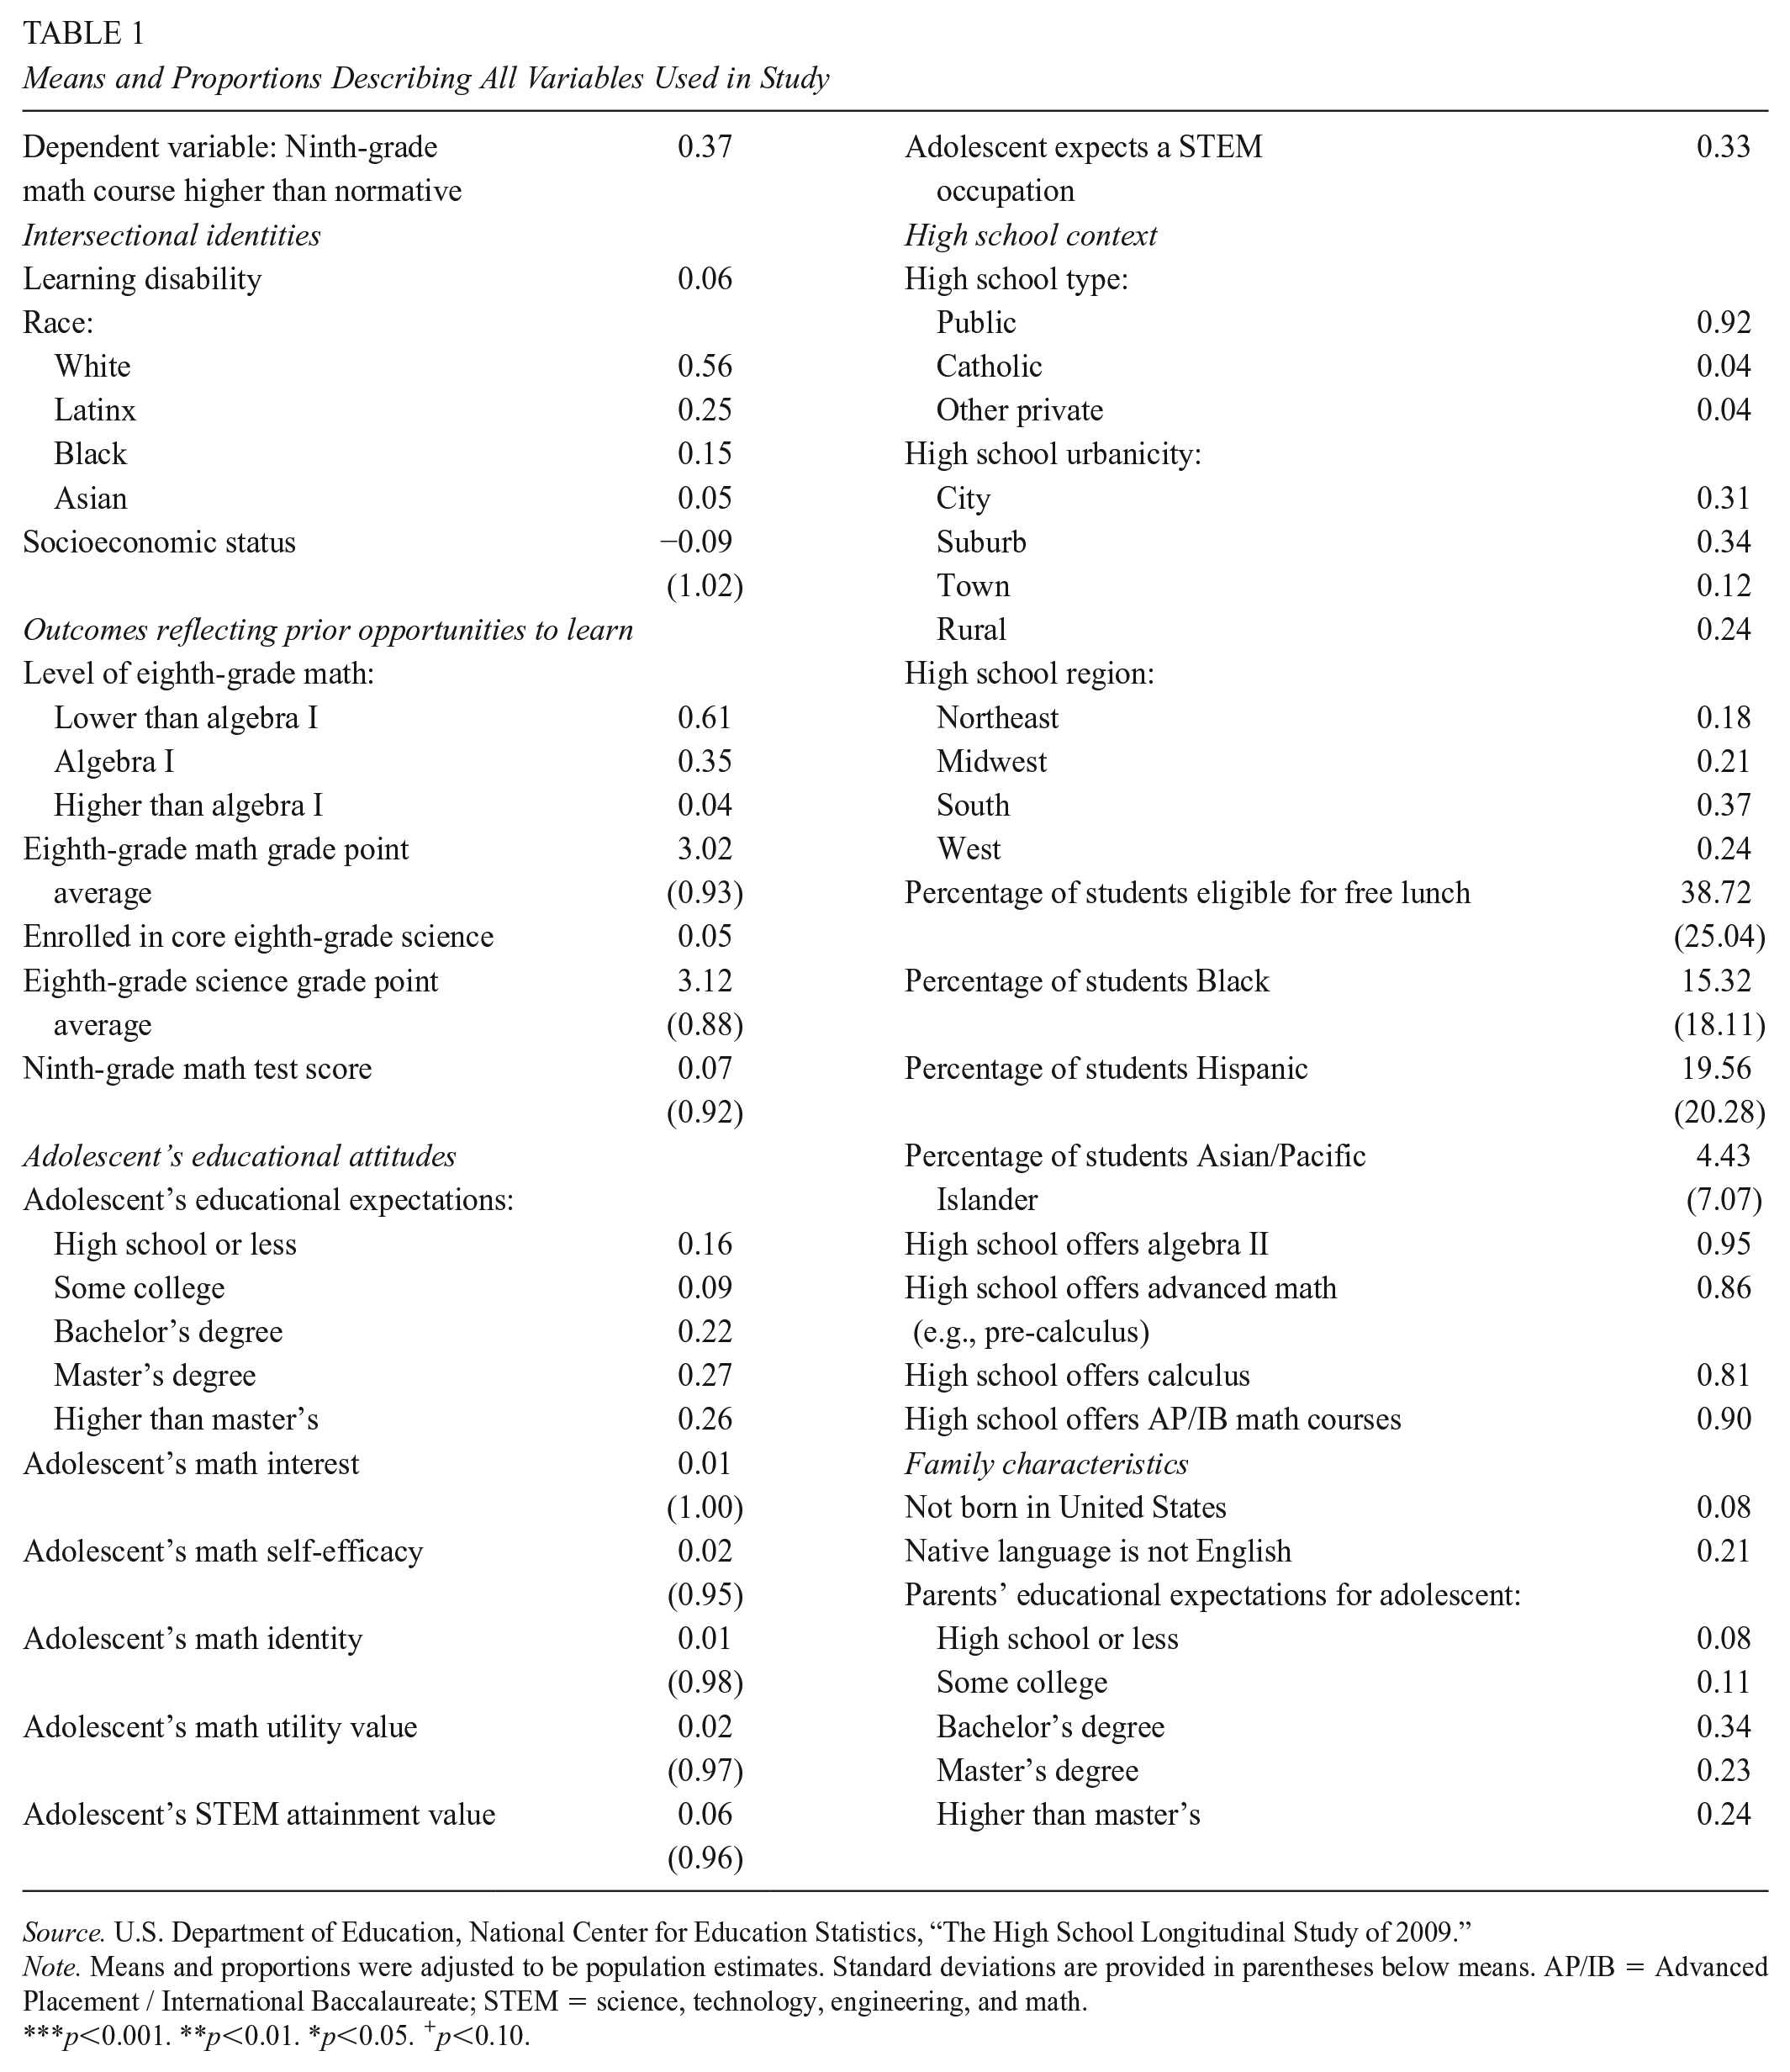
The National Center for Education Statistics (NCES) administers the nationally representative HSLS, which focused on a cohort of 21,444 U.S. adolescents in the ninth grade in 2009. This data set is the most recent large federal data set focused on high school students and offers rich measures of disability and course-taking. I used base-year data (2009) from the student survey, parent survey, and math test, as well as transcript data collected by NCES in 2014. Retrospective questions in the student survey enabled me to adjust estimates for a wide variety of mechanisms and confounders in the relationship between adolescents’ intersectional identities and their ninth-grade math course placement. After excluding 2,190 1 youth who were not White, Black, Latinx, or Asian; 1,320 with a neurodevelopmental disability other than a learning disability; 750 with an unspecified disability (more details below); and 1,640 youth missing on the dependent variable, my analytic sample included 15,540 ninth graders. Most measures were missing for 0%–10% of cases, except for higher rates of missingness on parents’ educational expectations and reports of whether their child was born in the United States (30%). I addressed missing values with multiple imputation using chained equations (White et al., 2011). Table 1 provides descriptive statistics of all variables used in the study.
Means and Proportions Describing All Variables Used in Study
Source. U.S. Department of Education, National Center for Education Statistics, “The High School Longitudinal Study of 2009.”
Note. Means and proportions were adjusted to be population estimates. Standard deviations are provided in parentheses below means. AP/IB = Advanced Placement / International Baccalaureate; STEM = science, technology, engineering, and math.
p<0.001. **p<0.01. *p<0.05. +p<0.10.
Dependent Variable
I used transcript data to construct a dichotomous measure of whether each ninth grader was in a higher than normative math class (“Geometry,” “Analytic Geometry,” “Integrated Math II,” “Algebra II,” “Trigonometry,” or “Other advanced math course”). The reference group included students in no math class, “Pre-algebra,” “Review or Remedial Math,” “Other math course,” “Algebra I,” “Integrated Math I or above,” and “Statistics.” Schools have recently begun to offer integrated math sequences (which combine algebra, geometry, and statistics) as an alternative to the traditional sequence, with freshmen typically enrolled in integrated math I and sophomores in integrated math II (Will, 2014), such that I classified the latter as higher than normative. I also confirmed analytic decisions for course titles with less precedence in the previous literature (e.g., “Statistics,” “Other math course”) by comparing average math test scores for students in each level of math. High school math course-taking is hierarchical, such that high-level math course attainment by the end of high school typically depends on the student being enrolled in math for all 4 years of high school. In this way, no math in the ninth grade should represent an academic disadvantage, just as low-level math courses do, but it is possible that students are not enrolled in math in the ninth grade for reasons that actually reflect social/academic advantage, such that these youth should not have been included in this variable’s reference category. Sensitivity analyses suggest that not taking math does reflect social/academic disadvantage, with Latinx and Black ninth graders’ higher likelihood to not be enrolled in a math course relative to that of White ninth graders largely attributable to their less socially privileged family backgrounds and their lower levels of achievement in the eighth grade (Table 9). Additional related sensitivity analyses are summarized in the Results section.
Predictors of Interest
This study’s dichotomous measure of learning disability was based on parents’ base-year reports of whether a doctor, healthcare provider, teacher, or school official ever told them that their ninth grader had a learning disability. I excluded adolescents whose parent reported that they had some other neurodevelopmental disability (n = 1,320). NCES asked schools to report which students had an Individualized Education Program but did not ask schools to report the qualifying disability. Because I could not know whether the disability was a learning disability, I also excluded 750 students with an Individualized Education Program but with no disability reported by their parent. HSLS’s measure of SES combined information from the base-year parent survey on the highest educational attainment of both parents, the occupational prestige score of both parents, and family income. HSLS’s composite race variable was based on data from the base-year student survey, with missing values imputed by NCES by using data from the sampling roster provided by schools or from the base-year parent survey.
Covariates of Adolescents’ Intersectional Identities and Math Course Outcomes
It is expected that the poorer ninth-grade math course outcomes of ninth graders with learning disabilities are, in large part, a function of confounders—that is, factors that relate to their likelihood of being classified with a learning disability and their educational outcomes (e.g., family characteristics, high school context). The relative social disadvantage of youth with learning disabilities (i.e., lower average SES, more likely to be Black or Latinx) as well as the marginalization students experience in school as a result of being classified with a disability also influence their opportunities to learn prior to high school and their educational attitudes in ways that subsequently affect their ninth-grade math course placement. To narrow in on potential disability-related inequities in the transition to high school, I also estimated regression models that were adjusted by these covariates that represented confounders of and mechanisms of the relationship between adolescents’ intersectional identities and math course outcomes. To capture outcomes that reflect prior opportunities to learn, I used a categorical measure of level of eighth-grade math, a dichotomous indicator of whether the student’s eighth-grade science course is a core science, continuous measures of grade point average in eighth-grade math and science courses, and the theta score from the math test NCES administered to sampled ninth graders. I use the phrase outcomes that reflect opportunities to learn rather than prior academic achievement because the former locates the accountability for achievement disparities in structural and systemic factors rather than on students from marginalized social groups (National Council on Disability, 2018; UCLA’s Institute for Democracy, Education, & Access, 2022). To capture adolescents’ educational attitudes, I included a categorical measure of their educational expectations; continuous measures of their math interest, math self-efficacy, math identity, math utility value, and STEM attainment value; and a dichotomous measure of whether they expected a STEM occupation. To capture the high school context, I included categorical measures of the school’s type (e.g., public, private), urbanicity, and region; the percentage of students who were eligible for free lunch, Black, Hispanic, and Asian/Pacific Islander; and dichotomous indicators of whether the school offered algebra II, advanced math (e.g., pre-calculus), calculus, or Advanced Placement/International Baccalaureate math. Finally, adolescents’ family characteristics other than the predictors of interest (SES and race) were measured through dichotomous indicators of whether the student was not born in the United States or had a native language other than English and a categorical measure of parents’ educational expectations for their adolescent.
Analytic Plan
In addition to providing means and proportions detailing differences by learning disability status, SES, and race in all key study variables and covariates, I provided descriptives at the intersection of disability status, race, and SES to increase intersectional understanding of the sample. As specified in the HSLS users’ guide (Duprey et al., 2018), I used Stata’s survey procedure to apply the base-year student analytic weight, account for HSLS’s complex survey design, and adjust for the clustering of students within schools. Intersectionalists specifically call for statistical interactions to understand multiplicative effects (Choo & Ferree, 2010; Hancock, 2007). To investigate whether intersectional differences in math course placement seemed to reflect multiple marginalization or increased liability (RQ1), I estimated models with three-way statistical interactions (1) to produce predicted probabilities of higher than normative math course placement at the intersection of disability, race, and SES. Additional models showed whether the relationship between a learning disability and math course outcomes differed significantly by race controlling on SES (2) or by SES within each racial group (3). I reestimated model (2) three times, alternating the reference group each time, so as to not imply that White youth were the default, “normal” racial group. In equations (1), (2), and (3) (unadjusted versions of the models), XL represents the learning disability measure, XS the SES measure, and XR the measure of each adolescent’s race:


To determine whether any disparities seemed to be attributable to disability-related inequities during the transition to high school rather than cumulative disadvantage (RQ2), I included all covariates in model (1). I used propensity score techniques, which are considered a more apt way to address selection bias than are standard regression techniques (Austin, 2011), to assess main results; this approach is detailed in Appendix B.
Results
Bivariate Analyses of Learning Disability, Race, and Socioeconomic Status
Table 2 shows unadjusted differences at the intersection of adolescents’ learning disability status, SES, and race. First, in differences by learning disability status, 0.38 of youth without a disability classification were placed into a higher than normative ninth-grade math course, whereas ninth-grade math courses were higher than normative for only 0.16 of youth reported to have a learning disability. Youth reported to have a learning disability also had a lower mean SES and were less likely to be White or Asian than were youth without a learning disability. In terms of differences by SES, higher SES ninth graders were more likely than lower SES ninth graders to be in a higher than normative math course (0.44 vs. 0.26), were less likely to be reported to have a learning disability (0.05 vs. 0.07), and were less likely to be Latinx or Black. In differences by race, Asian youth were the most likely to be placed in a higher than normative math course: 0.63 of Asian ninth graders, in contrast to 0.42 of White, 0.28 of Latinx, and 0.27 of Black youth. Latinx and Black youth were the most likely to have been reported to have a learning disability (0.08 and 0.06), in contrast to 0.05 of White youth and 0.02 of Asian youth. Latinx (–0.64) and Black (–0.42) youth had lower average SES than did Asian (0.23) and White (0.22) youth. Finally, descriptives at the intersection of disability status, race, and SES at the bottom of Table 2 show that Latinx and Black youth reported to have a learning disability had particularly low average SES, whereas Asian youth with a learning disability had a higher average SES than did Latinx and Black youth without a learning disability. These estimates demonstrate the importance of intersectional analyses, with factors that are endogenous to ninth-grade course placement (e.g., learning disability status, SES) also close covariates of each other.
Differences by Learning Disability Status, Socioeconomic Status, and Race in Key Variables

Source. U.S. Department of Education, National Center for Education Statistics (NCES), “The High School Longitudinal Study of 2009.”
Note. Means and proportions are adjusted to be population estimates. The frequencies total more than the analytic sample (15,550 vs. 15,540) because NCES requires that unweighted frequencies be rounded to the nearest 10. Lower SES includes adolescents whose family SES is in the bottom two quintiles, whereas higher SES includes adolescents with family SES in the third through fifth quintiles. LD = learning disability; SES = socioeconomic status.
p<0.001. **p<0.01. *p<0.05. +p<0.10.
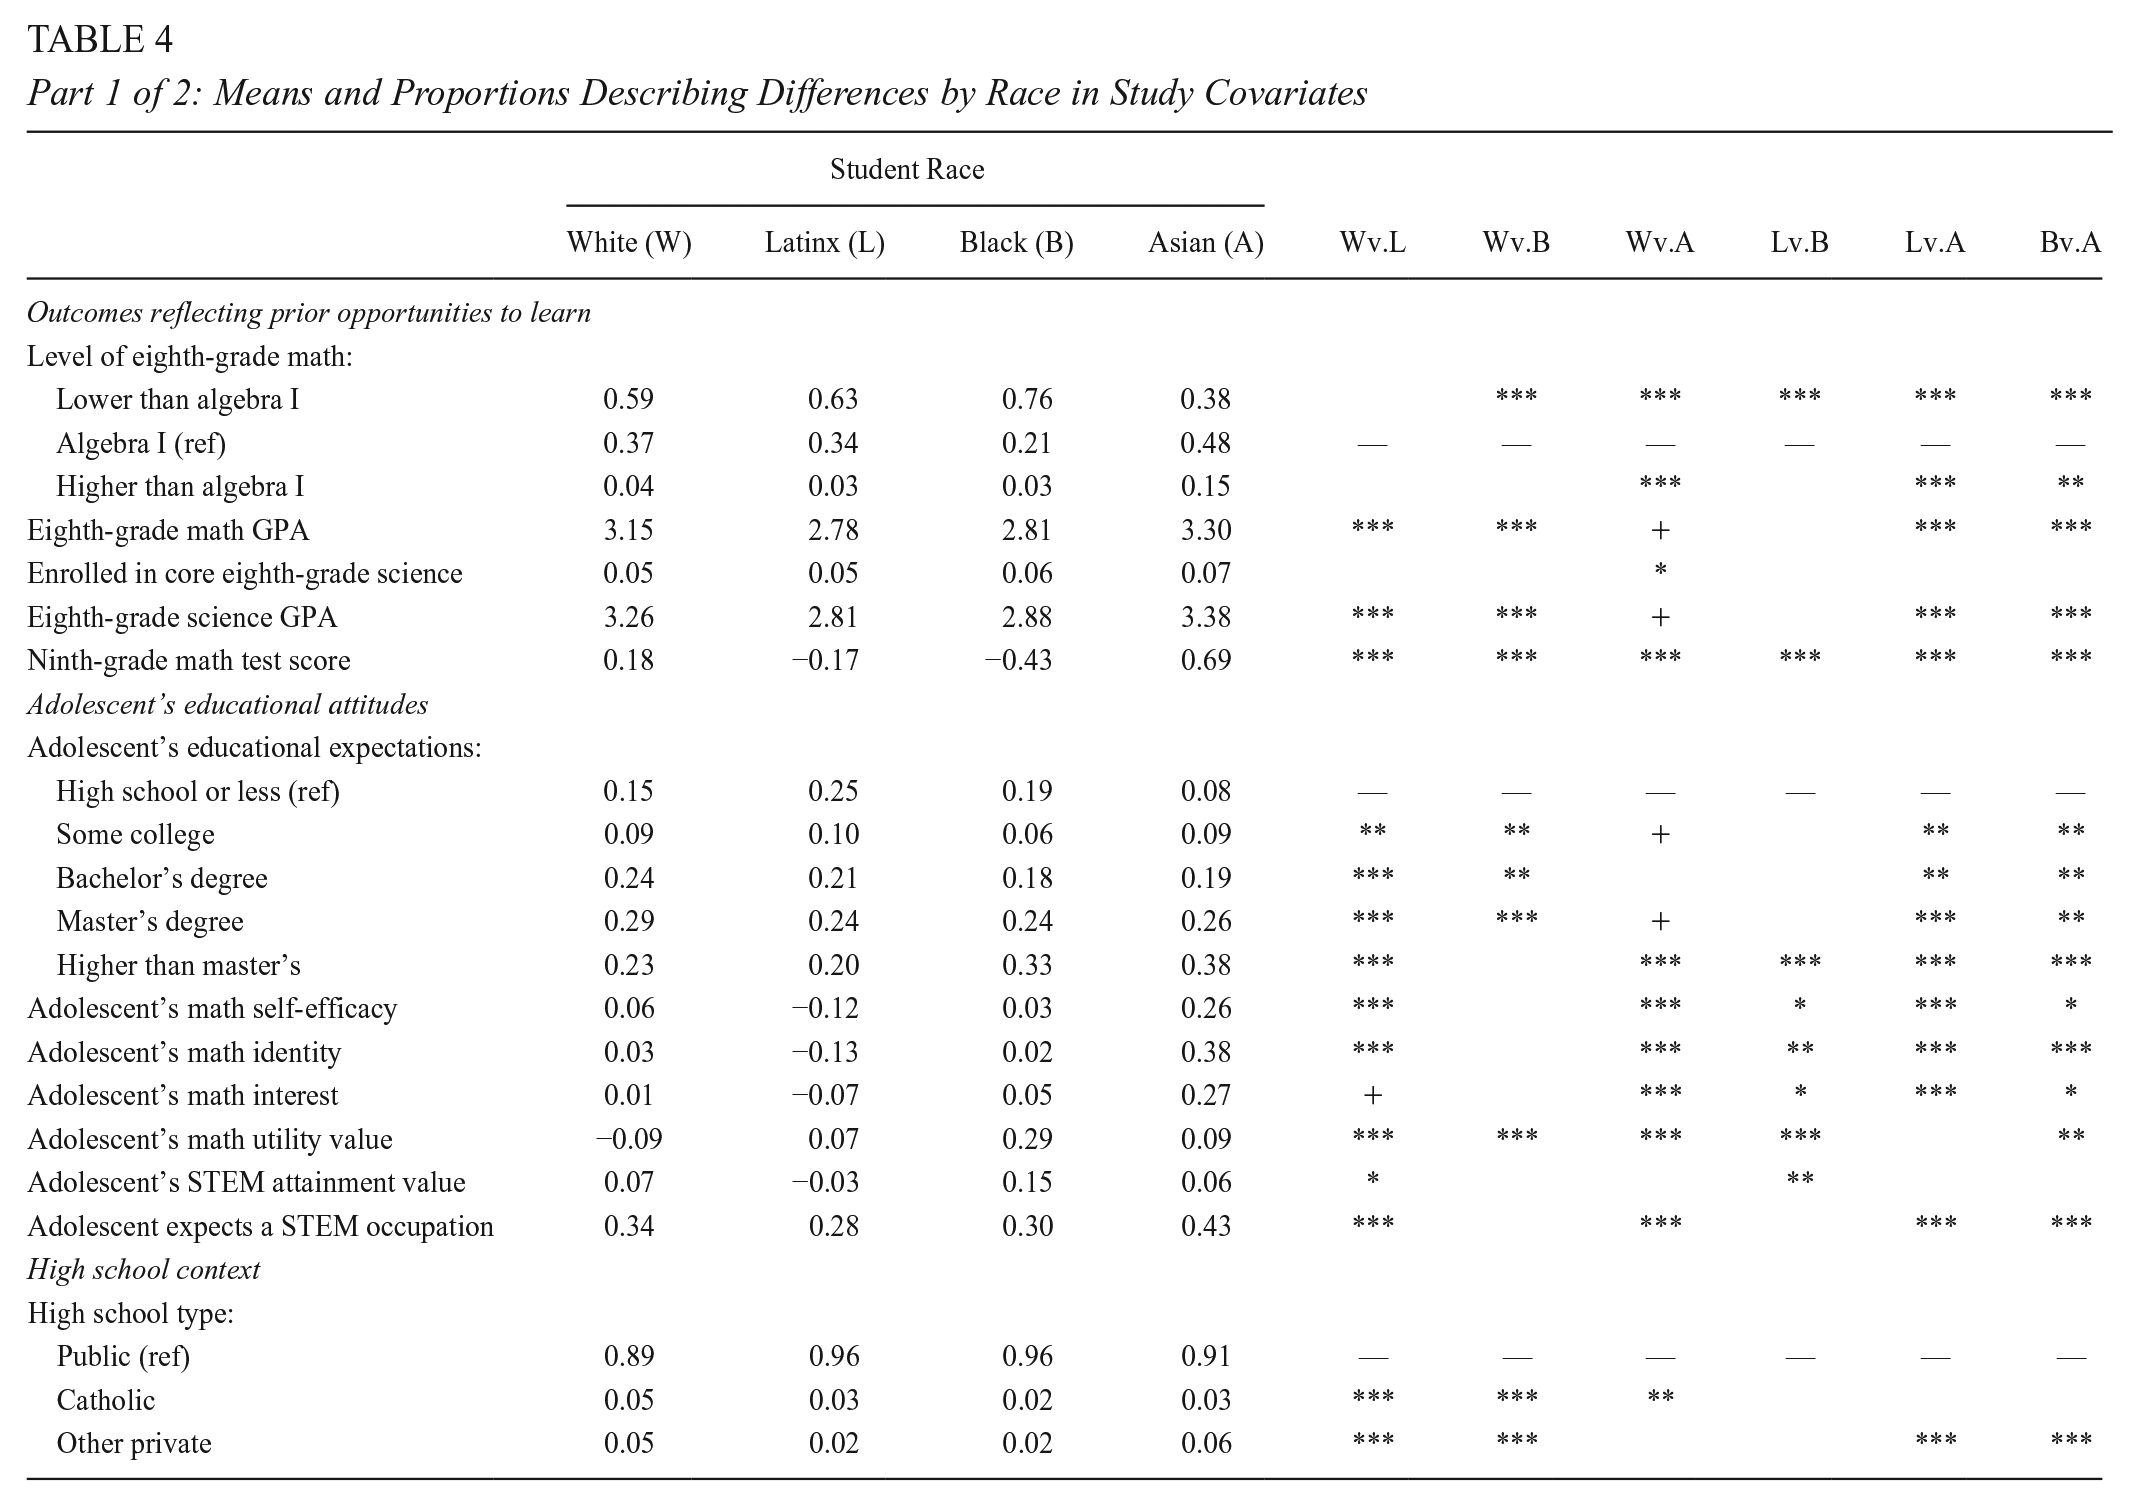
Table 3 shows differences by learning disability status and SES in the factors that are covariates of the relationship between adolescents’ intersectional identities and their ninth-grade math course placement. Relative to youth with no reported learning disability, youth with learning disabilities typically experienced inequities in prior opportunities to learn and educational attitudes. They were more likely to attend public high schools and high schools with a higher share of students who were Black or eligible for free lunch. Their parents had lower educational expectations for them. Patterns were similar for lower SES youth relative to those of higher SES youth, except that lower SES youth were also less likely to attend suburban high schools, but were more likely to live in the west. Their high schools also served larger shares of Hispanic students and were less likely to offer advanced math or calculus. Finally, they were more likely to not have been born in the United States and for English to not be their native language. Table 4 shows differences by race in covariates. Overall, Latinx and Black youth typically experienced inequities relative to those of White and Asian youth in terms of prior opportunities to learn, high school context, and family characteristics that related to educational outcomes. Differences by race in educational attitudes, though, were mixed. This study’s multivariate estimates that were adjusted for these covariates attempt to shift focus from differences that reflect cumulative disadvantage and disability-related inequities to just disability-related inequities in the transition to high school.
Part 1 of 2: Means and Proportions Describing Differences by Learning Disability Status and Socioeconomic Status in Study Covariates

Part 2 of 2: Means and Proportions Describing Differences by Learning Disability Status and Socioeconomic Status in Study Covariates

Source. U.S. Department of Education, National Center for Education Statistics, “The High School Longitudinal Study of 2009.”
Note. Means and proportions are adjusted to be population estimates. Lower socioeconomic status (SES) includes adolescents whose family SES is in the bottom two quintiles, whereas higher SES includes adolescents with family SES in the third through fifth quintiles. STEM = science, technology, engineering, and math.
p<0.001. **p<0.01. *p<0.05. +p<0.10.
Part 1 of 2: Means and Proportions Describing Differences by Race in Study Covariates
Part 2 of 2: Means and Proportions Describing Differences by Race in Study Covariates

Source. U.S. Department of Education, National Center for Education Statistics, “The High School Longitudinal Study of 2009.”
Note. AP/IB = Advanced Placement / International Baccalaureate; GPA = grade point average; STEM = science, technology, engineering, and math.
p<0.001. **p<0.01. *p<0.05. +p<0.10.
Math Course Outcomes at the Intersection of Disability, Race, and Socioeconomic Status
To investigate whether findings support multiple marginalization or increased liability, Figure 1 shows predicted probabilities that ninth graders’ math course is higher than normative at the intersection of adolescents’ learning disability status, race, and SES. Regardless of their race, adolescents with a learning disability have a lower predicted probability of being in a higher than normative math course than their same-race peers of comparable SES. The numbers in the brackets indicate the difference by disability status at each level of SES. For instance, among Latinx youth with an SES one standard deviation (SD) lower than average, the predicted probability of a higher than normative ninth-grade math course is 15 percentage points lower for Latinx youth with a learning disability than for Latinx youth with no reported disability. The base of Figure 1 shows that the average relationship between a learning disability and ninth-grade math course placement is largest for Asian youth (–0.40). Because Martin (2019) described a racialized math hierarchy in which Asian students are perceived to be even more capable than White students, these findings suggest that youth advantaged in terms of their race appear to experience increased liability from a learning disability.

Multiple Marginalization or Increased Liability? Predicted Probability Ninth Graders’ Math Course is Higher than Normative at the Intersection of Adolescents’ Learning Disability (LD) Status, Socioeconomic Status (SES), and Race.
Figure 1 also shows differences by SES in the relationship between a learning disability and math course placement within racial groups. Among lower SES (–1 SD) White youth, the difference by disability status in the predicted probability of placement in a higher than normative math course is −0.16, whereas the difference by disability status for higher SES White youth (+1 SD) is −0.25. The table at the base of Figure 1 indicates that the interaction between learning disability and SES is statistically significant (p<0.05) for White youth. In other words, White youth’s SES moderates how their disability status relates to their math course placement, with higher SES White youth experiencing a larger negative relationship than lower SES White youth. The pattern is identical for Latinx, Black, and Asian adolescents, although not statistically significant for Asian adolescents. This may reflect small cell sizes for Asian adolescents, as the three-way interaction (see Table 5) suggests that there are not significant racial differences in how SES moderates the relationship between reported learning disabilities and ninth-grade math course placement. In all, these findings also support the increased liability perspective. In sensitivity analyses that exclude ninth graders not in a math course (Table 10), results are substantively very similar.
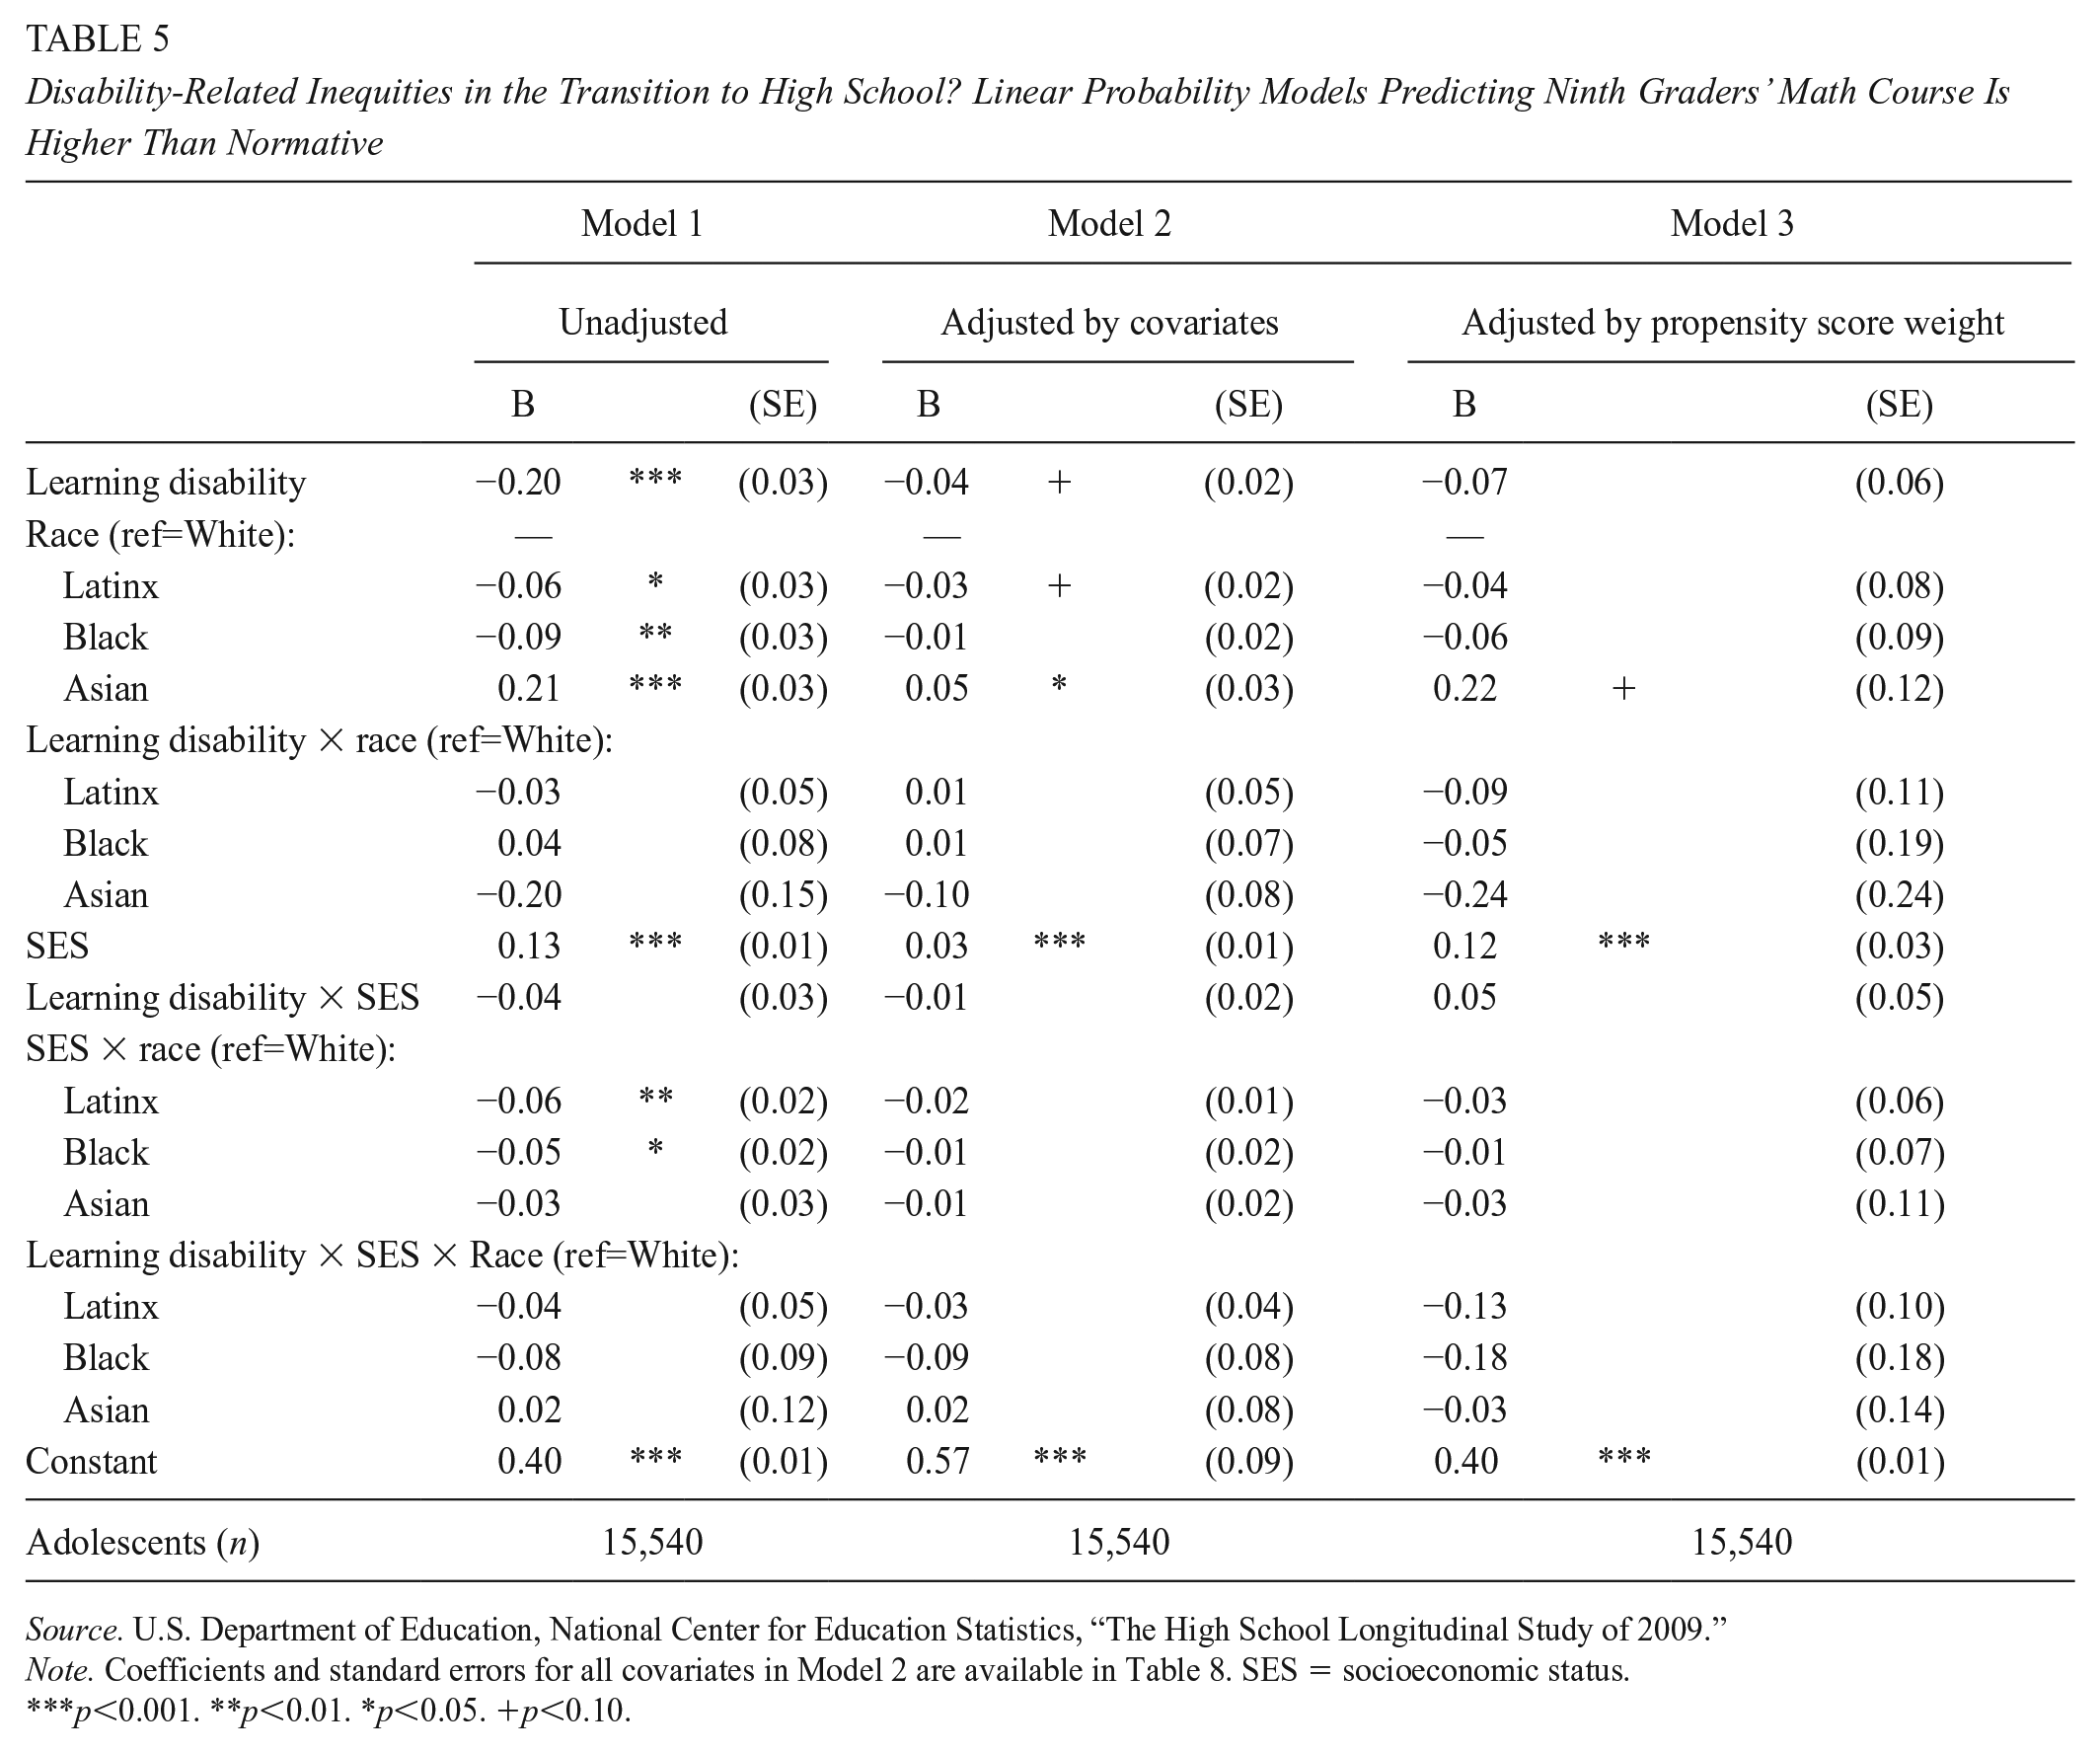
Disability-Related Inequities in the Transition to High School? Linear Probability Models Predicting Ninth Graders’ Math Course Is Higher Than Normative
Source. U.S. Department of Education, National Center for Education Statistics, “The High School Longitudinal Study of 2009.”
Note. Coefficients and standard errors for all covariates in Model 2 are available in Table 8. SES = socioeconomic status.
p<0.001. **p<0.01. *p<0.05. +p<0.10.
To investigate potential disability-related inequities in the transition to high school, Table 5 shows coefficients and standard errors from linear probability models predicting that ninth graders’ math course is higher than normative. Model 1 includes main effects and statistical interactions between measures of adolescents’ learning disability status, race, and SES. The main effect for a learning disability is negative and statistically significant. Interactions between the learning disability and race measures, and between the learning disability and SES measures, are not statistically significant, suggesting that this negative main relationship between a learning disability and ninth-grade math course placement is experienced by youth of diverse racial and socioeconomic backgrounds. Yet this unadjusted model reflects the contributions of cumulative disadvantage and disability-related inequities that adolescents experienced before and potentially in the transition to high school.
Model 2 in Table 5 narrows in on disability-related inequities in the transition to high school by controlling for multitudes of covariates that reflect cumulative disadvantage, including outcomes reflecting prior opportunities to learn, adolescents’ educational attitudes, high school context, and family characteristics. Table 8 provides coefficients and standard errors for all covariates in Model 2. In Model 2, the learning disability coefficient is only marginally significant, suggesting that the poorer ninth-grade math course outcomes of youth with learning disabilities are due to cumulative disadvantage rather than to disability-related inequities in the transition to high school. Because the interactions between the disability and race measures, and between the disability and SES measures, are not statistically significant, results indicate that this finding is true for youth of diverse racial and socioeconomic backgrounds. In corroboration of the robustness of these findings, the learning disability coefficient in Model 3, which incorporates a propensity score weight, is not statistically significant at all, and the interactions with the disability measure remain not statistically significant. The coefficient for the main effect of SES is likely significant even with propensity score weighting because the propensity focused on selection into a learning disability rather than selection into a higher SES. Sensitivity analyses similar to these but excluding ninth graders not in a math course (Table 11) align with these results, with the coefficients for the main effect of a learning disability not statistically significant in the model adjusted by covariates or the model adjusted by propensity score weighting.
Discussion
This study uses large nationally representative data to investigate ninth graders’ math course placement at the intersection of learning disability status, race, and SES. First, descriptive results (i.e., unadjusted for covariates) are consistent with an increased liability perspective, with the negative relationship between a learning disability and math course placement typically larger for adolescents who are more privileged in terms of their race and/or SES. Adjusted results suggest that the poorer ninth-grade math course outcomes of youth with learning disabilities are due to cumulative disadvantage rather than to disability-related inequities in the transition to high school for youth of diverse racial and socioeconomic backgrounds. These findings demonstrate the importance of the regular integration of intersectional approaches in all investigations focused on stratification, despite added complexity. This study provides a roadmap for future studies to address this complexity by introducing the new perspective of increased liability to be used in conjunction with the widely employed perspective of multiple marginalization. This study also contributes to scholarly efforts to integrate intersectional frameworks with quantitative approaches and expands the application of and understandings of intersectional theory to disability research.
Results suggest that disability in intersection with race and SES more often operates through increased liability rather than through multiple marginalization. More specifically, the negative relationship between a learning disability and math course placement is larger among higher SES youth than for lower SES youth within each race group (although the difference is not statistically significant for Asian youth). Owens (2020) similarly found that an ADHD classification relates negatively to children’s externalizing behaviors and academic self-competence for middle and higher SES children, but not for lower SES children. Blum’s (2015) study documented how children’s “invisible disabilities” cause more parental angst for higher SES families than for lower SES families, despite additional resources. Students who are advantaged in terms of their SES or race are more likely to attend high schools that serve similarly advantaged and higher achieving peers (Hanselman & Fiel, 2017). The likelihood of a struggling learner being classified as learning disabled is higher in higher SES/achieving schools than in lower SES/achieving schools (Fish, 2019; Shifrer, 2018; Shifrer & Fish, 2020). Similarly, higher SES youth are more likely to use stimulants to address learning struggles (King et al., 2014) and are even more likely to die by suicide, in some contexts (Mueller & Abrutyn, 2016). These scholars attributed these patterns to heightened expectations of self-control, academic excellence, and ensuring the continuation of family social privileges, all of which may increase the degree to which a learning disability is stigmatizing. From another perspective, though, these results could be interpreted to mean that lower SES youth experience fewer detriments from a learning disability only because they experience lower expectations and inequitable educational outcomes regardless of whether they are classified as disabled.
Similarly, this study finds that the negative relationship between a reported learning disability and math course placement is largest for Asian youth, who are perceived as particularly high status in math settings (Martin, 2019). This corresponds with Schwartz et al.’s (2021) finding that the negative relationship between a learning disability and test scores is larger for Asian youth than for White youth. These findings may reflect heightened disability stigma in Asian cultures (Bui & Turnbull, 2003; Choi & Lam, 2001), particularly for “invisible” disabilities, such as learning disabilities (Chen et al., 2004). Asian youth are also much less likely to have a reported learning disability than are White, Latinx, or Black youth (Office of Special Education Programs, 2018). Overall, these findings demonstrate how U.S. research on learning disabilities and math outcomes must more regularly incorporate consideration of this growing population.
Adjusted results suggest that the poorer ninth-grade math course outcomes of youth with learning disabilities are due to cumulative disadvantage rather than to disability-related inequities in the transition to high school for youth of diverse racial and socioeconomic backgrounds. Although this finding is positive in terms of the policies and processes guiding ninth-grade course placements, it may also reflect the decreasing flexibility of the math course sequence as students progress into high school. In other words, by ninth grade, math course placements are so predicated on students’ level of math in their prior year, and their performance in that course, that we can determine a student’s math course attainment at the end of high school by their middle school math experiences (Roderick et al., 2014). Moreover, although no real evidence suggests disability-related inequities during the transition into high school, cumulative disadvantage, in this case, likely includes disability-related inequities youth experienced before transitioning into high school, with the previous literature documenting how a learning disability classification, which can bias teachers’ perceptions of students’ potential (Allday et al., 2011; Ohan et al., 2011; Shifrer et al., 2013), subsequently limits their access to equitable opportunities to learn.
Some limitations merit mention. This study is focused on how learning disabilities relate to educational outcomes, but educational outcomes also predict being classified with a learning disability (Fletcher et al., 2005), threatening its internal validity. Endogeneity is a common problem in research on inequality (Lynch & Brown, 2011). Randomized controlled trials are the gold standard for causal answers, but they are often impossible or unethical, especially for questions related to health (Sanson-Fisher et al., 2007). Yet this study’s unadjusted results are in themselves a contribution because of our lack of understanding of baseline differences in adolescents’ outcomes at the intersection of disability, race, and SES. Although it is impossible to disentangle the source of these differences, I attempted to narrow the focus on potential disability-related inequities in the transition to high school first by using standard regression techniques, employing a wealth of covariates that relate to acquiring a learning disability classification (e.g., being a non-native English speaker), that capture the social implications of progressing through the education system with a learning disability classification (e.g., less access to opportunities to learn), and that are closely related to ninth-grade math course placements (e.g., achievement in the eighth grade). Second, I reestimated main analyses by using propensity score techniques, which are thought to better address selection bias than standard regression techniques (Rosenbaum & Rubin, 1987).
Although intersectional ideas are widely applied in feminist theory and beyond, researchers do not agree on what constitutes intersectional methodology (MacKinnon, 2013). Qualitative approaches may be better suited to the more personal subjective aspects of intersectional theory, but intersectionalists increasingly recognize the value of integrating quantitative approaches with intersectional perspectives (Covarrubias & Vélez, 2013; Hancock, 2007). U.S. racial categories eclipse the heterogeneous origins, backgrounds, and cultures each represents (Cruz et al., 2021; Windchief & Brown, 2017), but intersectionalists call for the strategic use of imperfect categories to document inequalities (Hancock, 2007; McNair et al., 2020). Similarly, the definition, diagnosis of, and “symptoms” of learning disabilities are variable (Shifrer & Fish, 2020), as partially evidenced in the different prevalence rates across racial and SES groups in this study. This study’s intersectional approach not only “controls” on differences in adolescents’ SES and race but explicitly centers and examines differences by race and SES in how disability relates to math course placements. Moreover, unlike previous federal data sets, HSLS allows consideration of youth with reported learning disabilities who may not be in special education. These adolescents’ disability status was measured in 2009—although rates of learning disability classifications have not increased as much as rates of autism and ADHD classifications have in recent decades, these results should be replicated with a more recent data set once it is available.
This study disrupts commonsense understandings of disparities in course outcomes as natural and inevitable for youth with learning struggles or differences. Intersectional theorists advocate for recognizing and including multiply marginalized identities or for not allowing these identities to be subsumed by the experiences of persons who share in only some aspects of their marginalization (Collins, 2015; Crenshaw, 1989). Future research taking a less nuanced analytic approach might narrow in on specific subgroups, such as less prevalent racial minority groups, such as Native American youth. Future research should also build on these findings to identify specific processes producing these disparities. This study advances knowledge through an intersectional theoretical and methodological approach, making it clear that considering individual status markers in isolation presents an incomplete and even inaccurate picture. This study answers multiple scholars’ calls: the consideration of disability in intersectional work (Annamma et al., 2018), the application of intersectional approaches in research focused on math and science (Ireland et al., 2018; Saw et al., 2018), and the more thoughtful consideration of race in research on educational and math disparities in particular (Diamond, 2018; McNair et al., 2020). Just as Prins (2006, p. 278) pointed out that White women should not be the “exemplary victims” of sexism, nor Black men the “exemplary victims” of racism, we cannot assume that the experiences of all children with disabilities in the United States mirror those of middle-class White children with disabilities.
Footnotes
Appendix A: Survey Items Used to Construct Scales
Appendix B: Propensity Score Approach
HSLS’s User’s Guide (Duprey et al., 2018) advises analysts to use Stata’s survey command to apply the base-year student analytic weight, account for HSLS’s complex survey design, and adjust for the clustering of students within schools. The survey command is only compatible with certain commands related to propensity score approaches (Garrido, 2014). I employ propensity score weights rather than propensity score matching techniques to facilitate the use of Stata’s survey command (DuGoff et al., 2014; Garrido, 2014). Following statisticians’ recommendations, I (a) created a propensity score, including the HSLS survey weight as one of the covariates (Table 6); (b) assessed the propensity score’s balance across treatment and comparison groups (Table 7); (c) weighted the treatment and comparison groups by the propensity score, using the covariates chosen in the first two steps; (d) multiplied the propensity score weight by the survey weight; and (e) estimated main analyses survey-set by the new weight variable. To combine a propensity score approach with multiply imputed data, I used the “within approach,” which Mitra and Reiter (2016) and Granger et al. (2019) found produces less biased estimates than the “across approach.” In the “across approach,” the treatment effect using the propensity score is estimated within each multiply imputed data set, and then the treatment effect estimates are averaged across the multiply imputed data sets. In the “within approach,” the propensity scores for each case are estimated within each multiply imputed data set and then averaged across the data sets, such that the treatment effects are estimated with the averaged propensity scores.
Relying on Stata’s pscore command, the models producing propensity scores (Table 6) include the measures available in HSLS that best capture factors that select youth into being classified with a learning disability (SES, race, whether the adolescent was born in the United States, whether their native language is English). Because school characteristics, and especially achievement levels, are highly determinant of which children are classified as learning disabled (Shifrer, 2018; Shifrer & Fish, 2020), I also included measures of eighth-grade achievement and high school context, even though they were probably measured after youth were classified with a disability (HSLS offers no earlier measures of these factors). These models are likely more robust than models with no measures of achievement or context, under the assumption that these more recent measures at least capture some aspect of youth’s earlier academic careers, with special education shown to typically not improve students’ achievement levels (Morgan et al., 2010; Shifrer, 2016; Shifrer et al., 2013). The models in Table 6 show that the likelihood of being classified with a learning disability are significantly lower for youth with higher levels of achievement and for youth in Catholic schools or schools in the west or the south, after adjusting for other factors. Corresponding with previous studies, with adjustments for differences in achievement, the likelihood of being classified with a learning disability is significantly lower for Black youth (Hibel et al., 2010; Shifrer, 2018; Shifrer et al., 2011) and for youth whose native language is not English (Maxwell & Shah, 2012).
Propensity score balance diagnostics are provided in Table 7. Balance is achieved when the difference in the mean level of the measure of interest is not statistically significant for treatment and control cases in the same block. Stata’s pscore command constructs enough blocks to ensure balanced propensity scores. From 95%–100% of covariates are balanced within each block. The dependent variable, whether the ninth grader’s math course is higher than normative, is balanced in every block but blocks 2 and 3. These blocks include control and treatment cases with the lowest propensity for being classified with a learning disability—namely, adolescents with higher levels of achievement. In addition to being indicative of the inconsistencies and subjectivities of the learning disability classification process (Shifrer & Fish, 2020), the differences in the outcomes of treatment and control cases in these blocks present the possibility that a learning disability will have a large negative effect for youth who are higher achieving (i.e., youth who are often also higher SES).
Declaration of Conflicting Interests
The author declared no potential conflicts of interest with respect to the research, authorship, and/or publication of this article.
Funding
The author disclosed receipt of the following financial support for the research, authorship, and/or publication of this article: This research is supported by the National Science Foundation (DRL-1652279) and by the National Institutes of Health funded Build EXITO program at Portland State University (UL1GM118964). This research also benefitted from suggestions from Linda Blum, Jamie Carroll, Paul Deppen, Angela Frederick, Lynn Fuchs, Eric Grodsky, Sarah Kyte Blanchard, Sarah Lubienski, Laura Mauldin, Karisma Morton, Chandra Muller, Jennifer Pearson, Carrie Shandra, Gwen Shusterman, and Alex Stepick.
Notes
Author
DARA SHIFRER is an associate professor of sociology at Portland State University, 1721 SW Broadway Ave, Portland OR 97201; email: