
Abstract
Due to the low success of traditional, postsecondary remediation mathematics, The Maryland Mathematics Reform Initiative First in the World Grant (MMRI–FITW) sought to develop and implement a statistics pathway in 2- and 4-year institutions as an alternative to traditional algebra-based math, to accelerate developmental mathematics students’ progress into credit-bearing postsecondary mathematics courses. In this study, we use cost to students and cost to institutions to estimate the cost per student and assess the cost-effectiveness of MMRI–FITW statistics-based vs. traditional algebra-based approach to developmental mathematics education for increasing student enrollment in college credit-bearing mathematics. The results indicate participating in the MMRI–FITW statistics-based vs. traditional algebra-based approach reduces education costs by approximately 7 percent and is 36 percent more cost-effective for increasing student enrollment in college-credit mathematics. The article concludes with the implications of the cost-effectiveness results for scaling the MMRI–FITW statistics-based approach
Keywords
Background
Earning general education mathematics credits early and performing well in mathematics is a strong predictor of completing a postsecondary degree (Adelman, 2006; Herzog, 2005; Zientek et al., 2020). Yet, almost two in five beginning college students are placed in remedial education (Snyder et al., 2016), with mathematics being the most frequently assessed remedial need in 2- and 4-year institutions (Valentine et al., 2017). Researchers have indicated that remedial mathematics is the single largest academic barrier to increasing overall college graduation rates (Attewell et al., 2006), and in some cases, becomes an insurmountable barrier (Bryk & Treisman, 2010). Trends in U.S. institutions indicate that 30 percent of community college students referred to developmental education do not even enroll in a remedial course (Bailey et al., 2010), and only 50 percent of community college students who take at least one remedial mathematics course finish their mathematics remediation requirements (Chen & Simone, 2016). Results from a meta-analysis of 21 developmental education studies from 1993 to 2015 demonstrate that placement in developmental education in 2- and 4-year institutions is associated with significant negative effects on credits earned, achievement in college-level courses, and degree attainment (Valentine et al., 2017).
Over the last two decades, researchers have presented many rationales and arguments for the poor success rates of traditional remedial approaches, including math anxiety (see (Ma, 1999) ; Zientek et al., 2010); insufficient skill development (Scott-Clayton & Rodríguez, 2012); lack of alternative pathways and academic-support (Bryk & Treisman, 2010). Meta-analysis studies (Ma, 1999; Zhang et al., 2019) have demonstrated a significant and robust negative association between mathematics achievement and mathematics anxiety, and remedial students tend to have higher levels of mathematics anxiety than the average population (Zientek et al., 2010). Furthermore, some have argued that mathematics anxiety may contribute to students taking fewer mathematics courses or deferring enrollment (e.g, Ashcraft and Moore, 2009; Zientek et al., 2018, 2020). Scott-Clayton and Rodríguez (2012) used administrative data about 100,000 students in a large, urban community college system using a regression discontinuity approach and found that instead of discouraging initial enrollment or persistence, the effect of remediation appeared to be diversionary, that is students simply took remedial courses but not college-level courses. The authors also noted that their findings affirmed prior research (e.g., Calcagno & Long, 2008 ; Martorell and Mcfarlin, 2011 as cited in Scott-Clayton & Rodríguez [2012]) indicating that assignment to remediation does not develop students’ skills sufficiently to increase their rates of college success. Bryk and Treisman (2010) framed part of the problem as the curriculum and support offered, arguing institutions need to develop a statistics pathway as an alternative to current math sequences and provide students with an academic support system.
Nonetheless, extensive student participation in developmental education continues with each developmental course costing students approximately $1,500. On average, students pay $3,000 and add $750 in loan debt for two developmental courses (Barry & Dannenberg, 2016). The result is college students in the U.S. pay approximately $1.3 to $1.5 billion for remediation annually (Barry & Dannenberg, 2016; Jimenez et al., 2016).
Due to the low success of traditional remediation mathematics in preparing students to succeed in college-level math and attaining degrees at 2- and 4-year institutions (e.g., Boatman & Long, 2018; Valentine et al., 2017) and substantial investments, recent redesign efforts have shifted the conversation toward developmental education approaches (see, for example, Rutschow & Mayer, 2018; Whinnery & Pompelia, 2018). Developmental approaches often integrate multiple instructional methods, blending elements of streamlining, in which remedial work is condensed or combined with college-level work, and alignment in which quantitative requirements are organized around programs of study. For example, replacing algebra-calculus with statistics for students pursuing social science or humanities credentials (Logue et al., 2019). Blending elements of these approaches is corequisite remediation, in which students may take college-level courses with academic support in select areas of need. Researchers argue that streamlining and alignment approaches may be more successful for improving students’ postsecondary success because placing students in college-level courses that meet general math education requirements may be more motivating, and college-level courses (statistics) may be easier for students to understand because it is more concrete than algebra-based math (Logue et al., 2019) and more closely related to the mathematics students need for their majors. In a Randomized Control Trial (RCT), Logue et al. (2016) compared the effects of traditional (algebra-based) and corequisite remediation (statistics-based) at three City University of New York community colleges and found a significantly higher pass rate with corequisite than traditional remediation. And, in a follow-up study using the same sample of students, Logue et al. (2019) found a long-term positive effect of corequisite remediation on graduation rates and concluded that policies requiring corequisite mathematics versus traditional remediation resulted in greater student success.
While there are some promising positive effects of developmental education redesign efforts, most research focuses on the effects of developmental education, exclusive of the costs. An exception is Belfield et al. (2016), which examined the cost-effectiveness of the corequisite remediation model as it was implemented across 13 community colleges in Tennessee and found gains in cost-effectiveness from moving from prerequisite to corequisite remediation on students’ rate of college-level gateway course completion. Using administrative interviews (in which respondents identified resources needed to create, implement, and provide prerequisite and corequisite remediation) and Integrated Postsecondary Education Data System (IPEDS) data, the authors found the estimated cost per three-credit college-level course did not vary much under prerequisite versus corequisite remediation ($1,000 and $1,030, respectively). But the rates of college-level gateway math course completion among students placed in remedial math was 51 percent for the corequisite model compared to 12 percent for the prerequisite model, resulting in a cost per successful student of $3,840 (corequisite model) vs. $7,720 (prerequisite model), an efficiency gain of 50 percent in students’ rate of college-level gateway course completion. The authors conducted a sensitivity test and found the findings robust to changes in the cost per course and varied student success rates.
Because traditional approaches to developmental education have not been successful, and because of the high personal and institutional costs of developmental education, it is a critical public policy issue for which policymakers need lower-cost alternatives that yield equal or better results.
The Maryland Mathematics Reform Initiative
Statistics-Based Approach to Developmental Mathematics Education
The report—College and Career – Are Maryland Students Ready?—by the Maryland state's Department of Legislative services stressed concerns that across the state many new college students were not ready to begin college-level classes (Halbach, 2015). In response, building on decades of statewide mathematics reform efforts with funds from a Department of Education First in the World (FITW) grant, The Maryland Mathematics Reform Initiative (MMRI) sought to “develop, implement, and evaluate a statistics pathway to accelerate developmental students’ progress into credit-bearing postsecondary courses and help more students reach certificate or degree completion effectively and efficiently” (Shapiro, 2016). Policymakers hypothesized that the MMRI–FITW alternative statistics pathway would be an effective strategy to reduce costs and time associated with taking multiple developmental-level math courses for college credit accumulation and successful completion of a postsecondary degree among students who mostly enroll in programs of study in the social sciences and humanities (Shapiro, 2016) and pursue majors that do not require algebra-based calculus. For that reason, the MMRI–FITW alternative statistics pathway targeted students in non-STEM majors. The aim was to address the “disconnect” between the mathematics content students are taught and the mathematics they need to be successful in social sciences and humanities majors (Shapiro, 2016). Each campus designed its own new developmental math course within guidelines that stipulated that courses focus on algebraic and numerical skills that prepare students for statistics (Morgan et al., 2019; Shapiro, 2016). At most institutions, the traditional approach consisted of a sequence of algebra-based developmental math classes that relied on the use of baseline math test scores to decide how many and which courses students should take. We refer to this approach as the traditional algebra-based approach and used it to identify students in the comparison group. (For additional information regarding the implementation of MMRI–FITW, see Morgan et al., 2019 and Marshall & Shapiro, 2019).
Given the rapid influx of new approaches for addressing developmental mathematics education, the field must continue to examine the impact of such efforts. And, information about the cost-effectiveness of alternatives is critical for policymakers and decision-makers to make informed decisions about interventions or reforms that may be more efficient for improving outcomes among students who take developmental mathematics courses.
Purpose of This Study
This study addresses the gap in the literature on the cost-effectiveness of alternative approaches to developmental mathematics education. Most of the literature on developmental mathematics education has focused on the effectiveness of such approaches and not the costs (an exception includes Belfield et al., 2016). While some positive effects of the MMRI–FITW statistics-based approach to developmental mathematics education have been identified on students’ passing rates in developmental math courses and enrollment in college, credit-bearing math courses (Feldman et al., 2020), these effects have not been assessed in combination with the cost to assess the cost-effectiveness. This study expands those findings by examining the cost-effectiveness of the MMRI–FITW statistics-based approach vs. the algebra-based traditional approach. CE analysis determines which intervention provides the highest level of effectiveness for a given cost (Levin et al., 2018). Specifically, our question is: Which approach to developmental mathematics education, MMRI–FITW statistics-based or traditional algebra, is more cost-effective for increasing postsecondary students' enrollment in credit-bearing math courses?
This type of information is critical to support education agencies’ in the adoption of programs, policies, and practices (IES, 2020). While CE analysis does not provide information about the overall worth of an intervention based on overall cost and benefits to society (as the cost-benefit analysis does) it is critical for determining which approach is more efficient in getting students to enroll in credit-bearing mathematics courses. For students, the results of this CE analysis are useful for deciding which approach to developmental mathematics may be more cost-effective to participate in, to complete college mathematics requirements, and eventually receive a degree. For policy- and decision-makers, the results of the CE analysis provide information about which approach is more efficient for increasing student enrollment in college-level credit-bearing math courses, which can be used to inform decisions about how to optimize resource allocation across comparable approaches. Ultimately, developmental mathematic education reforms may not be successful if they are not more cost-effective than traditional approaches.
Methodology
This retrospective CE analysis (Levin et al., 2018) compares the cost and effectiveness of the MMRI–FITW statistics-based approach to developmental mathematics education (treatment) with the traditional algebra-based approach (comparison) for increasing students’ enrollment in college-level credit-bearing math courses. We compare students who enrolled in the new courses that focused on preparation for statistics (treatment group) with students who enrolled in traditional algebra-based preparation for calculus (comparison group) over four semesters during their enrollment in college-level credit-bearing math courses. To estimate the costs of the MMRI–FITW statistics-based vs. traditional algebra-based approaches, we used two different methods: 1) institutional student expenses (student costs) based on willingness-to-pay, and 2) ingredients method based on opportunity costs (Levin et al., 2018) (institutional costs). The two methods provide cost burden estimates from different perspectives. The institutional student expenses indicate the cost burden to students for participating in the MMRI–FITW statistics-based vs. traditional algebra-based developmental mathematics class. The ingredients method, however, captures the cost burden to the institutions to provide faculty, facilities, and general overhead costs to implement the MMRI–FITW statistics-based alternative. For the ingredients approach, we conducted the following steps: identified primary program ingredients, priced the ingredients, calculated costs, and conducted a sensitivity analysis (IES, 2020; Levin et al., 2018). For the effectiveness measure, we used impact estimates on student’s rates of passing developmental math, and enrollment in credit-bearing math from a previous quasi-experimental design (QED) with a matched sample (Feldman et al., 2020). We discuss the study sample, the approaches to estimating costs, effectiveness estimates, and estimating the cost-effectiveness ratio below.
Sample: Schools and Students
The eight institutions included in the study represent a range of institutions in Maryland and include five 2-year (community colleges) and three 4-year institutions. The sample contained both large and small institutions, with the largest serving approximately 19,000 undergraduates per year and the smallest serving fewer than 700. The institutions are located in rural, suburban, and city settings in Maryland. Since students were not randomly assigned to either the MMRI–FITW statistics-based or the traditional algebra-based approach, the study (Feldman et al., 2020) used a QED to create the treatment and comparison groups. To be eligible, students had to enroll in the MMRI–FITW statistics-based developmental course or the traditional algebra-based developmental course in a sequence between summer 2017 and spring 2018. Students also had to be a social science or humanities major, undecided, and/or not pursuing a STEM-related credential. Students from the eight institutions were matched on baseline math ability and Pell grant status (as a proxy for socioeconomic status) resulting in an analytic sample of 2,041 students: 748 treatment students and 1,293 comparison students. The characteristics of the matched analytic sample are displayed in Table 1. This analytic sample was used to generate cost estimates and the main effects. (For more information about the sample selection process, matching process, and baseline math ability and SES, before and after matching, see Feldman et al., 2020.)
Characteristics of the Matched Analytic Sample (N = 2,041).
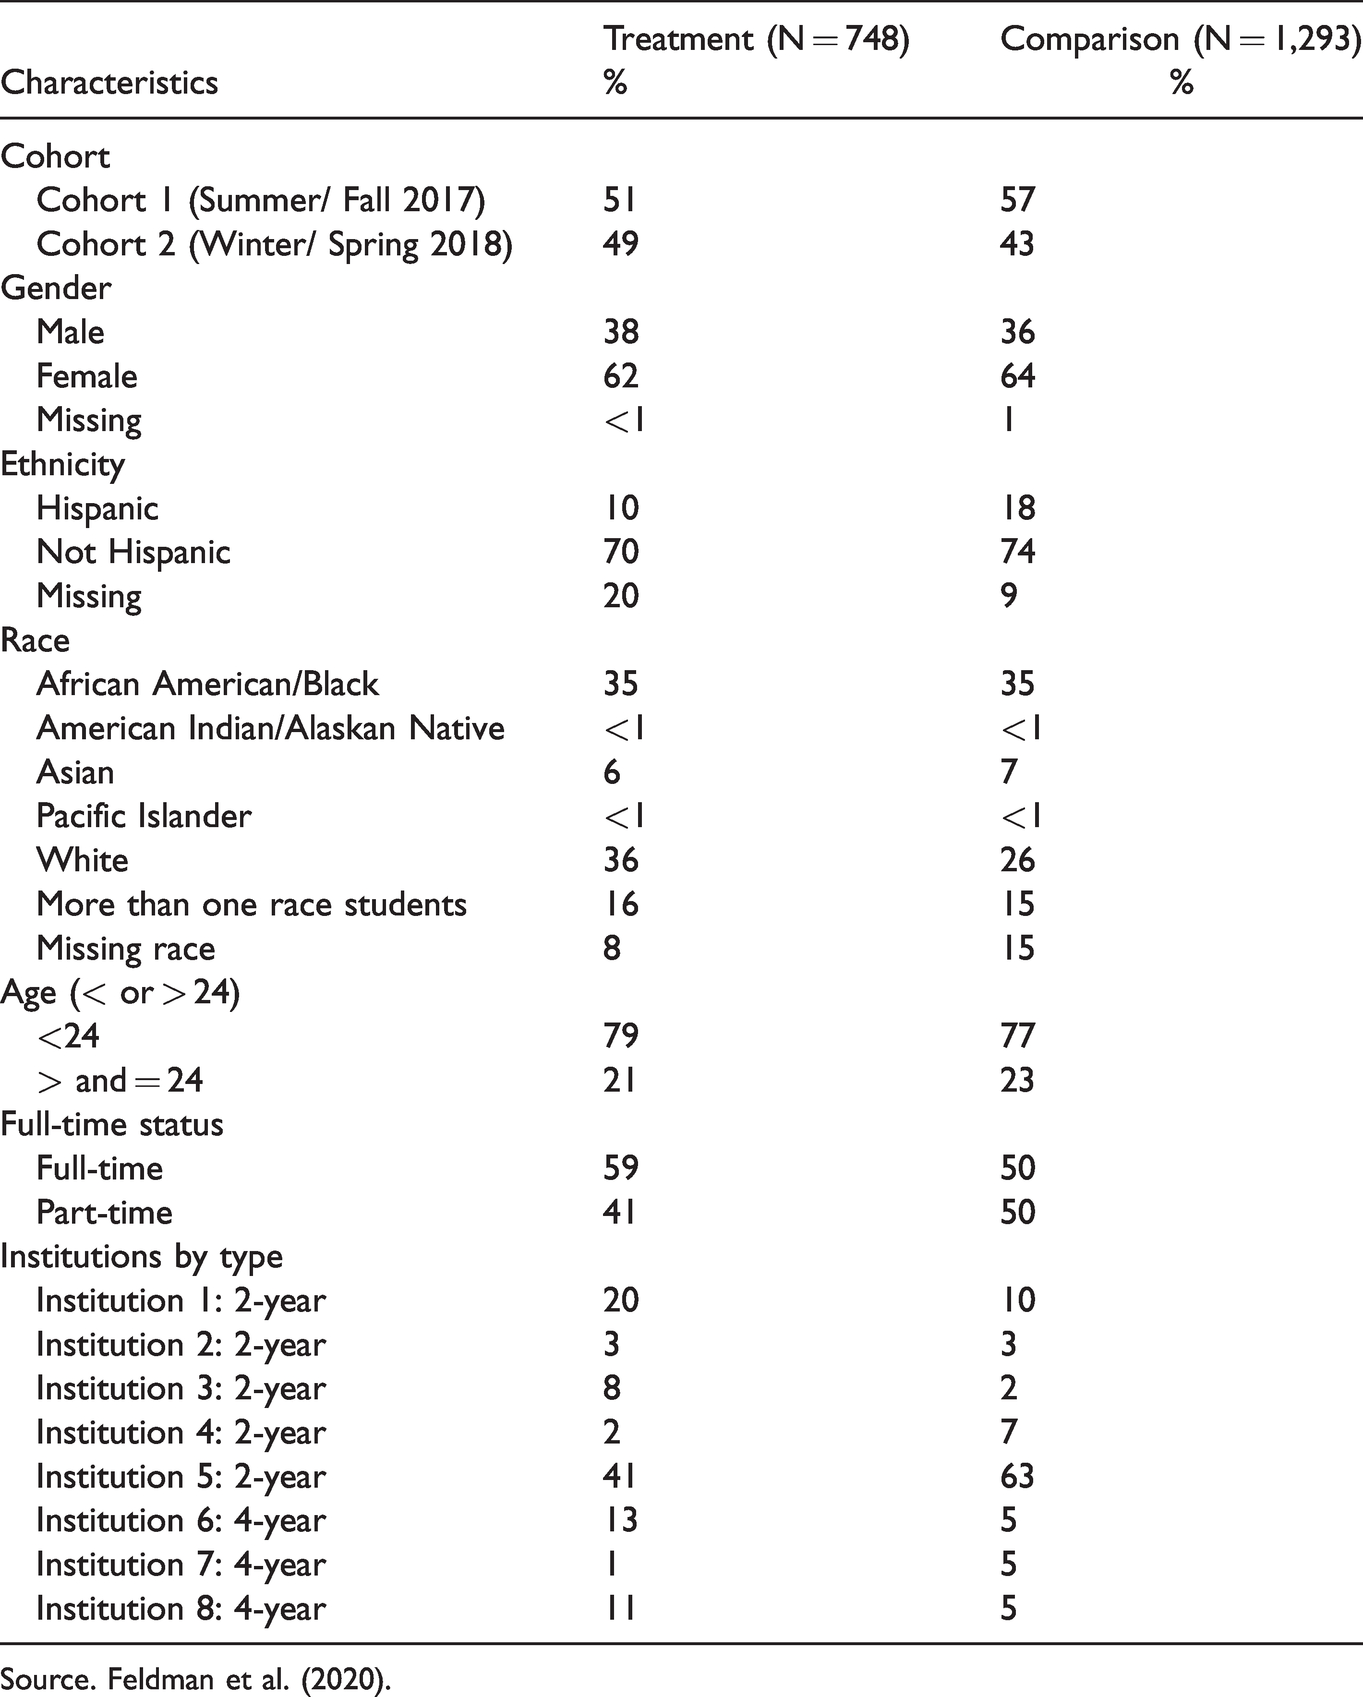
Source. Feldman et al. (2020).
Approaches to Estimating Costs
We estimated costs using two methods: 1) student expenses and 2) the ingredients method (Levin et al., 2018). The two methods estimate the cost burdens to different stakeholders—that is, cost to students and cost to institutions. And, while there is uncertainty in either approach, and both capture different costs, estimating both provides a sensitivity check to assess whether each approach is within a reasonable range of each other (though they capture different costs) and whether the use of one or the other influences the results of the CE analysis. However, both approaches are limited to the extent that they include all possible start-up or marginal costs; for example, the additional costs of institutions transitioning from the traditional algebra-based approach to the MMRI–FITW statistics-based approach. Nonetheless, the approaches are indicative of how costs can be estimated for developmental education alternatives. For example, as discussed above, Belfield et al. (2016) used IPEDS data to estimate costs of a prerequisite and corequisite remediation model across ten community colleges in Tennessee.
For the student expense approach, we collected 2018-19 student expense data from the IPEDS for the eight institutions. The estimated expenses for an academic year included the tuition and fees, and costs of living. For the tuition and fees, given all the institutions had a high percentage (>70%) of in-state students, we weighted the institution fees by the in- and out-of-state student population for each institution and then averaged the weighted tuition and fees across all institutions. We added the average weighted tuition and fees to the average costs of living estimates across all campuses to estimate the average total student expenses for an academic year. Provided additional information was not available about students’ living conditions (e.g., on- or off-campus, living at home), we did not weigh these expenses accordingly. To estimate student expenses, we prorated the average total student expenses for an academic year for one 3-credit course, assuming 30 credits over an academic year. We multiplied this amount by the number of unique attempts of taking the developmental course (using estimates from the impact study) for the treatment and comparison groups to estimate the per-student cost for each group (MMRI–FITW statistics-based vs. traditional algebra-based).
From the ingredients method to estimating costs, we identified and priced key program ingredients, and calculated the cost per student for the MMRI–FITW statistics-based and traditional algebra-based approaches. The primary ingredients were faculty salaries to faculty who provide developmental course instruction, facilities used to provide instruction, and institutional overhead rates. Key parameters used to estimate the costs of the ingredients included average faculty salary, average teaching load, average institution overhead rate, average student enrollment in mathematics courses, average square footage of institutions’ classroom, and average faculty/student ratio. To identify the costs of faculty and facilities, we used costs from CostOut® (Hollands et al., 2015), which has a database of U.S. prices for common ingredients of educational programs. We also referenced institutional documents (e.g., student catalogs and faculty workload guidelines, Internal Budget and Operating Plans, and Maryland Community College Space Utilization Report) to estimate student academic loads, faculty workloads, and use of facilities.
We used institutional overhead rates for on-campus instruction to estimate an average overhead rate across institutions. Given that the cost model uses the same averages for the parameters listed above for the treatment and comparison group, the cost parameter that varies between the two groups (besides sample size) is the number of unique attempts to pass a developmental mathematics course. Because all else is equal, this cost parameter drives the differences in the cost estimates between the two alternatives.
Effectiveness Estimates
The effectiveness estimates were obtained from an impact study that examined the impact of the MMRI–FITW statistics-based vs. traditional algebra-based approach to developmental mathematics education on students’ enrollment rates in college-level credit-bearing math courses (see Feldman et al., 2020 for additional information regarding sample selection, data collection, and creating the matched analytic sample). We used the impact of MMRI–FITW statistics-based approach on student enrollment in a credit-bearing course as the effectiveness measure to calculate the cost-effectiveness ratio. The impact study found that the MMRI–FITW statistics-based approach to developmental mathematics education had a significant, positive effect size of .141 (p<.001) on students’ enrollment in college-level credit-bearing math (Feldman et al., 2020). The authors found that 49 percent of treatment students enrolled in credit-bearing math, relative to 34 percent of comparison students. This represents a 15 percentage point gain in (adjusted) student enrollment in a college-level credit-bearing math course.
Estimating Cost-Effectiveness Ratio
To conduct the cost-effectiveness analysis, we combined the costs and effectiveness measures into a cost-effectiveness (CE) ratio (Levin et al., 2018) for the MMRI–FITW statistics-based (treatment) and traditional algebra-based (comparison) group. We divided the per-student cost of the MMRI–FITW statistics-based vs. traditional algebra-based approach by the effectiveness measure, that is, the percentage of students enrolling in credit-bearing math. The CE ratio is interpreted as the cost per student that results in a 1 percentage point increase in the percentage of students who enrolled. This metric can also be interpreted as the average cost per successfully enrolled student. The intervention with the lower CE ratio is more cost-effective.
Results
Costs of MMRI–FITW Statistics-Based (Treatment) Versus Traditional Algebra-Based (Comparison) Approaches
The student expenses for the MMRI–FITW statistics-based (treatment) vs. traditional algebra-based (comparison) approaches to developmental mathematics education are displayed in Table 2. The average expenses for course enrollment per student for MMRI–FITW statistics-based (treatment) approach to developmental mathematics education is $2,450 (rounded to the nearest ten) compared to $2,650 for the traditional algebra-based (comparison) approach. The cost per student indicates the MMRI–FITW statistics-based (treatment) approach costs 7 percent less than the traditional algebra-based (comparison) approach. The average number of unique attempts to pass developmental courses was multiplied by the number of students participating in each group to determine the total number of developmental mathematics courses in which students enrolled, which was multiplied by the average expenses per course to estimate the total expenses for courses students enrolled in. The total expenses were divided by the number of students in each group to estimate the average per student expenses for the treatment and comparison group.
Student Expenses for MMRI–FITW Statistics-Based and Traditional Algebra-Based Approaches.
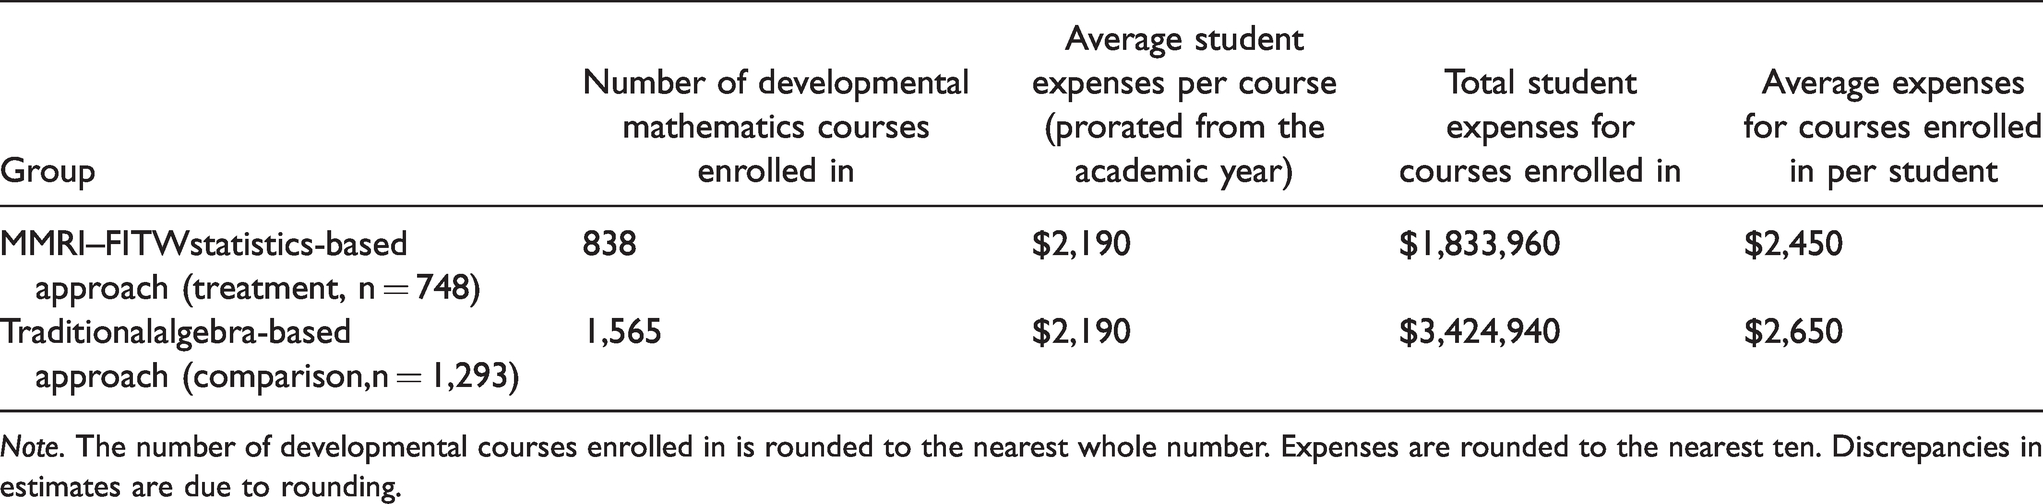
Note. The number of developmental courses enrolled in is rounded to the nearest whole number. Expenses are rounded to the nearest ten. Discrepancies in estimates are due to rounding.
We also used the ingredients method to calculate the cost per student for MMRI–FITW statistics-based vs. traditional algebra-based approaches. To estimate the faculty costs for the treatment group, first, we multiplied the number of students (n = 748) by the average number of adjusted attempts for completing a course (1.12) to estimate the total number of courses enrolled in (838). Then, we divided the total number of courses enrolled in (838) by the average student to faculty ratio (21:1) to estimate the number of courses provided (40). Next, we divided the number of courses provided (40) by the average teaching load (7-8 units [3-credit course] per year) to estimate the faculty full-time equivalency (FTE) required to provide instruction (5.7). Finally, we multiplied the FTE required to provide instruction (5.7 FTE) by the salary of a mathematical science instructor rate ($86,210) with average benefits as a percentage of personnel salary of 54 percent (Hollands et al., 2015) resulting in total faculty costs of $755,540 for the treatment group. 1 We calculated the faculty costs for the comparison group using the same process, but different numbers for the number of students (n = 1,293) and the average number of adjusted attempts for completing a course (1.21).
To estimate the facility costs for the treatment group, we started with a similar process. First, we multiplied the number of students (n = 748) by the average number of adjusted attempts for completing a course (1.12) to estimate the total number of courses enrolled in (838). We divided the total number of courses enrolled in (838) by the average student to faculty ratio (21:1) to estimate the number of standard classrooms required to provide instruction (40) (synonymous with the number of courses provided). Then, we multiplied the number of standard classrooms required to provide instruction (40) by the square footage capacity of facilities using the high range (740) resulting in 29,521 square footage. Next, we prorated the total square footage capacity by the amount of square footage used for 1 course (based on 3hrs a week instructional time) using 4 percent to estimate the total square footage required to provide instruction to the treatment group (1,265 sq. ft.). Finally, we multiplied the total square footage required to provide instruction (1,265) by the price per square footage of a college building and adjusted for inflation ($462) to estimate the total cost of facilities ($585,060) for the treatment group. 2 We calculated the facility costs for the comparison group using the same process, but different numbers for the number of students (n = 1,293) and the average number of adjusted attempts for completing a course (1.21).
To calculate other costs, we multiplied the average overhead rate across institutions (49.7%) by the faculty costs for the treatment ($755,540) and comparison ($1,410,990) groups, resulting in $375,510 and $701,260, respectively. 3 The costs of faculty, classrooms, and institutional overhead were summed and divided by the number of students to calculate the cost per student for the treatment and comparison group. Table 3 displays the cost per student derived from the total cost of personnel, facilities, and institution overhead used by the MMRI–FITW statistics-based and traditional algebra-based approaches. Compared to the cost per student based on student expenses, the cost based on the ingredients method is slightly less (6%) for the treatment and comparison groups ($2,290 and $2,480 respectively). But, the results are the same in that the MMRI–FITW statistics-based approach to developmental mathematics education is 7 percent less expensive than the algebra-based approach (displayed in Table 2). Though the cost per student estimates based on student expenses and the ingredients method capture cost burdens to different stakeholders (students vs. institutions), they both fall within the range provided in the literature on costs of developmental education courses (e.g., $830 [Belfield et al., 2016] to $3,000 [Barry & Dannenberg, 2016]).
Costs of MMRI–FITW Statistics-Based Versus Traditional Algebra-Based Approach to Developmental Mathematics Education Based on Ingredients Method.
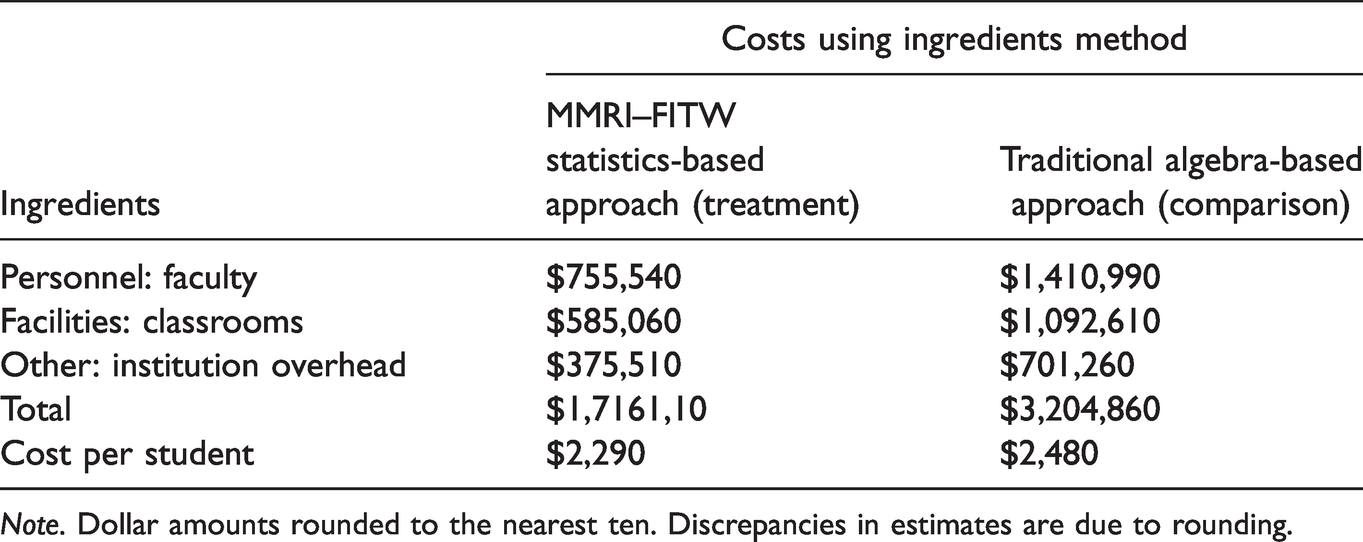
Note. Dollar amounts rounded to the nearest ten. Discrepancies in estimates are due to rounding.
Given the results of the cost-effective analysis are the same using cost per student from either method (discussed further in the sensitivity of costs section), we proceed with discussing the CE results using the costs derived from student expenses. This frames the discussion as the cost to students for the additional effect of MMRI–FITW statistics-based vs. traditional algebra-based approach on enrollment in college-level credit-bearing math courses.
Cost-Effectiveness of MMRI–FITW Statistics-Based Versus Traditional Algebra-Based Approach to Developmental Mathematics Education
Overall, we find that the MMRI–FITW statistics-based approach (treatment) is 36 percent more cost-effective than the traditional algebra-based approach (comparison). Table 4 presents the cost-effectiveness of the two approaches. Using the analytic sample, 367 of 748 (45%) students in treatment enrolled in college-level credit-bearing math vs. 440 of 1,293 (34%) in the comparison group. The total amount of costs allocated to the treatment and comparison group is approximately $1.83 million and $3.42 million, respectively. Dividing the total cost by the number of enrolled students provides an average cost of $5,000 (treatment) vs. $7,790 (comparison) for each successfully enrolled student in college-level credit-bearing math. The MMRI–FITW statistics-based approach requires 36 percent fewer resources than the traditional algebra-based approach to enable an academically underprepared student to enroll in a college-level credit-bearing math course. Hence, the MMRI–FITW statistics-based approach to developmental mathematics education is significantly more cost-effective than the traditional algebra-based approach.
Cost-Effectiveness of MMRI–FITW Statistics-Based Versus Traditional Algebra-Based Approach.
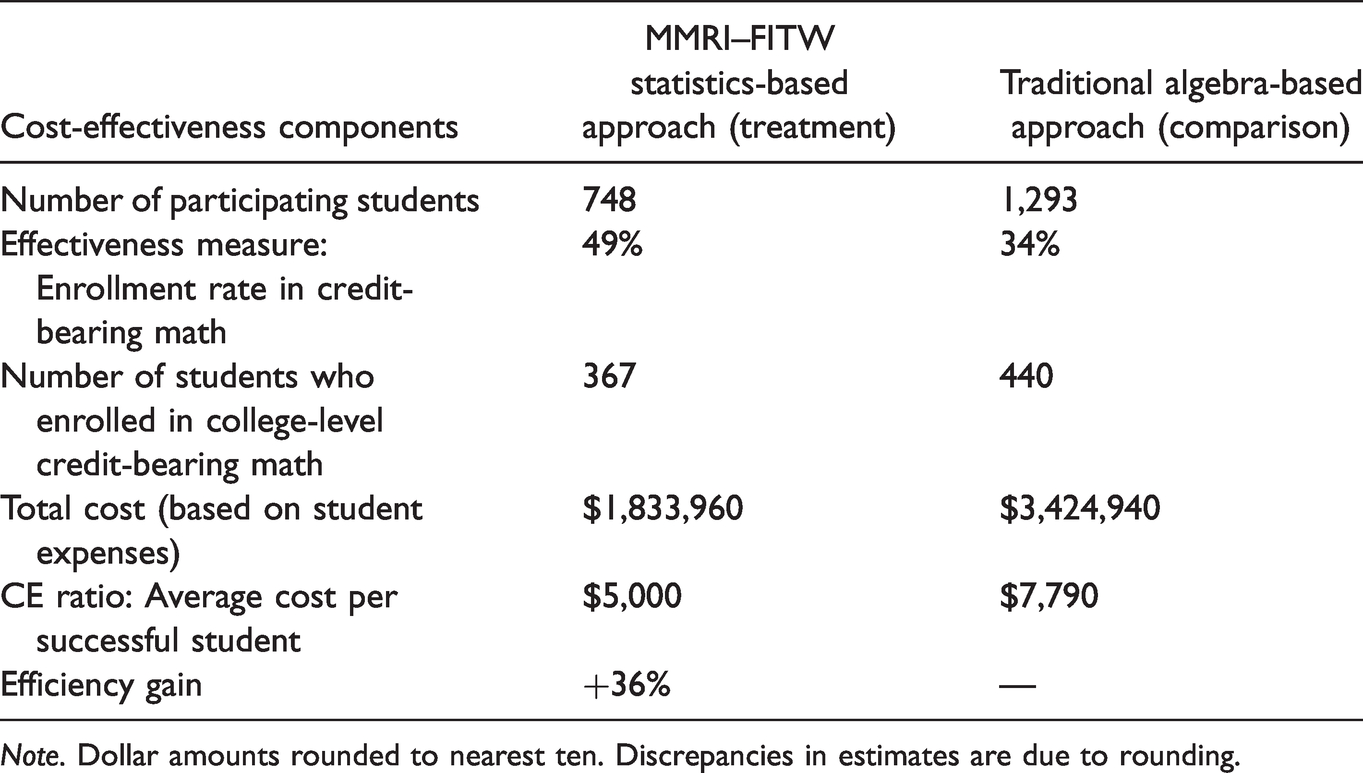
Note. Dollar amounts rounded to nearest ten. Discrepancies in estimates are due to rounding.
Sensitivity of Costs
The findings are robust to sensitivity testing of the cost parameters. Since estimating costs always involves uncertainty and estimates may vary (Briggs et al., 2012), we varied parameters in the cost model (e.g., average student expenses, average faculty to student ratios, average faculty salaries, average institutional overhead rates) to assess the implications for the CE ratio. We found efficiency gains moving to MMRI–FITW statistics-based from the traditional algebra-based approach under the different scenarios. While variations in cost parameters in the model do not change the results of the cost-effective analysis, they do demonstrate the possible range in per-student cost estimates. For example, prorating students’ expenses using an academic load of 24-units instead of 30-units, increases the cost per student from $2,190 to $2,740 (a 25% increase). In the ingredients method, changing the faculty to student ratio from 1:21 to 1:18 (the average student-to-faculty ratio for public 2-year institutions in 2018 [Condition of Education, 2020]) increases the cost per student for the treatment group from $2,290 to $2,680 [a 17% increase]).
Limitations
As a retrospective CE analysis, one of the key limitations of the study is we were unable to survey or interview staff about the actual ingredients (faculty, facilities, and other costs) used to implement the MMRI–FITW statistics-based vs. the traditional algebra-based approach. Hence, the cost estimates for the ingredients approach are based on secondary data sources for faculty salaries and costs of facilities. We did, however, collect the institutions’ data to estimate average class sizes (student to faculty ratio) and overhead rates. Similarly having more information about the students’ living arrangements (on- or off-campus) and credit load could provide more accurate estimates for the student expenses of MMRI–FITW statistics-based vs. the traditional algebra-based approach. To our knowledge, there was no reason to assume there were any differences between the students on these parameters.
However, it is also important to note if there were differences between groups on key cost parameters that could affect the cost-effectiveness results. For example, if for any reason, the treatment group had a lower student to faculty ratio than 1:21 that would increase the total cost per student, and would lower the overall cost-effectiveness of the treatment compared to the comparison group. This is true for the cost parameters that would increase the total cost (e.g., out of state students, taking fewer than 30 credits, living on campus, or using larger than the average classroom, higher-paid faculty). Conversely, if there were differences between groups on cost parameters that lower the costs (e.g., paying in-district fees, living at home, taking more than full academic load, having a higher faculty to student ratio than 1:21, using smaller than the average classroom, or lower-paid faculty) for one approach and not the other, that would lower the cost per student and increase the overall cost-effectiveness of the respective approach.
Discussion and Implications
This study provides initial evidence of the cost-effectiveness of the MMRI–FITW statistics-based approach to developmental mathematics education and is intended to help college educators and policymakers assess alternative approaches to developmental mathematics education. In general, cost-effectiveness analysis compares the cost of alternative approaches along with the impact on an outcome, which provides decision-makers with critical information for making informed decisions about program choices, budgets, and strategies (Hollands & Levin, 2017). Alternative approaches to developmental mathematics education approaches may integrate multiple instructional methods by, for example, condensing remedial work (streamlining), organizing quantitative requirements around programs of study (alignment), or allowing students to take college-level courses with academic support in select areas of need (corequisite remediation) (Logue et al., 2019). This study contributes substantially to the limited literature on the cost-effectiveness of different approaches to developmental mathematics education (e.g., Belfield et al., 2016) based on a streamlining and alignment approach. In particular, this CE study provides initial evidence that the MMRI–FITW statistics-based approach to developmental education is 36 percent more cost-effective than the traditional algebra-based approach, representing a substantial increase in efficiency. Furthermore, the results of this CE analysis indicate that the MMRI–FITW statistics-based approach had a medium effect size (ES = .05 to <.20) and moderate cost ($500 to < $4,000) as indicated in Kraft’s (2020) schema for interpretation of cost-effectiveness ratios. These results also fall within the “reasonable to scale” range (Kraft, 2020). The typology provides a way to incorporate scalability into the process of interpreting effects but only provides a high-level assessment.
Stakeholders deciding whether to adopt or expand the MMRI–FITW statistics-based approach need to consider whether the costs and effects of the MMRI–FITW statistics-based approach would be similar if it was offered across more institutions. The impact study included a diverse group of students and found the results were robust across subgroups of students (part-time and non-traditional [age 24+] students) (Feldman et al., 2020). Nonetheless, decision-makers and policymakers should assess the extent that the sample in the impact study is representative of their student body. Stakeholders should also consider whether the fidelity of implementation of the MMRI–FITW statistics-based approach would be similar at new institutions (e.g., adoption of course components, staffs’ knowledge, and skills regarding new components) and whether policies support the adoption of the MMRI–FITW statistics-based approach across more institutions? To inform this discussion, stakeholders should refer to the published implementation stories from eight campuses providing context for the QED study and showcasing the diversity of institutions and issues faced by advisors, counselors, and faculty (Morgan et al., 2019).
Some of the sensitivity analysis and limitations of this study are particularly pertinent to the scalability issues raised above. For instance, are cost estimates of the MMRI–FITW statistics-based approach reflective of the costs, if implemented, using different key ingredients? The results of the sensitivity analysis indicate that if there are differences between the groups on key cost parameters, then that can influence MMRI–FITW cost-effectiveness comparisons between the MMRI–FITW statistics-based alternative and the traditional algebra-based approach. For example, if the new approach is implemented with a lower student-to-faculty ratio, then that would substantially increase the cost and reduce the cost-effectiveness of the statistics-based approach. While this CE analysis is limited to enrollment in a college-level credit-bearing math course, given that the per student cost is less for the MMRI–FITW statistics-based approach, even if there is no long-term effect on student graduation (i.e., graduation rates between groups are equal), the statistics-based alternative would still be more cost-effective than the traditional algebra-based approach—given it costs less to achieve the same outcome.
Conclusion
Collectively, past efforts to improve the outcomes of students placed in remedial mathematics education at 2- and 4-year institutions have yielded disappointing results (Valentine et al., 2017), but recent developmental education efforts designed around streamlining, aligning, and/or blending provide more positive results (e.g., Logue et al., 2019). As promising developmental mathematics reforms continue to be implemented across the nation, it will be critical to assess their effectiveness along with the relative cost of reforms to assess whether interventions are providing a higher level of effectiveness for a given cost. By acting as a convenor, the University System of Maryland (USM) can bridge gaps and smooth transitions across the P-20 pipeline from the student (practical) and state (policy) perspectives using its policy office to access federal grants. In a state where 71 percent of community college students and 24 percent of students in four-year colleges test into developmental math, the results of this study suggest alternative approaches to developmental mathematics education for students in non-STEM majors may yield significant increases in efficiency. Given the substantial nationwide investment of $1.5 billion in developmental education (Barry & Dannenberg, 2016), using results from CE analysis to allocate resources more efficiently could save hundreds of millions of dollars.
Footnotes
Acknowledgment
The authors thank staff at the University System of Maryland, Nancy Shapiro and DeWayne Morgan, for reviewing drafts of this article. We also thank Karen Feagin for her research support and assistance.
Declaration of Conflicting Interests
The authors declared no potential conflicts of interest with respect to the research, authorship, and/or publication of this article.
Funding
The authors disclosed receipt of the following financial support for the research, authorship, and/or publication of this article: This work was supported by U.S. Department of Education, Fund for the Improvement of Post-Secondary Education (FIPSE), First in the World (FITW) grant program (P116F150201).