
Abstract
We investigated how the transition to remote instruction during the COVID-19 pandemic affected students’ engagement, self-appraisals, and learning in advanced placement (AP) Statistics courses. Participants included 681 (Mage=16.7 years, SDage=.90; %female=55.4) students enrolled in the course during 2017–2018 (N=266), 2018–2019 (N=200), and the pandemic-affected 2019–2020 (N=215) school years. Students enrolled during the pandemic-affected year reported a greater improvement in affective engagement but a decrease in cognitive engagement in the spring semester relative to a previous year. Females enrolled in the pandemic-affected year experienced a greater negative change in affective and behavioral engagement. Students enrolled during the pandemic-affected year reported a greater decrease in their anticipated AP exam scores and received lower scores on a practice exam aligned with the AP exam compared to a prior year. Although students were resilient in some respects, their self-appraisal and learning appear to have been negatively affected by pandemic circumstances.
Keywords
Introduction
The COVID-19 pandemic has undoubtedly had a direct impact on physical and material aspects of learning in school settings. Widespread school closures in response to the COVID-19 pandemic are estimated to have affected at least 50 million students enrolled in K–12 school-based settings in the United States beginning in March 2020 (UNESCO, 2021). Most school closures within the United States began shortly after COVID-19 was declared a pandemic on March 11 and a national emergency on March 13, 2020 (Federal Register, 2020), as state governments began issuing specific orders (e.g., State of Indiana 2020a, 2020b). Instructors and students rapidly transitioned from in-person to remote and online teaching and learning environments. The impact of such a rapid transition and its long-term effect on factors associated with student learning are still largely unknown, given the unprecedented nature of the circumstances. Not only the modality of instruction but, in many cases, the scope of content within the course itself substantially differed from previous years, given the need to reprioritize (Reimers & Schleicher, 2020). Such swift and drastic instructional and curricular changes created obvious limitations in the use of psychoeducational assessments to measure student learning in a valid and reliable way that enabled comparisons with previous academic years (Stifel et al., 2020).
Compounding these difficulties in capturing useful information that could be used for monitoring student learning, the rippling impact of the pandemic itself is thought to have exacerbated existing social inequalities (Dorn et al., 2020). Recent evidence has shown a negative impact on the social, emotional, physical, and mental health of K–12 students, with students from minoritized communities likely to have been more negatiely affected (McKune et al., 2021). As such, to understand the impact of the COVID-19 pandemic, we must consider not only differences in learning outcomes but also differences in motivation-related factors, such as engagement and self-efficacy. It is important to evaluate whether differences in such factors are emerging for students from historically marginalized groups, as accumulating evidence suggests a widening of disparities induced by the pandemic circumstances (Darling-Aduana et al., 2022).
Impact of COVID-19
Engagement
It is reasonable to expect that students would and could not be as engaged in learning as they had been in previous academic years under the stressful circumstances of COVID-19. Such academic engagement is thought to comprise three dimensions related to affective (i.e., interest and motivation), behavioral (i.e., observable participation), and cognitive (i.e., appraisals, self-concept, and self-confidence) processes (Fredricks, 2011). Research regarding undergraduate students’ attitudinal changes during the pandemic suggests marked decreases in students’ engagement in coursework, perceptions of their own present academic success, and goals related to academic achievement (Daniels et al., 2021). Disengagement is associated with diminished learning outcomes in online settings (Sun & Rueda, 2012). Even under non-pandemic circumstances, K–12 students who have never taken online courses may especially struggle to remain engaged and succeed in the courses and beyond (Hart et al., 2019).
Self-Efficacy
Aside from students’ engagement in learning having been affected by school closures during the COVID-19 pandemic, other factors associated with learning are likely to have been negatively affected. Students’ self-efficacy and ability to monitor their own performance are likely to have suffered. Self-efficacy refers to someone’s beliefs about abilities to produce desired levels of performance in activities or events that have some effect on their lives (Bandura, 1994). Some undergraduate students tended to express diminished self-efficacy by reporting a decrease in their academic achievement at the onset of the pandemic (Daniels et al., 2021). Although past research has found that students are remarkably accurate in predicting their performance on AP exams (Ober, Hong, et al., 2022), their ability to do so accurately under normal circumstances appears to necessitate that they be provided standards to calibrate their performance against (Nederhand et al., 2019). During the pandemic, many instructors adapted their approaches to instruction, assessment, and provision of constructive feedback to prioritize other needs, such as students’ well-being (UNESCO, 2021). As such, students may not have had sufficient opportunities to self-monitor and -evaluate their learning. The ability to self-monitor one’s learning has long been regarded as a critical factor that contributes to academic achievement within a self-regulated learning framework (Zimmerman, 1990). Some evidence indicates that the association between self-efficacy and academic performance is reciprocal, suggesting that initial differences in self-efficacy may contribute to widening disparities in academic achievement (Talsma et al., 2018). Students during the pandemic-affected year are likely to not only have had lower self-efficacy but also may have been less accurate in self-monitoring and appraising their learning, given the limited opportunities for social interaction and feedback with teachers and classmates (Tannert & Gröschner, 2021).
Learning
Growing evidence indicates that the constraints on the context of emergency online and remote learning affected not only students’ engagement and ability to accurately self-appraise their performance but also their ability to learn and make measurable progress (Engzell et al., 2021). Given the associations between engagement, self-monitoring, and learning (Lei et al., 2018), evidence of a decrement in one aspect is likely to foreshadow a decrease in the overall quality of students’ learning experiences. However, due to existing social inequalities, students may have experienced the impact of the pandemic with greater severity than others (Van de Werfhorst, 2021). Some have pointed to evidence of a “digital divide” as a factor that could have affected access to online educational resources amid the transition to remote learning (Bacher-Hicks et al., 2021) and, thus, opportunities to learn (Lai & Widmar, 2021). The digital divide refers to the unequal access or use of digital technologies within society (Van Dijk, 2017). Past research has found that such differences in access and use based on gender (Elena-Bucea et al., 2020), race/ethnicity (Yoon et al., 2020), and socioeconomic status (Harris et al., 2017) affect K–12 students’ educational opportunities, even under “normal” pre-pandemic circumstances (Dolan, 2016). Aside from the access to online educational resources for learning, school closures themselves may have cut students off from other critical resources necessary to support their mental and physical health and overall well-being (Martin & Sorensen, 2020; Pattison et al., 2021). These combined factors contributed to the “twin pandemic” in the United States, such that minoritized individuals, particularly those so-categorized based on race/ethnicity and socioeconomic status, experienced greater hardship during the pandemic due to inequalities related to differences in structural and societal factors as access to health resources (Chen et al., 2021).
Student Learning Within Advanced Placement Statistics
There is widespread concern that students did not achieve learning gains during the 2019–2020 COVID-19 pandemic-affected year comparable to grade-level norms established in previous years (Daniel, 2020) and that the circumstances also furthered existing disparities in the quality of education (Lewin, 2020). Yet it is difficult to quantify the extent of the loss of learning opportunities due to the challenges in assessing student progress (Jankowski, 2020). Examining differences in student learning because of the COVID-19 pandemic requires a comparison across instructional contexts that otherwise maintain some level of consistency. Advanced placement (AP) courses may provide a naturalistic context in which making comparisons between the pandemic-affected year and prior years not only is feasible but also may be especially informative. Across the United States, high school students who take AP classes are taught in a way that prepares them to take the cumulative AP exam, which is a standardized exam administered nationally. Given that there are certain requirements for AP courses to be authorized (CollegeBoard, 2022a), teachers are often provided general (e.g., syllabus guide) and subject-specific (e.g., summer institutes, online workshops) teaching resources, and the course culminates in a standardized exam (CollegeBoard, 2022b), some consistency is to be expected in the course material across sections of the courses taught at different schools. Therefore, it may be possible to draw comparisons across multiple AP classes in the same subject area because the curriculum is likely to be consistent, even despite other contextual differences.
Students who enroll in AP courses are likely to be incentivized to complete the AP exam because they may receive college credit if they achieve a satisfactory grade on it. As such, changes in AP exam participation could forecast later trends in college enrollment (Bowers & Zhou, 2019). Students’ AP exam scores in math subject areas are strong predictors of postsecondary achievement (Ackerman et al., 2013). Achievement in math-related high school courses is also associated with other factors, such as higher postgraduate income (Goodman, 2019). Completing applied math courses such as those in statistics may be particularly beneficial for students who otherwise may not be oriented toward math or quantitative reasoning (Gottfried et al., 2014).
Even though the availability of AP programs is already relatively limited in schools serving predominantly African American or Hispanic/Latinx communities (Xu et al., 2021), changes in participation in the AP exam during the pandemic-affected year appear to have affected students from these communities more so than others. Current exam participation rates indicate that during the 2020 administration of the AP exams, participation waned across all subjects (−7% average change between 2019 and 2020; CollegeBoard, 2020a) but decreased especially among Black/African American (−16% average change between 2019 and 2020 across all subjects within the group) and Hispanic/Latinx (−13% average change between 2019 and 2020 across all subjects within the group) students (CollegeBoard, 2019, 2020b). In the context of science, technology, engineering, and mathematics (STEM) education, such students were considered underserved even prior to the onset of the pandemic (National Science Foundation, 2019). Underrepresented minority (URM) status is typically defined as belonging to a group whose number is substantially below the comparable figure for scientists and engineers who are not considered a racial or ethnic minority (U.S. Code, 2011). Further examining differences in factors related to student achievement within an AP Statistics course between the pandemic-affected 2019–2020 year and preceding academic years, as well as how such differences affected underserved students, could provide insight about future trends in students’ postsecondary educational attainment.
Participation in certain AP course subjects may be especially informative about long-term enrollment trends. Students in AP courses in subject areas that require quantitative reasoning have been found to be one of the strongest predictors of persistence in a STEM major in college (Ackerman et al., 2013). Statistics and data science education is a subject area increasingly valued across multiple theoretical and applied disciplines (Ben-Zvi & Garfield, 2008; Wise, 2020). Students who enroll in statistics courses are likely to have a range of academic and professional interests, given that such coursework renders knowledge and skills for critically assessing data and statistical arguments to make educated judgments. Considering changes during the pandemic-affected year within the context of AP Statistics is specific enough to allow for comparisons with previous academic years yet likely to attract a cohort of students with varied academic and professional interests, making it possible to generalize beyond the context of statistics education.
Research Aims
We were interested in determining whether and the extent to which students’ engagement in the course, self-appraisal of learning, and learning outcome in the context of AP Statistics was negatively affected in the 2019–2020 academic year after the transition to remote online instruction relative to previous years. We were specifically interested in understanding whether students who are typically underserved in STEM (i.e., female and/or URM students) are more likely to have been negatively affected. To pursue this aim, we examined changes in end-of-year outcomes related to these factors during the pandemic-affected 2019–2020 academic year in comparison to two previous academic years (i.e., 2017–2018, 2018–2019) through the following research questions.
Baseline Differences Between Cohorts in Engagement and Self-Appraisal
Cohort Differences in Change From Baseline to End-of-Year in Engagement and Self-Appraisal
End-of-Year Differences in Self-Appraisal and Learning
Considering the literature reviewed previously, we had several expectations. First, we anticipated a greater decrease in engagement during the “post-pandemic” period at the end of the 2019–2020 academic year relative to the preceding years. Given that the AP exam format and content differed from preceding years, not to mention the impact of the sheer stress induced by the circumstances, we also anticipated that students’ self-appraisal of their anticipated AP exam scores would show a greater decrease from the beginning to the end of the spring semester in the pandemic-affected year compared to a previous year and would be less accurate and more susceptible to bias than previous years. Because the format and content for the AP exam differed so dramatically from previous years (CollegeBoard, 2020a), we were limited in drawing conclusions about student learning based solely on their scores on the AP exam. However, we were able to make comparisons in students’ ability based on their scores on a series of computerized assignments and one comprehensive practice exam that was aligned with the pre-pandemic general AP Statistics exam framework (CollegeBoard, 2010). We anticipated a difference in estimates of student learning, with students tending to receive lower scores in the 2019–2020 academic year compared with previous cohorts.
Methods
Participants
The sample consisted of students enrolled in AP Statistics (Ntotal=681) in seven high schools located in the state of Indiana (United States) during the 2017–2018 (N=266), 2018–2019 (N=200), and 2019–2020 (N=215) academic years. School leadership and AP Statistics teachers were invited to take part in the study through contacts and outreach to local schools. Students enrolled in classrooms taught by participating AP Statistics teachers provided consent and assent documentation prior to study enrollment. To be included in the analytic sample, participants also had to provide demographic information on a baseline survey, complete at least one of the first two online assignments administered before the spring semester, and not withdraw from the course. These criteria were set to ensure that the sample consisted of students who were at least minimally engaged in the course before the period in the academic year corresponding with onset of the pandemic.
Similar to national participation in the AP Statistics exam in corresponding years (CollegeBoard, 2018, 2019, 2020b; see Table 1), the sample had more females (55.4%) than males (44.6%). Participants were ages 14–18 (Mean age=16.72 years, SD=.90) and identified as White/European American (66.6%), Asian/Asian American (19.7%), Black/African American (6.1%), Hispanic/Latinx (5.6%), Hawaiian/Pacific Islander (0.3%), and more than one race/ethnicity (7.8%). About 10.7% qualified for free or reduced-price lunches.
Demographic Information

Note. AP = advanced placement; GED = general equivalency diploma.
Measures
Across each academic year, data were collected at multiple time points to reflect students’ engagement in the course, their appraisals of their scores on the AP exam, as well as their learning as measured by scores on a computerized practice exam. Figure 1 shows the timeline of the data collection during the academic year for each of the three cohorts of students. The descriptive statistics for each measure are reported separately for each cohort and in aggregate in Table 2. Some self-report measures were not administered in the 2018–2019 academic year (cohort 2) due to other research priorities. Additional information is available in the online repository associated with this manuscript (see Ober & Cheng, 2022).
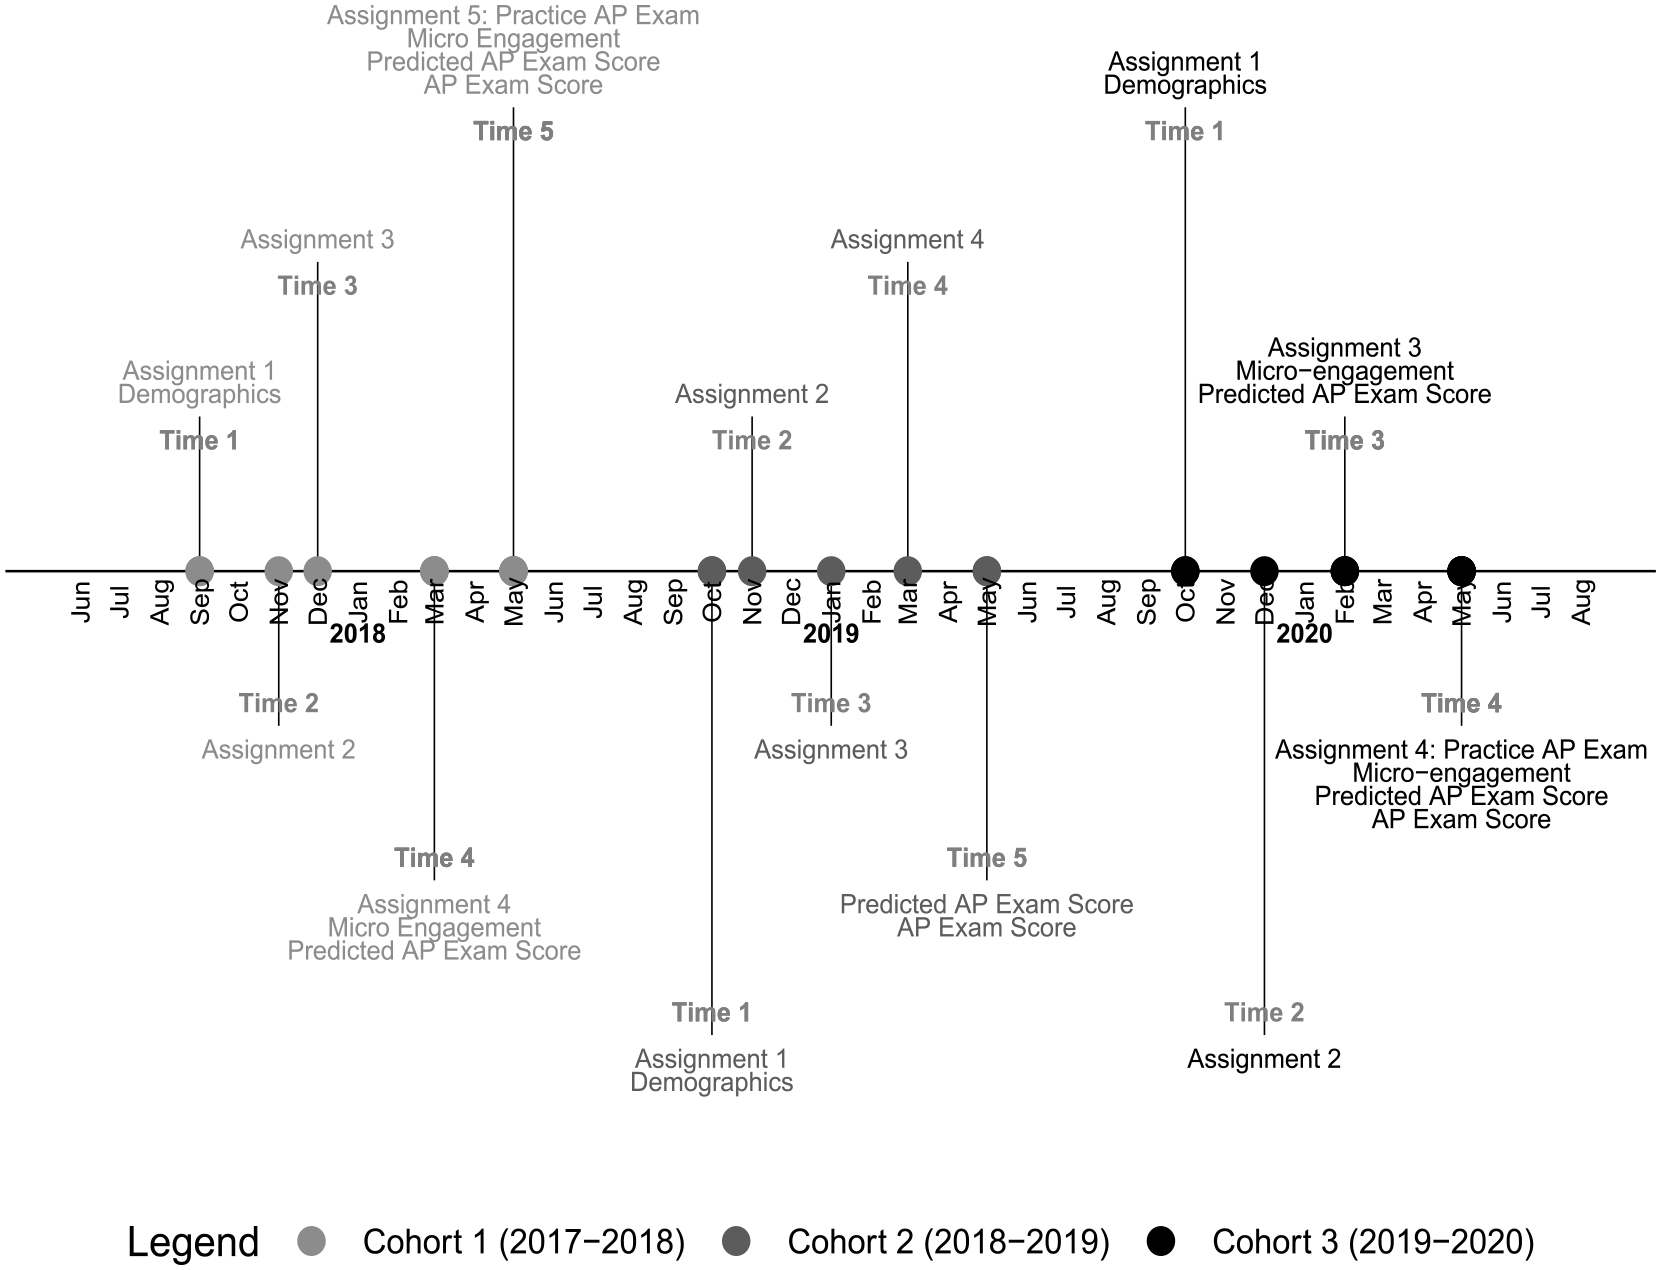
Timeline of the administration of each measure.
Descriptive Statistics for Predictors and Outcomes (N=681)

Note. AP = advanced placement.
Engagement (Cohorts 1 and 3)
Self-Reported Engagement (Cohorts 1 and 3)
Micro-engagement—that is, engagement within the context of the AP Statistics course—was measured based on students’ self-reporting using the Scale of Student Engagement in Statistics (Whitney et al., 2019). The Scale of Student Engagement in Statistics consists of 24 Likert-type items, with eight items each reflecting the affective, behavioral, and cognitive dimensions of engagement. Responses were provided by using a 5-point Likert-type scale indicating the extent to which participants agreed with the statement (1=Strongly Disagree, . . ., 5=Strongly Agree). The scale had acceptable reliability within each domain on the first occasion of measurement across all three cohorts (affective: McDonald’s ɷ=.92; behavioral: McDonald’s ɷ=.82; cognitive: McDonald’s ɷ=.79) and had acceptable test-retest reliability based on the correlation of scale scores over time based on data collected during a year not affected by the pandemic (cohort 1; affective: r=.83; behavioral: r=.80; cognitive: r=.59).
Online Behavioral Indicators of Engagement (Cohorts 1, 2, and 3)
As an indicator reflecting students’ actual behavioral engagement within the context of the course, we derived a variable of students’ use of one of the features of the online assessment platform. Results checks reflect the average number of times the user navigated to their score reports showing information about their performance on the assignments. Within the pages containing information about their scores on the assignments, students could view their mastery of certain attributes of statistics knowledge, assignment scores, scores on individual items within an assignment, as well as step-by-step answer solutions for items within an assignment. Two variables were derived: one reflecting the average number of times the student checked their results on the first two assignments (administered between September and December for all three cohorts) and the other reflecting the number of checks for the practice AP exam (administered in May for cohorts 1 and 3). Previously conducted analyses of the data had shown this number to be significantly associated with multiple assessment formats even after controlling for self-reported engagement (Ober, Hong, et al., 2021).
Self-Appraisal (Cohorts 1 and 3)
Information about students’ self-appraisals of their learning was derived from their AP exam scores and from the scores they self-reported anticipating receiving on the AP exam. Each of these variables is described in the paragraphs that follow.
Advanced Placement Exam Scores
The AP Statistics exam is administered nationally on one day in May each year in a given academic year to all students and is scored such that values range from 1 (lowest) to 5 (highest). Within the combined sample (cohorts 1, 2, and 3), scores ranged between 1 and 5 (Mean=3.63, SD=1.20, Median=4, Mode=5). Students enrolled in certain AP programs experienced changes to the exam content during the May 2020 (cohort 3) administration of the exam. Students taking an AP Statistics course were prepared for a standardized and nationally administered in-person AP exam, yet given constraints related to social distancing, an online exam was administered instead, consisting of new question styles and updated content, resulting in less comprehensive coverage with the removal of specific topics (e.g., chi-square test, regression inference; Chu, 2020). Therefore, AP exam scores in 2020 (cohort 3), although included in our analysis, should not be directly compared to scores in previous years.
Predicted Advanced Placement Exam Score
Along with completing an assignment, students were asked the following question to gauge how well they believed that they would perform on the AP exam: “Whether you plan to take it or not, what do you predict your score will be on the AP Statistics exam?” Students enrolled in the course in the 2017–2018 (cohort 1) and 2019–2020 (cohort 3) academic years were asked this question on two occasions: in early spring (late February or early March) and again in May. Students enrolled in the 2018–2019 (cohort 2) academic year were also asked this question, but only once, in May. The response options ranged between 1 and 5, reflecting the scoring outcomes of the actual AP exam. The polychoric correlation between the two predicted scores was .77 among students in cohort 1.
Accuracy and Bias Estimates
Two separate estimates were derived from all three cohorts to reflect aspects of students’ self-appraisals of their performance on the AP exam. Accuracy was defined as the absolute value of the distance of student’s predicted scores from their actual AP exam scores (M= 1.04, SD= 1.03). Bias was defined as the over- or underprediction and consisted of three levels: underconfident (negative estimate), no bias (0), and overconfident (positive estimate). In this case, the tendency toward underconfidence was specifically examined and found to be present among 46.1% of students in the sample combined across all three cohorts.
Learning Measures
Cumulative Assignment Scores (Cohorts 1, 2, and 3)
Between September and early December in each academic year, students completed at least two online sectional assignments on AP Statistics content. Students across each cohort were given the same or a comparable set of questions in each assignment, although not in the same order. Each assignment consisted of no more than 30 multiple-choice and blank-field items similar in format and aligned with the content of the AP Statistics test framework (CollegeBoard, 2010). Although all the assignments were graded for effort and completion, performance on the assignments was calculated based on the cumulative data available from students’ past work on the assignments up until that point. Students’ scores on each assignment were computed based on a Rasch model, a type of item response theory (IRT) model. Larger scores indicate better performance, and scores with greater absolute values are indicative of greater deviation from the expected population mean. Internal consistency was calculated across a total of 179 unique items (Mean number of items completed by each student=40.61, SD=13.88, Median=38) administered in assignments that were acceptable (McDonald’s ɷ=.97). Cumulative assignment scores were calculated from an aggregation of items administered across all assignments a student completed. This variable was not used as a learning outcome but rather to compare and control for baseline differences between cohorts.
Practice Advanced Placement Exam Scores (Cohorts 1 and 3)
Students enrolled in the 2017–2018 (cohort 1) and 2019–2020 (cohort 3) academic years completed one practice exam administered through the online assessment platform in May. The practice exam was a comprehensive assessment that was developed by the research team in consultation with content experts, mimicking the content coverage of the actual AP Statistics exam. Students completed the test for completion credit in their AP Statistics course and were allowed to complete it only once. Students’ IRT scores on the practice exam were computed in a similar fashion to the homework scores, were also based on a Rasch model, and ranged between −2.29 and 1.87 (Mean=.14, SD=.73), with higher scores indicative of better performance. The reliability across all abilities was acceptable (McDonald’s ɷ=.93), based on the same method used to calculate the reliability of the cumulative assignment score.
Procedure
This study was preregistered (Ober, 2021, February 17). Additional details can be found in the Online Supplemental Materials about the methods and results of data cleaning (Appendix A), attrition analysis (Appendix B), multiple imputation (Appendix C), and calculation of the propensity scores (Appendix D).
Analytic Plan
From preliminary analysis, we found evidence of missingness in several outcomes that differed between cohorts; across each cohort, missingness was associated with students’ assignment scores, and thus the assignment score was used for multiple imputations (see Online Supplemental Materials). We therefore attempted to account for differences in the composition of the cohorts through propensity score-adjusted regression. Figure 2 provides a flowchart of the analyses conducted and how they relate to the research questions and measures previously described. The analyses were conducted in several phases, all within the R statistical environment version 4.1.0 (R Core Team, 2021).

Schematic of analytic procedure.
As noted, considering that differences were found in the demographic composition of cohorts, we subsequently conducted propensity-score adjusted regression. First, we conducted analyses to determine whether engagement and self-appraisals differed across the three cohorts during the “pre-pandemic” period, between late February and early March (
For each outcome variable, analyses were also conducted to determine whether after controlling for students’ schools there were differences in the outcome variable based on gender (female=1) and URM status (URM=1) in the pandemic-affected cohort (cohort 3) using imputed data (
Results
We examined the impact of COVID-19 on students’ engagement, self-appraisal, and learning outcomes within the context of AP Statistics during the 2019–2020 academic year relative to previous cohorts. Furthermore, we were interested in determining whether students who are typically underserved in STEM (i.e., females, URM students) were more likely to have been negatively affected. Table 3 provides a summary of the main results of the analyses, with more details provided in the paragraphs that follow. Where data involved a comparison across multiple cohorts, the propensity score weighted data were used.
Summary of Main Findings

Note. AP = advanced placement.
Baseline Differences Between Cohorts
We first examined cohort differences in students’ engagement, self-appraisal, and assignment scores measured during a baseline “pre-pandemic” period before the transition to online and remote learning would have occurred for students enrolled in 2020 (
Results of Propensity Score Adjusted Regression Predicting Baseline and Change Scores for Engagement, Self-Efficacy, and Learning (

Note. Sample sizes reflect the analytic sample following imputation.
Engagement
Self-Reported
During the 2017–2018 (cohort 1) and 2019–2020 (cohort 3) academic years, a measure of micro-engagement was administered in the early spring semester (late February/early March). Results did not reveal a significant difference between cohorts in affective engagement (β=.01, SE=.09, p=.824). However, we did find a significant difference in behavioral (β= −.20, SE=.07, p<.001) and cognitive engagement (β= −.33, SE=.06, p<.001). For the dimensions of behavioral and cognitive engagement, students in cohort 3 (behavioral: Marginal M= 3.87, SE=.05; cognitive: Marginal M=3.58, SE=.05) reported on average higher levels of engagement than those in cohort 1 (behavioral: Marginal M=3.60, SE=.05; cognitive: Marginal M=3.16, SE=.04) early in the respective academic year.
Behavioral Indicator
As a baseline behavioral indicator of engagement, we derived the average number of times the student checked the results page on the first two assignments between September to December of the academic year in which they were enrolled. We used the number of times the student checked the results page on the final assignment as an end-of-year behavioral indicator of engagement. Unlike the previous analysis on the micro-engagement dimensions, which relied on data from the pandemic-affected cohort and only one prior cohort, in the analysis of the behavioral indicators of engagement, we were also able to include data from all three cohorts. The results did not suggest a significant difference between the pandemic-affected year (cohort 3) compared to the 2018–2019 year (cohort 2; β=.008, SE=.26, p=.882). However, students in the pandemic-affected year (Marginal M=3.05, SE=.26) appeared to check their scores more frequently than students in the 2017–2018 year (cohort 1; Marginal M=3.09, SE=.17) at the beginning of the academic year (β=−.11, SE=.26, p=.031).
Self-Appraisal
We next sought to determine whether there were any apparent differences in students’ self-appraisal of their AP exam scores. In the 2017–2018 and the 2019–2020 academic years, students were asked to estimate their score on the AP exam in the early spring semester (late February/early March). Students in the 2017–2018 year (cohort 1; Marginal M=3.81, SE=.06) had slightly higher predictions about their performance than students in the 2019–2020 year (cohort 3; Marginal M=3.60, SE=.08; β=.11, SE=.10, p<.05).
Assignment Scores
For a final baseline comparison, we wanted to determine whether students’ assignment scores significantly differed between the three cohorts. We found that students in the pandemic-affected year (Marginal M=−.18, SE=.04) tended to perform worse on the first two assignments than students in the prior cohorts (cohort 1: Marginal M=.12, SE=.04; β=.20, SE=.07, p<.001; cohort 2: Marginal M=.50, SE=.05; β=.42, SE=.07, p<.001).
Cohort Differences in Change From Baseline to End-of-Year
We next examined whether there were cohort differences in students’ change in engagement and self-appraisal of projected AP exam scores prior to (i.e., up until late February or early March) and following (i.e., after late April or early May) the transition to remote online teaching during the pandemic-affected 2019–2020 academic year (
Results of ANOVA Examining Subgroup Differences in Changes (Post-Baseline) in Engagement, Self-Efficacy, and Learning (Cohort 3 Only; N=215) (

Note. Sample sizes reflect the analytic sample following imputation of cohort 3 responses.
Engagement
Self-Reported
Separate analyses were conducted to determine whether change scores in each of the three dimensions of engagement differed between students enrolled in the 2017–2018 (cohort 1) and the pandemic-affected 2019–2020 (cohort 3) years. These analyses did not reveal a significant difference between the two cohorts in behavioral engagement (β=.05, SE=.05, p=.223). However, we did find significant cohort differences in the change from the beginning to the end of the spring semester in terms of affective (β=.36, SE=.07, p<.001) and cognitive (β=.09, SE=.06, p=.029) engagement. Although students in the pandemic-affected year (cohort 3) generally had improved affective engagement (Marginal Mchange=.49, SEchange=.06), students in a prior year (cohort 1) tended to have decreased affective engagement (Marginal Mchange=−.08, SEchange=.04). By contrast, students in the pandemic-affected year (Marginal Mchange=−.20, SEchange=.03) appeared to show a greater reduction in cognitive engagement than students in a prior year (Marginal Mchange=−.07, SEchange=.05).
We then examined differences in the change between demographic groups of students in the pandemic-affected year only (cohort 3), using the imputed data. ANOVA models were evaluated to determine whether gender (female=1), URM status (URM=1), or an interaction of the two variables explained any change in students’ engagement. We found that female students had a significantly greater negative change in affective (F(1,206)=7.82, p=.006, ηpartial2=.034; Mdiff=−.287, 95% CI=−.50 : −.07) and behavioral (F(1,206)=5.08, p=.025, ηpartial2=.021; Mdiff=−.142, 95% CI=−.27 : −.01) engagement. In terms of cognitive engagement, female students appeared to have a less negative change than male students (F(1,206)=4.86, p=.029, ηpartial2=.034; Mdiff=.136, 95% CI=.01 : .27). No other demographic variables explained significant change in students’ cognitive engagement or the other two dimensions of engagement.
Behavioral Indicator
We calculated a difference score based on the number of times students checked the results page for the final assignment minus the average number of checks of the results page for all other assignments that had been administered previously. We were interested in seeing whether students were more or less likely to make use of this feature in the assessment platform after transitioning to online and remote teaching due to the pandemic relative to previous semesters. The findings did not provide evidence of a significant difference between cohort 3 with respect to either cohort 1 (β=.07, SE=.31, p=.179) or cohort 2 (β=−.04, SE=.31, p=.456). Among students enrolled in the pandemic-affected year, none of the demographic variables appeared to moderate the change in students’ average checks of the results page (p > .05).
Self-Appraisal
Students in both the 2017–2018 (cohort 1) and 2019–2020 (cohort 3) years were asked to predict their score on the AP exam around early March and again in May prior to taking the AP exam. We were interested in determining whether there was a change in students’ predictions between the two cohorts. It was anticipated that students in cohort 3 may experience a greater reduction in their expectations of their scores on the AP exam. As anticipated, we found that students in the pandemic-affected year (Marginal Mchange=−.42, SEchange=.09) tended to have a more negative change in their estimates of AP exam scores than students in a prior year (Marginal Mchange=.16, SEchange=.10; β=.17, SE=.15, p<.001). None of the demographic variables appeared to moderate the change in students’ predicted AP exam scores among students in the pandemic-affected year (p>.05).
End-of-Year Differences
Self-Appraisal
Next, we wanted to determine whether students were more or less accurate or biased in predicting their scores on the AP exam in the pandemic-affected year (
Results of Propensity Score Adjusted Regression Predicting End-of-Year Outcomes (

Note. Sample sizes reflect the analytic sample following imputation. Given that accuracy was measured by the absolute distance of the prediction from the actual score, a negative coefficient reflects that the cohort was overall more accurate estimate in estimating their performance.
Results of ANOVA Examining Subgroup Differences in End-of-Year Self-Appraisals and Learning Outcomes (Cohort 3 Only; N=215) (

Note. Sample sizes reflect the analytic sample following imputation of cohort 3 responses.
Accuracy
The accuracy values reflected the distance between actual and predicted AP exam scores. Poisson regression was used, given that the distribution most closely reflected this distribution. Students in the pandemic-affected year (cohort 3) appeared to be less accurate than students in the 2018—2019 year (β=−.10, SE=.09, p=.032), although there appeared to be no significant difference between students in the pandemic-affected year and 2017–2018 (β=−.002, SE=.09, p=.961). However, overall, students in the pandemic-affected year (Marginal M=1.13, SE=.07) tended to have greater differences between their estimated and actual scores than students in both prior years (cohort 1: Marginal M=1.12, SE=.07; cohort 2: Marginal M=.90, SE=.08). Thus, despite efforts to reduce the scope of the exam content, students in the pandemic-affected cohort may have struggled in estimating their performance on the exam, given the novelty of the exam content and format. Using imputed data from students in the pandemic-affected year only, we wanted to determine whether, after controlling for the effect of school, the accuracy of students’ predictions varied based on gender, URM status, or the interaction of the two. There was no evidence that any of these background factors explained variation in the accuracy of students’ predictions (p>.05).
Bias
We next examined differences in students’ bias in terms of underconfidence (1=underconfident, 0=not underconfident). We were interested only in examining underconfidence, given that we anticipated that students in the pandemic-affected year would likely have a lower morale than students in the previous academic years, given the weighty context of the pandemic. Students in the pandemic-affected year did not appear to be significantly more underconfident than students in either prior cohort (cohort 1: B=−.21, SE=.19, p=.260; cohort 2: B=−.32, SE=.21, p=.133). The marginal means suggest that approximately 51.0% of students in the pandemic-affected year were underconfident in their self-appraisal relative to actual scores, compared to only 45.7% (cohort 1) and 43.0% (cohort 2). After controlling for the effect of school, we again did not find any evidence that the likelihood of being unconfident was associated with students’ gender, URM, or the interaction of the two in the pandemic-affected cohort only (p>.05).
Learning
We were subsequently interested in examining whether students’ IRT scores on the practice AP exam, an indication of learning, differed between students enrolled in the pandemic-affected year and the 2017–2018 year (cohort 1) (
Discussion
There presently remains a lack of understanding of the impact of the COVID-19 pandemic on student learning during the 2019–2020 academic year. There has been a great deal of speculation that the year marks a year of “learning loss” (Dorn et al., 2020; Pokhrel & Chhetri, 2021), yet systematically proving that is difficult because many annually administered standardized assessments were either substantially modified—in form, content, or both (as in the case of the AP Statistics exam)—or outright canceled. The present study used data collected in years preceding the pandemic-affected 2019–2020 year to compare differences in students’ engagement, their self-appraisals of learning via their predicted AP exam scores, and their IRT scores on a practice aligned with content on the AP Statistic test framework. Acknowledging that the pandemic affected subgroups of students differently, we further sought to understand whether female students and students from underrepresented racial/ethnic minority groups in STEM were more or less at risk.
Given the constraints around online instruction, the hastiness in the transition to remote learning, and the inability to communicate as freely with teachers and peers, research has found some evidence that these perceptions transpired as changes in student engagement during COVID-19 (Chiu, 2021; Ober, Brodsky, et al., 2021). Students were less likely to complete end-of-year assignments in cohort 3. With the concerns of the pandemic looming, daily stressors combined with a lack of accountability in completing schoolwork, students may have felt less pressure to complete assignments. We also found that students were less likely to participate in the AP exam, possibly for similar reasons of accountability or because they felt unprepared for the novel exam format or experienced untenable technical problems (Strauss, 2020).
Students may not have completed the assignments or the AP exam during the 2019–2020 year because they may not have felt as confident in their ability to perform well. Students in the 2019–2020 academic year reported a significantly more negative change in their cognitive engagement in the course between early March and May compared with students in a preceding year; however, they appeared to be significantly more affectively engaged (i.e., motivated to learn course material), at least based on self-reporting. Amid the stressful circumstances surrounding the pandemic, students enrolled in the course during the 2019–2020 academic year may have, indeed, felt that they were more motivated than previous cohorts, given that any effort dedicated to academics during this time may have felt like an extreme amount. However, greater perceived engagement may not necessarily always result in learning. Certain forms of affective engagement have been linked with a tendency toward academic burnout (Wang et al., 2015), which predicts lower academic achievement (Madigan & Curran, 2021). Alternatively, students may have perceived that they were more engaged, given that many teachers’ reported lower expectations of what constituted an acceptable level of engagement in an effort to accommodate the extenuating circumstances (Huck & Zhang, 2021; Ober, Carter, et al., 2022). Although we did not find a significant difference in change based on URM status among students enrolled in the 2019–2020 academic year, we did find that female students tended to report a greater decrease in affective and behavioral engagement, although male students had a greater decrease in cognitive engagement. These findings may underscore gender differences among adolescent students in perceived engagement and support in online learning settings (see Korlat et al., 2021; Lessard & Puhl, 2021; Tate & Warschauer, 2022).
We also found that students in the 2019–2020 academic year tended to have a more substantial decrease in their self-appraisal of their performance on the AP exam from mid- to late spring compared to a preceding year. Although a previous investigation found that students enrolled in AP Statistics were relatively accurate in predicting their performance (Ober, Hong, et al., 2022), students in the pandemic-affected year may have experienced a drop in their self-efficacy brought about by environmental stressors (Camfield et al., 2021) or because they simply lacked confidence in completing an AP exam in an online format with changed content, which would have been unfamiliar. As such, it may have been difficult for students to gauge the likelihood of performing well on the exam because existing materials that could be used as self-assessment tools differed so dramatically from the actual exam. There was, however, no evidence of significant differences between students based on gender or URM status with respect to changes in self-appraisal.
The decrease in students’ self-appraisal during the spring 2020 semester may have reflected legitimate concerns that affected their ability to learn. Emerging evidence suggests that students’ learning in core subject areas was, indeed, negatively affected by school closures and other pandemic-related circumstances (National Assessment of Educational Progress, 2022a, 2022b). With respect to learning, after controlling for scores based on assignments submitted in the “pre-pandemic” fall semester, we found evidence that students tended to receive lower IRT scores on the practice exam compared with students enrolled in a prior academic year. Although this result by itself is not definitive evidence of a “learning loss,” it does suggest that students during the pandemic-affected year tended not to achieve the same level of proficiency in their statistics knowledge as students in a preceding year. This finding comes even after attempting to adjust for baseline differences between cohorts to make them more comparable.
Implications
The findings here suggest several notable implications. First, students enrolled in the pandemic-affected 2019–2020 year performed significantly worse on the practice exam than students in the 2017–2018 year. These findings are consistent with trends for students enrolled in U.S. K–12 schools (Goldhaber et al., 2022; National Assessment of Educational Progress, 2022a, 2022b). Providing instructional opportunities to postsecondary students affected by the pandemic to reengage and relearn content they would have had the chance to master during the 2019–2020 academic year may be one way of addressing potential knowledge gaps.
Second, the findings point toward a conspicuous lack of differences in engagement in the expected direction relative to previous cohorts. This result may be taken as a sign that students may have been remarkably resilient even during what is likely the direst public health crisis they had ever experienced before and potentially in their lifetime. Even though there may be reason to be optimistic in this regard, further inquiry is clearly warranted, given the states for these students, especially given that our sample was limited to students enrolled in an AP course.
Third, although we expected to find gender and race/ethnicity subgroup differences among the pandemic-affected cohort of students, in the present study, we largely did not find any evidence of such effects. Given the associations between social and cultural factors and the quality of students’ educational experiences during the pandemic (Goudeau et al., 2021), we believed that it was important to investigate potential differences. In some dimensions of engagement, males and females in the pandemic-affected year appeared to experience change differently, although in terms of self-appraisal (in relative change and accuracy/bias) and practice exam scores, we did not observe a difference. Further work should nevertheless consider intersectional differences, particularly among a larger and more diverse sample of students.
Fourth, there remains a vexing methodological challenge in trying to estimate changes in learning among students who are more likely to have missing data. Even though the format of the practice exam remained largely the same between cohorts, our ability to draw comparisons in learning was mired by the drop in participation during the pandemic-affected year. In the present study, we therefore opted to impute missing data and use propensity score adjusted regression. Yet, as we describe in more detail in the next section, this solution was by no means unbiased (Cham & West, 2016).
Limitations
Despite the implications of the present findings, there are nevertheless several important limitations to acknowledge. The present study is limited to the sample from which the data were collected. Participants in the study were enrolled in an AP course and thus were unlikely to reflect the broader U.S. population of high school students. Students pursuing advanced coursework not only tend to be more academically motivated but also tend to reflect a demographic of students from families with higher income status (Judson et al., 2019). During the pandemic, students from financially secure households were less likely to have firsthand experience of the global health and economic repercussions of the pandemic (Van Lancker & Parolin, 2020). We also note that the proportion of students across all three cohorts who would meet the National Science Foundation’s definition of URM in STEM is still relatively small. This appears to be a problem with AP Statistics course/exam participation more widely (see Table 1) and thus is not exclusively an issue with the study sample. Whether the present findings would be reflected in a more diverse sample deserves further inquiry.
Another limitation of the present study is that data were likely collected from students who were, in general, more engaged in the course. As is the case with many studies attempting to understand the full scope of the “twin pandemics”—that of COVID-19 and of the social inequalities that surfaced in its wake—on student learning, there seems to be an ever-present challenge of handling missing data (Kuhfeld et al., 2020). Using complete data in such a context may produce results that do not adequately reflect students who are more at risk for underachievement due to a general lack of participation or for withdrawing from the course (Suzuki et al., 2022). That the percentage of students who completed the practice exam was significantly lower in the 2019–2020 academic year relative to the 2 preceding years speaks to the difficulty in estimating the effect of COVID-19 and school closures on student learning. We attempted to handle this issue by using multiple imputation after noting an missing at random (MAR) missing data mechanism, given that it is preferable to complete case analysis under such conditions, although not also bias-free (Hughes et al., 2019).
We attempted to balance the cohorts by using propensity score adjustments based on certain key baseline covariates. However, we note that there was considerable room for improving the balance between cohorts. In the present study, similarities between cohorts were likely affected because one school enrolled in the 2017–2018 year did not participate in the pandemic-affected 2019–2020 year, thus likely affecting the composition of the cohorts. We stratified based on the school factor, given that most schools (five of the seven) participated in all three academic years and thus we could use stratification to match students accordingly to mitigate bias due to school-level demographic and instructional confounders. However, this method of stratification did not guarantee that all students within the strata had the same or similar propensity scores and ensured that strata were not of equal size, which could have introduced bias (Adelson et al., 2017).
Conclusions
Understanding how engagement, self-efficacy, and learning differed in the pandemic-affected year has implications for the immediate and distant future of education. Consistent with emerging evidence (Goldhaber et al., 2022; National Assessment of Educational Progress, 2022a, 2022b), students in the pandemic-affected 2019–2020 academic year performed worse on an end-of-year assessment than students in previous years. Although we anticipated that student engagement would overall decrease significantly among students in the pandemic-affected school year, we did not find consistent evidence to support this. Instead, the findings may be an indication of the resilience of students. Students enrolled in the pandemic-affected academic year also tended to be significantly less accurate and slightly (although not significantly) more underconfident in their self-appraisal on the AP exam relative to their actual scores. These findings suggest how disorienting the pandemic-affected year was for many students, even students enrolled in AP courses who may tend to be more academically motivated.
Although the impact on students’ long-term opportunities for learning is yet to be more fully understood, this study charts progress toward an understanding of the impact of the COVID-19 pandemic and school closures on students’ learning. Despite the overwhelmingly negative effect of the pandemic, there may be reason to regard it as a disruption that could ultimately lead to the reimagining of current educational practices that reinforce inequalities and, thus, toward more equitable approaches to promote student learning (García-Morales et al., 2021; Iyengar, 2020). We hope that the present findings provide some understanding of the scope of the pandemic’s immediate influence on student engagement, self-appraisal, and learning.
Supplemental Material
sj-docx-1-ero-10.1177_23328584231177967 – Supplemental material for Disruptiveness of COVID-19: Differences in Course Engagement, Self-Appraisal, and Learning
Supplemental material, sj-docx-1-ero-10.1177_23328584231177967 for Disruptiveness of COVID-19: Differences in Course Engagement, Self-Appraisal, and Learning by Teresa M. Ober, Ying Cheng, Matthew F. Carter and Cheng Liu in AERA Open
Footnotes
Acknowledgements
We would like to thank the graduate and undergraduate research assistants in the Learning Analytics and Measurement in Behavioral Sciences (LAMBS) Lab at the University of Notre Dame for their contributions to the broader discussion of the topic, the high school statistics teachers and students who contributed to this project, and the ARTIST project (https://apps3.cehd.umn.edu/artist/index.html, PI: Garfield and del Mas) and the STATS4STEM project (https://www.stats4stem.org/, PI: Simoneau) for allowing us to use their items in our research A preprint of an earlier draft of this manuscript is available online (see Ober, Cheng, et al., 2021).
Funding
The author(s) disclosed receipt of the following financial support for the research, authorship, and/or publication of this article: This work was supported by a National Science Foundation CAREER (Grant #DRL-1350787) and an Institute for Education Sciences (Grant #R305A180269) awarded to Dr. Ying Cheng.
Authors
TERESA M. OBER, PH.D., is an associate research scientist at Educational Testing Service (ETS) and a research affiliate collaborating with members of Learning Analytics and Measurement in Behavioral Sciences (LAMBS) Lab at the University of Notre Dame. Dr. Ober’s work examines engagement and learning in technology-mediated environments and individual differences in applied educational contexts.
YING CHENG, PH.D., is a professor in the Department of Psychology, Fellow of the Institute for Educational Initiatives, associate director of the Lucy Family Institute for Data and Society, and director of the Learning Analytics and Measurement in Behavioral Sciences (LAMBS) lab at the University of Notre Dame. Dr. Cheng’s background and expertise are in educational and psychological measurement, with a focus on item response theory, computerized adaptive testing, and cognitive diagnostic assessment.
MATTHEW F. CARTER is a former lab manager for the Learning Analytics and Measurement in Behavioral Science (LAMBS) Lab at the University of Notre Dame. Mr. Carter is currently pursuing research in biostatistics and public health.
CHENG LIU, PH.D., is the lead data scientist for the Center for Social Science Research (CSSR) in the Lucy Family Institute for Data & Society and concurrent research assistant professor of psychology at the University of Notre Dame. Dr. Liu ‘s experience in quantitative research and the infrastructure development of online education platforms, his research interests include educational data mining and education technology.
References
Supplementary Material
Please find the following supplemental material available below.
For Open Access articles published under a Creative Commons License, all supplemental material carries the same license as the article it is associated with.
For non-Open Access articles published, all supplemental material carries a non-exclusive license, and permission requests for re-use of supplemental material or any part of supplemental material shall be sent directly to the copyright owner as specified in the copyright notice associated with the article.