
Abstract
Curriculum-based measurement of oral reading fluency (CBM-R) is used as an indicator of reading proficiency, and to measure at risk students’ response to reading interventions to help ensure effective instruction. The purpose of this study was to compare model-based words read correctly per minute (WCPM) scores (computerized oral reading evaluation [CORE]) with Traditional CBM-R WCPM scores to determine which provides more reliable growth estimates and demonstrates better predictive performance of reading comprehension and state reading test scores. Results indicated that in general, CORE had better (a) within-growth properties (smaller SDs of slope estimates and higher reliability), and (b) predictive performance (lower root mean square error, and higher R2, sensitivity, specificity, and area under the curve values). These results suggest increased measurement precision for the model-based CORE scores compared with Traditional CBM-R, providing preliminary evidence that CORE can be used for consequential assessment.
Keywords
CBM-R is considered to be more than just a measure of fluent decoding (Wayman et al., 2007) because it functions as a robust indicator of reading proficiency (e.g., Fuchs et al., 2001; Schilling et al., 2007; Tindal, 2013), as measured by reading comprehension and year-end state reading tests (e.g., Decker et al., 2014; Good et al., 2019; Jenkins et al., 2003; Nese et al., 2011; Roehrig et al., 2008; Shin & McMaster, 2019; Yeo, 2010). As such, research indicates that oral reading fluency should be regularly assessed in the classroom so an instructional response can be made when needed (Jimerson et al., 2015; National Research Council, 1998). CBM-R is widely used as part of a multitiered system of supports model to universally screen for students at risk of poor learning outcomes, to monitor student progress to help guide and inform instructional decision making (Fuchs et al., 2001; Speece et al., 2003), and to predict year-end performance on state reading tests (Kilgus et al., 2014; Shin & McMaster, 2019). For example, if a student scores below a locally defined cut point (e.g., the 20th percentile norm) on the CBM-R (and meets other locally defined indicators), they are candidates for grouped or intensive reading resources. For those receiving additional reading resources, their progress is monitored with regular CBM-R assessments to evaluate whether the intervention is meeting expectations. If student progress is satisfactory, the intervention may continue (or eventually discontinued); if student progress is below expectations, the intervention may be modified (e.g., increased in intensity).
Despite CBM-R’s prevalent use, practical application, and reported technical adequacy, researchers have suggested that some of the practical and psychometric properties of Traditional CBM-R could be improved. First, the opportunity for error in traditional CBM-R administration is exceedingly high and well-documented (Cummings et al., 2014; Munir-McHill et al., 2012; Reed et al., 2014; Reed & Sturges, 2013), including forgetting to start the timer, not stopping the student or circling the last word when the timer sounded, counting insertions as errors, miscounting the number of errors, and miscalculating the WCPM (Reed & Sturges, 2013). Second, the opportunity costs of traditional CBM-R administration, including lost instructional time (Hoffman et al., 2009) and school/district resources to train and implement a team of assessors can be considerable. Third, traditional CBM-R WCPM scores vary substantially across passages (Francis et al., 2008). And fourth, those scores demonstrate a large standard error (SE) of measurement (Christ & Silberglitt, 2007; Poncy et al., 2005). These last two are perhaps the most important, as both call to question the appropriateness of using traditional CBM-R scores as indicators of student risk and as a mechanism to evaluate student growth as they receive targeted instruction (Shapiro, 2012).
Computerized oral reading evaluation (CORE) is a project to develop a computerized CBM-R assessment system that uses an automated scoring algorithm based on automatic speech recognition (ASR) and a latent variable psychometric model to produce model-based CBM-R scores. CORE was developed to improve some of the practical and psychometric properties of Traditional CBM-R. To ameliorate administration errors, CORE applied a computerized procedure, which includes ASR, that can minimize or eliminate the potential for administration errors by standardizing the delivery, setting, and scoring; for example, timing the reading for exactly 60 seconds, correctly calculating the number of words read correctly (wrc), and recording the correct WCPM score in the database. Research provided evidence that ASR could be applied in schools with high accuracy of word scores and improved timings (Nese & Kamata, 2020b). To address the opportunity costs of Traditional CBM-R, CORE uses a computerized procedure that allows for small groups (or an entire classroom) to be assessed simultaneously in only a few minutes so that a single educator can monitor the integrity of the testing environment for a group of students, potentially reducing the cost of administration by eliminating the need to train staff to administer and score the assessment, the need for an assessor for every student, and the instructional time lost to testing.
Most important, to address passage inequivalence and to improve score reliability and precision, CORE developed and validated shorter passages (Nese & Kamata, 2020b), which were equated, horizontally scaled and vertically linked with an alternative scale metric based on a latent-variable psychometric model of speed and accuracy (Kara et al., 2020). These contributions resulted in substantially smaller standard error of measurement for the model-based CORE scores compared with Traditional CBM-R scores, especially for students at risk of poor reading outcomes, providing CBM-R scores that are sensitive to instructional change (Nese & Kamata, 2020a).
The purpose of this study was to compare the model-based CORE WCPM scores with Traditional CBM-R WCPM scores (both scored by ASR) to explore which measure (a) provides more reliable growth estimates, important for consequential inferences about a student’s response to intervention, and (b) demonstrates better predictive performance of reading comprehension and state reading test scores, important for identifying students at risk of poor reading proficiency.
CBM-R Growth
When students are identified as being at risk for poor reading outcomes, CBM-R data are collected systematically to measure a student’s response to reading interventions to help ensure instruction is effective, and so changes can be made if it is not (Deno, 1985; Stecker et al., 2008). Progress monitoring data needs to yield growth estimates that are sufficiently reliable for educators to make consequential inferences about a student’s response to intervention. Educators evaluate progress-monitoring data with CBM-R WCPM graphed over time, and often compare a trend line (an estimated line of best fit) of student performance, to an established goal line (the target WCPM for that student over time). If the slope of the trend line is less than that of the goal line, an instructional change is considered. Thus, the precision of the trend line and the associated variability in the data affect the consequential validity of the data-based decisions, with higher variability negatively affecting decisions (Nelson et al., 2017; Van Norman & Christ, 2016); for example, a student not responding to intervention but not receiving a needed instructional change. Thus, the precision of both CBM-R scores and CBM-R growth estimates are crucial for educators to make meaningful instructional decisions.
CBM-R Predictive Performance
Universal CBM-R screenings, grounded in prevention and early-identification, are brief assessments administered to all students (typically in the fall, winter, and spring) to identify students with or at-risk for overall reading difficulties, and students at risk for not meeting grade-level performance standards (Kilgus et al., 2014; Wayman et al., 2007). Year-end state readings test scores, often used in accountability systems, serve educators, parents, policy makers, and researchers as an indicator of reading proficiency for both students and schools (Nese et al., 2011; Reschly et al., 2009; Shin & McMaster, 2019; Wayman et al., 2007; Yeo, 2010). Developing practical measures that are highly predictive of state reading test performance helps stakeholders identify at-risk students and engage them in preventive intervention programs. Researchers have explored the adequacy of CBM-R for screening by examining how well it predicts some criterion measure as an indicator of risk for poor reading outcomes, including reading comprehension and year-end state tests (Kilgus et al., 2014; Shin & McMaster, 2019; Yeo, 2010), often reporting diagnostic accuracy evidence; for example, how well CBM-R scores differentiate between students who meet year-end state reading standards and those who do not. Diagnostic accuracy evidence supports the use of CBM-R as a screener to provide educators with scores applied educational decisions; that is, for data-based instructional decisions that can provide positive (and limit negative) consequences for students (Kane, 2013).
Research Questions
The purpose of this study was to compare the consequential validity properties of CORE and a Traditional CBM-R assessment for students in Grades 2 through 4. A longitudinal design with four repeated measurement occasions is employed to model the within-year student growth of each measure. The distal (predictive) and proximal (concurrent) predictive performance of CORE and Traditional CBM-R are examined for (a) comprehension scores for students in Grades 2 to 4, and (b) year-end state reading test scores for students in Grades 3 and 4. The research questions are as follows.
Method
This study was conducted in the 2017–2018 and 2018–2019 school years in Oregon and Washington, with institutional review board approval. The 2017–2018 study was replicated in 2018–2019 to increase the student sample size, with no differences in the study’s design. The study consisted of a longitudinal design with four repeated measurement occasions (waves) to address the research questions.
Participants
The original sample included 2,519 students from four school districts, seven elementary schools (four schools participated in both years, and three schools only in 2018–2019), and 21 classrooms. All students in Grades 2 through 4 at the seven participating schools were invited to participate such that the sample would be representative, to the extent possible, of typically developing students across reading proficiency levels.
The analytic sample varied according to the research question and outcome variable. Table 1 shows the sample demographic characteristics for each research question. We removed extreme WCPM scores that suggested they were an artifact of the audio data collection process and not a part of the data generating process. We removed WCPM scores that were based on less than 30 seconds of audio because (a) traditional CBM-R scores are intended to be 60 seconds, and (b) CORE scores are intended to be based on reading 10 to 12 passages and it is implausible to do that in 30 seconds. We also removed Traditional WCPM CBM-R scores that were based on less than 10 words read, as such scores would be at or below the first percentile for most of the participating students according to the easyCBM percentile tables. We acknowledge that other researchers may have made different theoretical data decisions, and that these decisions can affect results. As a result of these decisions, the analytic sample for the longitudinal analysis of WCPM (RQ 1) included 2,108 students (84% of the original sample) who had at least one (valid) wave of data for each of the Traditional CBM-R and CORE measures. Approximately 6% of students were missing demographic data but 27% of students were missing English language learners (EL) data because one state did not provide EL data for 2017–2018.
Sample Characteristics by Research Question

Note. Data are presented as n (%).
Of the 2,108 students in the longitudinal analysis, only 987 (47%) had fall and spring scores on the traditional CBM-R and CORE assessments, which limited the sample size for RQ 2 and RQ 3. The analytic sample for RQ 2 were the 427 students (43%) that had a score on the spring comprehension assessment. Note that one school district (District 2, Schools B and E) did not administer the spring comprehension assessment, which limited the sample. The analytic sample for RQ 3 were the 722 students (73%) that had a score on the Smarter Balanced Assessment Consortium (SBAC) English language arts/literacy (ELA/L) test. Note that Grade 2 students do not take the year-end state test.
According to 2018–2019 NCES school data, the populations of the seven schools ranged from 357 to 759 students, approximately half of whom were students in Grades 2 through 4. Four school locales were classified as Suburb: Midsize, and three as Town: Distant (for more information, see https://nces.ed.gov/ccd/commonfiles/glossary.asp). Six schools received Title I funding, and the percentage of students receiving free or reduced lunch ranged from 49% to 86%. The ethnic/race majority for all schools was White (56% to 76%), followed by Hispanic (16% to 34%), Multiracial (3% to 9%), American Indian/Native Alaskan (0% to 5%), Asian (0% to 1%), Black (0% to 1%), and Native Hawaiian/Other Pacific Islander (0% to 1%).
Measures
Table 2 shows the descriptive WCPM data and Figure 1 shows the WCPM means at each wave for the CBM-R measures (CORE and Traditional). Appendix Table A1 shows the correlations between the CBM-R measures and the continuous outcome measures (spring reading comprehension and SBAC ELA/L). All measures are described in the following text.
Mean (SD) WCPM for CBM-R Measures, and Assessment Dates, by Grade and Wave

Note. Time is the span, in months, between waves, and represents the latent slope factor loadings. WCPM = words read correctly per minute; CBM-R = curriculum-based measurement of oral reading fluency; CORE = computerized oral reading evaluation.

Mean words correct per minute (WCPM) scores across waves by grade and curriculum-based measurement of oral reading fluency (CBM-R) measure.
CORE CBM-R
Each CORE passage is an original work of narrative fiction that follows the story grammar of English language short stories, with a main character and a clear beginning, middle, and end (http://bit.ly/core_2E8iZDF). To reduce construct-irrelevant variance associated with different authors’ voice and style, the author of the CORE passages was part of the team that authored the easyCBM traditional CBM-R passages used in this study. Apart from the passage length requirements, the CORE passages were written to similar specifications as the easyCBM passages. Each CORE passage was written within five words of a targeted length: long, 85 words; or medium, 50 words. Ultimately, 150 passages were written: 50 at each of Grades 2 to 4, with 20 long passages and 30 medium passages for each grade. Previous research has shown that scores for the CORE passages were generally comparable to the scores for traditional CBM-R passages (Nese & Kamata, 2020b).
Administration instructions were to allow students to read the CORE passages in their entirety, but a time limit was set at 90 seconds to prevent low skilled readers from taking an excessive amount of time to complete the assessment task. At each wave, sample students read on average 8.40 passages (SD = 1.80; range = 1–12). The CORE passages ready by each student at each wave were combined into one CBM-R model-based oral reading fluency score.
The CORE passages are equated, horizontally scaled and vertically linked, and the CORE scores are model-based estimates of WCPM, based on a recently proposed latent-variable psychometric model of speed and accuracy for CBM-R data (Kara et al., 2020). The model-based CBM-R WCPM estimates are based on a two-part model that includes components for reading accuracy and reading speed. The accuracy component is a binomial-count factor model, where accuracy is measured by the number of correctly read words in the passage. The speed component is a log-normal factor model, where speed is measured by passage reading time. Parameters in the accuracy and speed models are jointly modeled and estimated. For a detailed description, see Kara et al. (2020).
Traditional CBM-R
We administered the easyCBM (Alonzo et al., 2006) oral reading fluency measures as the traditional CBM-R assessments for the purpose of comparison to CORE passages. Following standard administration protocols, students were given 60 seconds to read the traditional CBM-R passages.
easyCBM CBM-R passages range from 200 to 300 words in length and are original works of fiction developed to be of equivalent difficulty for each grade level following word-count, grade-level guidelines (e.g., Flesch-Kincaid readability estimates), and form equivalence empirical testing using repeated measures ANOVA to evaluate comparability of forms (Alonzo & Tindal, 2007). The easyCBM CBM-R measures have demonstrated features of technical adequacy that suggest they are sufficient to meet the needs as the comparative example of an existing traditional CBM-R assessment (Anderson et al., 2014). The reported alternate form reliability across passages ranged from .83 to .98, test–retest reliability ranged from .84 to .96, and G-coefficients ranged from .94 to .98 (Anderson et al., 2014). Predictive (fall, winter) and concurrent (spring) relations between Grade 2 CBM-R and spring SAT-10 reading scale scores were .59 to .62, and .66, respectively (Anderson et al., 2014). Predictive (fall) and concurrent (spring) correlations between Grade 3 and Grade 4 CBM-R and year-end state reading scores were .63 to .69 (Tindal et al., 2009).
ASR Scoring
The ASR engine scored each audio recording file (both CORE and Traditional CBM-R), scoring each word as read correctly or incorrectly, and recording the time in centiseconds to read each word and the time between words. See appendix (Table A2) for an example of a passage scored by the ASR. Bavieca, an open-source speech recognition toolkit, was the ASR applied in this study (http://www.bavieca.org/). Bavieca uses continuous density hidden Markov models and supports maximum likelihood linear regression, vocal tract length normalization, and discriminative training (maximum mutual information). It uses the general approach of many state-of-the art speech recognition systems: a Viterbi Beam Search used to find the optimal mapping of the speech input onto a sequence of words. The score for a word sequence was calculated by interpolating language model scores and acoustic model scores. The language model assigned probabilities to sequences of words using trigrams (where the probability of the next word is conditioned on the two previous words) and was trained using the CMU-Cambridge LM Toolkit (Clarkson & Rosenfeld, 1997). Acoustic models were clustered triphones based on hidden Markov models using Gaussian mixtures to estimate the probabilities of the acoustic observation vectors. The system used filler models to match the types of disfluencies found in applications.
Reading Comprehension
Participating school districts used easyCBM as part of their multitiered system of supports academic assessment system. The easyCBM reading comprehension measure assesses students’ comprehension of a 1,500 word fictional narrative. The comprehension items are designed to target students’ literal, inferential, and evaluative comprehension. Split-half reliability ranged from .38 to .87, item reliability from Rasch analyses ranged from .39 to .94, and Cronbach’s alpha ranged from .69 to .78 (Sáez et al., 2010). Predictive (fall) and concurrent (spring) correlations between Grade 2 comprehension and spring SAT-10 reading scale scores were .62 and .66, respectively (Jamgochian et al., 2010). Predictive (fall) and concurrent (spring) correlations between Grade 3 and 4 comprehension and spring state reading test scores (Oregon Assessment of Knowledge and Skills [OAKS] and Washington Measures of Student Progress [MSP]) were .52 to .70, and .37 to .68, respectively (Anderson et al., 2014). Predictive diagnostic statistics for fall comprehension and spring state reading test scores included sensitivity from .68 to .86, specificity from .57 to .92, and AUC from .74 to .86. Concurrent diagnostic statistics for spring comprehension and spring state reading test scores included sensitivity from .69 to .89, specificity from .63 to .80, and AUC ranged from .76 to .87 (Anderson et al., 2014).
The Grade 2 comprehension measure contained 12 multiple-choice items (M = 10.40, SD = 1.70), whereas the Grade 3 (M = 14.10, SD = 4.10) and Grade 4 (M = 13.50, SD = 3.80) measures contained 20 multiple-choice items. Figure 2 shows scatter plots of the CBM-R WCPM and comprehension scores by grade and season (distal and proximal).

Words correct per minute (WCPM) and comprehension scores by grade and season, distal (fall) and proximal (spring).
SBAC Reading Test
The SBAC ELA/L summative assessment is administered to students in Grades 3 through 8 and 11 and consists of two parts: a computerized adaptive test (CAT), and a performance task (PT) component. The SBAC ELA/L was developed to align to the Common Core State Standards (CCSS) and measures four broad claims: reading, writing, listening, and research (SBAC, 2020). Within each claim there are a number of assessment targets, and each test item is aligned to a specific claim and target and to a CCSS. The CAT consisted of selected response items that assess all four claims. The PT consisted of a set of related stimuli presented with two or three research items requiring both short-text responses and a full written response that assess the writing and research claims. The overall SBAC ELA/L performance scaled score is divided into four proficiency categories (Well Below, Below, Proficient, and Advanced), where the first two categories represent students who do not meet state grade-level reading achievement standards, and the last two categories represent students who do meet those standards.
The mean SBAC ELA/L score for Grade 3 was 2,447 (SD = 74.8) with 61% meeting proficiency. The mean SBAC ELA/L score for Grade 4 was 2,480 (SD = 79.7) with 57% meeting proficiency. Figure 3 shows scatter and density plots of the CBM-R WCPM and SBAC ELA/L score and proficiency, respectively, by grade and season (distal and proximal).
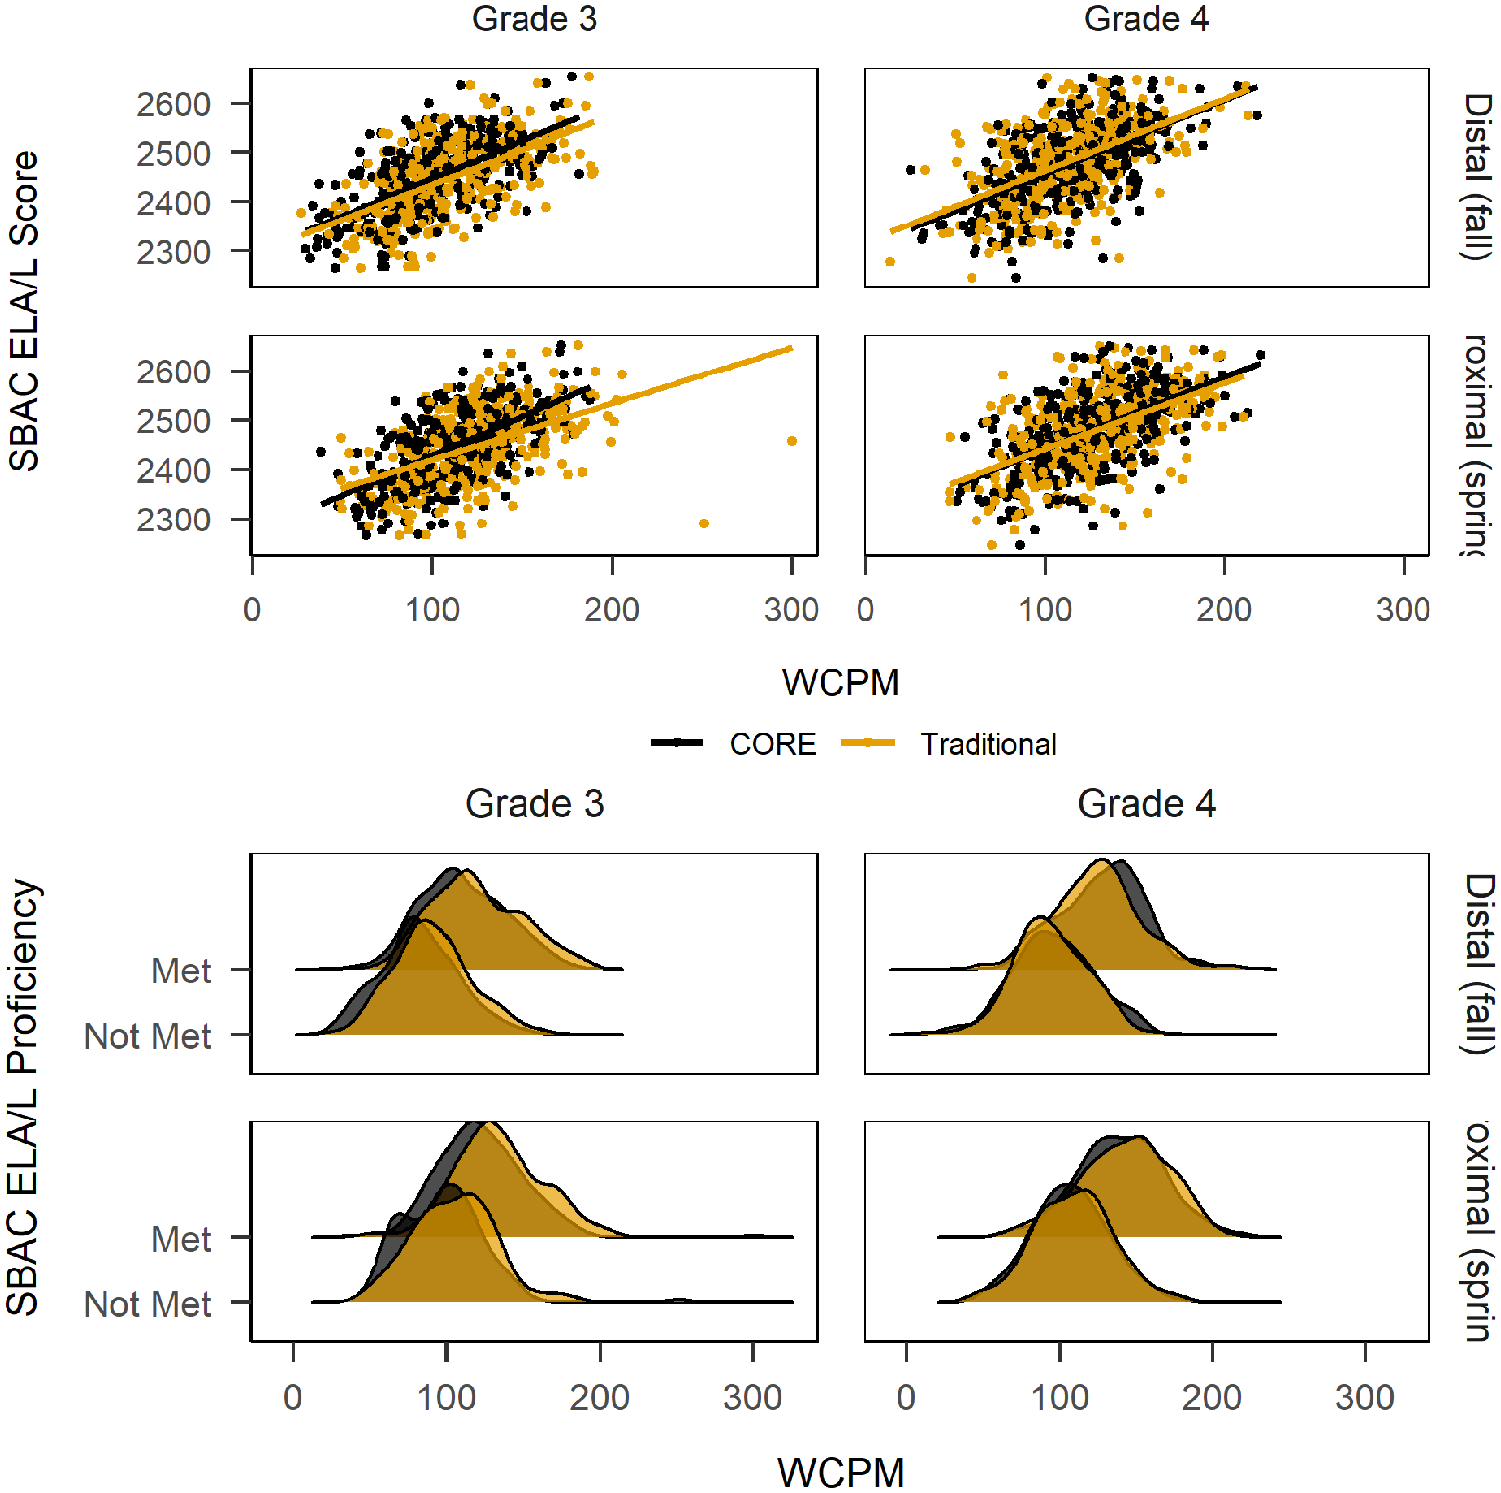
Words correct per minute (WCPM) and Smarter Balanced Assessment Consortium English language arts/literacy (SBAC ELA/L) score and proficiency classification by grade and season, distal (fall) and proximal (spring).
Procedure
Students were assessed online, using classroom or school devices, and wore headphones with an attached noise-canceling microphone provided by the research team. Students were introduced to the task by their teacher, and then directed to the study website where the first page asked for student assent; if a student declined, their participation ended. Teachers were given no study-specific training. They were introduced to the purpose of the study and given instructions on how their students could access the study website. The standardized instructions were presented to students via audio as well as print. Get ready! You are about to do some reading! After pressing start, read the story on the screen. When you are finished click done. Do your best reading, and have fun!
For each of the four measurement occasions (Oct–Nov 2017, 2018; Nov–Feb 2017–2018, 2018–2019; Feb–Mar 2018, 2019; May–Jun, 2018, 2019), students read aloud online a randomly assigned, fixed set of 10 to 12 CORE passages (3–5 long and 5–7 medium, randomly sampled), and one Traditional CBM-R passage from the easyCBM progress monitoring system. The CORE passages were combined into one CBM-R model-based oral reading fluency score. The ASR engine scored each reading, scoring each word as read correctly or incorrectly (accuracy), and recording the time duration to read each word and the silence between which was aggregated to calculate the time to read the passage (speed).
All WCPM scores were based on these readings and data. The model-based WCPM CORE scores (Kara et al., 2020) were estimated for each measurement occasion based on the CORE passages. Traditional CBM-R WCPM scores were calculated by dividing the number of wrc by the quotient of the total seconds read (s) and 60; that is,
Analyses
All analyses and figures were conducted and created in the R programming environment (R Core Team, 2020) with the following R packages: effectsize (Ben-Shachar et al., 2020), doParallel (Microsoft Corporation & Weston, 2020), ggridges (Wilke, 2021), ggthemes (Arnold, 2021), janitor (Firke, 2021), (Rosseel, 2012) lavaan, papaja (Aust & Barth, 2020), patchwork (Pedersen, 2020), tidymodels (Kuhn & Wickham, 2020), tidyverse (Wickham et al., 2019).
Growth
To address RQ 1, we apply a latent growth model (LGM; Meredith & Tisak, 1990) separately for each grade to represent students’ within-year oral reading fluency growth. The slope factor loadings were specified as the elapsed number of months between the median month of Wave 1 (
One, the SE of individual slope estimates, based on the latent intercept and slope factor scores as estimated by the LGM. The SE of the slope estimate quantifies the variability, or precision, of the slope estimate that has been often used in CBM-R research (e.g., Ardoin & Christ, 2009) to evaluate the accuracy of growth estimates. The SE of slope for each student (

where the numerator is the residual variance and the denominator is the square root of the sum, over the
Two, the reliability of the CBM-R scores at each wave, as estimated by the proportion of true score variance to observed score variance (Rogosa & Willett, 1983; Singer & Willett, 2003; Willett, 1988):

where
The LGM analyses were conducted using the lavaan package (Rosseel, 2012) with maximum likelihood estimation with robust Huber–White SEs and a scaled test statistic that is asymptotically equal to the Yuan–Bentler test statistic. This estimator is robust to nonnormality and clustering (McNeish et al., 2017).
Predictive Performance
To address RQ 2 and RQ 3, we apply a predictive approach to determine which CBM-R predictor most accurately estimates the outcomes, rather than an inferential approach that pursues unbiased estimates of
For RQ 2, we fit 12 linear models: two CBM-R predictors each at two seasons (fall and spring) for each of three grades:
For RQ 3, we model Grades 3 and 4 together and thus included grade level as a categorical covariate, as well as the state (OR or WA) to account for differences in state standards. We fit eight linear models, applying a logistic regression for the categorical SBAC ELA/L proficiency outcome:

To measure the predictive performance of the models, root mean square error of approximation (RMSEA) and
To understand the predictive performance of the CBM-R measures, and how that might generalize to new data, the data for each RQ were split into two sets: a training set, a random sample of 75% of the data; and a testing set, the remaining 25% of the data.
To get a measure of variance for the performance measures, 10-fold cross-validation was applied to the training set (Kuhn & Johnson, 2013). For each fold, 10% of the training set is sampled and serves as an assessment sample, so that each observation serves in one and only one assessment sample. The remaining 90% of the training set serve as the analysis sample for a fold. The predictive model is fit on the 90% analysis sample of each fold, and the resulting model parameters are used to predict the assessment sample within each fold. The mean and SD of the performance measures (RMSEA,
Research has shown that 10 folds is a sensible value for k-fold cross-validation, and repeating k-fold cross-validation can improve the performance of the estimates while maintaining small bias, particularly for smaller sample sizes (Kim, 2009; Molinaro et al., 2005). Thus, 10-fold cross-validation repeated five times was applied for each RQ training set so that 50 models were fit and 50 values of each performance measure were recorded (10 folds × 5 repeats = 50 models).
Finally, the predictive models were fit to the entire training set, and then the resulting model parameters were used to predict the test set. The test set here can be conceptualized as “new” (or unseen) data, as it has not been used in the model parameter estimation. The resulting final performance measures serve as estimates of how the two comparison CBM-R measures might generalize in their predictive performance. The predictive modeling process was conducted using the tidymodels package (Kuhn & Wickham, 2020).
Results
Figure 1 shows the difference between CORE and Traditional CBM-R in mean WCPM scores across grades and waves. The CORE trajectories were smoother than Traditional CBM-R, visually demonstrating more reliability in scores. In addition, the mean CORE scores were consistently and meaningfully lower than the mean Traditional CBM-R scores.
Research Question 1
To address RQ 1, we fit LGMs separately for each CBM-R measure and grade. The fit measures for the Grade 2 CORE LGM were
The Grade 4 LGM for Traditional CBM-R was not successfully estimated without a negative variance for the slope factor. We tried alternate modeling solutions, including homogeneous residual variances (and zero error covariances), heterogeneous Toeplitz residual structure, first-order autocorrelated residuals (McNeish & Harring, 2019), and transformed slope factor loadings, but all models were unsuccessful due to a negative variance or variance-covariance matrix. Thus, we do not report the results from this model. The parameter estimates from the LGMs can be found in the appendix (Table A3).
Table 3 shows the mean (SD) of the SE of the individual slope estimates (
Mean (SD) of the Standard Error of the Slope (SEb) Estimate by Measure and Grade

Note. d = Cohen’s d (Cohen, 1988). CBM-R = curriculum-based measurement of oral reading fluency.
Table 4 shows the observed variances of the CBM-R measures at each wave, the estimated residual variances from the LGMs, and reliability estimates by grade and wave. Across grades and waves, the reliability estimates were higher for the model-based CORE scores except for Grade 2, Wave 4 (.85 vs. .86). The reliability estimates for the model-based CORE scores ranged from .82 to .93, and for the Traditional CBM-R ranged from .62 to .86. Using Cohen’s h as a measure of distance between two proportions (i.e., true score variance explained), the differences in the reliability estimates can be interpreted similarly to effect sizes, where the Grade 2 Wave 4 difference favoring Traditional CBM-R is near zero, and the remaining differences favoring CORE range from h = .11 to .52, which can be classified as small to medium in magnitude (Cohen, 1988).
Observed Variances, Estimated Residual Variances, and Reliability Estimates by Grade and Wave

Note. h = Cohen’s h (Cohen, 1988).
Research Question 2
For RQ 2, we compared the predictive performance of CORE and Traditional CBM-R for distal (fall) and proximal (spring) assessments predicting spring comprehension scores for students in Grades 2 through 4. Table 5 shows the mean root mean square error (RMSE) and
Spring Comprehension Predictive Measures (RMSE and R2) For Distal and Proximal CBM-R Predictors by Grade

Note. Estimates from linear models, regressing spring comprehension on the distal or proximal CORE or Traditional CBM-R predictor for each grade;
For the cross-validation, the distal (fall) and proximal (spring) CBM-R predictor results generally favored CORE, which had better (lower) mean RMSE values compared with Traditional CBM-R, and better (higher) mean
The final RMSE and
Research Question 3
For RQ 3, we compared the predictive performance of CORE and Traditional CBM-R for distal (fall) and proximal (spring) assessments predicting spring SBAC ELA/L (scores and proficiency classification) for students in Grades 3 and 4. Table 6 shows the mean RMSE,
Predictive Performance Measures by Distal and Proximal CBM-R Predictors and Outcome (SBAC ELA/L Score and Proficiency)

Note. Estimates from linear models, regressing spring SBAC ELA/L score (multiple regression) or proficiency (logistic regression) on grade level (Grade 3 or 4) and state (OR or WA);
For the SBAC ELA/L score (continuous) outcome, both the distal and proximal results favored CORE which had lower mean and final RMSE and higher mean and final
The results of SBAC ELA/L proficiency (classification) outcome also favored CORE. For the cross-validation, the distal predictors, CORE had lower mean sensitivity (
Discussion
CBM-R, administered in classrooms across the country, is used as an indicator of reading proficiency, and to measure at risk students’ response to reading interventions to help ensure instruction is effective. As such, CBM-R scores need to be predictive of reading comprehension and year-end state test scores/proficiency, and sufficiently reliable so educators to make inferences about students’ response to intervention. The present study compared traditional CBM-R WCPM scores with model-based WCPM scores to examine their consequential validity properties for students in Grades 2 through 4, including reliability and predictive performance, to evaluate CORE’s utility as a CBM-R assessment for both progress monitoring and screening.
The CORE trajectories were not only less variant than those of the Traditional CBM-R, the mean CORE scores were consistently and meaningfully lower than the mean Traditional CBM-R scores (Figure 1). Thus, if the CORE and easyCBM passages were equivalent (which is untested here), and if the model-based CORE scores are interpreted as more reliable and precise (as the results suggest), then Traditional CBM-R WCPM scores tend to overestimate (on average) student oral reading fluency.
Within-Year Growth Properties
In response to the first research question, the results of the LGMs showed, in general, better within-growth properties for the model-based CORE scores. The SDs of the
The results of the LGMs also showed that the model-based CORE scores had higher reliability, as measured at each measurement occasion. The reliability estimates for the model-based CORE scores ranged from .82 to .93, and for the Traditional CBM-R ranged from .62 to .86. Excluding Grade 2 wave 4 where reliability favored Traditional CBM-R by .01 (
Based on the results of the LGMs (
In addition, the correlation between the latent intercept and slope factors for the CORE models were negative and moderate in magnitude, but were positive and small to moderate in magnitude for the traditional CBM-R models. These results may reflect of a ceiling effect, but that is not supported by the data; rather, these results suggest the model-based CORE scores are more sensitive to growth for students at risk of poor reading outcomes (i.e., lower fall WCPM scores), a finding that is supported by previous research that found increased precision (i.e., smaller conditional standard error of measurement) for CBM-R scores at/below the 25th percentile (Nese & Kamata, 2020a). This finding should be further examined by future research.
Of critical importance to the inferences drawn from this study and for applied researchers, particularly those working for state or local education agencies and their data, is that we could not successfully estimate the Grade 4 Traditional CBM-R model, despite trying several different LGM specifications. The reason for this is unclear. It could be due to data missingness, but this is unlikely given that (a) the missingness was similar to those data of the other models, and (b) a model with no missing data was not estimated without negative variance (latent slope or residual). We speculate that the Grade 4 Traditional CBM-R model was not successfully estimated because of the large increase in scores at Wave 3 (Figure 1), which may be an artifact of large measurement error.
Predictive Performance
The results of the predictive modeling of the reading comprehension and SBAC ELA/L scores and proficiency showed that the model-based CORE scores had lower final RMSE and higher final
These comparative improvements in predictive performance ranged in magnitude. The final RMSE values represented fairly modest gains of about 1% to 11% of a SD for comprehension, and about 2% of a SD for SBAC scores. If these improvements were interpreted on a scale of effect sizes for education interventions, they would be considered small to medium in magnitude (Kraft, 2020). But in a predictive framework, any increase in predictive performance can be interpreted as a benefit, especially for the comprehension measures which had score ranges of 0 to 12 (Grade 2) or 0 to 20 (Grades 3 and 4). In addition, compared with Traditional CBM-R, the CORE final
Similarly for the SBAC ELA/L proficiency (classification) outcome, the results favored CORE with standardized differences of
It is desirable to have a test that has high sensitivity and specificity, but the two are generally inversely related such that as one increases, the other decreases. Both the CORE and Traditional CBM-R measures adequately predicted students that met year-end grade-level achievement standards (specificity), with low rates of false positives (i.e., incorrectly predicting students would not meet proficiency standards). This helps prevent overidentifying students at risk of poor reading outcomes, which helps school better allocate limited resources for reading intervention. But neither the CORE or the Traditional CBM-R measure adequately predicted students that did not meet year-end grade-level achievement standards (sensitivity), with higher than desirable rates of false negatives (i.e., correctly predicting students would not meet proficiency standards). The implications of lower sensitivity is that some students at risk of not meeting year-end proficiency standards are not identified, meaning that if the CBM-R measure was the only indicator of risk, these students would not receive the reading supports they need.
Limitations
There are several limitations in the present study that should be noted and considered when interpreting results. The consequential validity properties reported in response to the research questions generally reflect aspects of the samples and models applied, which may have implications for the interpretation and inferences of the results and the use of the CBM-R measures in specific contexts (Messick, 1995).
For the samples used here, the small sample sizes affect parameter estimation and potentially limit generalizations of the reported results. For example, the sample size used to answer RQ2 was small for each grade, but particularly for Grade 2 (Table 1). Also, although the cross-validation models were repeated five times to help improve performance for the smaller sample sizes (Kim, 2009; Molinaro et al., 2005), their results are likely to be susceptible to data-dependent variance. For the predictive models applied, the linear models are associated with high statistical bias (the difference between model predictions and the true values) and low variance (variability of a model prediction for a data point given new data); that is, linear regression is less prone to overfitting to the data, which may perhaps offer some protection against the small sample sizes. But future research needs to replicate this study with new data to explore reproducibility. Also, the reliability estimates of RQ 1 are dependent on the specification of the LGM, and misspecification can affect estimates of parameters, but this would likely result in an underestimation of reliability and likely not affect the relative gains of CORE compared with the Traditional CBM-R measure (Yeo et al., 2012). Other modeling choices may also have affected the results, including: not accounting for clustered data (although a robust estimator was used); not modeling individually varying measurement occasions (although this would affect both outcome measures similarly as students took both assessments on the same day).
The LGMs were fit to four waves of data that were intended to represent entire classrooms, making the measure more similar to (triannual) screening assessments, and less similar to progress monitoring data. Future research should extend this study and include a planned study with students receiving additional reading supports and their corresponding CBM-R progress monitoring data to examine the growth and reliability properties of model-based CORE scores. Also, because some schools participated across both years of the study, some students were likely to have been resampled in a subsequent grade which may have increased the homogeneity in the results.
In addition, the CBM-R measures correlations with the continuous outcomes (Table A1) were generally lower than reported average empirical correlations of CBM-R and reading comprehension on state achievement tests (
Conclusion
A simple interpretation of the results presented here is that the model-based CORE scores had a stronger relation with year-end reading comprehension and SBAC ELA/L scores, which has implications for educators using oral reading fluency measures for educational decisions. Good reading fluency has a theoretical and empirical relation with good reading comprehension, the latter of which is the ultimate goal of reading instruction. Descriptive analysis showed that the model-based CORE scores had higher correlations with both continuous outcomes across grades, except Grade 4, proximal (equal correlation) and Grade 2, distal (Table A1). The model-based CORE scores, with a stronger relation with reading comprehension, can potentially better help with early identification of students at risk of poor reading outcomes and potentially better help monitor the reading fluency progress of those at-risk students because the scores provide a better estimate of students’ current and prospective reading proficiency.
This study is an important part of a larger effort to improve traditional CBM-R assessment and the systems used by educators to make data-based decisions. CORE reshapes oral reading fluency and traditional CBM-R assessment by allowing group administration, more than one minute of reading, multiple passages, machine scoring, and WCPM scale scores. The benefits include reduced human administration cost and errors (Nese & Kamata, 2020b), and reduced standard error of measurement (Nese & Kamata, 2020a). The results of this study suggest increased measurement precision for the model-based CORE scores compared to traditional CBM-R, providing preliminary evidence that CORE can be used for consequential assessment. This is important for practitioners, as these measures are used to screen for students at risk of poor reading outcomes, and to monitor the progress of those students receiving reading intervention. CORE could provide more accurate data to predict which students may not meet state reading standards so that intervention could be delivered, and more precise data to evaluate the effectiveness of intervention and base educational decisions, such as determining whether the intervention is effective or needs to be modified to better meet the student’s needs.
Footnotes
Appendix
Latent Growth Model Parameter Estimates by Grade

| Parameter names | CORE | Traditional CBM-R | ||||
|---|---|---|---|---|---|---|
| Parameter | SE | z value | Parameter | SE | z value | |
| Grade 2 | ||||||
| Mean intercept | 63.75 | 1.39 | 45.86 | 74.79 | 1.31 | 56.89 |
| Mean slope | 3.59 | 0.13 | 27.40 | 4.30 | 0.21 | 20.55 |
| Variance intercept | 1070.46 | 56.82 | 18.84 | 694.73 | 54.94 | 12.65 |
| Variance slope | 3.04 | 1.03 | 2.95 | 5.25 | 2.06 | 2.55 |
| Correlation intercept slope | −0.35 | — | — | 0.05 | — | — |
| Residual variance Wave 1 | 108.15 | 21.60 | 5.01 | 174.89 | 39.26 | 4.46 |
| Residual variance Wave 2 | 123.28 | 30.80 | 4.00 | 170.13 | 21.54 | 7.90 |
| Residual variance Wave 3 | 188.05 | 33.71 | 5.58 | 383.15 | 108.25 | 3.54 |
| Residual variance Wave 4 | 166.29 | 43.15 | 3.85 | 164.71 | 56.55 | 2.91 |
| Grade 3 | ||||||
| Mean intercept | 86.86 | 1.27 | 68.56 | 98.34 | 1.25 | 78.41 |
| Mean slope | 2.00 | 0.11 | 17.69 | 2.33 | 0.15 | 15.06 |
| Variance intercept | 1154.59 | 61.11 | 18.89 | 861.74 | 72.83 | 11.83 |
| Variance slope | 2.96 | 1.20 | 2.46 | 0.87 | 2.57 | 0.34 |
| Correlation intercept slope | −0.51 | — | — | 0.25 | — | — |
| Residual variance Wave 1 | 86.29 | 17.68 | 4.88 | 211.07 | 57.28 | 3.68 |
| Residual variance Wave 2 | 170.98 | 22.35 | 7.65 | 345.25 | 88.15 | 3.92 |
| Residual variance Wave 3 | 175.85 | 25.57 | 6.88 | 325.07 | 42.81 | 7.59 |
| Residual variance Wave 4 | 173.13 | 35.41 | 4.89 | 245.04 | 75.52 | 3.24 |
| Grade 4 | ||||||
| Mean intercept | 109.71 | 1.30 | 84.62 | — | — | — |
| Mean slope | 1.67 | 0.11 | 15.06 | — | — | — |
| Variance intercept | 1125.18 | 63.04 | 17.85 | — | — | — |
| Variance slope | 0.74 | 1.15 | 0.64 | — | — | — |
| Correlation intercept-slope | −0.44 | — | — | — | — | — |
| Residual variance Wave 1 | 103.88 | 20.96 | 4.96 | — | — | — |
| Residual variance Wave 2 | 167.61 | 33.84 | 4.95 | — | — | — |
| Residual variance Wave 3 | 149.52 | 21.61 | 6.92 | — | — | — |
| Residual variance Wave 4 | 207.36 | 46.01 | 4.51 | — | — | — |
Note. CORE = computerized oral reading evaluation; CBM-R = curriculum-based measurement of oral reading fluency.
Acknowledgements
The research reported here was supported by the Institute of Education Sciences, U.S. Department of Education, through Grant R305A140203 to the University of Oregon. The opinions expressed are those of the authors and do not represent views of the institute or the U.S. Department of Education.
Author
JOSEPH F. T. NESE is a research associate professor at the University of Oregon. His research interests include educational assessment and applied measurement, focusing on developing and improving systems that support data-based decision making, and using advanced statistical methods to measure and monitor student growth.