
Abstract
Although much of the national opt-out movement is parent driven, the Colorado opt-out movement involved considerable efforts from high school students. This study explores the geography of the Colorado opt-out movement among secondary students, drawing upon social movements theory. We utilize the Colorado Measures of Academic Success (CMAS) as a measure of opt-out behavior in Colorado between 2016–2019. We also examine school-level demographic data. We first applied ordinary least squares regression and then utilize multiscale geographically weighted regression (MGWR) to examine the relationships between school-level demographics and opting out behavior for 11th-grade standardized assessments in Colorado. This analysis demonstrates the importance of geography in enacting social networks surrounding the opt-out movement in the state of Colorado. This study offers insight into opting out in the unique context of youth activism in Colorado, with a specific focus on geographical analysis.
Keywords
Each spring in Colorado, students in grades 3, 8, and 11 participate in the Colorado Measures of Academic Success (CMAS) standardized tests in literacy, mathematics, social studies, and science (Colorado Department of Education, 2021). Although “required,” many students opt out of the tests by not attending their school that day. Opting-out behavior has grown considerably in recent years and is now a movement in education (Burris, 2016; Pizmony-Levy & Green Saraisky, 2016, 2021).
One prominent reason for opting out in Colorado is that not all students or their parents or guardians believe in the importance or relevance of CMAS testing (e.g., Abraham et al., 2018; Amrein-Beardsley et al., 2010; Mason, 2018; McKeon & Gitomer, 2019; McLoud, 2019; Paladino, 2020; Paquin Morel, 2019). As reported through media sources, some of these parents or guardians have taken their actions a step further and have begun collectively organizing in support of the opt-out movement (Erdahl, 2014). One such group, United Opt Out, was founded in 2010 to protest high-stakes testing tied to school accountability and student achievement (Erdahl, 2014). In the state of Colorado, much of opting out is driven by students themselves walking out and protesting the taking of standardized tests on the exact dates of the tests; thus, we see higher levels of opting out behavior among higher grades, as highlighted in Colorado newspaper articles (Engdahl, 2015; Gorski, 2015a, 2015b; Mullen, 2022).
This study analyzes opting out behavior in Colorado, a state with a long history of education movements and resistance. Colorado has one of the most prominent opt-out movements in the country (Bennett, 2016; Mullen, 2022; Pizmony-Levy, 2018; Ujifusa, 2015a, 2015b). Focusing on individual states can be important to understanding opt-out movements because there is not one clear pattern with test participation rate; levels of opting out vary across states, within states, and across grade levels—implying there is not one driving force behind opting out behavior. 1
Much of the opting-out movement in Colorado was driven by youth, and their nonparticipation was a form of activism (e.g., Engdahl, 2015; Gorski, 2015a; Mullen, 2022). This student nonparticipation in secondary school testing is situated within a much longer arc of youth protest and activism. The period of the 1960s and 1970s is unique because, for the first time, youth across the United States engaged in unprecedented social activism and movement building, organizing independently and alongside community members to form political and social organizations to peacefully protest racism and educational inequality they faced in schools and society (Alaniz & Cornish, 2008; García, 2015; García & Castro, 2011; Montejano, 2010; Muñoz, 2007). Many of these organizations held weekend retreats and youth conferences to foster students’ political and ethnic consciousness and prepare them for direct action (Garcia, 2015; Muñoz, 2007). Between 1969 and 1971, walkouts were organized and received national media attention. Walkouts are resistance; students peacefully walk out of classrooms and onto public sidewalks and streets to protest injustice. Walkouts disrupted school and district-level policies and emerged as a form of resistance and youth empowerment for students. The combination of conferences and walkouts played a major role in the formation of collective solidarity among students, radicalized a generation of youth, and cultivated student power to take action against the social injustices they experienced in school (Alaniz & Cornish, 2008; Garcia, 2015; Garcia & Castro, 2011; Montejano, 2010; Muñoz, 2007; Vigil, 1999).
Though we cannot specifically examine youth activism within the context of the quantitative analysis presented within this study, it is critical to remember that youth activism within education is another factor within the opt-out movement and is not a new notion within the Colorado education landscape. This paper focuses on opting out at the secondary level, much of which was driven by the students themselves (Taylor-Heine, 2021; Wilson, 2018).
Generally, higher opting-out levels are observed across the United States in high-performing, wealthy suburban school districts (Chingos, 2015). The same is true for Colorado, with higher opting out within suburban schools (Clayton et al., 2019). However, Colorado also has some unique geographical trends, with higher levels of opting out in rural districts (Clayton et al., 2019; Gorski, 2015b). Specifically, the highest level of opting out in Colorado from spring 2015 was observed in Dolores County School District, in southwestern Colorado, where there is a deep distrust of the government; nearly all students did not participate in the standardized tests during spring 2015 (Gorski, 2015b). This very high opting-out behavior in Dolores County could be due to district communication; specifically, the district did not pressure parents to have students participate in the test. Instead, teachers stayed in classrooms to teach those kids who did not participate in standardized tests (Garcia, 2015).
To understand the roles of high school students in this phenomenon, we examine 11th-grade science test CMAS participation across four testing cycles (spring 2016, 2017, 2018, and 2019). We address the following research questions:
To what extent are school demographics and geographical location predictors of opt-out/non-test-taking behaviors on the 11th-grade CMAS exam?
To what extent does geographically weighted regression better account for opt-out/non-test-taking behaviors on the 11th-grade CMAS exam?
Literature Review
Opting Out in the No Child Left Behind Era
From the public spectacle of opting out in 2015 and 2016, observers would have noticed two features: substantial variation between states in the level of nonparticipation and discussion of factors within states that were associated with greater or lower participation in state testing. In the years of greatest public and media attention on opting out, the impression of many observers was that opting out was a phenomenon of the middle class, of disproportionately white suburbs—and to some extent, there is evidence at a state or national level to support that impression (e.g., Chingos, 2015; Harris & Fessenden, 2015; Pizmony-Levy & Cosman, 2017; Supovitz et al., 2016). New York state was at the center of public reporting on opting out on multiple levels: political organizing of an emerging movement to oppose test participation, the level of substantial nonparticipation in tests in many schools and districts, the variation within the state, the apparent relationship between the level of nonparticipation and race and social class at the local level, and the subsequent focus of several researchers on the New York state opt-out movement. Several central questions have been asked not just of New York but more broadly: what has shaped the network dynamics of opt-out movements, debates over the role of standardized testing that emerged from these movements, and local dynamics within individual states and regions? We describe the emerging literature in this section, ending with the research conducted thus far in Colorado.
Opt-out movement
Some research has focused on the social organization of the opt-out movement. Green Saraisky and Pizmony-Levy (2020) find a heterogeneous set of organizational networks. Using social network analysis from a national survey, they found a range of related and sponsoring groups, from national unions or union-related factions to state-level organizations and separate advocacy organizations concerned with standardized testing in general. Chapman et al. (2020) argued that there was an important difference between the exchange of ideas about testing and the local organizing that was a foundation for significant nonparticipation. To them, ideas could transfer much longer distances than organizing acumen and local political knowledge, and one should expect local dynamics to be a significant factor in patterns of opting out. In New York State, Chen et al. (2021) saw a significant role in local dynamics and the greater facility for organizing by groups such as Long Island Opt-out. Wang (2017, 2021) analyzed the New York state dynamics as an evolving constellation of coalition fragments and found that members of the state’s de facto opt-out coalition were more tightly connected than state and local authorities and that the opt-out coalition addressed key rhetorical and philosophical issues around the uses of standardized testing. Wilson et al. (2021) concluded that opt-out coalitions were fragile and vulnerable to fragmentation, as happened in the organizational history of United Opt-out National.
Opt-out movement rhetoric
Within the opt-out movement dynamics, many researchers have focused on either internal or public arguments (Abraham et al., 2018; Casalaspi, 2021; Chen et al., 2021; Currin et al., 2019, 2021; McKeon & Gitomer, 2019; McLoud, 2019; Paladino, 2020; Paquin Morel, 2019, 2021; Pizmony-Levy & Green Saraisky, 2021; Rivera-McCutchen, 2021; Schroeder et al., 2018, 2020a, 2020b, 2021; Taylor-Heine & Wilson, 2020). Abraham et al. (2018) identify a counternarrative about testing in the New Jersey opt-out movement, one that McKeon and Gitomer (2019) see as exploiting social media networking potential. Currin et al. (2021) and Schroeder et al. (2020b) identify Florida opt-out activists as proceeding from a moral perspective evolved from systemic powerlessness, what one of Schroeder et al.’s informants calls “moral madness.” Schroeder et al. (2018, 2020a) also see gendered dynamics in this network, a feminist ethic of care, as part of the state’s opt-out activist discourse. The discourse around and within the movement is morally freighted. These moral arguments around opting out are tied to the interaction between individual decisions and public interests, including potential consequences for racial justice and the authority of parents, as well as educational politics more generally.
Some researchers have explored racialized dynamics in this discourse. Currin et al. (2019) argue that, in Florida, the opt-out movement had challenges addressing issues of race and standardized testing. Taylor-Heine and Wilson (2020) explore the extent to which a small group of national opt-out activists use racialized identities. Rivera-McCutchen (2021) concludes that white privilege was embedded within the New York state opt-out movement coalition. Wilson et al. (2021) see the potential for racial politics to challenge and fragment activist coalitions.
McLoud (2019) sees various reasons behind New York State parents’ boycott of testing. One part of the debate focuses on the framing through which parents understand and make decisions about testing. Paquin Morel’s (2019) three-part study identifies several shifts in the discourse of New York opt-out activists. Part of the activist network narrowed their concerns from general education issues to focus on promoting boycotts of state standardized tests. In that process, activists using social media shifted the framing of the local opt-out discourse from arguments that testing was a tool to undermine public education to focus on the harms to individual children and demonstrable problems with tests such as poor design. Paladino (2020) sees an important role in New York’s local district communications with parents; parents were more likely to opt their children out when local districts provided concrete information about how to boycott tests. It is important to note that Paladino’s qualitative study has a relatively large sample of interviews (more than 60 interviews across three districts). There is a likelihood of reverse causality—that is, that districts providing more information were doing so in communities with a much more active opt-out network and thus more likely to experience greater test boycotting.
Pizmony-Levy and Green Saraisky's (2021) conclusions about the national opt-out network differ from Paquin Morel’s (2019, 2021), seeing broad framing of testing as a part of systemic educational behavior and tying into activists’ broader concerns about schooling writ large. This difference with Paquin Morel (2019, 2021) may reflect different sources—Paquin Morel focuses on New York state, which had a more intense and highly networked opt-out movement, and Pizmony-Levy and Green Saraisky draw from a national survey.
Opting out in Colorado
In Colorado, high school opt-out rates were reported as being significantly driven by older or senior high school students (Engdahl, 2015). Although many parents or guardians officially opted their students out of these tests (i.e., roughly one in 10), thousands more students in Colorado purposefully missed the tests without stating their reasons (Gorski, 2015a). These students were preparing for college and their futures, so they may not have identified relevance or value in the state standardized tests (Gorski, 2015a; Whaley, 2016). Opting out in the first few years of the movement appeared to be different in Colorado from other states such as New York; although nonparticipation was associated with larger white populations in schools, it also appeared largest among charter schools, as well as both suburban and rural schools (Clayton et al., 2019). Gorski (2015b) suggests that the greater proportion of students who opted out from rural school districts may be due to deep distrust of the government.
Opting Out on the Continuum of Participation in Schools
Scholarship on opting out began to develop before the COVID-19 pandemic, and there was considerable uncertainty about whether opting out would blossom into a mass social movement. Thus, a number of the issues consider broader implications if opting out spread—if multiple states had large proportions of students not taking state assessments. Yet it is also important to consider the meaning of opting out regardless of the magnitude. At a philosophical level, Moses and Wilson (2020) use the opt-out movement to discuss the morals of participation or withdrawal from education in various circumstances. One can place the opt-out movement in a broader context: test nonparticipation is one form of withdrawal from complete engagement and endorsement of institutional preferences, and thus part of a continuum of relationships with schools as institutions. Historically, opting out of test participation is a temporary withdrawal from formal schooling, though the political rhetoric may be more freighted. The opt-out movement vis-à-vis state tests in Colorado in 2015 and 2016 was not the only nonparticipation in tests during the modern accountability era.
The specific context of test nonparticipation is not the only framework, and for alternatives, one should look to the entire repertoire of school engagement available to students and families. In the 1960s, one would use the phrase school boycott to refer not to testing but to one-day or longer walkouts as part of the civil rights movement (e.g., Barrera, 2004; Bernal, 1998; Danns, 2002, 2003; Mabee, 1968; Petrzela, 2015). Withdrawing students from schools either temporarily or in the long term is a means to coerce local education authorities in a broader political struggle. But nonparticipation in public schooling can also ameliorate private families or wider collective conflict with public schools. The actions of white families to create and enroll their children in segregation academies was a quasi-private response to desegregation efforts in the civil rights movement, with significant roots in the existing white power structure in the South (e.g., Fuquay, 2002; Lazerson, 1977; Ravitch, 2000; Taeuber & James, 1982; Walder & Cleveland, 1971). In the past several decades, homeschooling has been another example of full withdrawal from schooling, with various motivations (e.g., Isenberg, 2007; Kunzman & Gaither, 2013). Thus, nonparticipation in state academic testing is a form of dissent from complete institutional participation.
Conceptual Framework
A small but important part of the emerging literature focuses on the relationship between the opt-out debate and broader polity questions—what does the opt-out debate tell us about the relationship between education and public interests? A 2020 special issue of Educational Theory tackles the question of dissent and scaled participation in public education directly. Moses and Wilson (2020) use the opt-out movement as a provocation to ask who opts out, why, and what happens as a result. Shuffel ton (2020) and Stitzlein (2020) point to the potential for parents to act deliberatively publicly in withdrawing their children from testing, but the public nature of such an act is not guaranteed. Wilson’s introductory essay sees three dimensions to the debate: the “shifting and contextual nature of activism,” the fact that “activism takes place on uneven political terrain,” and the deeper question of “what is the democratic potential of activism, dissent, and refusal” (Wilson, 2020, p. 253). Schroeder et al. (2020a, 2020b) have seen gendered rhetoric in the opt-out movement in Florida.
Wilson et al. (2016) see democratic engagement within the opt-out movement as a public response to state authority and expertise, with public in the sense of both visibility and originating in the body of citizens. Wilson et al. (2016) draw a comparison with Dewey's arguments about expertise and the public and root the politics of knowledge within citizenship rather than state authority. It is important to note the cautions about potentially public acts, as Shuffelton (2020) and Stitzlein (2020) do, but even public actions may have limits. Wheeler-Bell (2020) argues that both opt-out activists and opponents in the civil rights movement were fighting in a tightly circumscribed discourse that presumed the political hegemony of inequality—that is, both parents arguing for opting out and civil rights organizations concerned with the consequences for test-based accountability were fighting under the assumption that society is and inevitably will remain unequal. Szolowicz's (2021) observation of opt-out politics in Arizona embodies Wheeler-Bell’s point. In Arizona, arguments for a state bill to allow opting out of tests were couched predominantly in the language of private goods. Ultimately, these expressions of opting out of standardized tests can be considered a broad social movement of people refusing to participate in standardized tests.
We situate this study of the opt-out movement in Colorado within the broad corpus of social movements research. To guide this study, we use Snow et al.’s (2004) definition of social movements, which are “collectivities acting with some degree of organization and continuity outside of institutional or organizational channels to challenge or defend extant authority, whether it is institutionally or culturally based, in the group, organization, society, culture, or world order of which they are a part” (p. 11). Social movement theory examines collective or joint action/behavior with change-oriented goals and is characterized as having some temporal continuity (Snow et al., 2004). This broad conceptualization of social movement theory presented by Snow et al. (2004) allows for more general conceptions of social movements; for instance, movements do not need to be only connected to polity or government but can also include other institutions or phenomena. Within social movement theory, protesting is a common collective action whereby people voice their grievances with a particular action, system, or practice. Within this study, we use a social movement framework to understand opting out of standardized tests in Colorado as a form of protest.
In a social movement framework, it is understood that powerless agents, such as high school students, target centers of power, including the state, corporations, and social institutions, to provoke change (Armstrong & Bernstein, 2008). The opt-out movement is a mass rejection of standardized tests through a social movement. It is an example of an alliance between students—or between students, their families, and educators—as they protest the taking of federally mandated standardized tests (Pizmony-Levy & Green Saraisky, 2021). In the case of Colorado, students have participated in creating a social movement. In this social movement, they are choosing to challenge the educational practices of their communities by organizing and participating in walkouts and other forms of protest (Schimke & Zubrzycki, 2015; Taylor-Heine, 2021; Wilson, 2018). This social movement is operating with student activists organizing themselves within social networks in-person at the school, school district, or community level and spreading virtually throughout Colorado using social media outlets (Schimke & Zubrzycki, 2015).
Much of the social movements research does not emphasize the importance of space within the phenomenon. Specifically, Miller (2000) asserts that if geography is considered, it is often to separate “social” from “spatial” variables or to look at large-scale, national-level differences in movements. Space is often viewed as a constraint on social movements rather than an important part of the process that can facilitate social movements (Miller, 2000). In Snow et al.’s (2004) edited collection on social movements, none of the chapters focus on the role of geography within social movements. There is mention of spatial aspects of movements, such as protests occurring in the streets. In resource mobilization, it is understood that some geographical locations might have better access to resources (Edwards & McCarthy, 2004). Further, there is a discussion that movements might be more apt to happen in certain geographic locations, such as cities or metropolitan areas (Edwards & McCarthy, 2004). However, the research and literature do not fully consider the role of geography and space within many analyses centered on social movement theory (Miller, 2000; Nicholls, 2009).
The ways we can theorize about location and geography in social movement theory spaces include territorial and relational approaches (Nicholls, 2009). Agnew (2002) asserts that social relations and institutions are produced through distinct territorial units. Within these distinct geographical locations, Agnew (1987) describes locations as places where political processes play out, locales as sites where social and organizational relations develop in reaction to larger-scale processes, and a sense of place as a spatial form whereby people approximate themselves in the broader world. Within these spaces, the sociological characteristics of actors (e.g., socioeconomic status, race, gender, political affiliation) shape their social relations and networks. On the other hand, other geographers question the territorial understanding of place and opt for a more relational approach (e.g., Amin, 2004; Marston et al., 2005). First, people within a common geographical location can possess very different sociological attributes and ideas. Amin and Thrift (2002) argue that people serve as actors with different statuses and ideas within geographical spaces. Within these spaces, actors come together to navigate various social processes (i.e., standardized tests) in multiple institutions (i.e., schools). Within this relational approach, institutions function as locations or sites where diverse actors form relationships and negotiate power across multiple situations.
Building on these conceptions of territorial and relational geographies, Nicholls (2009) asserts a new theoretical framework for thinking about the role of geographies within social movements. Networks of people play a critical role in social movement theory (Diani & Bison, 2004; Tarrow & McAdam, 2005). Specifically, people form networks within particular places. Public meetings and social gatherings can serve as a means for people to connect and spread social ideas (Nicholls, 2009). Further, people are tasked with mobilizing resources across these geographic spaces. At the same time, people can also grow movements across great distances, particularly with online technology. Nicholls (2009) asserts that proximity and great distances can both produce strong social movements. Ultimately, Nicholls (2009) argues that we must consider the role of geography within social movements research.
Similar to these trends within social movements theory, much of the current research on opting out of standardized tests considers geography from the standpoint of major trends by state or location (i.e., suburban moms). As such, and following the calls to expand our understanding of social movements theory, this study aims to incorporate spatial relationships within the social movement of opting out of standardized tests in Colorado.
Methods
In this study, to explore the connection between social movements and school-by-school experiences, we examined school-level 11th-grade science standardized test participation on the Colorado Measures of Academic Success (CMAS) test as a measure of opt-out behavior in Colorado between 2016—2019. We used multiple data sources and analytical approaches to understand better opt-out behavior in Colorado and the factors related to opting out. All data and analyses occurred at the school level.
Since the opting out movement is centered on standardized testing, we first identified administered standardized tests in the state of Colorado. The Colorado Measures of Academic Success (CMAS) is the state summative assessment to measure student performance in K–12 schools (Colorado Department of Education, 2021). The CMAS comprises mathematics, English language arts, Spanish language arts, and science. These tests are administered in grades 3–8 and grade 11 and are all required. The only CMAS test administered in high school is science. The Colorado Department of Education also administers the PSAT/SAT to high school students. Because Colorado had a previous history of high school students leading efforts in opting out of standardized tests (Engdahl, 2015; Gorski, 2015a; Whaley, 2016), we focused our analyses on high school standardized tests. Since the PSAT/SAT is required for many college admissions applications, test-taking behavior around college entrance exams would differ. Therefore, we utilized the CMAS 11th-grade science exam to measure test participation.
Data Sources
We gathered data from the Colorado Department of Education, the National Center for Education Statistics (NCES), and the Civil Rights Data Collection to examine opt-out behavior in Colorado. School-level demographic information from the NCES Elementary and Secondary Survey Data included charter school status, pupil-teacher ratio, number of students by race, free-and-reduced price lunch (FRL) status, and latitude/longitude to map locations of each individual school (NCES, 2021). We only pulled school data for “regular” schools from NCES—in other words, locally governed or “traditional” public schools and charters (NCES, 2021). 2 Further, we did not include schools with fewer than 50 students so as not to influence results unduly. We used the Civil Rights Data Collection (2021) to collect information on the number of students with disabilities at each school. We also used Colorado Department of Education (2021) data to collect 11th-grade CMAS participation information. We then merged these data into a master file of information comprising school-level data for the state of Colorado. Table 1 shows the distribution of schools by type across each year. To conduct the geographic analyses of the study, we mapped each school in ArcGIS Pro (Esri Inc., 2021) using their base shapefiles and then exported these data for the geographically weighted regression (GWR) analysis. As previously discussed, we were not specifically focusing on measuring the geographical nature of activism and did not include a particular variable meant to measure or serve as a proxy for activism. Instead, we focused this analysis on school-level demographic variables related to opting-out behavior. Prior research demonstrates that race, socioeconomic status, the percentage of students with disabilities, pupil-teacher ratio (Chapman et al., 2020), and charter school status type all are important characteristics of opting-out behavior (Chapman et al., 2020, Currin et al., 2019; Rivera-McCutchen, 2021; Taylor-Heine, 2021; Wilson et al., 2021). More specifically, a large body of research indicates that opting out is typical among white, middle-class families (Chapman et al., 2020; Chingos, 2015; Harris & Fessenden, 2015; Pizmony-Levy & Cosman, 2017; Supovitz et al., 2016). Further, research also demonstrates that the percentage of students is positively associated with opting out of standardized tests (Chapman et al., 2020). Other studies suggest that charter school status is an important indicator of opting out (Clayton et al., 2019). Pupil-teacher ratio is a measure of per-pupil resources that is more direct than spending and is included as an independent variable as an indicator of teacher availability (National Center for Education Statistics, 2015), which could potentially influence student test-taking behavior.
School Characteristics, By Year

Data Analysis
Our analytical approach was multifaceted. First, we conducted descriptive statistics to understand general opt-out behaviors better. We then conducted an ordinary least square (OLS) regression for each year of interest (2016, 2017, 2018, and 2019) to assess for statewide relationships between opt-out behavior and school characteristics, including the percentage of white students, percentages of FRL students, pupil-teacher ratio, and charter school status. Because of high multicollinearity, we chose to include only the percentage of white students, as this aligns with the hypothesis that higher opting out is associated with white privilege.
Because we investigate opting out as a social movement, we investigated the geographic relationship between opting out and the same independent variables (percentage of white students, percentages of FRL students, pupil-teacher ratio, charter school status, and magnet school status) through multiscale geographically weighted regression (MGWR) (Oshan et al., 2019). GWR is a statistical technique that extends the traditional regression framework by allowing regression coefficients to vary locally and be estimated for specific points in space (Fotheringham et al., 2002). It is a locally weighted estimate where the value of a coefficient for an independent variable is determined by geography—for example, where the relationship between free- and reduced-lunch participation and test participation in a school is calculated using an individual school and their nearest physical neighbors in the data. This differs from the standard quantitative model, which assumes that relationships among variables are the same everywhere. GWR takes into account the possibility that relationships change by location. MGWR is an extension of the traditional GWR, allowing for varying spatial scales throughout the model (Oshan et al., 2019). In addition to coefficient estimation, measures of fit for chosen GWR model specifications include R2 and an Akaike information criterion with a small-sample correction (AICc), which allows comparison of model fit to OLS.
Analysis was conducted via MGWR 2.2 (Oshan et al., 2019). This is appropriate for analyzing the opt-out movement, where ideas can spread across space but organizing happens locally. With MGWR, locally weighted regression estimates outcomes (and therefore relationships) by looking at a predictor’s range and only at cases close to the predictor. Those cases that are closer geographically will have greater weight. The kernel (or nearby weighting) is such that relationships between variables will quickly drop to zero once they move outside each predictor’s nearest neighborhood. For our models, we specified adaptive bi-square spatial kernels. Although most locally weighted regression is along one dimension at a time, MGWR is a two-dimensional version, where local kernel weights are set by distance on the plane (local geography); within this model, we utilized an adaptive spatial kernel, which allows for varying bandwidths rather than fixed distances between data points (Rowe & Arribas-Bel, 2022). Further, MGWR requires researchers to preselect variables likely to have geographic variation and exclude those more likely to be constant regression coefficients.
Results
Descriptive Statistics
A summary of school demographic characteristics is presented in Table 2. In general, demographics remained stable across all four years. On average, white students were the predominant racial group (average between 56–62%), followed closely by Latinx students (average between 29–49%). It is also interesting to note that across all four years, there were schools composed of 100% or nearly 100% white students, which was not the case for any other group. There were also schools in the sample comprised of nearly all Latinx students (98%). This suggests high levels of segregation in some schools. Recent work by Frankenberg et al. (2019) examines school segregation across the United States. In this work, they found that Colorado was one of the most segregated states in the nation for Latinx students (in the top 20), with Latinx students having lower exposure levels to white students.
Student Demographic Details for Schools in Percentages, by Year

Next, we looked at the nonparticipation rate as a measure of opting out of the CMAS 11th-grade science standardized test. The participation rate was generally similar across the four years we examined, with the average nonparticipation rate across the state hovering between 22–27% (see Table 3). The highest year for nonparticipation was 2016, at 27.1%, and the lowest was 2018, at 22.5%. These results indicate that nearly one-quarter of students did not participate in the CMAS 11th-grade science standardized test each year.
CMAS Opt Out/Nonparticipation Rates, by Year

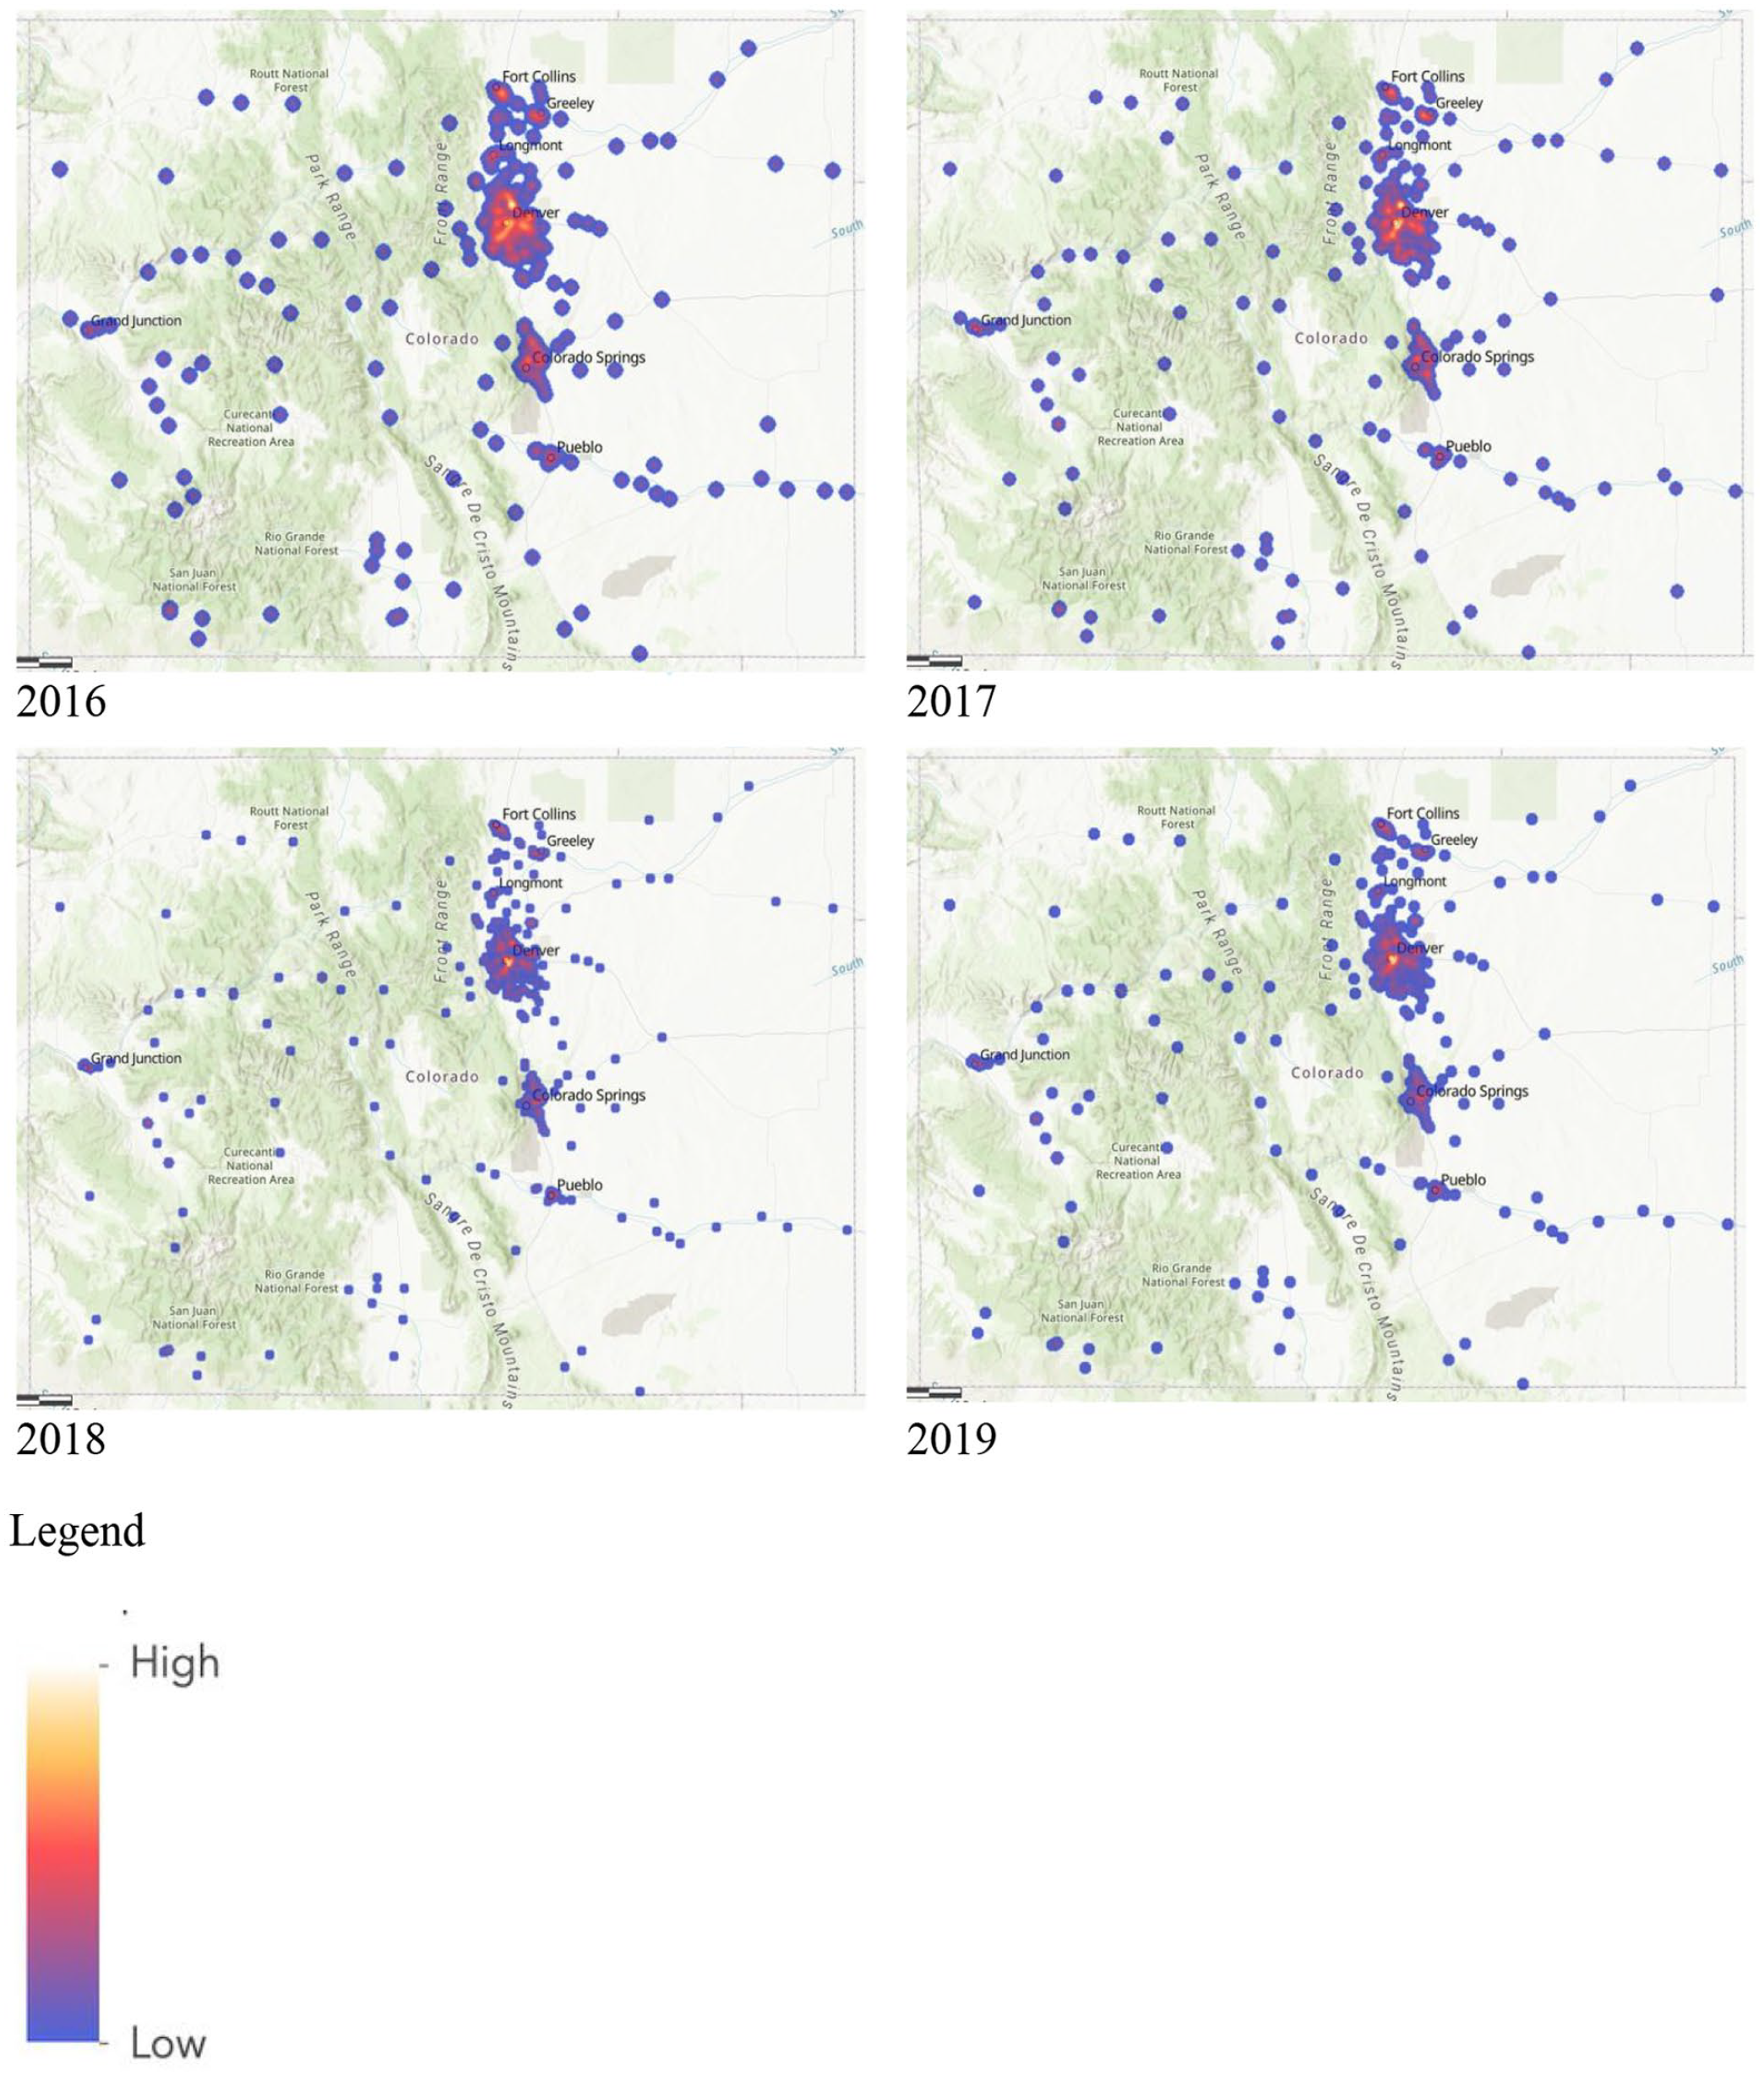
Maps of participation by geography are presented in Figure 1. Each dot on the map represents a high school in the state of Colorado. Each dot is a different color gradient representing that school’s opt-out/nonparticipation rate (separated into five categories). Red and orange dots represent lower opt-out levels or higher levels of participation (i.e., between 0 and 40% of students did not participate in the test), whereas blue dots represent higher opt-out rates, or lower levels of participation (between 60 and 100% did not participate in the test).

Opt out/nonparticipation rates for 11th-grade CMAS science test.
Across all four years, a large cluster of light and dark blue dots symbolized higher opt-out rates in the Southern portion of the Denver metro, which is largely suburban and middle to upper-middle class. There is also a concentration of schools with higher opt-out rates around Colorado Springs, Boulder, Fort Collins, and other major metropolitan areas in Colorado. Interestingly, and in line with prior research (Gorski, 2015b), we see schools in rural pockets with high levels of opting out, particularly along the I-70 corridor starting in Grand Junction and across the Western slope in Colorado.
Standard Linear Regressions
We conducted separate standard OLS regressions by year to better understand the relationship between opting out and the selected predictors. The dependent variable was opt-out rate, with higher scores indicating higher levels of nonparticipation. For this study, we included the percentage of white students, the percentage of students on FRL status, the percentage of students with disabilities, pupil-teacher ratio, charter school status, and magnet school status. This analytical approach assumes a constant relationship between each independent variable and test participation and thus does not account for any geographical variations/relationships within the data.
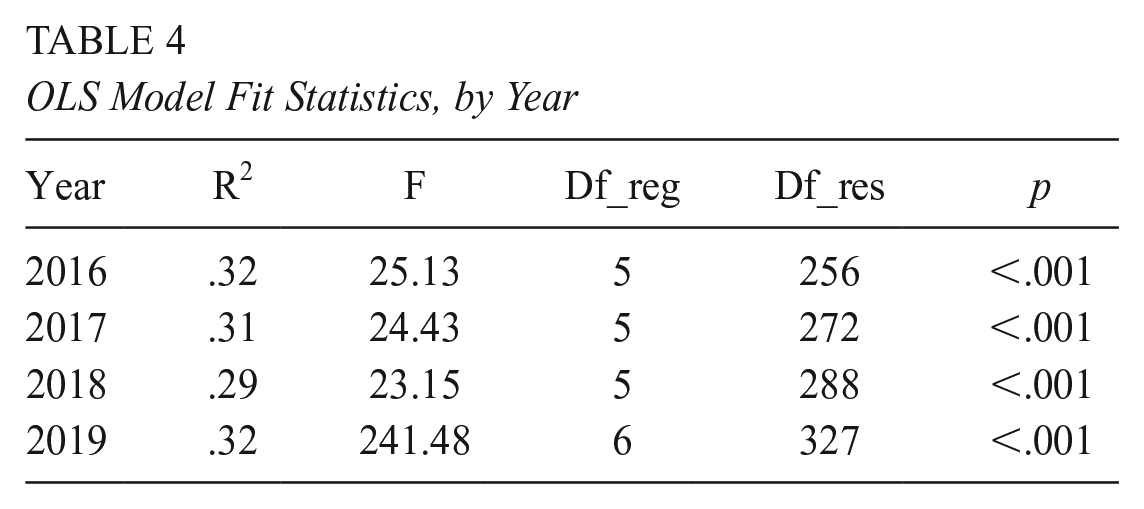
Table 3 shows the model fit summary for all four models. The model fit was reasonable across each year (p < .001). The variance accounted for over 30% for 2016 and 2017. There was a slight decrease in variance accounted for in 2018 and 2019, with an R2 of 29% and 28%, respectively.
In general, the models for 2016, 2017, and 2018 were closely aligned, with some deviations in main patterns starting in 2019 (see model results in Table 4). Across all four years of the OLS models, the percentage of white students, the percentage of free and reduced-lunch students, and charter school status were statistically significant predictors of the year’s test participation rate (p < .05) (see model results in Table 5). The pupil-teacher ratio was a significant predictor each year, except for 2017 (p > .05). The percentage of students with disabilities and magnet school status was not distinguishable from zero (p > .05). In this section, we present standardized coefficients for each predictor, where for each one standard deviation increase/decrease in the independent variable coefficient represents a change in the standard deviation of nonparticipation rate.
OLS Model Fit Statistics, by Year
Standardized OLS Coefficients, by Year

p < .05, **p < .01, ***p < .001.
Consistently, the percentage of FRL students was the strongest predictor of opt-out rate in the CMAS 11th-grade science standardized test. This was particularly true in 2019, when for each standard deviation increase in FRL status, the opt-out rate was predicted to decrease by 0.83 standard deviations (p < .05). For 2016, 2017, and 2018, the coefficients for the percentage of FRL ranged between −0.62 and −0.78, which still indicated a strong inverse relationship between the percentage of FRL students and overall opt-out rates across schools. As the percentage of FRL students increased, the opt-out rate decreased (or the participation rate increased).
The predictor with the next biggest magnitude on CMAS 11th-grade science test nonparticipation rate was the percentage of white students. For 2016 and 2018, the coefficients for the percentage of white students were −0.27 (p < .05). In 2017 and 2019, for each standard deviation increase in the percentage of white students, the opt-out rate decreased by 0.34 and 0.44 standard deviations, indicating substantial growth in the relationship between the percentage of white students and higher participation rates. This indicated that as the percentage of white students increased at schools, so too did the predicted opt-out rate, albeit to a lesser extent than the percentage of FRL students.
Pupil-teacher ratio and charter school status were statistically significant predictors of similar magnitude. Across all four years, pupil-teacher ratio had a positive relationship with opt-out rate. Still, it was only significant for 2016, 2017, and 2018 (p < .05), which indicates that as classroom size increased, opt-out rate increased. Surprisingly, pupil-teacher ratio was the only variable in our model that was positively associated with opting out. This finding is discussed in greater detail in the following section. Charter schools were negatively associated with opt-out rates. Schools with a designated charter status were predicted to have lower opt-out rates, with the effects ranging from −0.18 to −0.19 standard deviations.
Geographically Weighted Regressions
Next, we conducted geographically weighted regressions (GWRs), which allowed us to account for geographic relationships within the specified model. The GWR framework takes the traditional regression model as a foundation and then allows for the local parameters of the predictors to vary (Fotheringham et al., 2002). We first consider general issues of model fit and the strength of the relationship for variables of interest and then discuss the geographic variations in coefficients that GWR estimated—on the basis that relevant factors were likely to vary across Colorado during the years in question.
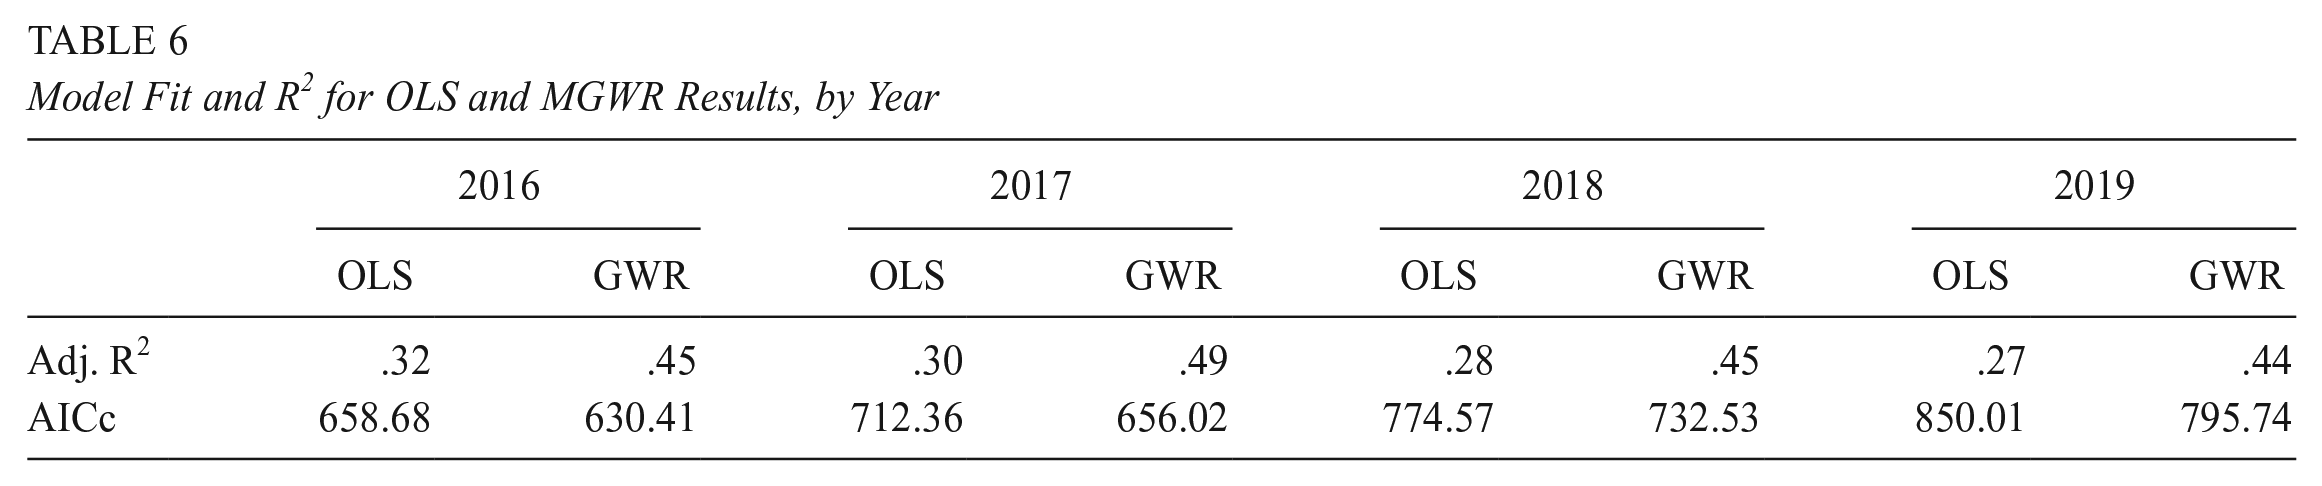
Table 6 shows the model fit comparison for GWR and OLS models, using both R2 and AICc. The MGWR models across all four academic years resulted in a substantial increase in the variance accounted for by the standard OLS models. The increase in variance accounted for ranged from 13–19%. Overall, the GWR models accounted for anywhere between 44–49% of the overall variance in the CMAS 11th-grade standardized science test opt-out rate.
Model Fit and R2 for OLS and MGWR Results, by Year
Across all four years, the same trends from the OLS regression models were held in the MGWR models (see Table 7). A notable exception is that the percentage of students with disabilities (perSWD) and magnet school status became significant predictors in all four GWR models. In contrast, they were not a significant predictor across any of the OLS models. In the same pattern as the OLS models, the percentage of FRL students remained the biggest predictor of opt-out rates in terms of coefficient magnitude, except for 2018. However, once we accounted for geographic variation in the data, the percentage of white students was no longer the second-largest predictor of opt-out rate; further, the percentage of white students was more positively associated with opt-out rate in 2017 and 2018. Pupil-teacher ratio remained a large predictor, with a positive relationship between class size and opt-out rate. Charter school status was also negatively associated with opt-out rate, particularly in 2016 and 2017. See Table 6 for a truncated presentation of results.
GWR Results, by Year
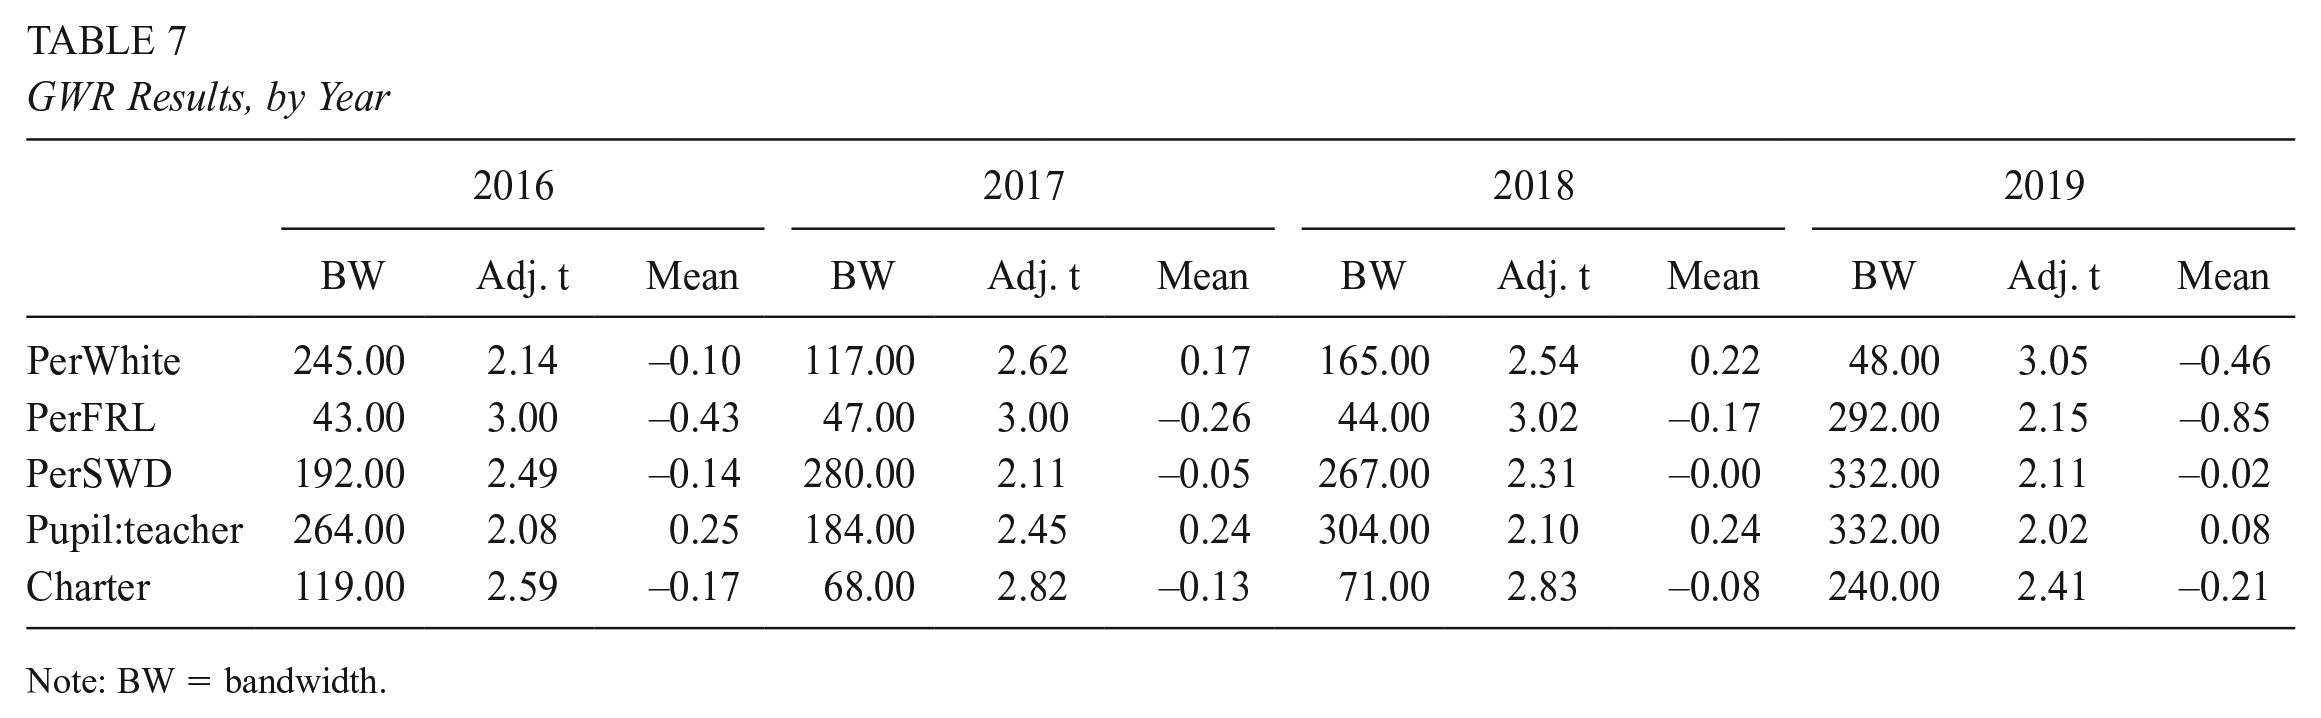
Note: BW = bandwidth.
In MGWR, bandwidth is a critical parameter, which measures the spatial scale at which variables occur (Oshan et al., 2019). The smaller the bandwidth value, the shorter the geographical distance that the variable affects. Across all four years, the percentage of white students, the percentage of students with disabilities, and the pupil-teacher ratio had the largest bandwidths, indicating the greatest geographic reach at which individual data points (schools here) affect the estimate of local coefficients. In 2016, the percentage of white students and pupil-teacher ratio had the two largest bandwidths; the percentage of students with disabilities and charter schools also had considerable bandwidths. This same pattern was repeated in 2018. In 2017, the variable with the largest bandwidth was the percentage of students with disabilities, followed by the pupil-teacher ratio and the percentage of white students. Notably, the charter school variable had a considerably lower bandwidth. In 2019, the bandwidths changed substantially. The percentage of white students had a very low bandwidth in comparison to prior years, whereas the bandwidth for the percentage of FRL students increased considerably (from 43 the previous year to 293). The percentage of students with disabilities and pupil-teacher ratio had the highest bandwidths, though much higher than in previous years. This change might be due to a shift in covariation structure across the years, and as a result, the geographic spread of variables shifted.
To further explore the relationship of the predictors of the percentage of FRL and charter school status with participation rate, we constructed nearest neighbor maps. These maps are the heat-map-style representation of geographically varying coefficients for individual variables. These nearest neighbor maps embody the heart of GWR—showing how estimated relationships for a dataset vary across space. With nearest neighbor maps, it is important to interpret only the blue and yellow portions. All other colors (i.e., red) are just noise and should not be interpreted. The yellow areas of the maps show estimates of local coefficients with more positive relationships between the predictor (either percentage FRL or charter school) and opt-out rate. In contrast, blue areas of the map indicate more negative (and sometimes minimally positive) relationships between the predictor and opt-out rate.
There is a strong positive relationship with the percentage of FRL students and opt-out rate in pockets of the Denver-metro area and in the Southern portion of the state (see Figure 2 for maps; full-size maps are available online in Appendix C). We also see an exaggerated low or negative relationship with the percentage of FRL students and the opt-out rate in more rural areas of the state. In more urban areas of Denver, Colorado Springs, and Fort Collins, we see a pronounced positive relationship between the percentage of FRL students and the opt-out rate. However, much of this is likely because these areas have more schools with greater numbers of FRL students.

Natural neighbor maps for estimates of student opt out/nonparticipation in association with free-and-reduced-price lunch percentages.
Before exploring the geographic variation between charter schools and participation rate, we constructed maps to show the distribution of charter schools across the state (see Figure 3 for maps; see full size online in Appendix D). In general, we see most of the charter schools clustered around the Denver-metro area and in major metropolitan areas, such as Colorado Springs and Fort Collins. Further, a few charter schools are spread out along the Western slope.
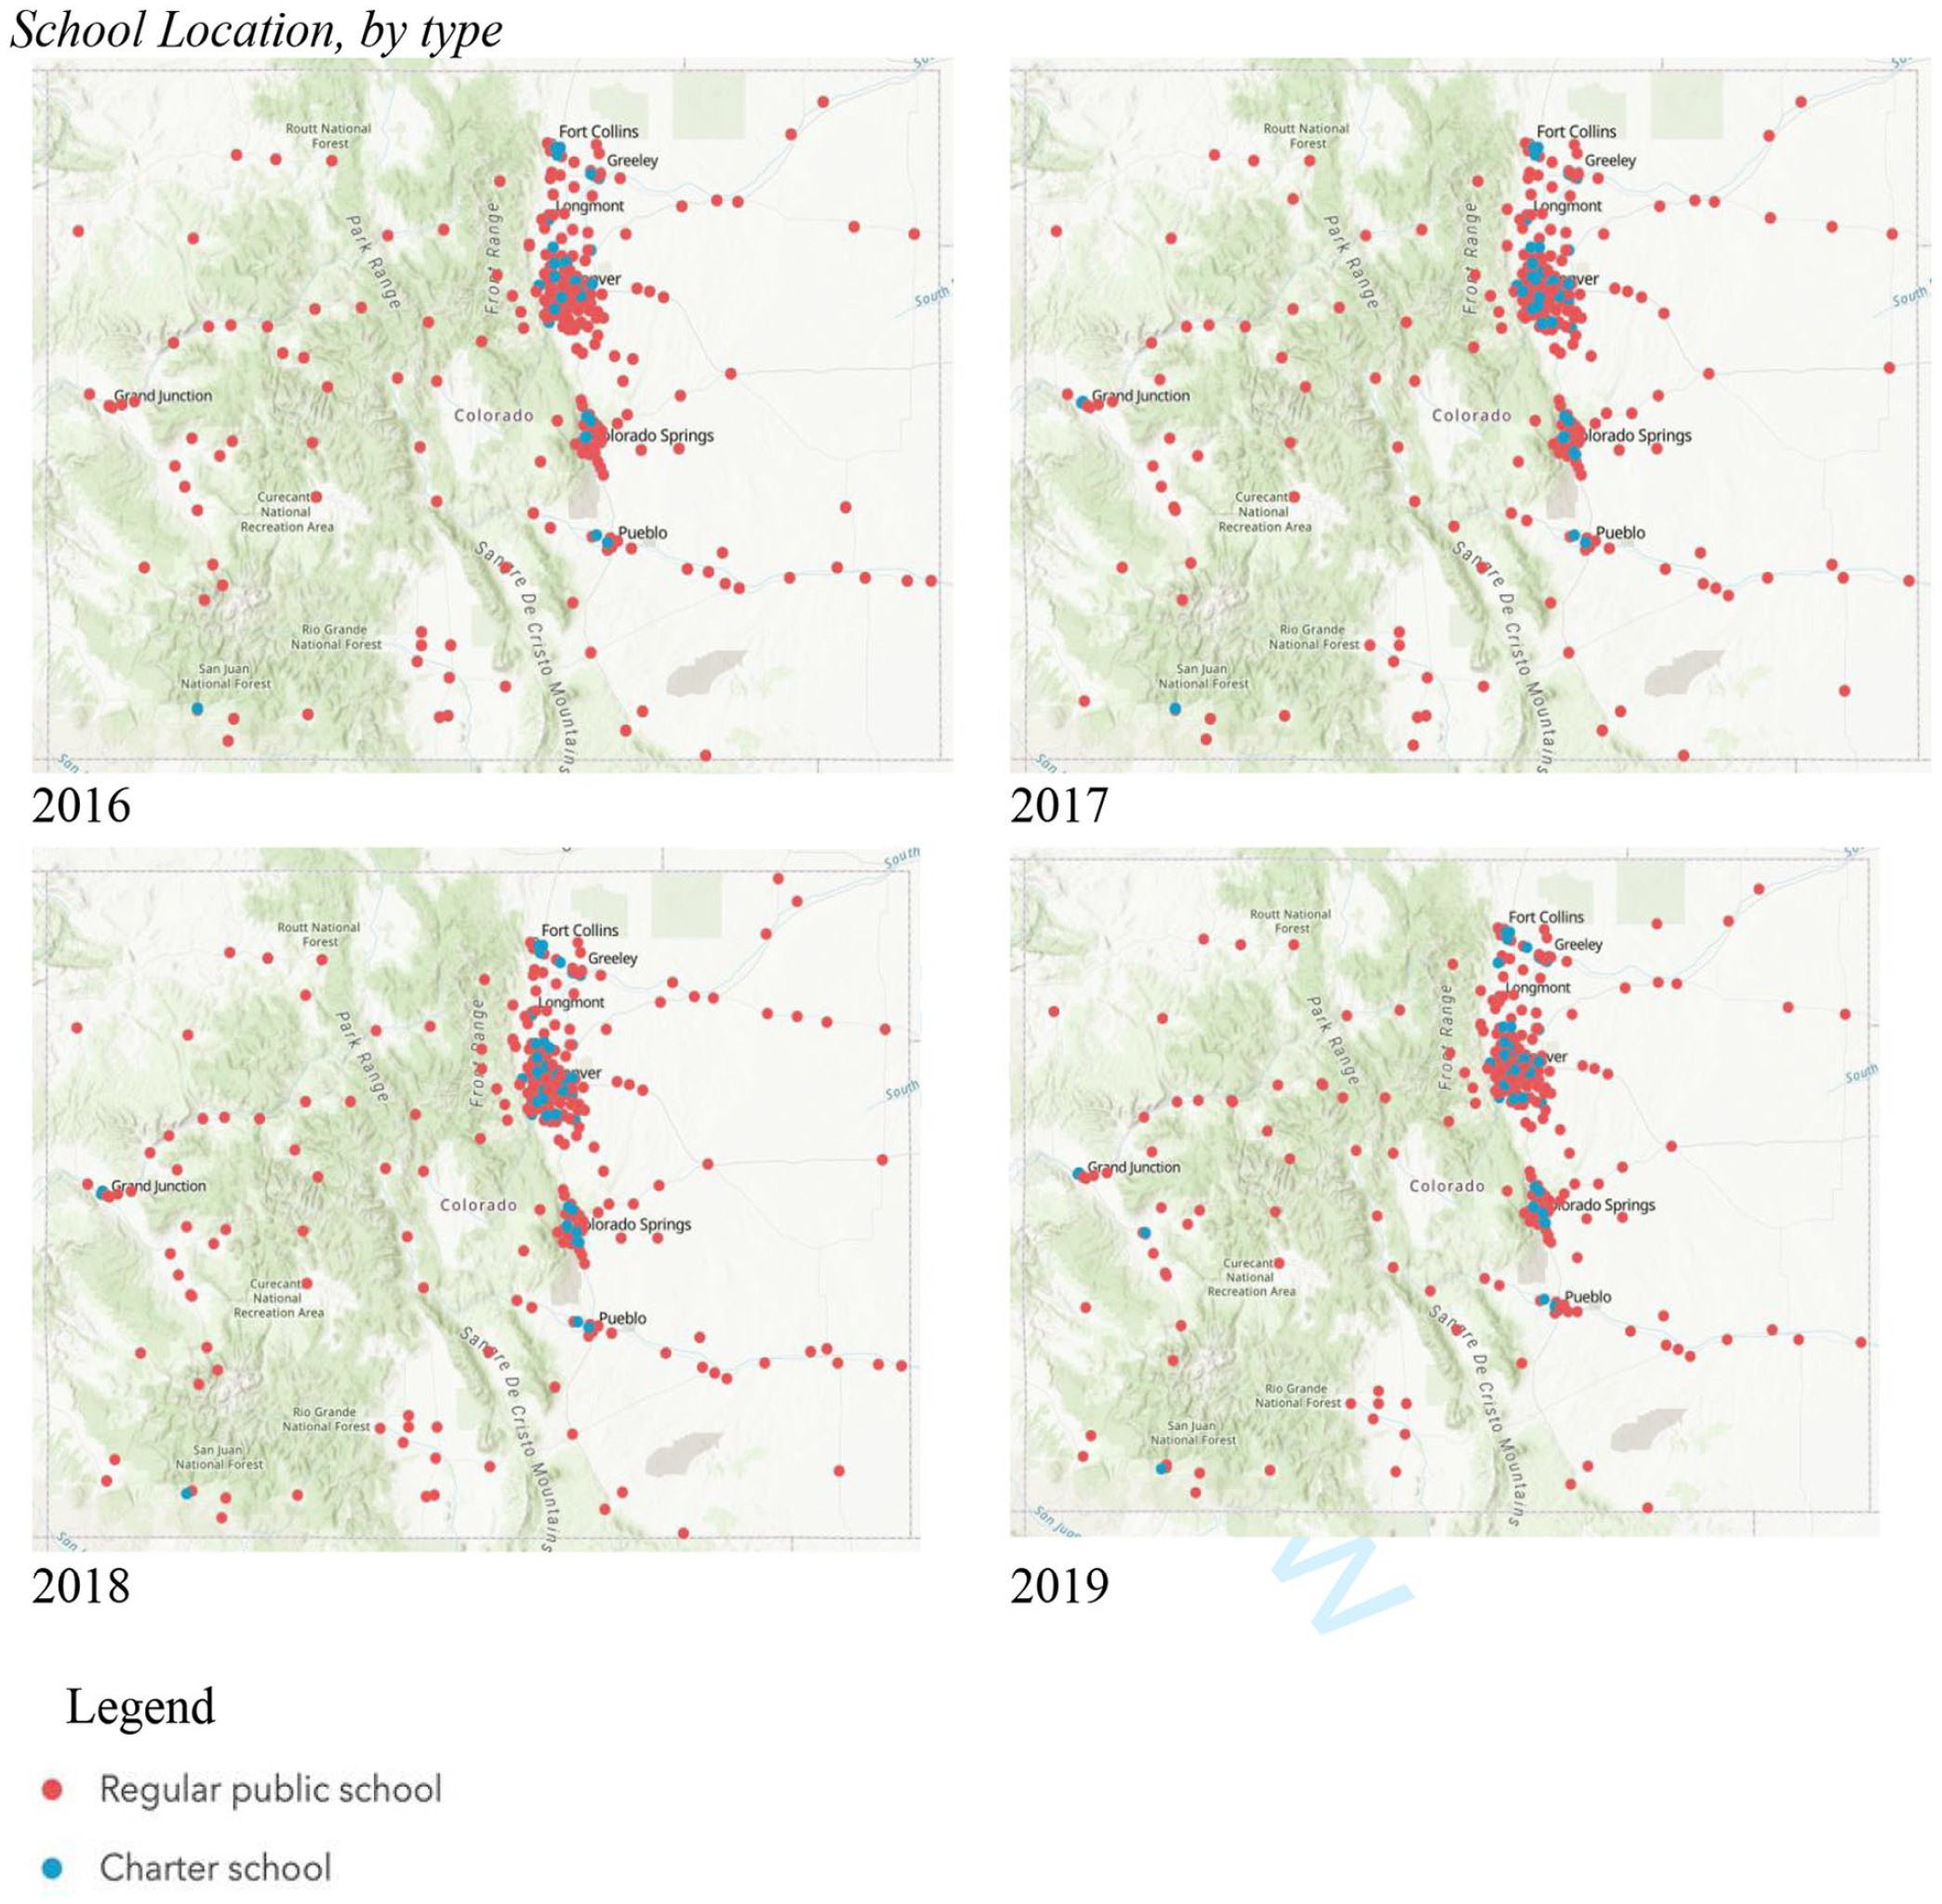
School location, by type.
When looking at the nearest neighbor maps for charter schools, we see a strong positive relationship between charter schools and opt-out rate in pockets of major Colorado metropolitan areas (see Figure 4 for maps). Because charter schools had lower bandwidths in the GWR results, we set these maps to have smaller areas of influence not to overstate the effects of charter schools. Interestingly, from 2016–2018 we see bright yellow pockets in Denver and Northern Colorado, indicating a very strong, positive relationship between opt-out rate and charter schools in these areas. Blue indicates a low or more negative relationship between charter schools and participation rates. Across all four years, a large blue ring around Denver or in more suburban areas exists. Across the Rocky Mountains, Western slope, and rural Western parts of the state, we see many blue dots, indicating negative relationships between charter schools and participation rates. Interestingly, this decreased substantially in 2019. Also, the yellow portion in Denver decreases in size considerably, suggesting substantially less effects from charter schools.
Natural neighbor maps for estimates of student opt out/nonparticipation in association with charter schools.
To further explore the potential dynamics of charter schools, we then conducted descriptive statistics of all independent models by charter versus traditional public schools (see Table 8). This analysis revealed findings that might point to some of the reasons why there is greater participation among charter schools. Across all four years, traditional public schools had higher average percentages of white students. In 2016, there was nearly the same percentage of white students across charter and traditional public schools. However, this gap increased by six percentage points in 2017, and this trend held through 2019. Unsurprisingly, charter schools had a lower average percentage of students with disabilities. Traditional public schools had consistently higher percentages of students with FRL status. This gap was largest in 2016 and then decreased to a difference of about three percentage points in 2019. Charter schools consistently had higher pupil-teacher ratios, indicating traditional public schools had smaller average class sizes, which might explain the dynamic of both pupil-teacher ratios and charter schools in relation to participation rate.
Descriptive Statistics by Charter Schools

Geographical Subset
To further explore the concept of social movement theory within the opting-out behavior in Colorado, we examined a subset of the state. Specifically, we examined the quintile classifications of school opt-out/nonparticipation rates in the Denver-metro area (see Figure 5). As with the maps in Figure 1, the red/orange dots indicate lower levels of opting out, with blue dots signifying higher nonparticipation levels. This smaller-scale analysis reveals some interesting findings. Many schools in clusters move from one quintile group to another across the four years. This suggests a local geographical context is at play, driving some of the opting out behavior.
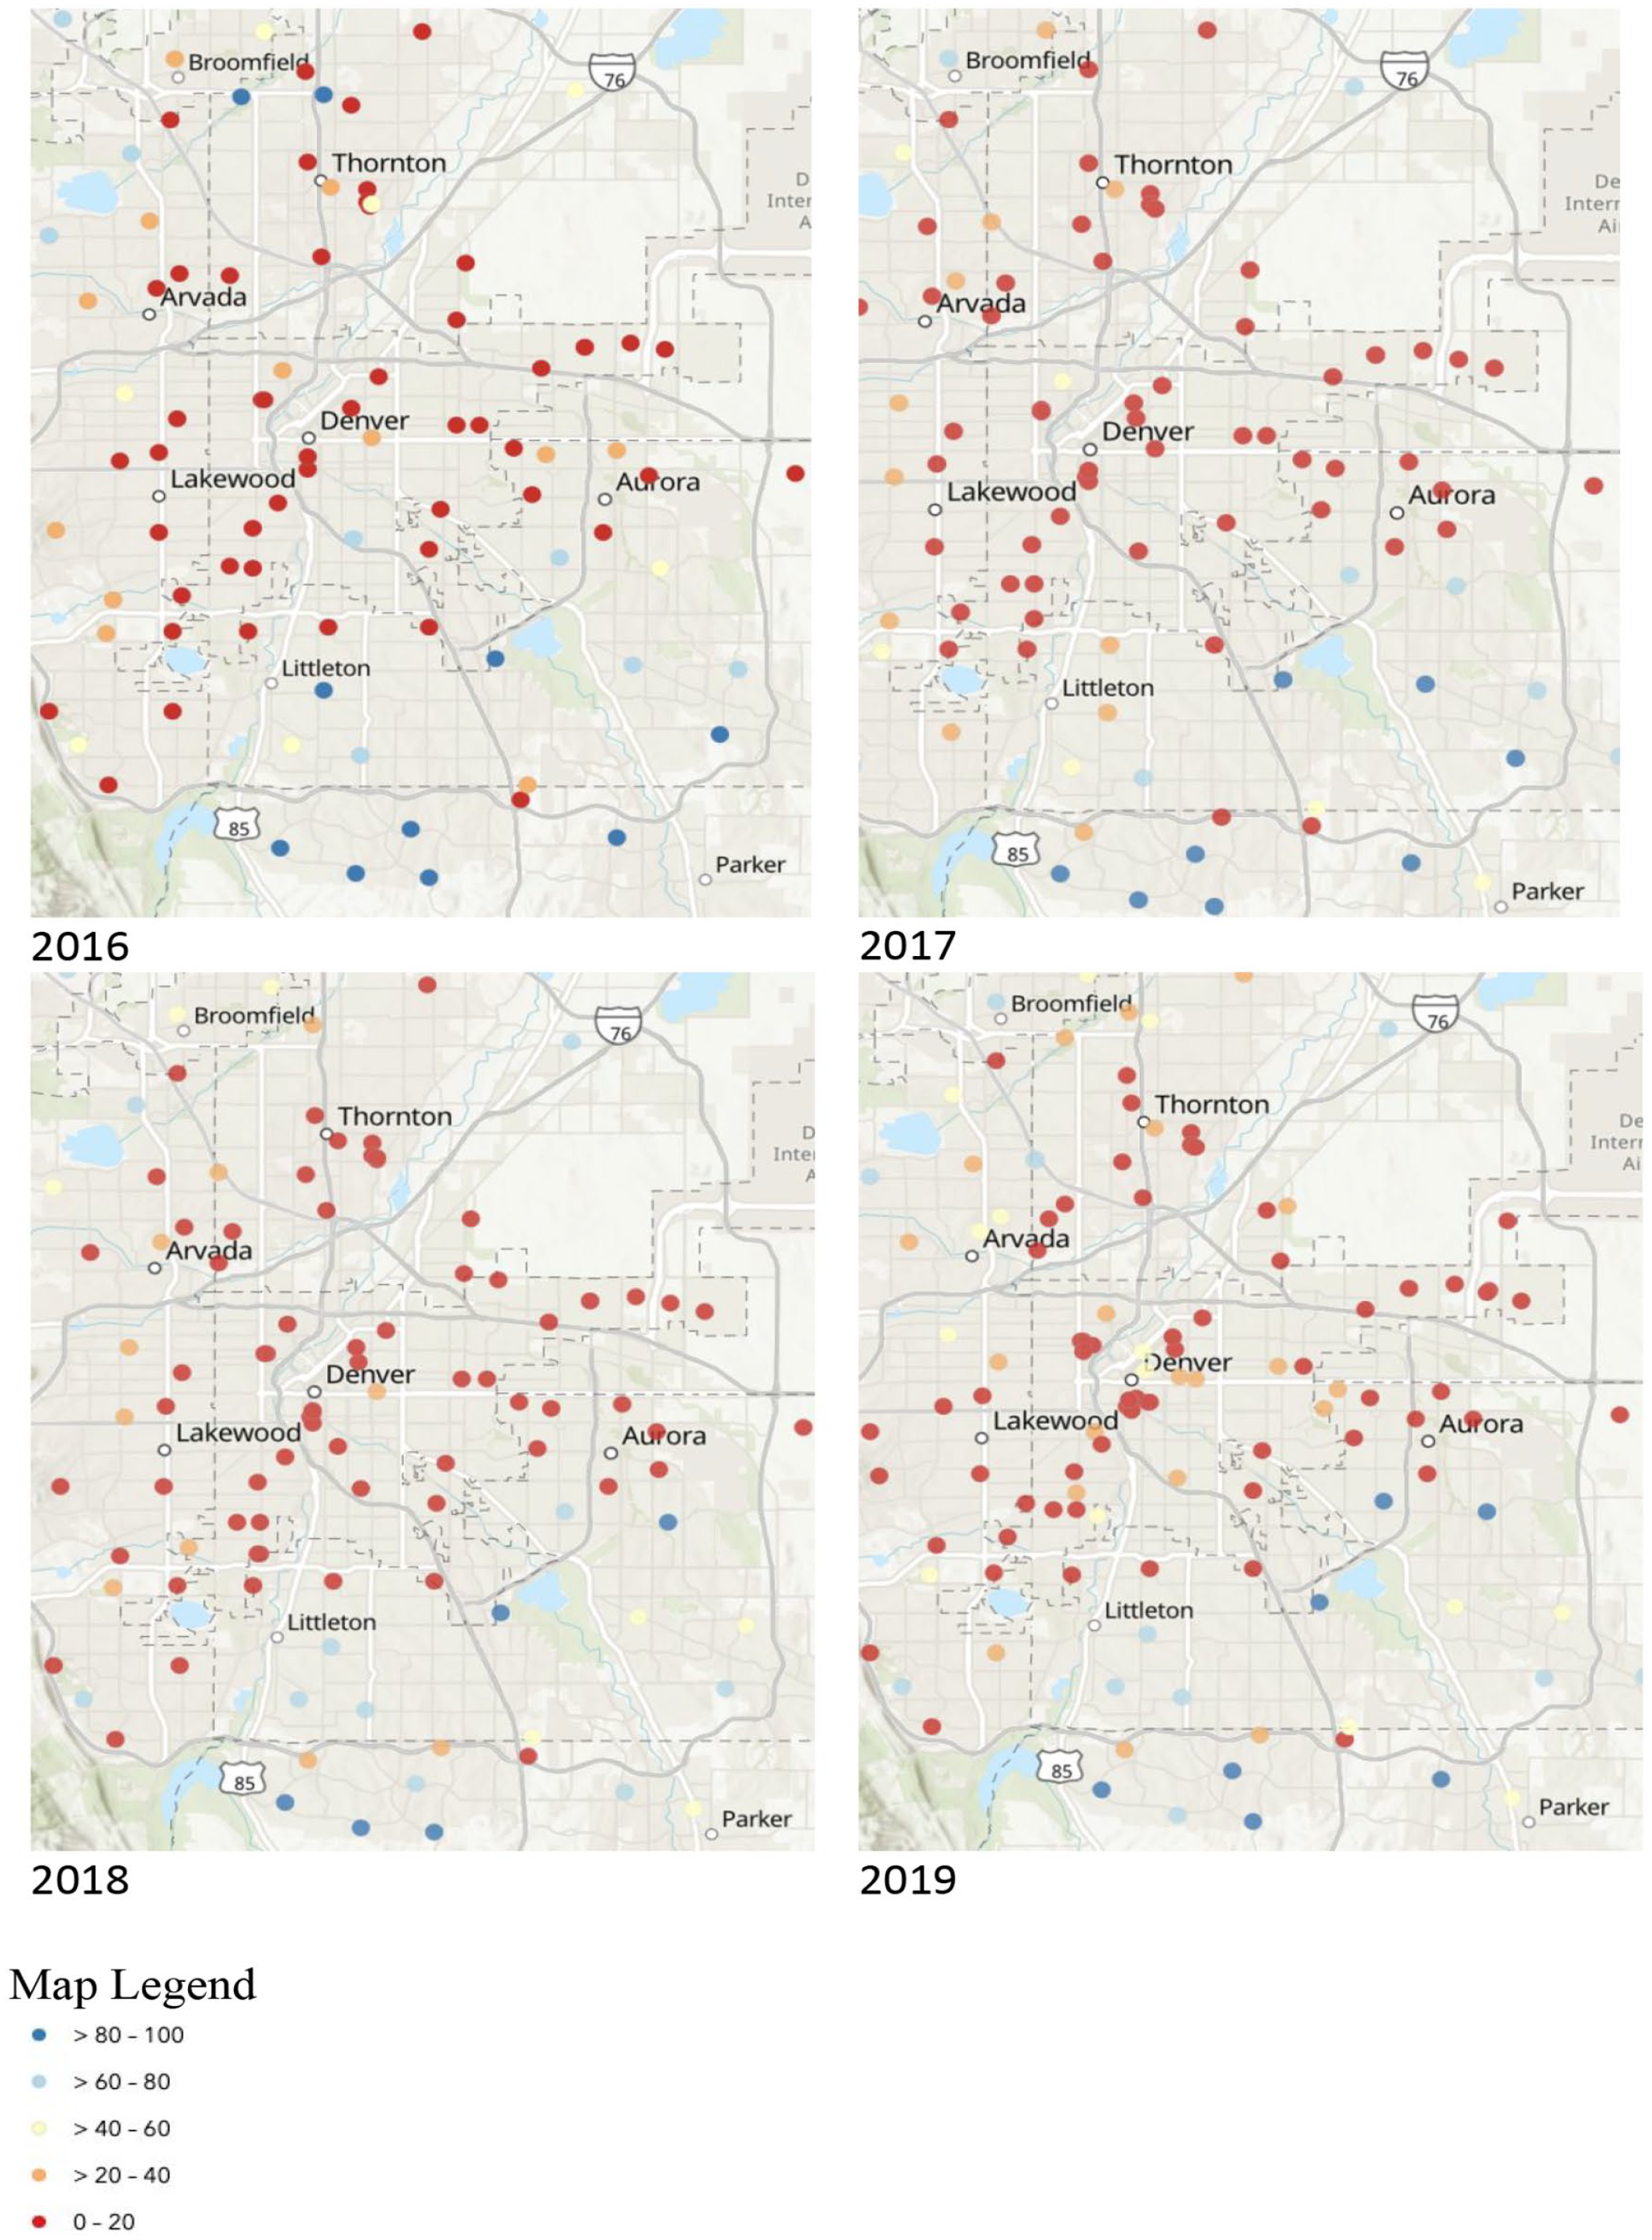
Subset of opt-out rate in the Denver-metro area.
Discussion
Multiscale geographically weighted regression (MGWR) is a supplementary analysis to OLS regression, requiring a more nuanced description of the opting-out phenomenon. Through this technique, we can examine factors influencing the CMAS science standardized test participation rate among 11th graders from 2016 through 2019. However, unlike OLS, where we look at factors only with constant coefficients, we can examine these factors’ geographic relationships and weights across the state through MGWR. Although some states have higher opt-out behavior (i.e., Colorado, New York, and Rhode Island) (e.g., Bennett, 2016; Ujifusa, 2015a, 2015b), the geographic analysis in this article indicates that there is considerable variation within the states. Using the same predictors, the variance increased by 16–24 percentage points when we utilized the GWR framework. This finding aligns with previous work demonstrating geographic variation’s importance in opt-out behavior (Chapman et al., 2020).
Further, these findings reinforce the ideas from previous work that emphasize the importance of social networks in opting out (e.g., McKeon & Gitomer, 2019; Pizmony-Levy & Green Saraisky, 2021). Although OLS can provide a strong understanding of these behaviors, the GWR method allows for a more nuanced and specific understanding of opting out behaviors while accounting for considerably higher variance within test participation in Colorado. In Colorado, as in all states, the political and social dynamics surrounding education can be highly localized, and they were as such in terms of test participation in the years examined.
Aligning with prior work, our analyses reveal key demographic characteristics related to opt-out behavior. Consistently, and across both OLS and GWR models, the percentage of free-and-reduced-price lunch (FRL) students was the strongest predictor of nonparticipation, with lower numbers of FRL students linked with higher opt-out rates, which aligns with similar findings from Chingos (2015). It is important to note that the percentage of FRL students does not have the same weight or relationship with the participation rate when examined across the entire state. In particular, large pockets around the Denver-metro area and along the Western slope have a pronounced minimal/negative relationship between the percentage of FRL students and the opt-out rate. In contrast, portions of Southern and Eastern Colorado, which are in more rural and conservative parts of the state, have a stronger positive relationship between the two. These findings indicate a complicated and nuanced relationship between socioeconomic status (SES) and participation in standardized tests and suggest the potential for greater distrust of schools as an institution among rural communities in Southern and Eastern Colorado. Past research indicates that people with more conservative views are less supportive of Common Core or the involvement of the federal government in their children’s education (Pizmony-Levy & Green Saraisky, 2016). This understanding of political views and geographical trends can further our understanding of opting out of standardized tests and add context to the first impressions of opt-out research (e.g., Chingos, 2015). As such, we cannot look just at SES or the percentage of FRL students when examining relationships with standardized test behavior. Instead, these findings indicate a need for including a geographic analysis and the importance of understanding and identifying local dynamics that underlay the specifics of test nonparticipation.
Another finding different from prior studies was the relationship between charter school status and participation rate. Clayton et al. (2019) observed that opting out was higher among charter schools in Colorado. However, our study found that charter schools typically had lower opt-out rates. The MGWR and natural neighbor maps tell a more complicated story. We see a strong, positive relationship between charter schools and the opt-out rate in metropolitan areas. However, much of the state is covered in blue swaths, indicating a low relationship between charter schools and opt-out rates. This finding must be interpreted within the context of charter school locations. There are very few charter schools in more rural areas, which influences the effects of charter schools on participation rates. In this case, we observe that the large pockets of a positive relationship with charter schools and opt-out rate occur around the Denver-metro area, largely suburban neighborhoods that are typically more affluent. On the other hand, in more rural areas, we observe greater participation in the CMAS 11th-grade science test. Further, charter schools in Colorado must have at least 95% of students participating in standardized exams, or the nonparticipants will be classified as nonproficient, as specified by the Every Student Succeeds Act (ESSA) (Katanyoutanant et al., 2021). Therefore, some trends we see with higher participation rates in charter schools could be due to this requirement.
The analysis also suggests a more complicated relationship between race and standardized test participation rate. Some prior studies have primarily characterized the opt-out movement as predominantly occurring among white women (Schroeder et al., 2018, 2020b). Other studies have demonstrated that opt-out behavior is greater among white families (Pizmony-Levy & Green Saraisky, 2016). However, other scholars have suggested that racialized dynamics and components are more at play (Currin et al., 2019; Taylor-Heine & Wilson, 2020). Our analysis indicates that white students were, on average, more likely to participate in the standardized test when compared to their nonwhite counterparts in 2016 and 2019. In 2016, the range of the coefficients for the percentage of white students ranged from −0.22 to −0.07, suggesting a small range, and negative relationship between the number of white students and the opt-out rate. For all other years, the geographically varying coefficient ranged from negative to positive, suggesting greater variation in the relationship between the percentage of white students and opt-out rate. These ranges were especially pronounced in 2017 and 2019. In 2019, we observed a large increase in the predictive relationship between the percentage of white students and the opt-out rate. However, at the same time, we also found a much smaller bandwidth for the percentage of white students in MGWR results. In 2017 and 2018, the percentage of white students was negatively associated with participation rate, which aligns with prior research. Some of these shifts in participation could be due to the shifting testing environment and requirements in Colorado (Gorski, 2015a, 2015b).
Lastly, in Colorado, we found a role of pupil-teacher ratio in opting-out behavior. Of all the independent variables, this was the only one contributing to higher levels of opting out of the CMAS 11th-grade science test. A higher pupil-teacher ratio was associated with higher opt-out rates across each academic year examined. When we tabulated the number of charter schools by the independent variables, we found that they had a higher average pupil-teacher ratio than their district-governed public school counterparts. This finding is particularly significant because much prior research has not included pupil-teacher ratios in their studies as predictors. As such, this suggests that pupil-teacher ratios might be an important variable in future research.
More broadly, what does the geographic variation in patterns indicate about the opt-out movement? The findings here should undermine a monolithic view of opting out as a social movement and behavioral phenomenon. Instead, it should push researchers to see nuance in what are often localized patterns. Much of the prior research on opt-out behaviors has focused on the role of parents in the opt-out movement (e.g., McLoud, 2019). This is an important lens, especially when examining test-taking behavior for elementary and middle school students. We extend the literature by incorporating the role of youth activism and action in the opt-out movement (building on the work of Wilson, 2018). There is a long history of youth activism in Colorado’s educational systems (Alaniz & Cornish, 2008; Garcia, 2015; Garcia & Castro, 2011; Montejano, 2010; Muñoz, 2007). In recent years, we have observed the continuation of this youth activism in Colorado schools, such as through student walkouts in 2014 when hundreds of students refused to participate in a new standardized test for 12th-grade students (see Wilson, 2018, for a more detailed description). In this case, students protested not only the function of the test itself but also the role of allocating funds to the test in lieu of other areas in need (Wilson, 2018). Our study affirms a strong geographic component to youth organizing and participating in the opt-out movement.
We found geographic variation in the relationships between test nonparticipation and a broad range of predictors, especially free-and-reduced-lunch program participation, percentage of white students, and whether the school was a charter school. This analysis of available school-level data for these years suggests that geographic variation should be considered the norm in opting out, not the exception. This reinforces the importance of local dynamics, including the history of youth activism in Colorado, up through and including the opt-out movement. Although we did not include a measure of youth activism as a variable, we examined a state where high school students had demonstrated significant youth activism regarding standardized tests. And we can see from the analysis that geography plays an important role in how students participated in 11th-grade CMAS exams. These findings echo the call from Nicholls (2009) to incorporate geographic analyses within the context of social movements research. As can be seen in the results from this study, we specifically find strong local and statewide patterns among opting-out behavior—suggesting that proximity and great distances can produce social movements (Nicholls, 2009). This might be explained by social media and technology, which have played a critical role in the opt-out movement (Harris & Fessenden, 2015; Pizmony-Levy & Green Saraisky, 2016; Solnik, 2015; Wang, 2017). Further, in Colorado, students who are especially active on social media led much of the opting out of standardized tests (Engdahl, 2015; Gorski, 2015a; Mullen, 2022). Future research should consider the role of technology as a means to bridge geographic distances in social movements. Qualitative research might better illuminate some of the nuances of high school students' test-taking behavior.
Ultimately, this study tells of the continuation of a long-standing tradition of youth activism surrounding educational policy choices in Colorado. This time, we see nonparticipation in the 11th-grade CMAS exam as the area of focus. Further, our work underscores the importance of incorporating geographical analyses when examining complex behaviors, such as opting out of standardized tests. MGWR significantly expands our understanding of the opt-out movement in Colorado. In this case, we see a large effect of geography, complex racial dynamics, and youth roles, all influencing opt-out behavior in Colorado. This study can inform education agencies, local policymakers, and practitioners on adopting and spreading ideas among students and families in educational contexts. Specifically, policymakers should examine local contexts more closely when considering testing and standardized test rules. As seen in this study, views about participating in tests varied considerably across the state’s geography. Therefore, trying to enforce a statewide policy or practices around testing should be reevaluated. From a research standpoint, future researchers should heed Nicholls’ (2009) call to include geographic analyses when examining social movements. As can be found in our prior (Chapman et al., 2020) and current research presented in this study, the geographical analyses add considerable understanding of opting-out behavior—including geography as an important analytical component that can further our collective understanding of this phenomenon.
Further, this study aims to expand and extend our understanding of youth behaviors while incorporating a geographical analytical component. Because we could not include a formal variable to measure youth activism, future work should do more to examine better how much youth activism influences 11th-grade CMAS (or other standardized tests) participation. Within opting out, further work should consider other state contexts, looking at national dynamics and in-depth qualitative analyses to better understand opt-out behavior, especially as it relates to students of color and their educational choices. Ultimately, these findings extend the current research on the opt-out movement. Much of this prior work laid the foundation to understand overall opting out behavior nationally or at a state level. Further, much of the social movements literature does not consider the role of geography in the spread of ideas and movements. Those studies considering geography are often conceptualized in close geographic proximity only. These findings presented in this study tell a much more complicated story–student demographics, school governance, and geography all coincide to create dynamics of a complicated and varying opting out movement in the state of Colorado.
Supplemental Material
sj-docx-1-ero-10.1177_23328584231169735 – Supplemental material for Opting Out of Standardized Tests at the Secondary Level—A Geographic Analysis of Colorado
Supplemental material, sj-docx-1-ero-10.1177_23328584231169735 for Opting Out of Standardized Tests at the Secondary Level—A Geographic Analysis of Colorado by Lydia Ross, Kathryn P. Chapman, Sherman Dorn and Carlos R. Casanova in AERA Open
Supplemental Material
sj-docx-2-ero-10.1177_23328584231169735 – Supplemental material for Opting Out of Standardized Tests at the Secondary Level—A Geographic Analysis of Colorado
Supplemental material, sj-docx-2-ero-10.1177_23328584231169735 for Opting Out of Standardized Tests at the Secondary Level—A Geographic Analysis of Colorado by Lydia Ross, Kathryn P. Chapman, Sherman Dorn and Carlos R. Casanova in AERA Open
Footnotes
Notes
Authors
References
Supplementary Material
Please find the following supplemental material available below.
For Open Access articles published under a Creative Commons License, all supplemental material carries the same license as the article it is associated with.
For non-Open Access articles published, all supplemental material carries a non-exclusive license, and permission requests for re-use of supplemental material or any part of supplemental material shall be sent directly to the copyright owner as specified in the copyright notice associated with the article.