
Abstract
This study leverages six years of public prekindergarten (pre-K) and kindergarten data (N = 22,469) from the Boston Public Schools (BPS) to examine enrollment in BPS pre-K from 2012–2017 for students from different racial/ethnic, socioeconomic, and linguistic groups. The largest differences in enrollment emerged with respect to race and ethnicity—and for enrollment in programs in higher-quality schools (defined as schools scoring in the top quartile on third-grade standardized tests)—with disparities increasing over time. Although there were no differences across groups in proximity to BPS pre-K programs in general, Black students lived about a quarter of a mile farther than their White peers from the nearest program in a higher-quality school, with gaps widening over time. Closer proximity was associated with a higher likelihood of enrollment in a program in a higher-quality school. Implications for future research and policy are discussed.
Keywords
Expanding access to high-quality public pre-K has emerged as a key policy lever for supporting young children’s development (Chaudry et al., 2021) and is thought to be a tool for promoting more equitable learning for children from marginalized groups (Bloom & Weiland, 2015; Phillips et al., 2017; Puma et al., 2010; Weiland & Yoshikawa, 2013). Yet, there are sizable disparities in availability of and enrollment in early childhood education programs—and high-quality programs in particular—depending on children’s racial/ethnic, linguistic, and socioeconomic backgrounds (Barnett & Yarosz, 2007; Latham et al., 2021). As federal and state policymakers craft historic proposals to expand the availability of high-quality pre-K across the country, there is a critical need to examine patterns of equitable enrollment in pre-K across time and to identify the key factors that facilitate and inhibit enrollment for students from families with lower incomes, dual language learners (DLLs), and those from racially/ethnically marginalized groups. 1
To address this need, we leverage six recent years of data on all children’s enrollment in the well-known, high-quality Boston Public Schools (BPS) prekindergarten (BPS pre-K) program to consider how patterns of enrollment vary by children’s racial/ethnic, linguistic, and socioeconomic backgrounds. Importantly, as is the case in many large cities in the United States, BPS allocates seats in its public school–based pre-K program via a centralized school choice system. As we detail, this system plays a role in enrollment as families’ placements also rest on their choices. Following Latham and colleagues’ (2021) work on New York City’s universal pre-K (UPK) program, we focus on children’s enrollment patterns by demographic groups, regardless of application and choice behaviors. Identifying patterns of inequities, regardless of their origins, is essential for future work on causes and potential remedies.
We make five specific contributions to the literature on pre-K enrollment. First, we examine enrollment patterns within each of our six focal years and across time, which allows us to understand whether any disparities in enrollment are growing or contracting. Second, we access data on students’ enrollment in community-based programs that do not participate in the centralized school choice system and that are partnering with the district to implement the BPS pre-K model in order to examine these patterns in the context of a new mixed-delivery system for the final two cohorts. Next, we consider how enrollment in a program in a higher-quality school—defined as schools scoring in the top quartile of all BPS elementary settings on third-grade state standardized tests—varies for students from socioeconomically, racially/ethnically, and linguistically marginalized groups and whether those differences have changed over time. Importantly, we recognize that test scores are an imperfect measure of school quality. However, because district leaders in BPS view and use test scores as indicators of quality, we also argue that there is strong policy relevance for examining these relationships in this context. In conducting these analyses, we are able to compare enrollment in the program in general and enrollment in the types of higher-quality settings theorized to offer the strongest educational opportunities in the early years and shown to have sustained impacts on children’s development in the Boston context (Unterman & Weiland, 2020).
Fourth, we consider a key malleable factor potentially affecting students’ enrollment in the program by examining residential proximity to pre-K in general and to a higher-quality school, considering how proximity varies by race/ethnicity, family income, and home language, and testing whether it predicts enrollment for children from different groups. Finally, we use geospatial mapping techniques to highlight variation in enrollment across neighborhoods in Boston across time. As federal, state, and local policymakers continue to push for universal pre-K (UPK) for three- and four-year old students, there is a clear need to learn from existing programs in order to build equitable systems to scale. Findings provide information on factors associated with equitable enrollment in high-quality, early-learning experiences across time in a large-scale public pre-K system.
Variation in Enrollment in Pre-K in Higher-Quality Settings
High-quality, center-based pre-K programming has long been discussed as a policy prescription for directly addressing racial/ethnic, income, and home language–based disparities in children’s scores on assessments of school readiness (Bassok et al., 2016a; Bradbury et al., 2015; Cannon & Karoly, 2007; Reardon & Portilla, 2016). High-quality pre-K as a tool to promote more equitable learning outcomes does have empirical support, with some studies finding that the highest-quality programs yield the biggest impacts (Burchinal et al., 2010) and other work detecting the largest benefits for students from families with lower incomes, racially marginalized groups, and DLLs (Bloom & Weiland, 2015; Cascio, 2021; Phillips et al., 2017; Puma et al., 2010; Weiland & Yoshikawa, 2013). Across studies, Chaudry et al. (2021) find that pre-K programs on average close about 40% of the gap between children from lower- and middle-income households on assessments of reading and math skills at kindergarten entry, and the most successful programs close nearly all of this gap. Yet, these findings are not universal. Other work using nationally representative data has found that all groups of students tend to benefit similarly from pre-K programming (Valentino, 2018) or that White students actually benefit more (e.g., Montrosse-Moorhead et al., 2019). This latter pattern extends to studies examining long-term outcomes as well (e.g., Gormley et al., 2018; Gray-Lobe et al., 2021).
Attention to these differences is especially important because enrollment in pre-K programs among children from marginalized groups has been increasing over time (Cannon & Karoly, 2007; Friedman-Krauss & Barnett, 2020). Yet, the literature has also consistently found that Black and Hispanic children and those from families with low incomes are less likely to be in the highest quality and most cognitively stimulating programs relative to their White and more economically advantaged peers (Bassok et al., 2016a). For example, Bassok et al. (2016b) used neighborhood-level information and data from Georgia’s state pre-K program to show that in communities with higher proportions of non-White families and families with low incomes, state pre-K classrooms consistently rated lower on observed pre-K classroom quality, as measured with the Classroom Assessment Scoring System (CLASS; Pianta et al., 2008). These findings align with earlier research from California (Karoly et al., 2008) and a multistate sample of pre-K programs (Early et al., 2010). Enrolling in pre-K programs in the highest-quality settings—operationalized using both observed measures of pre-K classrooms and indicators of broader school quality like third-grade standardized test scores—is strongly linked to achieving equitable learning outcomes in the short- (Bartik & Hershbein, 2017) and longer-term (Unterman & Weiland, 2020).
Disparities in enrollment in pre-K programs in higher-quality settings have emerged even in UPK systems where all age-eligible children can access publicly funded programming. For example, New York City began implementing UPK in 2014 with over 70,000 eligible students enrolling in the program by 2019 (Reid et al., 2019). Students were assigned to programs via a centralized school choice program (similar to Boston). Latham and colleagues (2021) found that White students and students from families with higher incomes were significantly more likely to enroll in UPK programs with the highest levels of instructional quality, emotional support, and classroom organization, as defined using program-level data on the CLASS aggregated across three years (CLASS; Pianta et al., 2008). Valentino (2018) re-examined the NCEDL-SWEEP data and found that Black and Hispanic students, DLLs, and students from families with lower incomes enrolled in lower-quality programs as measured with the CLASS, ECERS, Emerging Academic Snapshot, and other indicators of process quality—on the order of .30 to .70 standard deviations—than their White, non-DLL, and more economically advantaged peers. Differences in program quality mirrored the magnitude of differences in assessed skills between these groups at the start of kindergarten.
Despite associations between student demographic characteristics—such as family income—and standardized tests (Owens, 2018), we argue that scores on third-grade math and English language arts state tests may also be an important indicator of overall school quality to consider when examining trends in pre-K enrollment (for programs located in public schools where those data are available). Importantly, these measures are typically available on a yearly basis, allowing for examination of how enrollment patterns and access to pre-K programs in higher-quality schools change over time. Reardon (2019) also argues that average third-grade test scores are measures of early educational opportunities in a given context. And there is empirical support for this theory. Zhai et al. (2012) conducted a randomized trial of a pre-K enhancement intervention and followed up with students as they transitioned to K–12 settings. The research team found that impacts only persisted into elementary school for students who attended elementary schools with higher third-grade state test scores. And in an experimental study of the pre-K program in Boston, Unterman & Weiland (2020) similarly found that there were only long-term impacts for children who attended programs in the top quartile of the third-grade standardized test score distribution. They conducted similar analyses examining demographic characteristics of schools—like the proportion of students in the school from families with low incomes—and found no evidence that those characteristics were associated with impact variation. Given this theoretical and empirical evidence base—and district policymakers’ focus on test scores as their key metric of quality—the third-grade standardized test scores before students enroll in the school serve as a proxy for the school’s efficacy from pre-K to third grade in educating students. They also capture the broader average early educational opportunities afforded children in the school and for the types of students attracted to it.
Factors Promoting Equitable Enrollment in Pre-K Programs in Higher-Quality Settings
There is a further need to examine the key structural factors that are associated with more equitable enrollment in pre-K in higher-quality settings in the context of publicly funded, scaled programs. There is clear evidence that all parents prioritize quality when seeking care for their child (Bassok et al., 2018; Crosnoe et al., 2016; Grogan, 2012). But not all parents are able to access the highest-quality programs due to a number of constraints. For example, past work has found that physical proximity is perhaps the strongest predictor of whether families enroll their child in a given early care and education program or not (Connors et al., 2021; Crosnoe et al., 2016), particularly in the context of a centralized school choice process (Glazerman & Dotter, 2017). Social capital theory would suggest that parents’ informational networks are more salient for the pre-K programs located in their neighborhoods, where other families in their social network to whom they are directly and indirectly tied also send their children (Sommer et al., 2017; Warschauer, 2003). In addition to ease of transport, parents’ greater knowledge of these programs increases their comfort with sending their own children there, as compared to a program that may appear higher quality but lacks the same level of information via the local network. Access to transportation may be an additional cost barrier, particularly among families with low incomes (Tang et al., 2012).
Location as a priority choice characteristic may play a key role in the disparities that emerge in the groups of children that are most likely to enroll in programs in the highest-quality settings. For example, in the study by Latham et al. (2021) discussed previously, students who lived in majority Black census tracks were significantly less likely to live within .25 miles of a high-quality UPK program. This study did not detect differences in proximity to high-quality UPK programs for children living in majority Hispanic and majority Asian census tracts but was not able to measure students’ location at a more granular level, such as block group or address. And program location is a key factor that can be intervened on by policymakers and may change over time. Connors and colleagues (2021) found that policies in Chicago focused on intentionally placing full-day pre-K classrooms in neighborhoods with larger proportions of age-eligible children from racially marginalized families, and historically low rates of enrollment in Chicago Public Schools (CPS) pre-K did increase the number of children who enrolled over time.
Ability to pay for pre-K programs is also a clear factor associated with enrollment. As reviewed by Shapiro et al. (2019), there is unequal coverage of free, publicly funded pre-K programs nationwide, affecting the extent to which families with differing levels of income are able to enroll their children. Full-day pre-K for a 4-year-old costs $8,000 on average, which is almost 15% of pretax average family income and >25% of earnings for families in the bottom two income quartiles (Noss, 2014). Only about 31% of income-eligible 3- to 5-year-olds in the United States are served by Head Start, and capacity in state- and locally funded public programs varies considerably (Friedman-Krauss & Barnett, 2020).
Other research on the topic of pre-K choice has examined how parents’ preferences for different types of early care and education vary by race/ethnicity, family income, and linguistic background. For example, mothers with higher levels of education are more likely to enroll their young children in center-based pre-K (Greenberg, 2011), whereas parents of DLLs are more likely to prefer relative care (Sandstrom & Gelatt, 2017). Other work has found that families in neighborhoods with higher immigrant populations and those with lower average incomes are less likely to enroll in center-based pre-K (Liu & Anderson, 2012). Some have hypothesized that these preferences are a function of these families having stronger social networks and enrollment in friend, family, and neighbor care (e.g., Brandon, 2004; Suárez-Orozco & Suárez-Orozco, 2009; Takanishi, 2004) as well as concerns about safety (Bandy & Moore, 2009).
The Boston Public Schools pre-K Program and Enrollment in High-Quality Early Learning
The BPS district offers a unique opportunity to explore patterns of enrollment in pre-K (and pre-K in higher-quality schools) across a recent time period. The BPS district is well-known across the country for offering a full-day, free pre-K program to all age-eligible four-year-old children living in the city. The program consists of two evidence-based curricula: an adapted version of Opening the World of Learning (Schickedanz et al., 2005), which is a language and literacy curriculum that includes a social-emotional skills component in each unit, and Building Blocks (Clements & Sarama, 2007), an early mathematics curriculum that also promotes language development by requiring children to explain their mathematical reasoning verbally. Until the 2012–2013 year, the model was implemented solely in public schools, co-located with later elementary school grades. It then expanded to include a total of eleven partner community–based organizations by 2016, supported by funding from the federal pre-K development grant program (Hofer et al., 2018) before beginning the move to a fully universal model in 2019 by partnering with several additional community-based providers across the city (Guerrero-Rosada et al., 2021). Prior to the move to UPK, however, the public school pre-K program had the capacity to serve about 2800 students total across its 81 programs, or about 60% of the students who eventually would enroll in the city’s public kindergarten program. Thus, although all age-eligible children in the city could apply to the program, the city did not have sufficient capacity to serve all applicants during the study period (Weiland et al., 2020).
After establishing positive short-term impacts of the program (Weiland & Yoshikawa, 2013), Weiland & Unterman used an experimental lottery-based design to examine the impacts of the BPS pre-K program on state test scores, grade retention, and special education in third grade, for the 25% of all pre-K applicants who applied to oversubscribed programs and were randomized in or out of the program. This study detected no average impacts of the BPS pre-K program for this subgroup on these third-grade outcomes relative to the highly served comparison group (Weiland et al., 2020). Importantly, however, further work considering heterogeneity of treatment impacts found that there were substantial lasting effects for children who were able to enroll in pre-K in the highest-quality schools, operationalized as those schools scoring in the top quartile of third-grade state test scores (Unterman & Weiland, 2020). Winning a spot in a school in the top quartile of the test score distribution also substantially increased the likelihood that students would remain enrolled in that high-quality elementary school setting through third grade (and likely beyond). Important questions remain about which children are able to enroll in the BPS pre-K program in general as well as the pre-K programs in the highest-performing schools.
Key to this work as well is to consider how changes in the enrollment process may have affected patterns of enrollment for different groups across time. Prior to the 2014–2015 school year, children were able to rank up to 10 public pre-K programs and were not restricted by their choices. For schools that were ranked highly by many students and were oversubscribed because they had more applicants than available slots, students received priority for living within a walk zone of the school and for having a sibling at the school. This process changed in fall 2014, with the district removing the walk zone priority and providing parents with a list of the 10 schools located closest to their home to rank in order of preference. Importantly, given concerns about equity, this process was adjusted if needed to ensure that every student had at least two higher-performing schools—operationalized as those scoring in the top quarter of the distribution on state standardized tests—that they were able to rank on their list. If needed, those additional schools were identified from outside the pool of the physically closest schools as an approach to preserve equitable access to higher-performing settings. The district itself uses test scores as their primary indicator of quality in this case and provided information on third-grade test scores to parents for ranking their choices (Josette Williams, personal communication, September 19, 2022). The list also included information on how the schools ranked in terms of overall quality, measured as a combination of past academic performance, school climate, culturally responsive teaching, and diversity, among other factors (personal communication, Josette Williams, March 16, 2022). The original goal of this adjustment in the enrollment process was to promote greater equity in accessing higher-performing schools. Prior to the change, students from families with higher incomes had a greater ability to choose schools because they could transport themselves there and deal with constraints like lack of free aftercare and availability of hours. To date, there has been no empirical investigation into how the policy change may have influenced equitable enrollment across time.
The Current Study
The current study leverages data from 2012–2013 through 2018–2019 on students who applied to the BPS pre-K program and/or eventually enrolled in BPS public school kindergarten—and were thus eligible to attend the public pre-K program—to address the following research questions:
To what extent does enrollment in BPS pre-K and enrollment in a program in a higher-quality school (defined in our study as schools in the top quartile of third-grade standardized tests for that year) differ by children’s race/ethnicity, family income, and dual language learner status? How, if at all, did any of these differences change between 2012 and 2018?
How does residential proximity to a BPS pre-K program and a program in a higher-quality school differ by children’s race/ethnicity, family income, and dual language learner status? How, if at all, did any of these differences in proximity change between 2012 and 2018?
How does residential proximity to a BPS pre-K program and a program in a higher-quality school predict enrollment in those same programs for students across this time period? And how do those associations vary by children’s race/ethnicity, family income, and Dual Language Learner status?
Findings aim to highlight key disparities in enrollment in pre-K in the context of a well-regarded, scaled public program working to expand access to programming for children from marginalized groups.
Method
Participants
The full sample for the current study consists of 29,355 students who applied to pre-K in a BPS public school between 2012–2013 and 2017–2018 or enrolled in kindergarten in a BPS public school between the 2013–2014 and 2018–2019 academic years and would have been eligible based on age (four years old by September 1 of the coming academic year) to attend the public BPS pre-K program in the year prior to starting kindergarten. 2 We restrict our main analyses to N = 22,469 students within this group who have complete data on whether they enrolled in BPS pre-K or not, and whether they enrolled in a program in a higher-quality school or not, allowing for direct comparability across all models. Within this sample—which is our best attempt to capture as many age-eligible students as possible—55% (N = 12,332) did enroll in BPS pre-K for at least one day, while 45% (N = 10,137) did not.
Our approach excludes any age-eligible students in Boston who never interacted with the public school system and instead attended private school or were homeschooled. However, the study sample is representative of the students in Boston who may be most likely to enroll in the public pre-K program given the opportunity, as indicated by their interest in public pre-K or kindergarten.
In addition, this analysis focuses on enrollment in the district’s public school pre-K program, including partner community–based organizations that implemented the BPS model in 2016–2017 and 2017–2018. The study does not uniquely account for enrollment in any other community-based, Head Start, or private pre-K or community-based programs associated with BPS before 2016–2017. This is important to note because the large majority of children who did not attend the public pre-K program likely did enroll in some other type of formal pre-K in the year prior to kindergarten (Weiland et al., 2020). Indeed, work by Shapiro et al. (2019) examining students who eventually enrolled in BPS kindergarten during the 2008-2009 and 2009-2010 school years found that although half did enroll in BPS pre-K, 17% enrolled in private pre-K, 17% attended Head Start, 2% attended a non-BPS public option, 3% enrolled in family daycare and only 10% did not enroll in any form of center-based pre-K. More detail on the counterfactual is included later.
As illustrated in Table 1, 33% of the children in the analytic study sample were Black, 18% White, 40% Hispanic, 8% Asian, and 2% identified as being another race or multiracial. About 71% of students across years were eligible for free or reduced-price lunch and 49% were dual language learners. Children were five and a half years old (SD = .30) on September 1 of the kindergarten year. Students in the analytic sample were demographically representative of the full population of students who applied to BPS pre-K and/or enrolled in BPS kindergarten (see full comparison in Appendix G).
Demographic Characteristics of Students in Analysis Sample

p < .001, **p < .01, *p < .05.
Setting
Application to the BPS pre-K program is open to any age-eligible child in the city regardless of income or demographic factors. To enroll, children need only turn four years old by September 1 of the academic year. In the years examined in the current study (the 2012–2013 to 2017–2018 academic years), the program was mostly based in the public schools (N = 81 total) but also expanded to include a total of eleven partner community–based organizations (CBO) by 2016–2017. 3 At least one teacher in every CBO classroom implementing the BPS pre-K model had a minimum of a BA in early childhood education or a related field. And teachers in partnering CBOs received a pay boost to ensure parity with the entry-level salary of teachers in public school settings. Public school teachers were subjected to the same educational requirements of K–12 teachers (e.g., a master’s degree within five years and grade range certification); CBO lead teachers had to have a BA. The program in both public schools and CBOs offered families a full school day of care (6.5 hours per day), with before- and after-school options available in most schools. pre-K students who lived more than a half mile from school were provided bus transportation following the same policies that were applied to elementary-age children.
Although the BPS pre-K program has been expanding in size since 2005, there were fewer available seats in the program than eligible children for each year examined in the current study (Hofer et al., 2018; Shapiro et al., 2019). For example, including students enrolled in CBOs in 2016–2017 and 2017–2018, 4 the program served an average of 2,825 pre-K students per year, compared with a population of approximately 4,498 kindergarten students who enrolled in BPS elementary schools in each subsequent year. In the public school pre-K system, BPS uses a school choice mechanism to assign children to schools, employing a lottery when demand for seats exceeds supply (see Appendix F for details on school lottery processes, as well as Weiland et al., 2020). Students applying to CBOs do not participate in this centralized process but rather apply to and enroll in CBOs individually and directly. Families can apply to both types of programs. Our analysis focuses on inequities in enrollment regardless of families’ choices. Future work will examine causes of any identified inequities.
Students in the current study sample attended schools located all over the city of Boston (see Figure 1 for school locations in 2017–2018 overlaid on a map of Boston with CBO partner schools included) and enrolled in 84 different schools for kindergarten across the six study years. Eighty-one of these elementary schools offered the BPS pre-K program during at least one year and 84% offered pre-K during all six years of the study. On average, 34% of students in elementary schools offering pre-K were Black, 40% Hispanic, 16% White, 8% Asian, and 2% another race or more than one race. Schools had 68% of students eligible for free or reduced-price lunch and 50% were DLLs.

Locations of BPS Public School and CBO pre-K programs in 2018, by neighborhood racial/ethnic composition.
Counterfactual Pre-K opportunities
Because of data restrictions and the simplification of enrollment forms, we are not able to access student-level information on the pre-K experiences of children who did not apply for or enroll in the BPS pre-K program. However, we are able to gain some understanding of their likely experiences from concurrent sources of data. In the years prior to our study (2008–2009, 2009–2010), Shapiro et al. (2019) reported that of the children who did not apply to the BPS pre-K program, about 32% attended another private program, 36% attended Head Start, 22% did not attend pre-K at all, 7% enrolled in family daycare, and 3% attended a charter program. We were also able to access Quality Rating and Improvement System (QRIS) data from the MA Department of Early Education and Care (EEC) on all licensed center-based programs serving four-year-olds during the final two years of our study—2016–2017 and 2017–2018. These QRIS ratings were not available before then. The more than two-thirds of non-BPS pre-K applicants who attended private and Head Start programs were likely to be enrolled in one of the programs with QRIS ratings. EEC ratings for those two years averaged 2.10 (SD = .56, range 1–4). Quality was low to moderate but did vary substantially with about 20% of programs receiving ratings of 3 or 4. Work done in community-based organizations in Boston during the early period of this study has also found that classroom and instructional quality in general was lower than the observed quality in the public school BPS pre-K program (Yudron et al., 2016). Taken together, these data suggest that children enrolled in BPS pre-K likely experienced higher instructional quality than children who did not enroll in or apply for the program.
Data
We accessed the majority of the data for this study from the Boston Public School district’s Office of Data and Accountability. These data included schools’ locations, whether schools implemented the public pre-K program and during which years, school-level demographic characteristics, de-identified student-level characteristics including geocodes as proxies for students’ home locations, and student-level information on pre-K and kindergarten application and enrollment. We accessed census data and information from the American Community Survey (ACS) to describe the neighborhoods where students lived and to identify where the schools in the study were located. Next we describe the data that we used to operationalize study variables.
Student school assignment and demographic characteristics
The BPS district provided de-identified information on students who applied for and enrolled in a public pre-K program between 2012–2013 and 2017–2018 and all children who applied to and enrolled in kindergarten between 2013–2014 and 2018–2019. These data sets included information on whether each child had applied to the public pre-K program, their choice ranking of public pre-K programs, the school to which they were assigned, whether they enrolled in a school for pre-K and which school, whether they enrolled in BPS kindergarten and in which school they enrolled, and any changes in classroom or school during each year. These data also allowed the team to identify students who enrolled in a community-based partner pre-K program in the final two study years in addition to those who applied to BPS pre-K but ultimately enrolled in a community-based partner program (N = 94 in the analytic sample from the final two years of the study). The data sets included information on children’s demographic and background characteristics that parents provided when completing enrollment paperwork. The research team used these data to create demographic variables describing students’ sex (female = 1; not female = 0), age (in years), race/ethnicity (binary mutually exclusive indicators for Black, White, Asian, Hispanic, and mixed or other race), dual language learner status (1 = DLL; 0 = not DLL), first language (English, Spanish, or other language), eligibility for free or reduced-price lunch (FRPL) (1 = yes; 0 = no), whether the student had an Individualized Education Plan (IEP) (1 = yes; 0 = no), and whether the child enrolled in a community-based pre-K program. For FRPL and IEP status, which are time-variant characteristics, we used the student’s status from their first BPS year.
Distance to nearest pre-K program and pre-K program in a higher-quality school
We used district administrative data to identify where each study participant lived in Boston who were in pre-K or kindergarten. Because the administrative data were de-identified, we did not have information on each student’s home address. However, the district did provide a “geocode” for each student record, which is an indicator used to narrow the home address of students to a roughly three-block area (average size of 0.06 square miles). To maintain consistency with Shapiro et al. (2019), we took the geocode from the participant’s pre-K-eligible year school records. If the student did not have a BPS school record for their pre-K-eligible year (typically because they did not apply to pre-K), we used their kindergarten school record. Ideally, we would have been able to determine where all students lived in their pre-K-eligible year, given the possibility that families moved to or within Boston between the pre-K and kindergarten years. Although we cannot assess what proportion of non-pre-K applicants moved before kindergarten, we can infer from the proportion of students who have different geocode values in their pre-K and kindergarten years (10%) that a small but non-negligible proportion of students likely moved to or within Boston between the pre-K-eligible year and kindergarten year. 5 Despite this asymmetry in data availability, we chose to use the earliest geocode available because home address influences both priority status in the school assignment process (for the first two study cohorts) and the number of non-BPS options near a child’s home. We return to this issue in our limitations section.
School context and quality data
We accessed data on school context and quality from the district and from publicly available sources. We used school-level information from the year prior to kindergarten enrollment to examine school-level demographic characteristics (% of students from low-income families; English language learners; students who speak a non–English language at home; students with disabilities; male students; and students who are Asian, Black, Hispanic, or White), school size, and third-grade state English/language arts (ELA) and math standardized test scores.
Following Unterman and Weiland (2020), we used the publicly available information on schools’ third-grade standardized test scores to create a binary variable to operationalize higher-quality (1) compared to lower-quality (0) schools within each study year. To do this, we first calculated the average of the percentage of students scoring proficient on the third-grade math and ELA exams. We then assigned the top quartile of these schools a value of 1 and the schools in the bottom three quartiles a value of 0. By calculating this variable within years, we were able to account for changes in the set of higher-quality schools across time. Scores required to be in the top quartile varied across years but ranged from a low of having 42.5% students proficient in math and ELA exams in 2016–2017 to 58% of students proficient in 2013–2014. As summarized in Appendix A, we find some mobility across time in being included in the higher-quality group; 61% of schools were never in the higher-quality group across the six years, 13% were in the higher-quality group for 5 or 6 of the study years, 8% were in that group for 3 or 4 study years, and 18% were included in the group for just 1 or 2 study years. Importantly, there were 12 total schools across all cohorts ever designated by the district as Early Education Centers (EECs) that offered pre-K but did not offer third grade and were originally missing state test data. For these cases, the district provided data on a subset (N = 4) of elementary schools that students from specific EECs would likely feed into. We applied those test score data to the EECs to maintain consistency in data and retain information on school quality for the largest possible sample. Follow-up analysis (see more in Appendix A) revealed that, of those students who persisted in BPS after leaving their EEC, about three-quarters did enroll in their associated feeder elementary school.
As noted in the introduction, we concur that this test score measure of quality is imperfect and likely to be confounded with student demographic characteristics (Owens, 2018). Although we argue that it does represent the educational opportunities available during the pre-K through third-grade period (Reardon, 2019), we also believe it is important to assess whether these test score indicators of school-quality measures are indeed associated with other features of pre-K quality specifically, such as the domains of CLASS (Pianta et al., 2008) or aspects of instructional quality, such as time spent on language/literacy and math instruction (Weiland & Guerrero-Rosada, 2022). We had access to CLASS scores from a complementary, concurrent study (see Guerrero-Rosada et al., 2021) for the 2016–2017 pre-K cohort. We found moderate and statistically significant bivariate correlations between our indicator of being a “higher-quality school” and classroom instructional support (r = .26, p < .001) and emotional support (r = .27, p <.001). We were also able to access measures of school climate—as reported by teachers—for the final two cohorts of the study. Climate measures mapped onto earlier work done in BPS by Rochester et al. (2019). We found moderately large correlations between our indicator of high-quality and school-level supports for diversity (r = .34) and parental engagement (r = .45). There were also smaller correlations between the indicator of quality and school-level emotional support (r = .12), and academic support (r = .14).
In another paper by our team that used the CLASS data, we did not find significant disparities in observed measures of pre-K quality by race/ethnicity, family income, and home language (Guerrero-Rosada et al., 2021). Yet, results from that study also show that pre-K programs in general did not help to close gaps in children’s assessed skills. These results highlight the importance of exploring broader structural factors—perhaps captured by measures like standardized test scores and approximating pre-K through third-grade educational opportunities—and their role in contributing to or diminishing such disparities.
Neighborhood-level data
We used five-year ACS census block group estimates to measure and describe the characteristics of the surrounding neighborhood of kindergarten enrollees. We pulled estimates in accordance with the year students were in kindergarten—that is, cohort 1 (2012-2013) estimates are five-year ACS estimates from 2013. ACS five-year estimates are generated with 60 months of data collected over five years and estimate the average number of people in a given category within a census geography (U.S. Census Bureau, 2020). We decided to use ACS estimates from the year children were in kindergarten and not pre-K primarily because the estimates are generated with data collected for a full five-year period. As such, for 2013 kindergarten enrollees, the estimates reflect the years 2009–2013 (and so on for future years). Because the address data sometimes included kindergarten addresses as a proxy for pre-K, it was appropriate to similarly use information that would include data from both the kindergarten and pre-K year. The ACS estimates are also quite stable across years, so this decision was unlikely to change our interpretation of findings. Census block groups are the smallest area that the U.S. Census Bureau creates estimates for and are generally defined to contain between 600 and 3,000 people (U.S. Census Bureau, 2020). Unlike the decennial census, which counts all persons in the United States in a census year, ACS estimates are generated with a random sample of 3.5 million households and collected on a monthly basis. The five-year estimates are averages of these monthly surveys over the past 60 months. As such, the 2013 five-year estimates reflect polling data from 2009–2013. To describe the neighborhood characteristics of our sample participants, we include indicators of race (Asian, Black, White, more than one race, and other), ethnicity (Hispanic/Latino), and median household income. Appendix B illustrates neighborhood characteristics for students in our sample who did and did not enroll in the BPS pre-K program. We aligned the variables examined with work by Shapiro et al. (2019).
Analytic Approach
Descriptive statistics
We first used descriptive statistics to examine the characteristics of the sample and the extent to which students from each racial/ethnic group, students from families with lower incomes, and DLL students enrolled in BPS pre-K in general and a BPS pre-K program in a higher-quality school compared to students who did not. We also calculated the average distance that students from each of these demographic groups lived from the nearest pre-K program in general. Finally, as illustrated in Figure 1, we created visual maps to illustrate the locations of pre-K programs in general and programs in higher-quality schools across the city of Boston in the last cohort of our sample (earlier years are illustrated in Appendix C), denoting in the maps how locations varied for neighborhoods with different racial/ethnic and socioeconomic compositions in the first and last years of our study. The map for the last year also includes community-based pre-K programs that implemented the BPS pre-K model.
Research question 1. Variation in enrollment for key subgroups and across time
To answer our first research question, we fit a series of linear probability models with clustered standard errors for kindergarten school wherein we modeled each of the two binary outcomes of interest—enrollment in BPS pre-K and enrollment in BPS pre-K in a higher-quality school (coded as 1)—as a function of race/ethnicity (Black, Hispanic, Asian, and Multiracial/other race with White as the reference group); eligibility for free or reduced-price lunch; and DLL status, controlling for child age and gender and indicators for cohort year. As such, differences in enrollment that we observe between groups are conditional on the other characteristics in the model. We used this approach in order to account for the intercorrelation of key demographic characteristics of interest and to isolate the factors that were most strongly associated with patterns of enrollment. As discussed later, we also fit each characteristic of interest in a separate model on its own, only adjusting for child age, gender, and cohort in order to examine whether results were generally consistent across modeling approaches or whether unique findings emerged when we isolated the effect of each demographic characteristic, controlling for the others. Findings are illustrated in Table 2. We also fit all analyses using logistic regressions so that we could interpret findings in odds ratios and probabilities (see Appendix A for results) (Cohen et al., 2003). Finally, we added interactions between cohort effects and indicators for race/ethnicity, DLL status, and eligibility for free or reduced-price lunch in order to examine whether patterns of enrollment changed across time.
Results of Linear Probability Models Examining Associations Between Students’ Race/Ethnicity, Family Income, Dual

p < .001, ** p < .01, * p < .05.
Research question 2. Proximity and enrollment
We then used OLS regressions with clustered standard errors for kindergarten school to model each student’s distance to the nearest BPS pre-K program (first set of models) and program in a higher-quality school (second set of models) on the same set of characteristics as we included in research question 1 analyses. The coefficient on each characteristic thus represents the difference in miles between that particular group and its reference group, controlling for time and the other demographic characteristics in the model. We interacted the indicators for cohort and the dummies for race/ethnicity, eligibility for free/reduced-price lunch, and DLL status to examine whether and how variation in distance to nearby pre-K programs across groups changed over time.
Research question 3. Variation in associations between proximity and enrollment by key subgroups
To combine information from the prior two questions, we fit a final series of linear probability models with clustered standard errors for kindergarten school predicting enrollment in BPS pre-K (first set of models) and enrollment in BPS pre-K in a higher-quality school (second set of models) as a function of all the demographic characteristics of interest, indicators for cohort, and the proximity to the nearest pre-K or nearest pre-K in a higher-quality school (specific to outcome) (we also fit logistic regressions, described later in robustness checks). The coefficient on the proximity variable represents the relation between distance to the nearest program and likelihood of enrollment on average, controlling for time and all demographic characteristics. We then interacted the proximity variables with the demographic characteristics of interest to test whether these linkages appeared to be more or less salient for particular groups of students across the study period.
Results
Descriptive Results
We present results from our initial descriptive analysis in Table 1. With respect to enrollment in any public pre-K program, descriptive differences between enrollees and non-enrollees were fairly small. White students, on average, were overrepresented in the BPS pre-K program by 3 percentage points, whereas Black students were underrepresented by 2 percentage points. Dual language learners and students with IEPs were also underrepresented in the program by 3 and 6 percentage points, respectively. We found larger differences when examining pre-K enrollment in a higher-quality school. On average, students in the sample lived .30 (SD = .18) miles from the nearest BPS pre-K program and .82 (SD = .49) miles from the nearest program in a higher-quality school. Although distance in general was fairly consistent for students from different racial/ethnic, socioeconomic, and linguistic backgrounds, larger differences between racial/ethnic groups emerged for distance to the nearest pre-K in a higher-quality school. The biggest difference was that Black students lived about a quarter of a mile farther away from the nearest program in a higher-quality school than White students.
Figure 1 shows maps of Boston block groups by racial composition and proximity to pre-K programs in 2018. Complemented further by maps in Appendix C (for earlier years and broken out by family income as well), this figure highlights stark Black-White residential segregation as well as a smaller degree of Hispanic and Asian segregation. The map further shows that BPS pre-K programs are clustered in more southern neighborhoods that tend to be racially mixed or predominantly non-White. These neighborhoods are also where children comprise a higher percentage of the total population. 6 Figure 1 denotes programs in higher-quality schools’ programs in red and also illustrates that those settings tend to be located closer to more predominantly White neighborhoods. Adding pre-K programs to existing public schools serving elementary school-aged students appeared to facilitate this even distribution of enrollment. And including community-based partners in 2016 appeared to succeed in offering more equitable access in communities with large proportions of Black residents in particular.
Research Question 1
Results from the first set of linear probability models examining enrollment in any BPS pre-K program revealed that—among all students who applied to BPS public pre-K or kindergarten—Black (γ = −.09, p < .001), Hispanic (γ = −.11, p < .01), and Asian (γ = −.10, p < .05) students were 9, 11, and 10 percentage points less likely to enroll in BPS public pre-K in general than their White peers, adjusting for family income, home language, gender, race, and cohort year. Interestingly, however, dual language learners were actually 5 percentage points more likely to enroll in the pre-K program than their peers, all things equal (γ = .05, p < .01). Enrollment in BPS pre-K was similar for children eligible and not eligible for free or reduced-price lunch and for other race children compared to White children.
In Figure 2, we illustrate patterns of enrollment across the study period by plotting enrollment probability for subgroups using a smoothed line (estimates were created using probabilities from logistic regression results; see Appendix A). The average BPS kindergarten student had a 48% likelihood of enrollment in BPS pre-K in 2012–2013 compared to 62% in 2017–2018. The overall probability of enrollment increased consistently each year as BPS added slots to the public school pre-K program and also included community-based partners. Patterns of enrollment did change across time by group (see Figure 2), with White students’ probability of enrollment increasing steadily across time, compared to Black and Hispanic students who maintained similar levels of enrollment despite overall increases in available slots. There were also changes over time for Asian students where probability of enrollment increased through 2016–2017 but then was reduced.
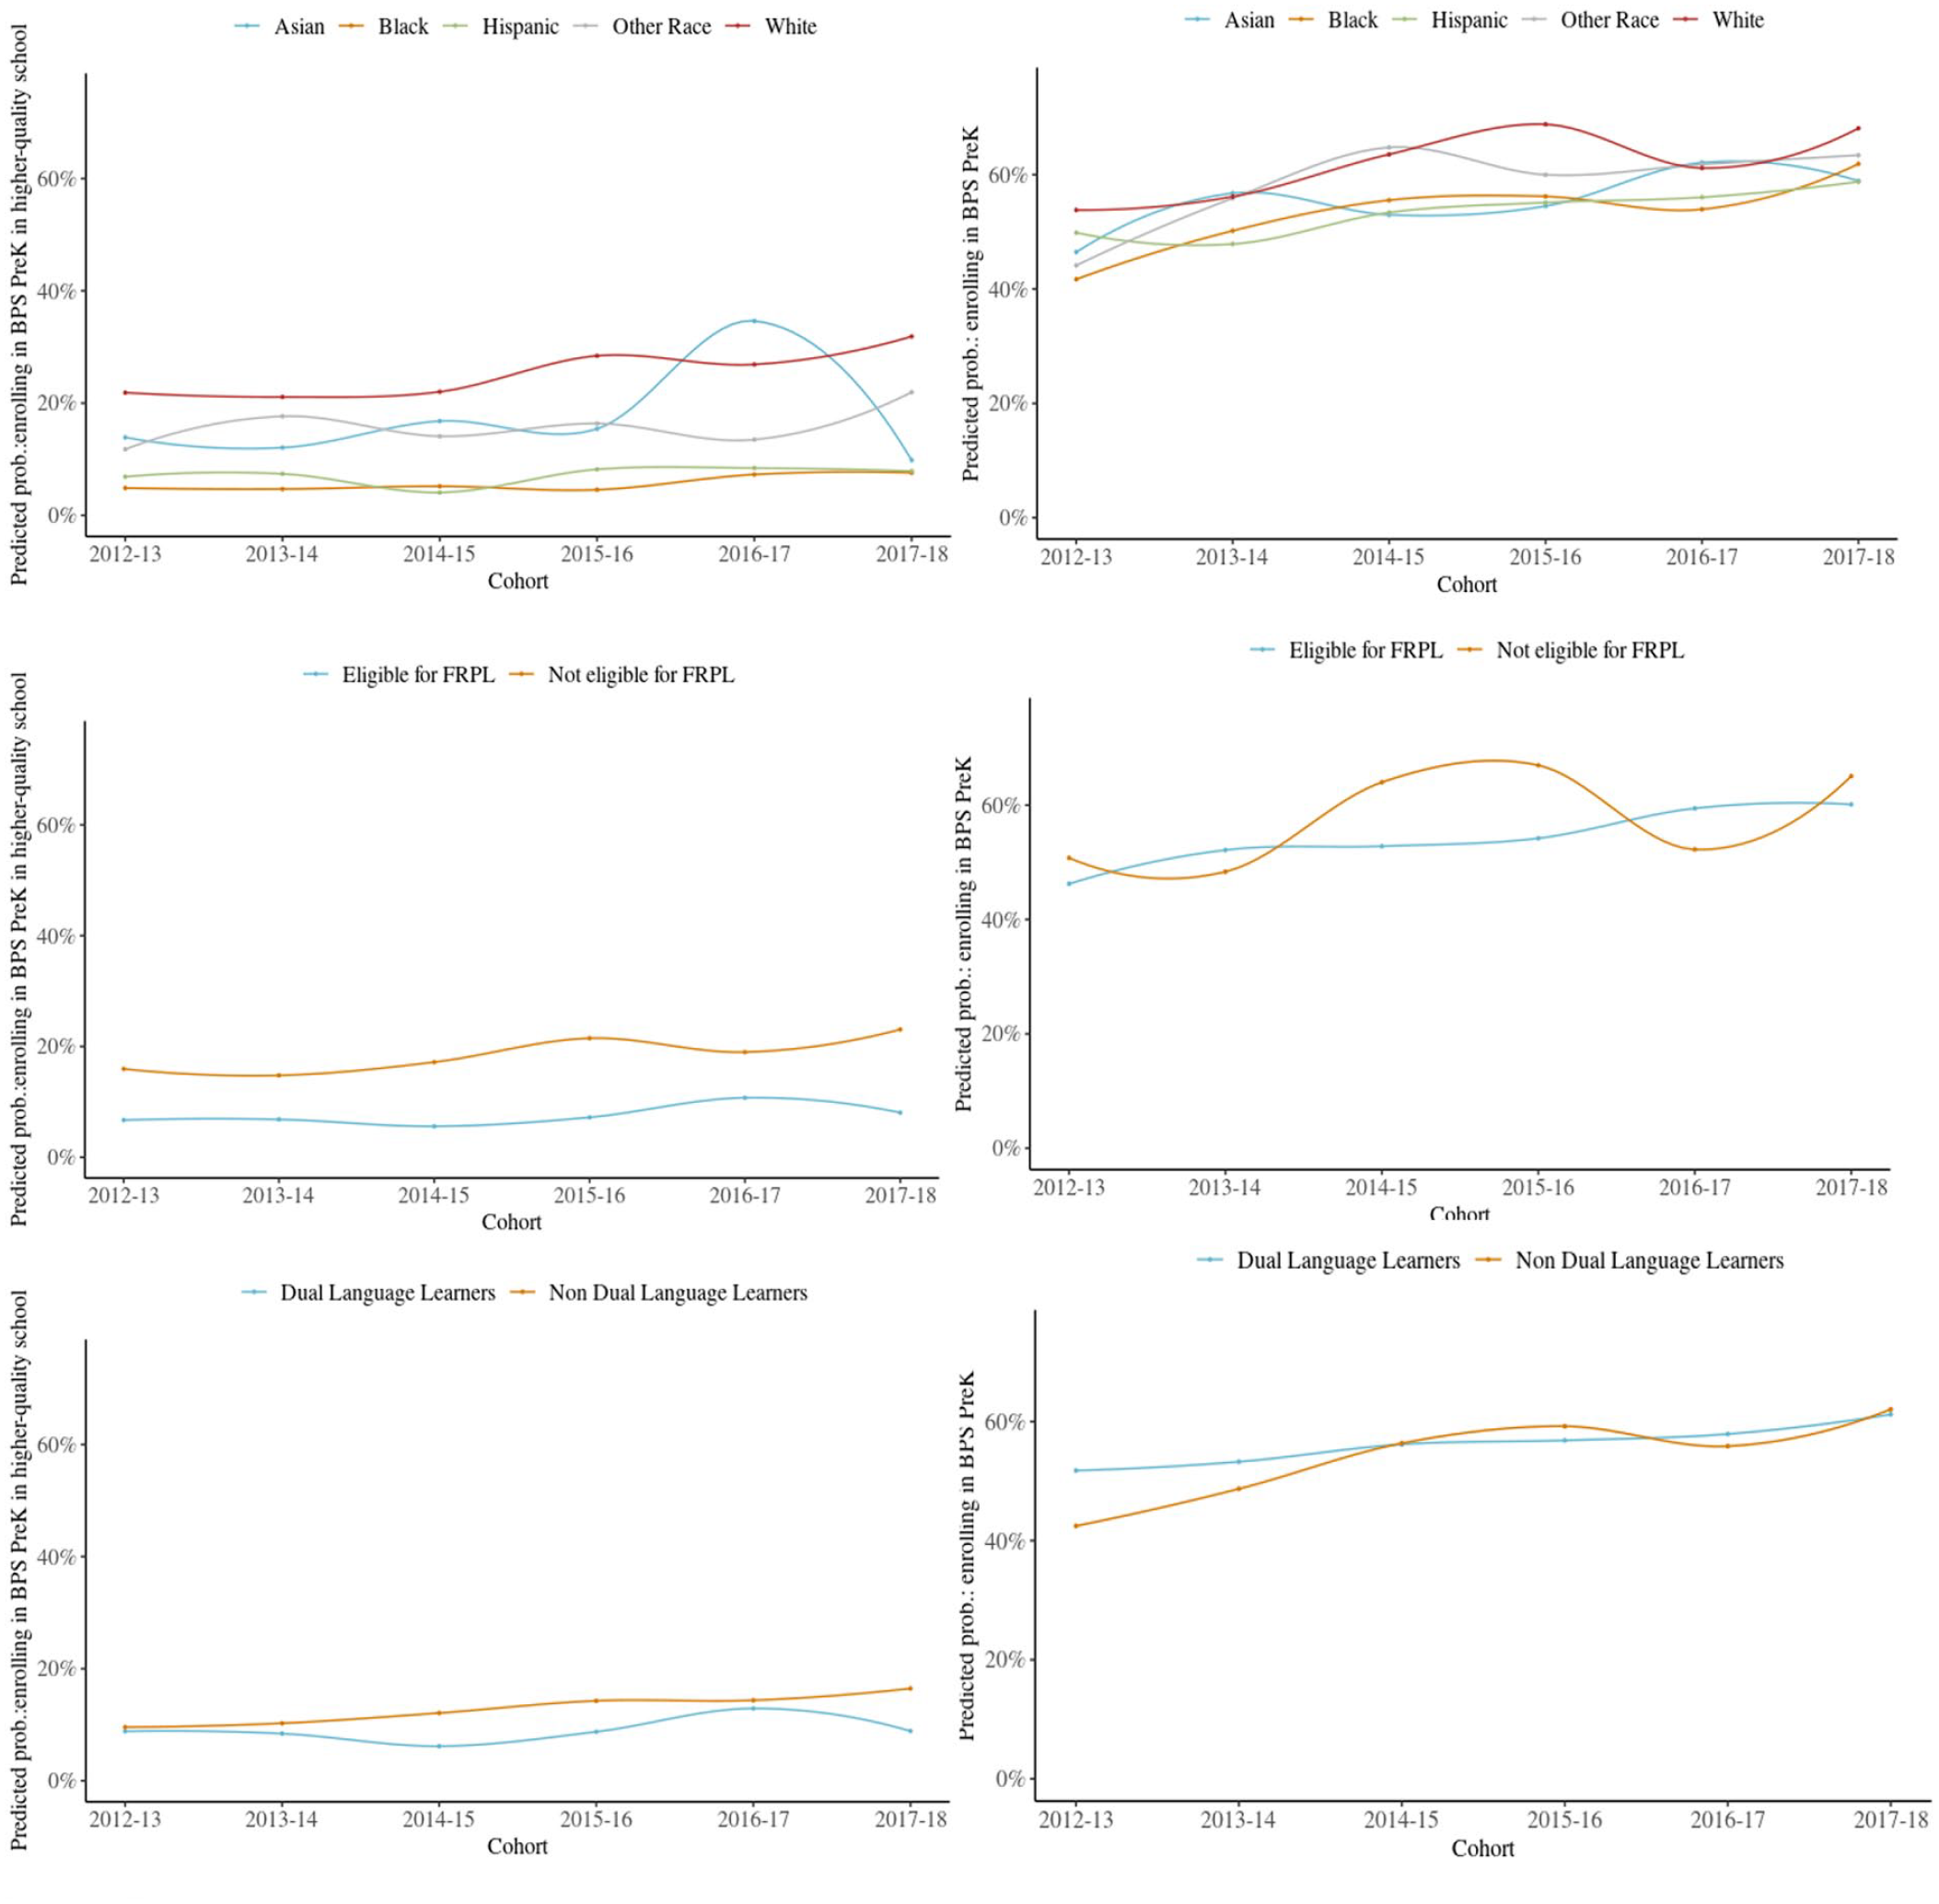
Students’ probability of enrolling in BPS pre-K and pre-K in a higher-quality school by race/ethnicity, socioeconomic status, and dual language learner status between 2012–2013 and 2017–2018.
When we considered enrollment in BPS pre-K in a higher-quality school, we found large differences in enrollment by race/ethnicity. Specifically, Black (γ = −.17, p < .001) and Hispanic (γ = −.15, p < .001) students were 17 and 15 percentage points less likely to attend a BPS pre-K program in a higher-quality school compared to White students. Other race (γ = −.09, p < .001) students were also 9 percentage points less likely to enroll in these programs than White students but the magnitude of the difference was less stark. There were disparities for children eligible for free- or reduced-price lunch compared to their peers with higher family incomes on the order of 5 percentage points (γ = −.05, p < .001), but this difference was smaller than the difference by race/ethnicity. There were no differences in DLL and non-DLL students’ enrollment in a program in a higher-quality school.
And as illustrated in Figure 2, differences in enrollment in pre-K in higher-quality schools between White students and their Black and Hispanic peers grew larger across the study period. As noted previously, BPS did add more schools offering pre-K across the study period, meaning that the probability of any student enrolling in pre-K in a higher-quality school grew from 9% in 2012–2013 to 13% in 2017–2018. Compared to this benchmark, White students had a 22% probability of enrolling in a program in a higher-quality school in 2012–2013 and that likelihood increased to 32% six years later. In contrast, all else equal, the probabilities of Black and Hispanic students enrolling in pre-K in a higher-quality school were 6% and 7%, respectively, in 2012–2013 and only increased slightly to 8% for both groups by the final cohort year. 7
Research Question 2
Results from proximity analyses are presented in Table 3. The unit of distance that we examined is miles. Controlling for other demographics and cohort year, we found some differences across groups in proximity to the nearest BPS pre-K program in general, but they were quite minimal in size. Negative coefficients in these models indicate less distance to the nearest school compared to the reference group. On average, Black (γ = −.03, p < .05) and Hispanic (γ = −.05, p < .001) children lived .03 and .05 miles closer, respectively, to a BPS pre-K program than their White peers. Students eligible for free- or reduced-price lunch (γ = −.03, p < .001) also lived .03 miles closer to the nearest BPS pre-K. These distance measures remained similar across time (see Figure 3).
Associations Between Students’ Race/Ethnicity, Socioeconomic Status, Dual Language Learner Status, & Distance in Miles to Nearest BPS Pre-K and Nearest Program in a Higher-Quality School

p < .001, ** p < .01, * p < .05.
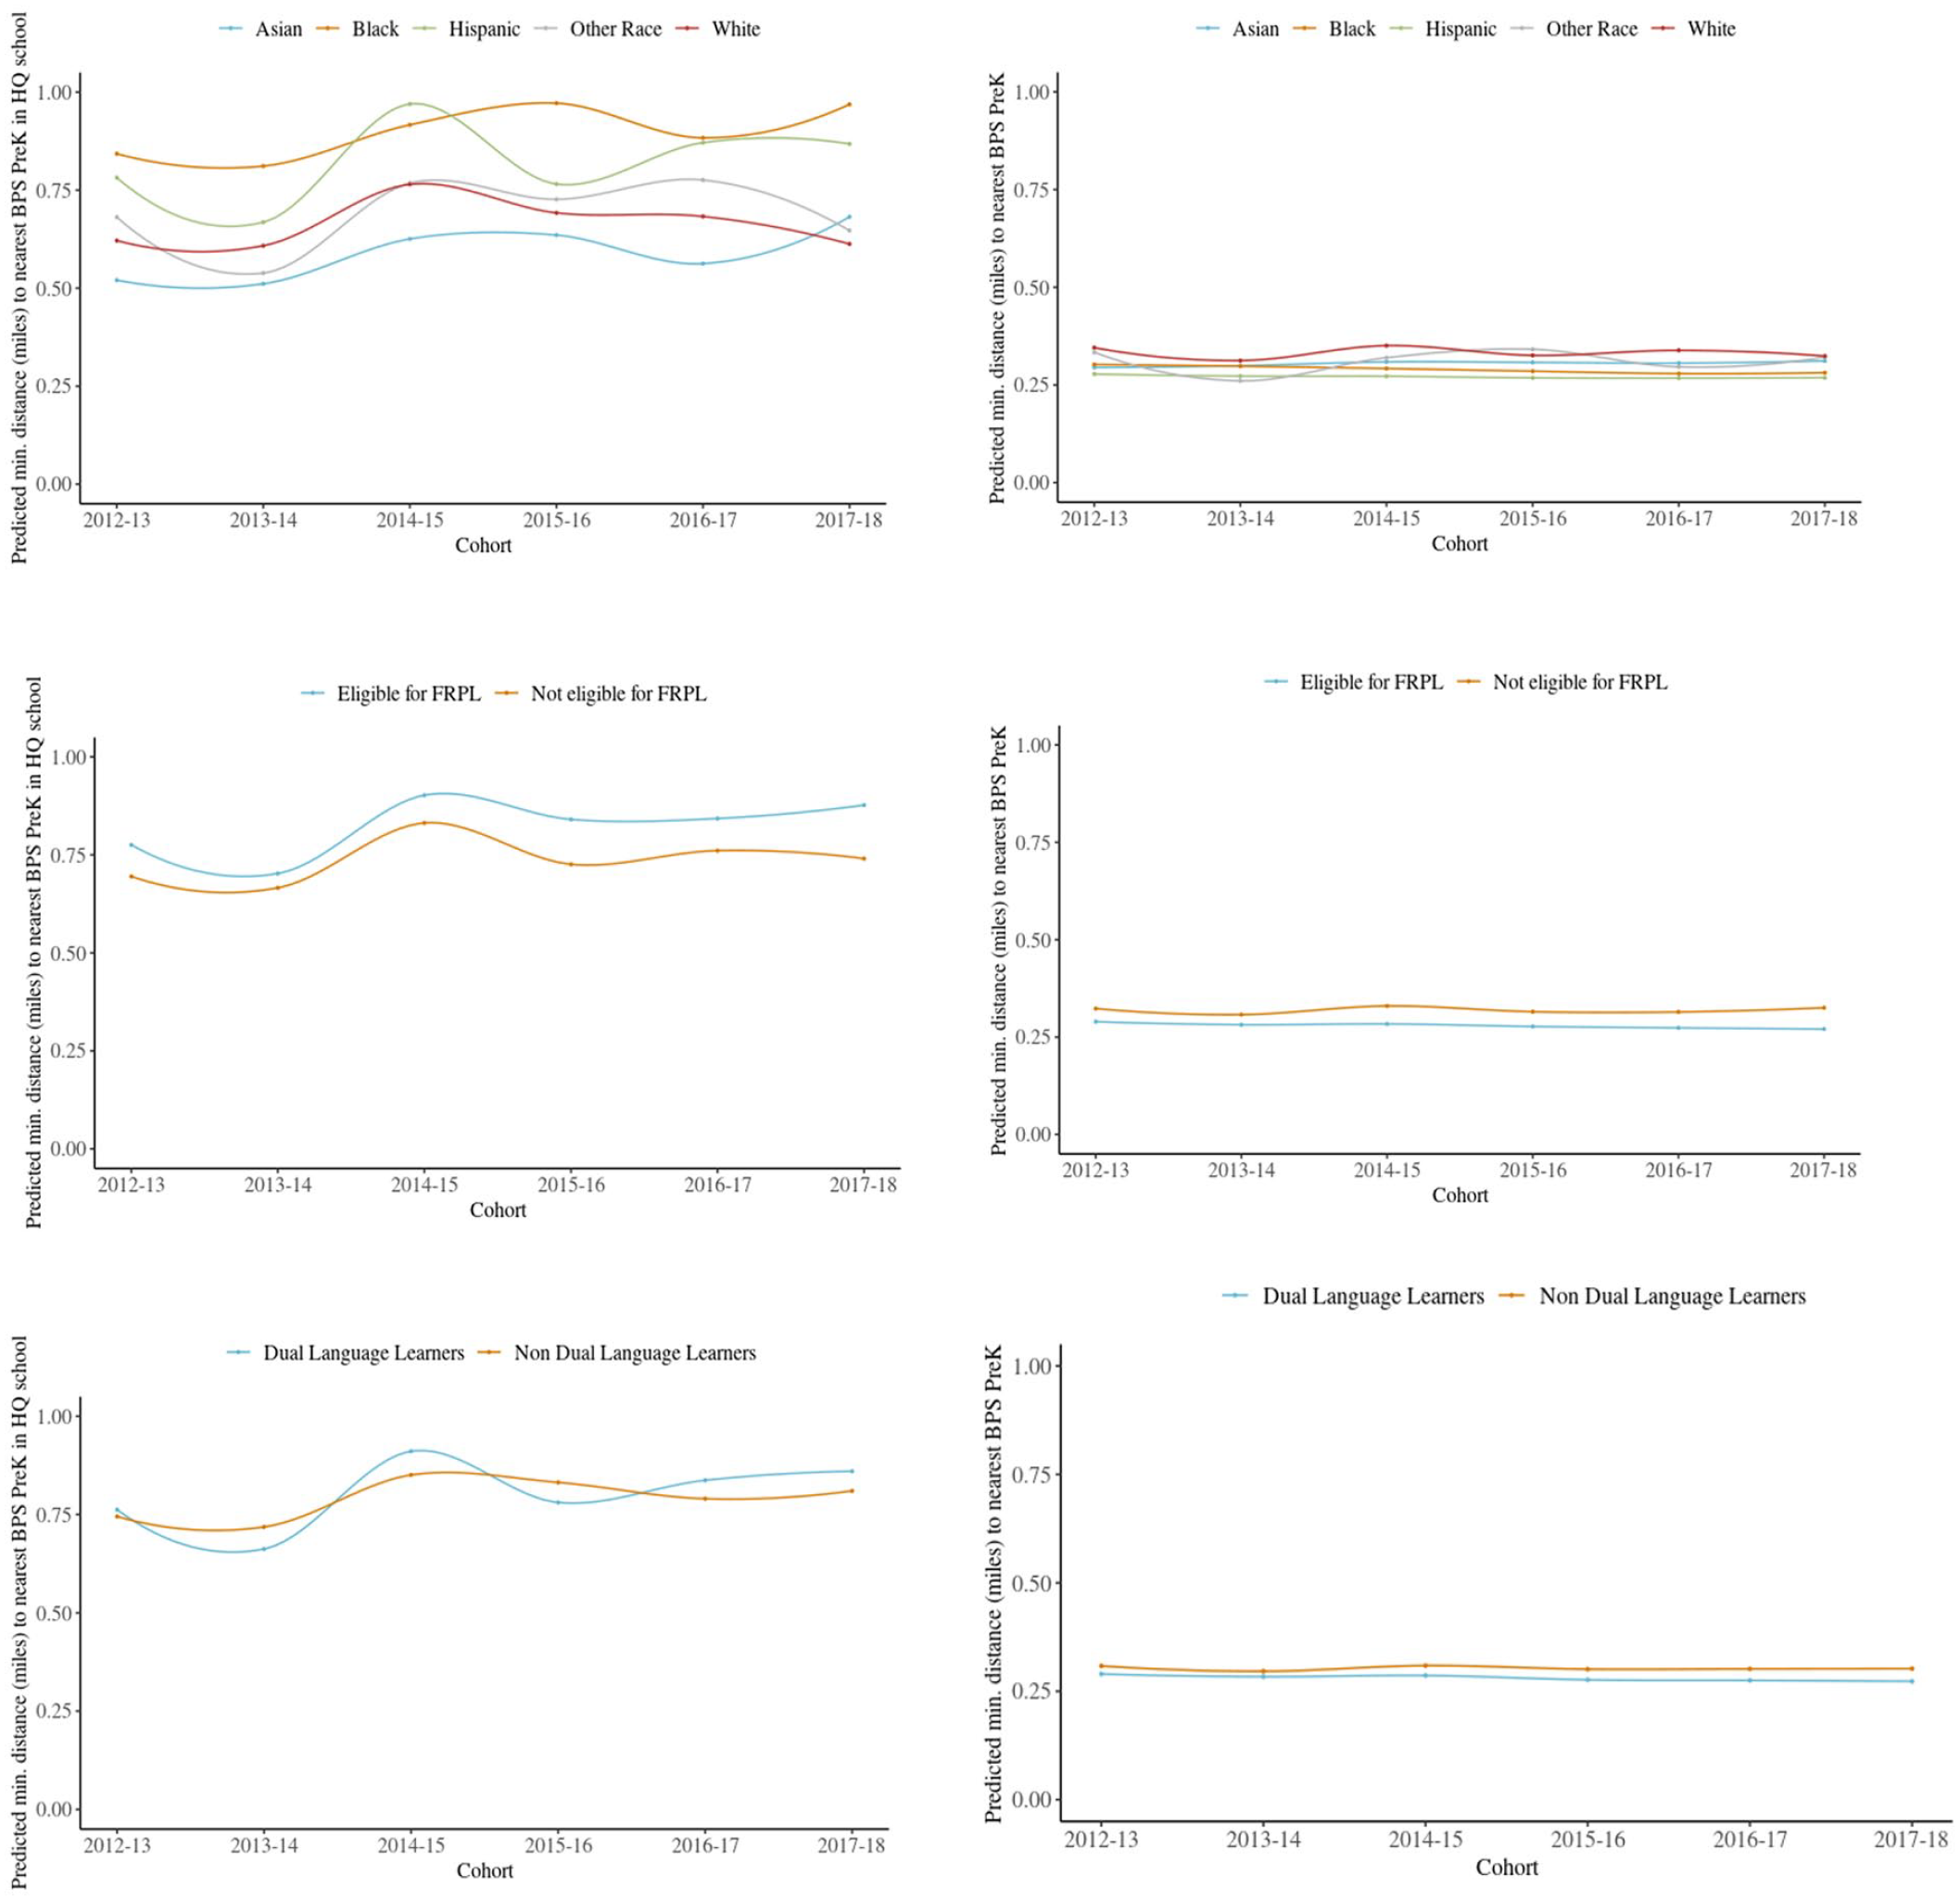
Students’ distance in miles to nearest BPS pre-K program and pre-K in a higher-quality school by race/ethnicity, socioeconomic status, and dual language learner status between 2012–2013 and 2017–2018.
We found a different picture when we examined proximity to the nearest pre-K program in a higher-quality school. In those models, we found that, after controlling for family income, home language, age, and gender, Black and Hispanic students lived about .22 miles (p < .001) and .13 miles (p < .001), respectively, farther away from the nearest pre-K program in a higher-quality schools than White students. Asian students, in contrast, lived about .10 miles closer (p < .05) to the nearest pre-K program in a higher-quality school than White students. There was also a statistically significant difference in distance by DLL status, but that was fairly small—.03 miles (p < .05)—and likely less meaningful. There were some changes in distance across time with Black and Hispanic students living slightly farther away from the nearest BPS pre-K program in a higher-quality school over time (see Figure 3).
Research Question 3
In the final set of models, we considered the role of proximity in explaining enrollment across diverse groups of students. Results are illustrated in the bottom panel of Table 2. With respect to enrollment in any BPS pre-K program, we found no association between distance and likelihood of enrollment across the sample. Moderation analyses, however, revealed that this pattern was moderated by race and ethnicity. Compared to White students, when Black and Hispanic students lived farther away from any BPS pre-K program they were actually slightly more likely to enroll in one (see Appendix D, Figure 1).
In contrast, we found that students who lived farther away from the nearest program in a higher-quality school were less likely to enroll in a program in a higher-quality school (γ = −.09, p < .001), all things equal. Translated into probabilities, students who lived .25 miles from a pre-K program in a higher-quality school had, on average, a 16% probability of enrolling in a program in a higher-quality school, whereas students who lived 1 mile away only had a 6% probability of enrolling. Moderation analyses revealed that this association was stronger for DLLs compared to non-DLLs but again not in the expected direction. Rather, when DLL students lived farther away from a program in a higher-quality school they were more likely to enroll (see Appendix D, Figure 2).
Exploratory Analyses
We also considered the intersectionality of our demographic characteristics and how being a member of multiple marginalized groups could further disadvantage students. Results from these follow-up analyses are included in Appendix E. Although family income and DLL status on their own did not have large associations with enrollment in BPS pre-K after controlling for race/ethnicity (as we reported previously), these characteristics considered together did reduce the likelihood of enrollment in both BPS pre-K and a program in a higher-quality school in the sample.
Robustness Checks
For the sake of brevity, we report the full details of all our robustness and follow-up checks in Appendix A. We examined how sensitive results were to modeling each demographic characteristic on its own, fitting models in the full sample, fitting logistic regressions rather than linear probability models for RQs 1 and 3, and examining application to BPS pre-K as the outcome rather than enrollment, among other checks. We also conducted follow-up analyses related to mobility and choice sets. The pattern of results was consistent across robustness checks, with no major changes to substantive findings.
Discussion
As policymakers continue to debate whether and how to expand access to pre-K, our findings demonstrate that inequities in enrollment deserve ongoing policy and research attention. Data from our study period—during which time the BPS district was increasing the number of available pre-K slots in both public school and community-based settings—showed that Black and Hispanic students in particular were less likely than their White peers to enroll in the BPS pre-K program, with disparities growing across the study period. However, we initially did not find differences in enrollment by family income and also found that DLLs in the more recent cohort were more likely to enroll than non-DLLs across time. Results were consistent when we considered application—rather than enrollment—as our outcome and used alternative modeling approaches better aligned with prior work in this context (Shapiro et al., 2019). 8
Findings from this more recent cohort suggest that race and ethnicity—and being Black or Hispanic specifically—are the strongest predictors of enrollment in BPS pre-K for our study period. Like most urban settings in America, Boston is a racially and ethnically segregated city with likely structural differences in both formal and informal information across neighborhoods (DiPrete et al., 2011). Even when public programs are located in largely Black and Hispanic neighborhoods, families may not prefer their local BPS pre-K program if there are better-known alternative options in the community (Chaudry et al., 2011). Moreover, given a history of systemic racism in Boston, it is also quite possible that Black families in particular may fear racism and discrimination against their young children in the public school setting and prefer delaying interactions with that system until the start of formal elementary school (Posey-Maddox et al., 2021). In contrast, in neighborhoods with majority White families, the system could work in the opposite direction via informal networks and little fear of discrimination (Reardon, 2016). The centralized school choice system too might present administrative burdens or hurdles that are more difficult to navigate for some groups of families compared to others.
When comparing our results to earlier work on applications to Boston pre-K (Shapiro et al., 2019), it is also important to consider variation across the study periods and how disparities in application and enrollment appeared to change over time. In the 2008–2009 and 2009–2010 school years that were the focus of prior work, the current version of the BPS public pre-K program was fairly nascent, having just launched a set of systematic activities to enhance quality at scale in 2005. In 2013, Weiland and Yoshikawa (2013) reported large, positive, short-term impacts on children’s skills that garnered significant attention not just in Boston but across the country (Rochman, 2013). The data for the current study come from the period after the program had developed a national reputation as a high-quality provider. It is possible that a disproportionate number of White families had better information via their social networks on how to enroll in the program—and programs in higher-quality schools—during this more contemporary period.
Variation in Enrollment in Pre-K Programs in High-Quality Schools
Importantly, disparities in BPS pre-K enrollment by race and ethnicity were not nearly as large as the differences we observed in enrollment in pre-K programs in higher-quality schools by race/ethnicity. This is particularly important in light of prior work finding causal evidence that enrollment in pre-K in one of those schools (relative to a control group heavily served by other care options) has sustained impacts on children’s academic outcomes through third grade (Unterman & Weiland, 2020). In the somewhat mixed literature on differential effects of pre-K programs, there are some examples of studies finding small or null effects for children from marginalized groups even when students from other groups continue to benefit (Gormley et al., 2018; Montrosse-Moorhead et al., 2019). Variation in enrollment in pre-K in a higher-quality school may be part of the explanation for this inequitable variation. Admittedly, our indicator of quality in this study is limited, as it uses standardized test scores to operationalize quality (Owens, 2018). These test score metrics reflect the achievement levels of third-grade students rather than the children enrolling in pre-K in this study. Even so, we argue that these test scores are policy relevant for decision-makers in this context and are shared as indicators of pre-K program quality in the information parents receive to rank schools. And our own correlational work has found that test scores are moderately associated with the widely used measures of pre-K process and instructional quality reported on in similar studies (e.g., Latham et al., 2021).
Relatedly and critically, the city did change the process for applying to the program during our study period. Whereas in the earlier application process students received priority for living within a walk zone of the school—but were able to apply to any school in the city—the district revised the process for the 2014–2015 school year, removed the walk zone priority, and allowed parents to rank the ten schools located closest to their home. This process was adjusted if needed to ensure that every student had at least two higher-performing schools (based on standardized tests) that they were able to rank on their list. For example, if a students’ initial list of ten schools did not include any higher-performing options, they received the option to rank two additional schools that were identified to be higher-performing. This list also included information on how the schools ranked in terms of overall quality, measured as a combination of academic performance, school climate, culturally responsive teaching, and diversity, among other factors (personal communication, Josette Williams, March 16, 2022). Although these changes were implemented to help provide parents with more information to rank their school choices, it is possible that they affected other decision-making processes. For example, our work showed that Black and Hispanic families tended to live slightly farther away from pre-K programs in higher-quality schools than their White peers. As such, the lists these Black and Hispanic families received to rank likely included fewer schools in the higher-quality group. And the pre-K programs in higher-quality schools that were in that group were located farther away from the homes of families in those groups, compared to White families. This is particularly true if those higher-quality schools had to be added on to their initial list. Thus, changes to the application process may have contributed to growth in enrollment disparities across time, among a range of other factors. More rigorous research—possibly leveraging strategies like an interrupted time series design—may be able to shed light on this possibility. That work must consider parents’ choice sets, the percentage of higher-performing schools they received to rank, and how changes in choice sets affected enrollment for diverse groups of students.
Importantly, given more limited choice sets, families may have decided not to apply to any public pre-K program at all if there were alternative care options in the neighborhood, such as community-based pre-K providers and Head Start programs, that they preferred. Although all families are primarily motivated to choose pre-K programs for their children that are high-quality and developmentally appropriate (Bassok et al., 2018; Grogan, 2012), there are also key issues that affect families’ pre-K enrollment decisions that have led to cities’ adoption of mixed-delivery systems—where programs are implemented in both public schools and community-based partner organizations—when implementing public programs. And this is the approach that BPS also began implementing in fall 2019 in the first year of their Universal Pre-K Expansion. CBO programs may better meet some families’ needs, preferences, and values and increase the likelihood of a cultural and/or race/ethnicity match between the family and program staff, a factor shown to promote children’s learning outcomes in rigorous causal studies (Blazar & Lagos, 2021; Gershenson et al., 2018). CBOs may offer families access to a greater range of wraparound care options and may allow them to enroll their child at the same school as their younger sibling(s) and to have their children attend a center that is most conveniently located for them In building a stronger universal model that delivers high-quality programming to children in both public school and CBO settings, districts like BPS can address these selection issues but also work to build equitable early-learning opportunities across systems. Key to this is avoiding what has been described as a “two-tier system” where CBOs receive fewer supports and offer lower-quality programming than their public school counterparts (Weiland et al., 2022).
Residential Proximity and Pre-K Enrollment
Finally, we found that proximity to any BPS pre-K program was fairly equitable across our study period with respect to race/ethnicity, family income, and DLL status. As illustrated on our map of all programs in Figure 1, programs were allocated throughout the city in all neighborhoods. Adding pre-K programs to existing public schools serving elementary-aged students appeared to facilitate this even distribution of access. And including community-based partners in 2016 also appeared to succeed in offering more equitable access in communities with large proportions of Black residents. Likely because of the broad range of offerings that the district has invested in and all students’ general proximity to programs, we did not find that distance was a statistically significant predictor of enrollment in any BPS pre-K program when we took the whole sample into account.
Interestingly, however, we did find that Black and Hispanic students were more likely to enroll in the program if they lived farther away. This pattern could again reflect the information that parents had access to about the program and the alternative care options that they had in their community. For example, prior work by Shapiro et al. (2019) and Weiland et al. (2020) found that there was a wide range of alternative care options in BPS, and the large majority (87%) of students who enrolled in BPS kindergarten did attend some type of nonresidential care in the year prior. Students in heavily served communities likely have many alternative options in addition to their local public pre-K program (although they may be lower quality, as demonstrated by our review of QRIS scores for community-based programs in the final two cohorts of the study). In contrast, the public pre-K option—which offers busing to students who live more than half a mile away—may be more attractive to families who have fewer local, feasible, alternative choices (Wei et al., 2021).
Importantly, this pattern was not reflected when we examined enrollment in BPS pre-K in a higher-quality school. In contrast, we found that students who lived closer to programs in higher-quality schools were substantially more likely to enroll in them. This finding likely reflects the endogeneity discussed previously between schools’ standardized test scores and the students who select them. Even so, it raises critical implications for equity, as it demonstrates strong associations between key structural factors that are not easily malleable—residential proximity in this case—and patterns of pre-K enrollment. Even as the district has made significant investments to enhance program quality across all early-learning programs (e.g., McCormick et al., 2020), it is extremely challenging to ensure equitable enrollment in the highest-quality settings in the context of a pre-K program that is universally available to all age-eligible children. Strategies to address disparities in access to high-quality early learning—such as busing, mandatory integration, and preference priorities—are politically challenging to implement yet may hold promise for promoting more equitable learning opportunities for children from marginalized groups (Billings et al., 2014).
Limitations
Despite the strengths of this study, there are a number of key limitations. First, this is a descriptive study and none of the associations should be interpreted causally. Second, we used the measure of school quality in this study based on prior work demonstrating its salience for understanding lasting impacts of BPS pre-K (Unterman & Weiland, 2020). However, as we noted previously, test scores on their own are a proxy for the skills and socioeconomic backgrounds of the students attending the school and may not reflect the full range of domains that make a school higher quality (Owens, 2018). At the district level, we did not have access to observational information on children’s classroom microsystems. The study would have benefited from more nuanced measures of process and instructional quality (Weiland & Guerrero-Rosada, 2022) as well as equitable instructional practices (e.g., Curenton et al., 2020). Moreover, given the focus on test scores as indicators of quality, it is difficult to disentangle whether the benefits of BPS pre-K in the higher-quality settings are more likely to persist due to higher-quality subsequent learning experiences or the general quality of the pre-K program itself. Capturing more nuanced information at scale on the quality of early learning distinct from the quality of future learning environments is needed to better explore these pathways and determine the factors most critical for supporting equitable learning and development across time.
Third, we are explicitly focused in this paper on enrollment in the BPS pre-K program implemented in public schools and by community-based partners. This paper does not include data to describe the types of programs that children who did not enroll in the program attended. Although we have some understanding of the QRIS ratings of programs in the community, and have earlier data on nonapplicants’ enrollment decisions, having this information would perhaps have provided more context related to families’ decision-making—particularly on their enrollment in alternative care options—and future work will examine these data more thoroughly. And relatedly, we were only able to capture whether students did enroll in partner CBOs for the final two cohorts of the study. Fourth, this paper does not examine nuances in families’ choice sets and rankings of programs. Having established growth in disparities in enrollment in the pre-K programs in the highest-quality schools, further research is needed to better understand how parents make rankings and choices and how that affects ultimate enrollment patterns. Key to this will also be exploiting the policy change that occurred in 2014 affecting how parents are able to rank their preferred schools and understanding more rigorously how that may have contributed to disparities in enrollment. Next, we did rely on kindergarten enrollment data to capture our possible pool of applicants. We lacked access to information on all possible applicants. And finally, although this investigation is generalizable to the BPS school district, it is not necessarily reflective of other large urban districts with public pre-K programs. As the country seeks to expand universal pre-K, prioritizing work examining equitable enrollment in high-quality pre-K is of paramount importance.
Implications
Although findings from this paper are descriptive, they help to identify key considerations for policymakers. First, it is important to better understand why there are clear racial/ethnic disparities in the students who do and do not attend the BPS pre-K program and who gains access to the highest-quality settings. Our work uncovered that racial/ethnic disparities were actually growing over time and primarily after the introduction of new policies for ranking school preferences. Such findings highlight that these policies may be undermining the district’s goals to ensure equitable access to higher-performing settings not just in pre-K but throughout schooling. Indeed, gaining access to a pre-K spot in a higher-quality school guarantees students a spot in that setting for the duration of elementary school, and experimental evidence has shown sizable impacts of winning a spot in a given pre-K program and continued enrollment in that elementary school setting (Weiland et al., 2020). More experimental research on this topic is needed but results highlight the need for policymakers to examine the implications of these enrollment policy changes for future years.
Findings also point to the importance of continuing to expand the high-quality public school program to a broader range of community-based settings that primarily serve students from racially/ethnically marginalized groups. Boston has begun moving to a fully universal pre-K model by implementing a mixed-delivery system through partnerships with community-based programs. Ensuring that quality in these new partner programs is on par with or exceeding quality in the public schools will be of paramount importance. And exploring policy interventions to improve quality in existing public school settings serving a disproportionate number of Black and Hispanic students is clearly needed to address these gaps and move toward a more equitable system. More broadly, findings broadcast the importance of all districts doing early childhood work to examine how investments in universal pre-K—designed as a tool to promote equity—are or are not achieving that goal.
Supplemental Material
sj-docx-1-ero-10.1177_23328584231168867 – Supplemental material for Going the Distance: Disparities in Pre-K Enrollment in Higher-Quality Schools by Geographic Proximity, Race/Ethnicity, Family Income, and Home Language
Supplemental material, sj-docx-1-ero-10.1177_23328584231168867 for Going the Distance: Disparities in Pre-K Enrollment in Higher-Quality Schools by Geographic Proximity, Race/Ethnicity, Family Income, and Home Language by Meghan McCormick, Mirjana Pralica, JoAnn Hsueh, Christina Weiland, Amanda Ketner Weissman, Anna Shapiro, Samantha Xia, Cullen MacDowell, Samuel Maves, Anne Taylor and Jason Sachs in AERA Open
Footnotes
Funding
The author(s) disclosed receipt of the following financial support for the research, authorship, and/or publication of this article: the research reported here was conducted as a part of a study funded by the Robert Wood Johnson Foundation. Setting up the study’s initial infrastructure was supported by Arnold Ventures and through grant R305N160018 – 17 from the Institute of Education Sciences to MDRC with subcontracts to the University of Michigan and the Boston Public Schools. The opinions expressed are those of the authors and do not represent views of the Institute or the U.S. Department of Education.
Supplemental Material
Supplemental material for this article is available online.
Notes
Authors
MEGHAN MCCORMICK is a senior research associate at MDRC, 200 Vesey St. 23rd Floor, New York, NY 10281,
MIRJANA PRALICA is a research associate at MDRC, 200 Vesey St. 23rd Floor, New York, NY 10281,
JOANN HSUEH is the director of the family well-being and children’s development policy area at MDRC, 200 Vesey St. 23rd Floor, New York, NY 10281,
CHRISTINA WEILAND is an associate professor in the Marsal Family School of Education and (by courtesy) Ford School of Public Policy at the University of Michigan, 610 East University Avenue, Ann Arbor, Michigan 48109-1259,
AMANDA KETNER WEISSMAN is a research statistician developer at SAS EVAAS,
ANNA SHAPIRO is an associate researcher at the RAND Corporation,
SAMANTHA XIA is a research associate at MDRC, 200 Vesey St. 23rd Floor, New York, NY 10281,
CULLEN MACDOWELL is a research analyst at MDRC, 200 Vesey St. 23rd, Floor New York, NY 10281,
SAMUEL MAVES is a research assistant at MDRC, 200 Vesey St. 23rd Floor, New York, NY 10281,
ANNE TAYLOR is a senior data analyst at the Education Policy Initiative in the Gerald R. Ford School of Public Policy at the University of Michigan, 735 S. State St., Ann Arbor, MI 48109,
JASON SACHS is the executive director of the department of early childhood for the Boston Public School District, 2300 Washington St. Roxbury, MA 02119,
References
Supplementary Material
Please find the following supplemental material available below.
For Open Access articles published under a Creative Commons License, all supplemental material carries the same license as the article it is associated with.
For non-Open Access articles published, all supplemental material carries a non-exclusive license, and permission requests for re-use of supplemental material or any part of supplemental material shall be sent directly to the copyright owner as specified in the copyright notice associated with the article.