
Abstract
Education has faced unprecedented disruption during the COVID pandemic. Understanding how students have adapted as we have entered a different phase of the pandemic and some communities have returned to more typical schooling will inform a suite of policy interventions and subsequent research. We use data from an oral reading fluency (ORF) assessment—a rapid assessment taking only a few minutes that measures a fundamental reading skill—to examine COVID’s effects on children’s reading ability during the pandemic. We find that students in the first 200 days of the 2020–2021 school year tended to experience slower growth in ORF relative to prepandemic years. We also observe slower growth in districts with a high percentage of English language learners and/or students eligible for free and reduced-price lunch. These findings offer valuable insight into the effects of COVID on one of the most fundamental skills taught to children.
Keywords
Introduction
Beginning in March 2020, COVID disrupted virtually every aspect of life. All students missed out on critical learning experiences during COVID, with school being virtual for the remainder of the 2019–2020 academic year (AY) and a mixture of virtual and in person the following year (with substantial variation between school districts). Evidence is accumulating about the lasting effects of the pandemic on students’ academic development (Hamilton & Ercikan, 2022). However, much of this evidence tends to pertain to older children (Kuhfeld, Soland, et al., 2020; Kuhfeld, Tarasawa, et al., 2020; Lewis et al., 2021; Pier et al., 2020; Pier et al., 2021) and to be based on assessments spanning a broad range of academic behaviors that may not have been amenable to at-home use, either because typical standardization and security protocols would be impossible to implement for many conventional school-based standardized tests or because assessments utilized the co-location of the teacher and the student, and adaption to virtual settings may have been challenging. Existing evidence focusing on the reading ability of students in earlier grades (i.e., Kindergarten through Grade 2) tends to examine readiness at a point in time, usually at the beginning of the AY (Amplify, 2021; Curriculum Associates, 2020; McGinty et al., 2021; Ohio Department of Education, 2021). Here, we estimate the impact on younger learners with a specific focus on the growth in their literacy skills throughout an entire AY.
We utilize a novel source of data on a critical reading skill—oral reading fluency (ORF), which measures the number of words correctly read per minute in a given passage or text (Fuchs et al., 2001)—to study the effect of the pandemic on our youngest school-age students, a group who was negatively affected by the disruptive nature of the pandemic, according to existing research (Amplify, 2021; Bielinski et al., 2020; Curriculum Associates, 2020; Huff, 2020; Lewis et al., 2021; Pier et al., 2020). Our analysis of within-person growth complements other analyses that use different designs; given the severity of the COVID disruption to schooling, we argue that evidence derived from a variety of research designs relying on different assumptions is vital. Further, the measure we use has several appealing properties for understanding the effects of the pandemic. As measured here, ORF can be rapidly measured, can be administered remotely to students learning via virtual instruction, and is an important predictor of subsequent reading ability. We briefly discuss the emerging research regarding COVID’s effect on learning before then turning to the specifics of our study.
Background
Given the unprecedented nature of the disruption, numerous studies have attempted to calibrate the pandemic’s effects on education. Evidence suggests that the pace of learning slowed after March 2020 and into the 2020–2021 AY relative to growth in prepandemic years (Dorn et al., 2020a, 2021; Lewis et al., 2021; Pier et al., 2021; Renaissance Learning, 2020). These estimates vary based on the construct measured and the analytic strategy employed. Generally, existing work shows that students’ learning in math has been more negatively affected than their learning in reading (Bielinski et al., 2020; Dorn et al., 2020a; Huff, 2020; Kuhfeld, Tarasawa, et al., 2020; Renaissance Learning, 2020). Many studies also find that the academic trajectories of younger students, particularly those in elementary school, have been more negatively affected than those of their older peers (Amplify, 2021; Bielinski et al., 2020; Curriculum Associates, 2020; Huff, 2020; Lewis et al., 2021; Pier et al., 2020), although some evidence suggests the opposite (Renaissance Learning, 2020).
Perhaps the most concerning findings are related to heterogeneity across student and school characteristics. Existing literature indicates that low-income students (Herold, 2020; Korman et al., 2020) and Black, Hispanic, and Native American students (Dorn et al., 2020a; Korman et al., 2020) have less access to reliable Internet connections and devices at home that facilitate high-quality remote learning experiences. Other learners—English language learners (ELLs), students with disabilities, homeless students, and students in foster care—may not have been able to access remote instruction (Korman et al., 2020), may not have received accommodations to which they were entitled, or may have otherwise experienced increased instability, all of which may have affected opportunities to learn. There are also disparities in modality, as Black and Hispanic students were more likely to be exposed to remote learning than were their White peers: about 70% of Black and Hispanic students were learning remotely at the start of the fall of 2020, compared to 49% of White students (Dorn et al., 2020a). Consistent with these facts, most studies find that the negative impact on student learning is, indeed, greater for students in majority-minority schools (Curriculum Associates, 2020; Dorn et al., 2020a, 2021), Black students (Amplify, 2021; Dorn et al., 2020b; Huff, 2020; Lewis et al., 2021; McGinty et al., 2021; Renaissance Learning, 2020), Hispanic students (Amplify, 2021; Dorn et al., 2020b; Lewis et al., 2021; McGinty et al., 2021; Pier et al., 2021; Renaissance Learning, 2020), American Indian and Alaska Native students (Lewis et al., 2021; Renaissance Learning, 2020), low-income students (Curriculum Associates, 2020; Dorn et al., 2020b; Huff, 2020; Lewis et al., 2021; McGinty et al., 2021; Pier et al., 2020; Pier et al., 2021; Renaissance Learning, 2020), students with lower prior achievement (Pier et al., 2021), students with disabilities (Renaissance Learning, 2020), ELLs (McGinty et al., 2021; Pier et al., 2020; Pier et al., 2021; Renaissance Learning, 2020), and students in rural schools (Renaissance Learning, 2020).
We emphasize a few notable limitations of existing research. One issue is that remote instruction induced missingness from the postpandemic assessment data. Further, this missingness is often concentrated in the most vulnerable subgroups; Black students, Hispanic students, students with disabilities, low-income students, and students with lower prior achievement are more likely to be missing (Dee et al., 2021; Kuhfeld, Tarasawa, et al., 2020; Lewis et al., 2021; Ohio Department of Education, 2021; Pier et al., 2021). This missingness may lead to bias in estimates of COVID’s impact on student learning; in particular, we may be underestimating the impact of the pandemic on student learning. A second issue is the modality of assessments during the pandemic, which were largely taken online and at home. Although some evidence suggests that remote testing in the fall of 2020 had similar properties to in-person testing (Lewis et al., 2021), other results have led to concerns about comparability over time. For example, one study finds that at-home test-takers in Grades 2 through 4 outperformed in-school test-takers (Huff, 2020), potentially suggesting that students may have been receiving help from parents at home. Other evidence (Pier et al., 2020; Pier et al., 2021) suggests surprising results (e.g., a learning acceleration in Grades 8–10 relative to prepandemic years) that have led to speculation that either students could be cheating or there may be significant differences over time in which students are being assessed remotely (thus leading to questions about the comparability of the measures derived from different assessment modalities). Another issue is that much of the research focuses on older students, specifically those in Grades 3–8 (Kuhfeld, Soland, et al., 2020; Kuhfeld, Tarasawa, et al., 2020; Lewis et al., 2021; Pier et al., 2020; Pier et al., 2021). The research that does include students in earlier grades (i.e., Kindergarten through Grade 2) tends to examine readiness at a single point in time, typically at the beginning of the school year (Amplify, 2021; Curriculum Associates, 2020; McGinty et al., 2021; Ohio Department of Education, 2021). Younger children may have experienced differential impacts relative to older children, and yet relatively limited assessment data are collected for these students, particularly repeated assessments that allow for measurement of growth in reading skills across an AY. A final issue is that the pandemic led to a relaxation of federal and state accountability requirements; to the extent that assessments and curricula are linked (Hamilton et al., 2020), this may have prompted curricular changes. Such changes further complicate inferences associated with COVID-related changes to performance on many conventional assessments used for accountability purposes (e.g., less “teaching to the test” could result in lower student assessment scores because the tested content was not covered as comprehensively).
COVID’s Effects on ORF
This project builds on earlier work focusing on ORF during the spring and fall of 2020 (Domingue et al., 2021). Those data identify distinctive patterns of growth during the early phase of the pandemic relative to prepandemic growth. Growth effectively stopped, especially for second and third graders, in the spring of 2020. However, that period was unique—schools were suddenly closed, giving teachers effectively no time to prepare for virtual instruction and leading to a host of other pressing problems (e.g., meal deliveries) that required substantial attention—and growth in the fall of 2020 was more robust.
Here, we focus on growth through the first 200 days of the 2020–2021 AY, with emphasis on potential heterogeneity in growth across important student and/or environmental features. These data are unique in that they focus on a key skill of interest for younger learners, utilize a measure with high face validity, and allow for analysis of within-person growth, given that students are observed at multiple time points. Because these assessments are also not used for formal accountability purposes, inferences about ORF skills (or other skills not targeted by state-mandated assessments or prior to Grade 3) may be less sensitive to the changing federal and state accountability policies that complicate inferences with state standardized assessments. Further, we are able to probe dynamics of learning during COVID because the assessments are administered continuously as opposed to only at a small number of fixed time points (e.g., fall/spring testing).
Methods
Administration of Literably Assessments
Data are provided by Literably, 1 which provides a measure of ORF. We first discuss how the Literably assessments are used by schools and districts before providing details on the measurement process. Literably contracts with schools and districts. Implementation can be either broad (i.e., focusing on all students in a system) or targeted (i.e., focusing on narrower sets of learners), but most clients attempt to assess all children in certain grades. The data are collected in a rolling fashion so that teachers and district personnel are able to obtain measures for individual students at any time. This continuous data collection becomes apparent in Figure 2. However, many districts apply an internal schedule and attempt to have all students assessed at, for example, the beginning, middle, and end of the AY.
For our purposes, we emphasize two facts about the administration that are relevant for our analysis. First, as data are collected continuously, we model growth as a function of time. Second, data are collected in an ad hoc fashion. Given that systems may choose in some cases to focus on specific learners (e.g., children struggling with reading skills) rather than all learners, we focus on within-person growth in reading skill.
Measuring ORF
We use measures of ORF to study the pandemic’s effect on reading skills. ORF is measured as the number of words correct per minute (WPM), or the number of words read correctly divided by the elapsed time. This ability is a key indicator of developing reading ability. If the decoding or word recognition skills required for accurate oral reading are underdeveloped, the reader will not be able to activate the intended meaning of what they have read. If these skills are not automatic, the reader may expend so much cognitive capacity on decoding that they are unable to attend to meaning.
In the Literably system, a student reads aloud from a passage displayed on an electronic device (e.g., tablet or laptop). The tablet records the reading and transmits the audio file, typically a length between 60 and 120 seconds, to an offsite scoring system. Literably uses human ratings and automated speech recognition to score these recordings. Previous work on the human-rater component suggests that this approach can be used to generate scores that are appropriately predictive of downstream outcomes (e.g., standardized test scores; Literably, 2018; Townsend & Domingue, 2018). These measures are ideal for examining the effects of the COVID pandemic because they are easily and rapidly deployed and could be administered at home in a manner highly comparable to their administration in school; in contrast, many other measures of ORF require active administration of the measure by the teacher and were thus challenging to implement following the cessation of in-person schooling.
To assess alignment of our ORF growth estimates with previous estimates, we compare yearly growth (from pre-COVID AYs) on the Literably ORF measure to other established norms of ORF growth (see Table 1). In general, ORF tends to grow quickly in early elementary school and then slows down, eventually leveling off in later grades. We compare differences between fall and winter median scores by using data from established benchmarks (Hasbrouck & Tindal, 2006) to estimated growth over 4 months 2 from the basic specification discussed in Equation 1. Growth in Grade 2, especially in the fall of 2018, is similar in the Literably data to the reference norms. Comparisons in Grade 1 are not possible, given the lack of Grade 1 data in the reference norms. Differences are more pronounced in later grades, as Literably data tend to exhibit less growth. This result could be due to differences in the measures (e.g., the specific text passages used), but it could also be due to other differences that have greater analytic implications. For example, students who are being assessed in the Literably system in those later grades may be those students exhibiting lower levels of growth. These differences are an important justification for our utilization of models that focus on within-person growth, as described below.
Estimated growth (in WPM) for first 4 months of AY
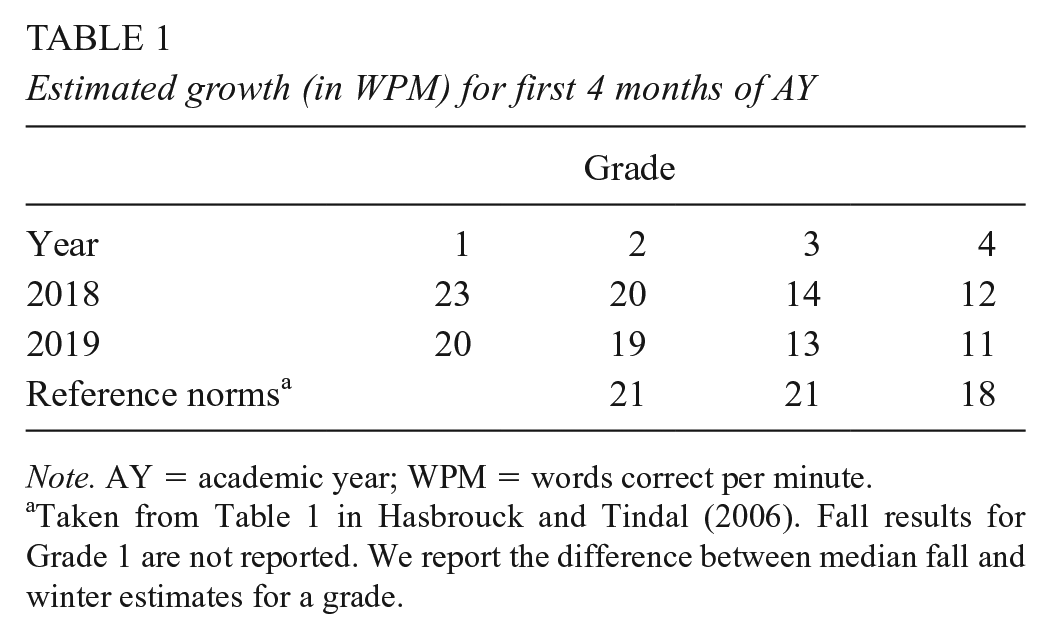
Note. AY = academic year; WPM = words correct per minute.
Taken from Table 1 in Hasbrouck and Tindal (2006). Fall results for Grade 1 are not reported. We report the difference between median fall and winter estimates for a grade.
Data
We emailed districts that used the Literably system and described the proposed research; districts were given an opportunity to opt out. We use data from districts that did not opt out. Table 2 shows information on the districts. We can characterize the districts’ level of academic achievement and socioeconomic status (SES) by using data from the Stanford Education Data Archive (SEDA; Fahle et al., 2021). Achievement in SEDA is calculated based on aggregated test scores from the state’s standardized testing program. SES data are a composite based on American Community Survey data on family income, levels of unemployment and education, poverty rates, and proportions of families receiving benefits and headed by a single mother. The districts in our data are a relatively advantaged set of districts; the mean level of academic achievement in these districts is .45 standard deviation (SD) units above the national average, and the mean SES is .67 SD units above the national average. Although the levels are higher on average, these districts do span a range of levels of achievement and SES; in Figure 1, we compare the distributions of achievement and SES across the various districts. The relative advantage of the districts is apparent in the shift of the density curves relative to the histogram, but we also note substantial overlap. Although they are generally more advantaged in terms of achievement and SES, the districts used in our analysis also contain more Black and ELL students than the national average and had higher levels of closure of physical facilities (based on reduced levels of in-person visitors observed at schools in January 2021; Parolin & Lee, 2021) than did U.S. districts as a whole.
Means of district-level variables for analytic sample (standardized relative to 11,328 schools in nation-level data based on merged SEDA and closure data)

Note. ELL = English language learner; FRL = free and reduced-price lunch; SEDA = Stanford Education Data Archive; SES = socioeconomic status.
Closure data from Parolin and Lee (2021); closure in January 2021.
SEDA data from Fahle et al. (2021). Not all districts in the Literably data could be found in SEDA (N = 10 districts from the full analytic sample of N = 72).

Comparison of distributions of academic achievement and SES for all districts (blue) and districts in analytic sample (red and black; see Table 2).
We focus on data from Grades 1–4 in the first 200 days (i.e., roughly September through early March) of the 2018–2019 through 2020–2021 AYs. Note that scores from the 2019–2020 AY should largely be unaffected by COVID, given that 200 days from September 1, 2019, is March 19, 2020, roughly 1 week after the initiation of large-scale shutdowns across the United States. Across those years, we have 376,489 ORF scores taken from 78,429 students. We primarily focus on data collected in the 2020–2021 AY. During that AY, we have 189,572 ORF measures collected from 52,280 students. Students take more ORF measures in younger grades. In 2020–2021, for Grades 1–4, we have an average of 4.2, 3.9, 3.5, and 3.0 measures per student, respectively. By way of contrast, students in the prepandemic 2019–2020 AY were tested at similar levels; in that AY, we have averages of 4.2, 4.0, 3.4, and 2.9 measures per student in Grades 1–4, respectively.
Data collection during the 2020–2021 AY is illustrated in Figure 2. This figure shows that data are being collected continuously across the year rather than at a few isolated points in time (as may be the case with, for example, benchmark testing systems; Kuhfeld, Tarasawa, et al., 2020). Note that there is some increase in ORF scores across the year, but, crucially, there may be systematic differences in which students are taking ORF measures at different points in the year, thus further motivating the within-person analytic approach we consider below.

Data collection through the 2020–2021 AY. Darker blue regions emphasize periods of heavier data collection (via smoothScatter in R). Red lines are LOESS lines showing changes in expected score as a function of when measure is taken.
Data are taken from a variety of districts; in particular, there is a large growth in districts represented in the data over time. In 2020–2021, data came from 60 districts, whereas in previous years, no more than 35 districts were represented. The sample is unbalanced; in 2020–2021, some districts provide a few hundred ORF scores, whereas others provide a few thousand (IQR: 354-3453).
Analysis
Our approach to analyzing growth is based on identifying expected changes in ORF score as a function of time after controlling for person and book (i.e., the specific text passage a student is asked to read aloud) fixed effects. Specialized approaches are needed to estimate models with large numbers of fixed effects. Here, we use the R package lfe (Gaure, 2013). To estimate growth in ORF for a given cohort, we first calculate the time since the start of the school year, which we assume is September 1 of a given AY. For student

We emphasize that the inclusion of fixed effects for person
In other cases, we allow for nonlinear effects of time. To account for potential nonlinearities in student growth in ORF, we use B-splines (Hastie et al., 2009).
3
As used here, B-splines are a map from

In such cases, we do not focus on estimates of
Results
Overall Growth During the 2020–2021 AY
We first examine growth in 2020–2021 relative to prior years by using Equation 1; results are in Table 3. To ensure that results are not driven by a change in the kinds of districts using Literably in 2020–2021, we first analyze only those districts observed pre-COVID. We see generally reduced levels of growth in 2020 as compared to 2019. The biggest difference is in Grade 2, wherein we expect students to grow over 0.5 WPM/month slower in 2020. Based on the pre-COVID growth rates, this number translates to as many as 40 days of lost learning; that is, students in 2020 would need as many as 40 additional days of skill development to reach the same level of ORF as students observed in the previous year.
Linear growth estimates (WPM/month) for first 200 days of each AY
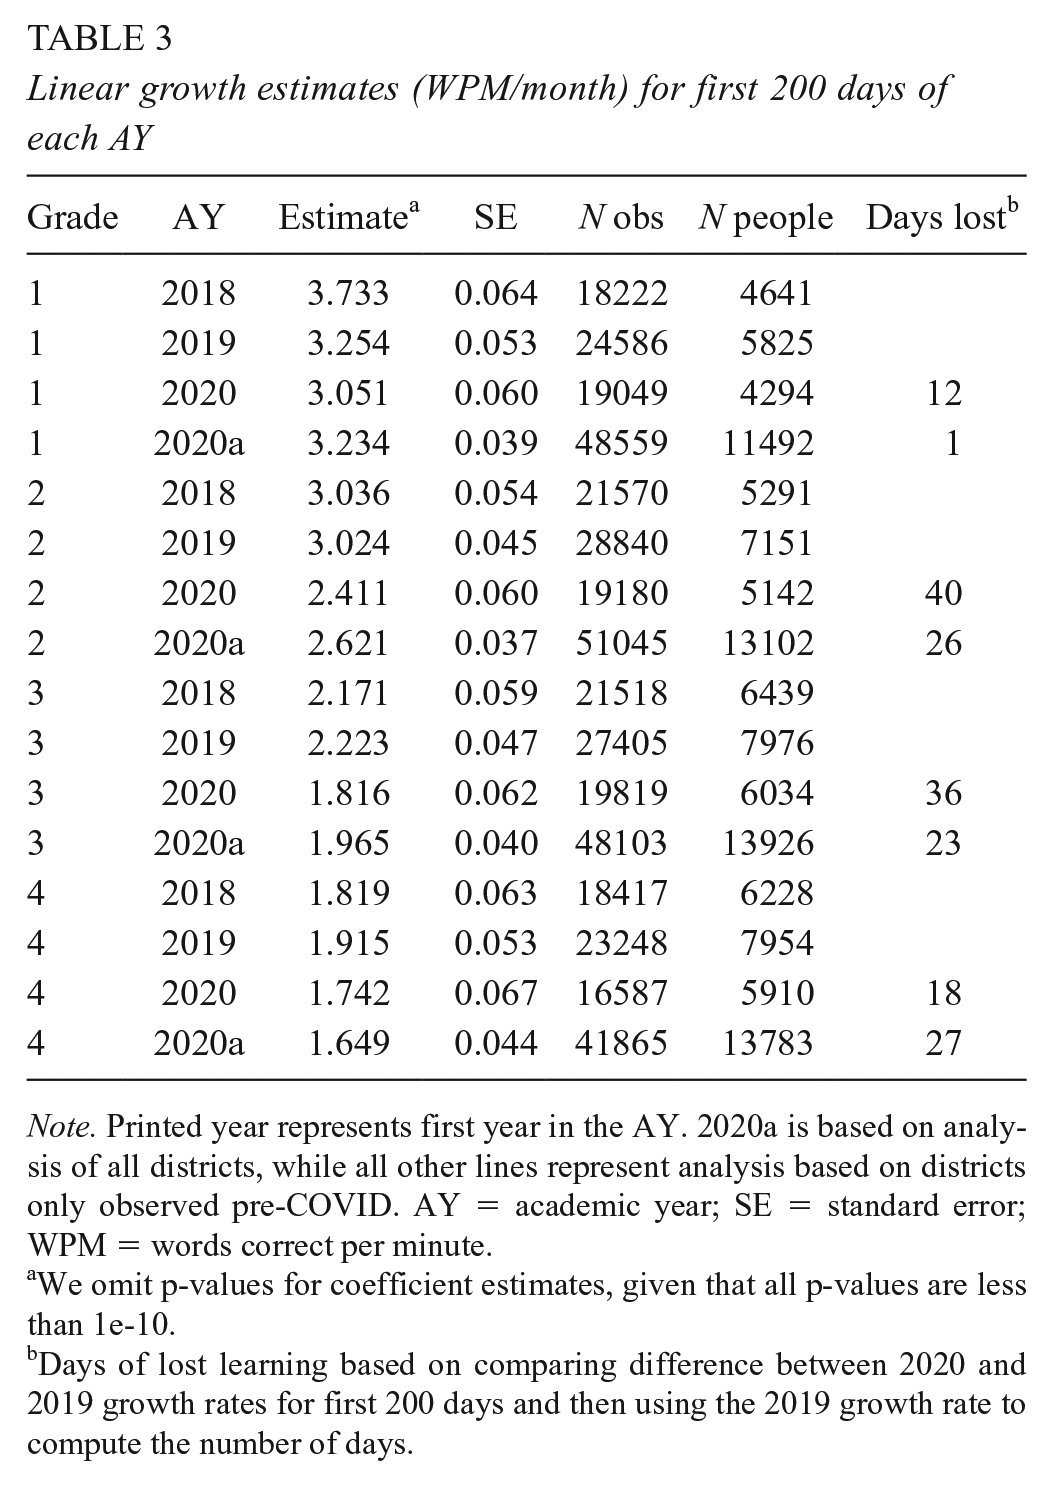
Note. Printed year represents first year in the AY. 2020a is based on analysis of all districts, while all other lines represent analysis based on districts only observed pre-COVID. AY = academic year; SE = standard error; WPM = words correct per minute.
We omit p-values for coefficient estimates, given that all p-values are less than 1e-10.
Days of lost learning based on comparing difference between 2020 and 2019 growth rates for first 200 days and then using the 2019 growth rate to compute the number of days.
As another means of quantifying the effect, note that during the first 200 days of the 2020–2021 AY, second graders were expected to grow by roughly 17.2 WPM, as compared to nearly 21.6 WPM observed in prior years. To benchmark the magnitude of this difference, we conduct a randomization analysis. This analysis is designed to be informative about the level of variation in growth that may have come from randomness alone, which is especially important given that the sample here is not a random sample (thus reducing the credibility of, for example, the standard errors as a means for making such an inference). In this analysis, students from Grade 2 are randomly assigned to the 2019–2020 or 2020–2021 AY. Across 250 iterations of this randomization, we reestimate growth; differences are never larger than 1.8 WPM, suggesting that the observed difference of 4.4 WPM is far greater than differences due to chance alone.
We also report estimates from Table 3 in effect size metrics. We first standardize ORF scores by grade for years for all data collected after 2018 (due to growth in the number of Literably clients after 2018) and rerun analyses focusing on growth in standardized score by day. We compute the expected difference 200 days out for 2019 and 2020 AYs based on these growth rates; we also compute bootstrap standard errors by resampling people with replacement. For Grades 1–4, these differences translate to effect sizes of .055 (SE = .026), .157 (.025), .099 (.021), and .040 (.022), respectively.
To examine potential temporal patterning of growth, we use Equation 2 to allow for nonlinearities in our growth models using splines (see Figure 3). We again see that, relative to growth in the prior AYs unaffected by COVID, growth in the 2020–2021 AY was affected. In particular, gaps seemed to emerge during the course of the AY, with a larger departure from pre-COVID growth typically manifesting roughly 100 days into the AY.

Growth in Grades 1–4 across three AYs. Printed year represents first year in the AY (e.g., 2020–2021 is represented by “20”). Solid lines represent analysis based on districts only observed pre-COVID. The dotted line is based on growth in 2020–2021 using all districts (i.e., 2020a).
One concern is that the picture of growth in 2020–2021 might be distorted due to changes in the composition of the sample of districts. Above, we attempt to control for the effect of new districts by focusing analysis on only those districts that were included pre-COVID. We also consider estimates based on all data (i.e., 2020a in Table 3); these growth estimates are generally somewhat larger than those based on consistently observed districts (resulting in a smaller gap in growth between 2020a and prepandemic years), but not universally so (see Grade 4). The slightly larger estimates are potentially consistent with the introduction of even more high SES districts in 2020–2021; see Table 2. Figure 3 also suggests fairly comparable growth patterns between all districts versus the consistently observed districts.
One assumption embedded in the results discussed thus far pertains to school starting on September 1 of a given AY. We view this date as a viable assumption because we are interested in growth over the following 200 days (i.e., the difference between September 1 and the actual start date is likely to be relatively small, given the length of time we focus on), but we also explore the robustness of our results to this assumption. We obtained 2020–2021 start dates for the 53 school districts in our data. Most schools started within roughly 1 week of September 1 (IQR August 24 through September 8). Among these schools, growth estimates are quite similar, whether we use the September 1 start date or the precise start date; the biggest difference is for Grade 3, wherein an assumption of September 1 yields a growth estimate of 1.777 versus 1.779 when we use the actual start date. 4
The Role of Missingness
We consider the sensitivity of results in Table 3 to different assumptions about missingness. In particular, if

where
Based on these estimates, we assume that
In Figure 4, we compare estimates adjusted via Equation 3 to raw estimates for the 2020 cohort (gray bar) and the 2019 cohort (red line). Although missingness clearly affects the estimates, the estimated rate of growth would still be far above zero under the assumptions considered here. That said, the problem of missingness induced by COVID is pronounced (Dee et al., 2021; Dee & Murphy, 2021). We view this sensitivity analysis as informative but not exhaustive and further comment on this matter in the discussion. In particular, it may not account for differential levels of missingness across relevant subgroups, a point that we emphasize as being relevant for subsequent analyses.

Linear growth estimates adjusted for missingness (estimates for 2020 cohort in Table 3). Gray bar represents grade-specific linear growth estimate for first 200 days of 2020–2021 AY (with 95% CI). Blue bars represent estimates adjusted for missingness (via mixture distribution shown in Equation 3) assuming different proportions of unobserved students with zero growth. Red bars represent 2019 growth estimates for the same grade.
Heterogeneity in Growth as a Function of Early-Year Ability
One concern is that students with limited ORF skills at the start of the AY may be especially affected by the COVID pandemic. To analyze this possibility, we split data into quintiles as a function of a student’s mean ORF recorded in the first 2 months of a given AY and then reestimate growth within each quintile. Results based on linear growth estimates are shown in Figure 5. To facilitate interpretation of these results, consider Grade 2: the students in the quintile with the lowest ORF scores in the first 2 months of school start at similar places in the 2 years but grow more quickly (as indicated by the steeper dashed blue line) in the prepandemic AY. This basic pattern is observed across all quintiles for Grade 2 students.

Growth in Grades 1–4 as a function of ORF quintile in the first 2 months of AY. P-values are shown for significant differences in growth estimates. Lines start at the ORF average for measures observed in first 2 months of AY.
We now turn back to the question of whether COVID seems to have more substantially affected lower-ability students. In Grade 1, the lowest-ability students do seem to show the largest deviation from prior growth trajectories (
Heterogeneity as a Function of District Characteristics
Districts with different levels of material resources or preexisting levels of student achievement may have been differentially affected by the pandemic. To test this, we examine variation in linear growth (i.e., a version of Equation 1 modified to include interactions 5 ) during 2020–2021 as a function of the district’s SES, average academic achievement, and percentage of free and reduced-price lunch (FRL) students, Black students, and ELLs. Data are taken from SEDA (Fahle et al., 2021) and standardized for this analysis. Results are shown in Table 4, but we also pause to emphasize that the learning experiences of students in different districts may have been more uneven than during normal times (i.e., students in relatively disadvantaged districts may have struggled with virtual schooling due to insufficient Internet connectivity or otherwise not had dedicated space in their homes for this activity).
Heterogeneity in growth as a function of district characteristics

Note. Time is denominated in months. ELL = English language learner; FRL = free and reduced-price lunch; SES = socioeconomic status.
Higher-SES districts tend to show slightly higher rates of growth in Grades 1 and 2, but the magnitude of change varies. At its largest, a district 2 SDs above the mean in SES in Grade 1 would be expected to have a growth rate of 3.7 WPM/month, as compared to an expected growth rate of 3.4 WPM/month. In Grade 2, the rates would be 2.9 and 2.8 WPM/month, respectively. FRL results similarly suggest that districts with higher levels of FRL students are expected to show weaker growth, although the differences are fairly minor by Grade 4.
Similarly, higher-achieving districts show somewhat stronger levels of growth. In general, the achievement-based gradient is bigger than the SES gradient. For example, a second grader in a district two SDs above the mean in achievement would be expected to grow at 3.4 WPM/month, as compared to the expected 2.8 WPM/month in an average district.
Turning to demographics, districts with a higher percentage of Black students tend to show less growth in Grades 1–2 but not in Grades 3–4. Differences are similar in magnitude to those previously discussed. Across all grades, districts with a larger share of ELLs tend to show lower levels of growth. Although speculative, we suspect that demographic heterogeneity is correlated with unequal distribution of resources prior to and during the pandemic. These results also may be sensitive to differences in missingness across groups that would not be accounted for by the sensitivity analysis considered above (i.e., Equation 3) and so should be interpreted with this caveat in mind.
Discussion
Student growth in ORF was lower during the 2020–2021 AY than in previous years. During the first 200 days of the 2020–2021 AY, second graders were expected to grow by roughly 17.2 WPM, as compared to nearly 21.6 WPM observed in prior years. Differences in Grades 3 and 4 were somewhat smaller. Although some evidence suggests that the first graders who started with the lowest levels of ORF may have grown more slowly than did their higher-ability peers, little additional evidence shows that lower-ability students in Grades 2–4 grew less during COVID. Earlier work along these lines (Domingue et al., 2021) suggests that COVID had substantial impacts on ORF growth in the spring of 2020 but that effects were more modest in the fall of 2020. Findings reported here continue to suggest this basic trend of growth, which is closer to normal in the 2020–2021 AY. On the one hand, the return to near-normal levels of growth is perhaps reassuring, given the disruption to normal provision of educational services caused by COVID. On the other hand, these lower levels of growth will leave students further behind after accounting for potential effects of COVID on learning from the prior school year.
Further, we find evidence of heterogeneity as a function of district characteristics. On average, first and second graders in higher-SES districts grew at faster rates than did students in lower-SES districts, perhaps suggesting that students in higher-SES districts had greater access to resources that supported their virtual learning. Similarly, students in Grades 1–3 in higher-achieving districts grew at significantly faster rates than did students in lower-achieving districts. This achievement-based gradient is generally larger than the SES-based gradient. Districts with higher percentages of FRL students in Grades 1–3, Black students in Grades 1–2, and ELLs in Grades 1–4 had significantly lower growth rates did than districts with lower percentages of those student subgroups. In general, the differences in growth are fairly modest but troubling, given that they may be leading to exacerbation of preexisting inequalities. We emphasize that students in relatively disadvantaged districts may have been dealing with a range of COVID-related problems above and beyond education that were not necessarily being experienced by students in more advantaged districts, but these results combine with other existing evidence (Dorn et al., 2021; Pier et al., 2021; Reardon et al., 2017; Renaissance Learning, 2020) to suggest that the educational impacts of COVID were not and are not evenly distributed.
We acknowledge limitations. First, missingness may lead to bias in our results. Earlier work (Domingue et al., 2021) suggests substantial missingness in the spring of 2020 but much less missingness in the fall of 2020. To the extent that students facing more challenging situations during COVID are those who are missing, we would expect our estimates to be biased upward relative to the growth we would have observed without missingness. Here, we have attempted to benchmark the potential sensitivity of our estimates to different assumptions about missingness. Missingness is a serious problem (Dee et al., 2021) and seems highly nonrandom (e.g., enrollment declines are larger in districts serving higher concentrations of economically disadvantaged students; Dee & Murphy, 2021). We view the approach taken here as one with high internal validity—i.e., we are assessing the learning happening for students who are observed in the assessment system—but emphasize that such results may not generalize to unobserved students.
A second limitation pertains to the fact that Literably data are collected in a fairly unsystematic fashion. We attempt to address this issue via a focus on within-person growth and think that benefits remain regarding the use of this system in the context of the COVID pandemic, given the nature of the assessment (i.e., rapid and unlikely to be gamed). However, we acknowledge the possibility that our estimates may be reflective of teachers choosing to have certain types of students take the assessment. In particular, if COVID led to a systematic change in the students targeted for ORF measurement, this shift could have an implication for our findings.
We also emphasize the distinction between our work, which focuses on growth as contrasted with, for example, differences in ability levels at the start of the AY for the 2020–2021 cohort, and historical data. Our focus on growth is due in part to our desire to remove the impact of idiosyncratic effects on ORF measures due to, for example, specific text passages that a student happens to read or a nonrandom selection of students with certain ability profiles for assessment at certain times. We would additionally argue that the asynchronous data collection makes identification of ORF levels at a unique point in time challenging. We view our evidence as an excellent complement to research on COVID’s impact that focuses on levels, as it allows for a view on this topic of critical importance but with an alternative set of assumptions (e.g., our analysis of within-person change may be robust to forms of missingness that may lead to interpretative challenges in other datasets) and also includes effect sizes that allow for direct comparisons to results based on alternative analytic strategies (e.g., Betthäuser et al., 2022).
Our findings complement the growing literature on COVID’s effect on student learning in three specific ways. First, we include students too young to be covered by many standardized assessments (i.e., students in Grades 1 and 2). Second, we use an assessment focused on an essential reading skill that was readily adapted for at-home use, given that it can be administered quickly and in the same format that a student was accustomed to at school. Third, our results are based on estimated within-student growth as opposed to between-cohort changes. We also note that assessment of specific, highly important skills may offer novel information vis-à-vis the information gleaned from broader educational measures typically used in formative and summative assessment. These results suggest that students’ reading skills likely grew at a reduced pace in 2020–2021 and that such reductions were widely felt.
Although these reductions in the development of student skills are concerning, we think it noteworthy that students do seem to have made gains this year. Yet despite these gains, our findings suggest a level of loss in some cases (e.g., over a month of time) that will not be resolved in the near term; a longer-term perspective will be required if we are to make up all the losses suffered by these students. Our findings also suggest some degree of heterogeneity; such observations could help policymakers target resources to specific students, grades, schools, and districts based on the disparate impacts observed in such studies. Finally, this type of research should be extended to monitor the progress of students affected by the pandemic, allowing for continued adjustment to policy and practice over time. A growing literature is evaluating the efficacy of interventions designed to remediate learning loss, including (but not limited to) high-dosage tutoring (Allensworth & Schwartz, 2020; Hough et al., 2021; Robinson et al., 2021), extended learning time (Allensworth & Schwartz, 2020), and summer learning programs (McCombs & Augustine, 2021). Although providing recommendations for policy and practice based on a full review of these studies is beyond our scope, existing and future research may provide useful insights to guide decision-making about how to best address the learning loss we have documented in our study.
Footnotes
Acknowledgements
BD, DL, and JY have consulting relationships with Literably; however, work on this analysis was not funded by Literably. This work was supported in part by the Institute of Education Sciences (R305B140009), Eunice Kennedy Shriver National Institute of Child Health and Human Development and the Jacobs Foundation. The authors thank Habib Moody, Sherrie Reed, Jeannie Myung, and Alix Gallagher for comments on this manuscript and Literably and the districts for sharing the data.
2
Note that we use an approximation of 1 month as 4 weeks.
3
4
We similarly collect data on districts that were in the Literably data in 2019–2020 and 2020–2021 and examine their start dates in the pre-COVID year of 2019–2020. Results are again similar; the largest difference is in Grade 2, where the exact start date yields an estimate of 3.053, compared to 3.050 under the September 1 approximation.
5
Authors
BENJAMIN W. DOMINGUE is an associate professor at the Graduate School of Education at Stanford University. He is interested in psychometrics and quantitative methods.
MADISON DELL is a doctoral student at the Graduate School of Education at Stanford University. Her research interests include quantitative evaluation of federal and state higher education policies.
DAVID LANG is a doctoral student at the Graduate School of Education at Stanford University. He is interested in applications of causal inference, machine learning, and natural language processing approaches to educational data.
REBECCA SILVERMAN is an associate professor at the Graduate School of Education at Stanford University. She is interested in early language and literacy.
JASON YEATMAN is an assistant professor at the Graduate School of Education at Stanford University and the department of pediatrics at the Stanford University School of Medicine. He is interested in the neurobiological foundations of reading development.
HEATHER HOUGH is the executive director of Policy Analysis for California Education (PACE). Her research is focused on understanding student experiences and outcomes and strengthening district and state structures that promote system improvement.