
Abstract
This paper studies the patterns of individuals’ student loan repayment for up to 12 years, tracking borrowers through the formative ages of the early 20s to the late 30s. Using social sequence and cluster analysis to understand these longitudinal repayment histories, we identify five archetypes of loan repayment that describe borrowers’ experiences: persistent defaulters, perpetual payers, rapid full payers, late full payers, and consolidators. We find significant stratification by race/ethnicity, social class, and institutional sector into repayment clusters, with minoritized borrowers and those attending for-profit institutions more likely to experience adverse borrowing outcomes and to experience them for longer.
Postsecondary education is more critical than ever for economic security and mobility as the employment prospects of individuals without a college degree continue to deteriorate (Ma et al., 2016). Employers’ expectations of postsecondary attainment continue to grow (Harris & Holley, 2016). This “credentialism” has recently been framed as a key driver of student debt (e.g., Cottom, 2017; Morgan & Steinbaum, 2018) as it creates an imperative for investing in one’s education even though such investments carry some risk: Students bear a growing share of education costs (Desrochers & Hurlburt, 2016) and rely heavily on student loans to finance them (Akers & Chingos, 2016). Even though college graduates outearn their peers with no higher-education credentials, millions of borrowers face significant challenges repaying student loans (Looney & Yannelis, 2015).
The culmination of these trends is a student loan system in distress. Outstanding student loan balances exceed $1.7 trillion (Board of Governors of the Federal Reserve System, 2020) at a time of stagnant earnings, even for holders of college or graduate degrees—and earnings have declined even more sharply for those with no college education (Morgan & Steinbaum, 2018). Thus, although the college earnings premium seems to grow, the debt that many incur to finance their education leaves them in a financially precarious position. It is no surprise, then, that a student loan “repayment crisis” has emerged (Dynarski, 2014, p. 2): Upwards of 30% of borrowers default within 5 years (Mueller & Yannelis, 2017), and more than half of borrowers do not pay down any of their principal balance within 3 years (Kelchen & Li, 2017). In fact, many borrowers—57% of those entering repayment in 2012—owe more after 2 years in repayment than they did initially, accruing interest faster than they pay down their loans (Looney & Yannelis, 2015). Underlying these trends is a complex student loan repayment system that interacts with borrowers’ life course as they manage debt while navigating careers and formative financial decisions.
This paper analyzes student loan repayment as a longitudinal process. Prior research on student debt has generally centered on a select few outcomes of interest at discrete points in time (e.g., default within 3 years, outstanding balances 10 years post-enrollment). Rather than focusing on a single loan outcome or time window, we construct continuous repayment histories for a nationally representative sample of borrowers from initial college enrollment for up to 12 years post-college. These histories capture a formative stretch of individuals’ lives as well as the numerous transitions, starts and stops, and events that borrowers experience during repayment. Based on these repayment histories, this paper focuses on three research questions.
First (RQ1), what patterns of student loan repayment do borrowers experience? Investigating a more complete picture of loan repayment, we find that repayment is a complex, discontinuous process characterized by frequent transitions. This complexity implies that oft-cited metrics of the “repayment crisis,” such as the focus on student loan default, may understate the struggles and disparities inherent to student loan repayment. We identify five archetypes of repayment patterns. Persistent defaulters and perpetual payers experience perhaps the most adverse repayment histories; the former group has frequent, repeated, and long-lasting spells of unresolved student loan default, whereas the latter alternates between repaying loans and spells of deferment and forbearance. Both groups owe more on average at the end of the observation period than when they enter repayment. Two clusters, rapid and late full payers, fully repay their loans through different routes. The first group has the lowest loan balances among all borrowers and reaches full repayment quickly, frequently through lump-sum payments. The second group takes longer to repay loans after stretches of deferment, forbearance, and default, during which balances grow before eventually being settled by a lump-sum payment. The final group of borrowers, consolidators, uses loan consolidation to settle their original debt quickly but faces new repayment obligations on those consolidated loans. These histories show that repayment experiences vary widely by borrower. For example, we find that about half of all defaulters remain in this status for several years, unable to bring their loans back to good standing. Among borrowers who do fully repay loans, up to 30% do so only after defaulting at least once and then making lump-sum payments to settle defaulted loans. Each defaulted borrower faces widely varying sets of fees and charges that can significantly increase the total cost of their debt. Focusing on dichotomized student loan outcomes, such as default, erases such variation in borrower experiences and paints an incomplete picture of the policy solutions needed to address the student loan repayment crisis.
Having grouped loan repayment histories into clusters, we ask (RQ2): What student and institutional factors are associated with different repayment patterns? The relationship between student characteristics and repayment patterns allows for a better understanding of disparities in how borrowers fare during repayment; these relationships can also matter for targeting of policy interventions or debt relief. The institutional factors associated with each repayment cluster can inform evolving regimes for institutional accountability and transparency of outcomes to borrowers. There are large disparities in repayment outcomes by institutional control, although we find that these differences are attenuated in a regression framework and dependent on operationalization of variables, given that many students attend multiple types of institutions.
We close with some exploratory descriptive analysis (RQ3) of the relationship between repayment patterns and other financial outcomes. Our findings suggest that students struggling to repay student loans face other negative financial outcomes, including lower rates of home ownership and higher credit card debt. We find that the most distraught borrowers (persistent defaulters) and those facing long repayment terms (perpetual payers) also report that the need to pay off student debt has shaped their career decisions. Relative to non-borrowers, we also find that all borrowers across all repayment clusters are more likely to express regret over their investments into higher education.
The next section provides a review of the salient student loan literature, from borrowing through repayment. We then frame our analysis by drawing on life course and administrative burden perspectives, highlighting the student loan repayment life cycle, the bureaucracies that shape it, and its interaction with individuals’ contexts and higher-education experiences. Next, we outline our empirical approach. Empirical findings for the three research questions follow. We close with a discussion of the implications of this analysis for the student loan system and its reform.
Literature Review
Student Borrowing
Student loans are integral to higher education, accounting for as much as two-thirds of federal spending on postsecondary aid (Akers & Chingos, 2016). From 1990 to 2008, the percentage of undergraduates borrowing almost doubled, from 19% to 35%, while total federal loan dollars tripled over the same period (Avery & Turner, 2012). Borrowers completing their bachelor’s degrees in 2018 (58% of all graduates) owed on average $29,000 (College Board, 2019). Since the Great Recession, average debt at graduation has held largely constant, and the volume of federal loans issued to undergraduate students has declined as enrollment growth has stagnated (College Board, 2019). However, total outstanding student debt continues to rise, owing partly to increased graduate borrowing, slow repayment progress, and accrued and capitalized interest, suggesting that additional research is needed to better understand the repayment process.
Aggregate debt statistics obscure variation across students, particularly for historically marginalized student populations. A large body of research has documented that Black students leave college with a disproportionate share of student debt (e.g., Despard et al., 2016; Goldrick-Rab et al., 2014; Hillman, 2015; Price, 2004). Such disparities grow over time as borrowers accumulate more debt to finance additional education and see interest charges accumulate and capitalize (Scott-Clayton & Li, 2016). Addo et al. (2016) find that by age 25, Black students have loan burdens that are 68% higher than those of their White counterparts, which attenuates to 40% when controlling for institutional characteristics and familial contributions to college expenses (Addo et al., 2016). Houle and Addo (2019) document that the Black–White disparity in student debt “increases across the early adult life course from around the early 20s to mid-30s” (p. 571), accounting for close to one-quarter of the wealth gap between the two groups at age 30.
Student debt also disproportionately burdens first-generation college-goers (Furquim et al., 2017; Javine, 2013) and women, who hold almost two-thirds of student loan balances (American Association of University Women, 2017, 2020; Kaba, 2017). An exception is that Latinx college students tend to borrow at lower rates than their peers (Cunningham & Santiago, 2008; McDonough et al., 2015; Taylor et al., 2020). Elengold et al. (2020) find that borrowing decisions among Latinx students are familial rather than individual and are closely tied to “[p]arents’ trust perceptions of financial institutions” (p. 144), resulting in heightened loan aversion.
The sorting of students across institutions partly shapes the distribution of debt. Students in the for-profit sector, for example, borrow more, even controlling for observed student and institution characteristics (Cellini & Darolia, 2017). Although the for-profit sector is responsible for the highest levels of indebtedness, debt has risen across higher education (College Board, 2019). The divestment of states from public higher education, particularly during the Great Recession (Desrochers & Hurlburt, 2016), has resulted in an acceleration of “cost-shifting from public subsidies to individual payments in higher education” (Barr & Turner, 2013, p. 168). The disparities in borrowing across student characteristics and higher-education sectors are mutually reinforcing, given the stratified nature of postsecondary enrollment, as minoritized students are more likely to attend the least well-resourced public institutions (Carnevale et al., 2018) and higher-cost for-profit colleges (Iloh & Toldson, 2013).
In the absence of sufficient federal and state efforts to address college affordability, student loans are integral to higher-education access and seem, on average, justified by expected returns from postsecondary degrees (Avery & Turner, 2012). Recent research suggests that student loans can positively affect student outcomes beyond access. In a randomized study, Marx and Turner (2019) find that higher loan offers increase borrowing and grades, credits earned, and transfers to 4-year institutions. Black et al. (2020) find that greater loan availability enables students to borrow more and improves short-term academic attainment (congruent with Barr et al., 2019, and Wiederspan, 2016) and longer-term outcomes, including degree completion, earnings, and financial well-being.
Paying Off Student Debt
Coinciding with substantial reliance on borrowing is a deterioration of student loan repayment, whether measured by the incidence of delinquency or default (Looney & Yannelis, 2015), institutional cohort default rates (CDRs; Looney & Yannelis, 2019), or negative amortization (College Board, 2019; Looney & Yannelis, 2015).
For most borrowers, federal student loans carry a mortgagelike repayment schedule of 10 years with fixed payments. However, these loan terms do not match most individuals’ life course and earnings trajectory (Barr et al., 2019; Chapman & Dearden, 2017), resulting in frequent deviations from these loan terms. Most research focuses on one of the most disruptive events that student borrowers face—default. Student loan default poses potentially serious consequences to borrowers, ranging from interest and fee charges to loss of eligibility for federal student aid, impacted credit scores, and wage garnishment (Delisle et al., 2018). Many of the early studies of default document its correlation to such student characteristics as race/ethnicity, Pell Grant eligibility, and standardized test scores (Gross et al., 2009). More recent empirical work also identifies patterns between default and institutional characteristics (e.g., Darolia, 2013; Deming et al., 2012; Hillman, 2014; Ishitani & McKitrick, 2016; Webber & Rogers, 2014). This newer body of research points to the for-profit sector as consistently having the highest default rates; for-profit students have two to three times the odds of default as those attending public institutions (Hillman, 2014). Two-year institutions, which typically have lower rates of borrowing, also have high default rates (e.g., Scott-Clayton, 2018).
Reflecting long-standing stratification of higher education, student and institutional characteristics interact to shape the student loan repayment crisis. Following the Great Recession, enrollments and federal student aid dollars grew among institutions with low graduation rates (Jaquette & Hillman, 2015). Older, independent students attending college part-time have made up a large share of borrowers since the mid-2000s and primarily been concentrated in for-profit institutions and community colleges, sectors that account for about half of all new borrowers but 70% of all defaults (Looney & Yannelis, 2015). An important confounder to loan repayment is degree attainment: Non-completers are more than twice as likely to default than are students who earn their degree (Gladieux & Perna, 2005; Perna et al., 2017). Completion rates are lowest at the least-resourced institutions, with some of the highest CDRs (Carnevale et al., 2018).
Improved availability of data has enabled researchers to expand the study of loan repayment. Extending the tracking period over which borrowers are observed, Scott-Clayton (2018) shows that borrowers remain at risk of default far beyond the 3 years that define the CDR, with 40% of defaults occurring 12 years or more after students begin college. These longer tracking periods reveal larger disparities: Nearly half of students at for-profits eventually default, and over 20 years, 20% of White students default, compared to nearly 50% of Black students (Scott-Clayton, 2018). Delisle et al. (2018) find that 70% of defaulters eventually exit default, while another 17% default on loans multiple times. Borrowers also have access to income-driven repayment (IDR) plans, which can lower monthly payments and protect borrowers from default at the cost of slower progress toward paying down principal balances. Three years into repayment, less than half of borrowers on IDR plans pay off a single dollar of principal on their loans (Lacy et al., 2018). Take-up rates for the various IDR programs also remain low among the lowest-income borrowers (Collier et al., 2020). Finally, recent reports document high rates of delinquency and forbearance: At least half of all borrowers go through periods of either, with rates above 60% among Black, Indigenous, and Latinx borrowers (Taylor et al., 2020).
Each of these numerous statuses has its own associated bureaucratic and administrative processes, but navigating the repayment system is a cost mostly absent from discussions of the student loan repayment process. The mechanisms intended to orient students to student loan repayment appear to be ineffective: Loan entry and exit counseling seem to be of limited utility, as they are too distal from repayment (Baker, 2019); one-third of students underestimate their indebtedness (Andruska et al., 2014). Exit counseling has grown to encompass more than 25 topics but seems to be inadequate preparation for borrowers, given its content and timing (Baker, 2019). Moreover, many borrowers simply do not complete exit counseling (Klepfer et al., 2015). Cox et al. (2020) show that the complicated messaging about student loan repayment options has led many students into standard repayment terms when IDR plans would serve them better. Even while borrowers are in college, evidence suggests that they pay a psychic cost for their debt: Debt-induced stress negatively affects several dimensions of mental health (Deckard et al., 2021). The impact of student loans over the life course persists well into early and middle adulthood by influencing choices about career (Field, 2009; Rothstein & Rouse, 2011), business startup (Ambrose et al., 2015), family formation (Bozick & Estacion, 2014; Stivers & Berman, 2020), and home ownership (Mezza et al., 2020).
Conceptual Framework
We ground this study on two sociological perspectives: those of the life course and administrative burden. Literature on the life course has gained traction as researchers grapple with the patterns and structures of individuals’ lives (Elder & Rockwell, 1979). We conceptualize student loan repayment as possessing a life cycle during which individuals transition through repayment statuses; these transitions and statuses are themselves partly the product of individuals’ contexts, their higher-education experiences, and prevailing student loan policies. This framework thus forgoes analysis of a single status at a point in time, recognizing that “single events should not be isolated from each other but have to be understood in their continuity” (Aisenbray & Fasang, 2010, p. 421).
Two recent studies in higher education inform this framing. Monaghan (2020) employs such a framework to analyze participation in higher education over the life course, focusing on transitions between college enrollment and employment through early adulthood. His approach reveals the trade-offs that individuals face between school and work, how these trade-offs evolve as individuals age, and what they imply for other milestones, such as marriage and family formation. Such analysis moves the discussion of higher-education participation “. . . from separate investigations of specific enrollment behaviors (e.g., delayed enrollment) to grasping how individuals combine such behaviors to form complex patterns of discontinuous educational participation” (p. 424). Houle and Addo (2019) study the accumulation of student debt with a life course perspective, arguing that “[a]lthough social scientists have suggested that social inequalities in debt are a function of processes that play out across the life course, cross-sectional or point-in-time debt estimates do not adequately reflect these processes” (p. 566). Their findings illustrate this point: Disparities in student indebtedness between Black and White students are understated when measured at a fixed point because they grow over the life course. Our analysis seeks to extend these insights to loan repayment: Cross-section or point-in-time measures of repayment do not reflect the temporal experiences of borrowers navigating the complex student loan system.
We augment this life course perspective by drawing on the administrative burden literature. Administrative burden emphasizes how rules and bureaucracies shape interactions with government services. Moynihan et al. (2014) define administrative burden as a function of three costs incurred by citizens: learning, compliance, and psychological. Much about the student loan repayment process requires borrowers to navigate bureaucratic structures to access benefits that make repayment easier: Borrowers hoping for relief from economic hardship through loan forbearance or deferment face complex submission processes; defaulters face lengthy and costly rehabilitation processes to return loans to good standing; and such plans as IDR and public service loan forgiveness (PSLF) require frequent recertification to maintain eligibility (e.g., Turner, 2018; U.S. Government Accountability Office, 2019). The administrative burden inherent to the student loan system gives students relatively easy access to credit but often sets up borrowers for the least-advantageous outcomes, ranging from the terms of the standard repayment plan to the numerous hoops that borrowers face when attempting to secure relief.
Empirical Approach
Data
Student and Institutional Characteristics
We use the Beginning Postsecondary Students 2004/2009 (BPS:04/09) survey for all analyses. The BPS:04/09 survey followed a nationally representative subset of respondents from the fall of 2003 for 6 years after initial enrollment. It collected information on students’ backgrounds, academic experiences, enrollment histories, degree attainment, and work experiences over three waves: at the end of students’ first year of enrollment and at 3 and 6 years thereafter. We use information collected across all waves to capture the variables relevant to the conceptual framework. These include race/ethnicity, gender, parental education, institutions attended, enrollment intensity, financial-aid use, degree attainment, and field of study. Institution-level variables include control and level of academic offerings. The final sample focuses on borrowers only (n ~ 9,990; all numbers are rounded per reporting guidelines from the National Center for Education Statistics [NCES]) after a series of exclusions from the original ~ 12,040 borrowers in the BPS:04/09 sample (see Online Appendix A). Summary statistics are reported in Table 1.
Descriptive Statistics by Student Loan Borrower Status

Note. All statistics are weighted by WTA000. Numbers are rounded in accordance with NCES guidelines for privacy. ***p < 0.001. **p < 0.01. *p < 0.05. ~p < 0.1.
Source. Authors’ calculations from BPS:04/09 survey.
The borrower sample differs from that of non-borrowers across virtually all student- and institution-level measures. Borrowers are more likely to be female, be Black and Native Hawaiian/Pacific Islander, and come from lower-income households. Non-borrowers are more likely to attend lower-cost institutions, including public colleges and universities at the 2-year or less than 2-year level; as a result, borrowers face 70% higher tuition and fee charges than do non-borrowers. Non-borrowers also come from households with higher incomes.
Student Loan Repayment
The December 2017 release of the BPS added detailed student loan repayment records sourced from the National Student Loan Data System (NSLDS). These data track borrowers’ principal and interest balances and instances of default, deferment, and forbearance at the student-loan-transaction level. We construct holistic repayment histories at the student-quarter level through several transformations of the source data (detailed in Online Appendix B). These individual-level histories span up to 56 quarters dating to the fall of 2003. For each quarter, borrowers are assigned to one of the statuses described in Table 2.
Loan Repayment Statuses and Rankings for Repayment History Creation

Note. Statuses are derived from transaction dates included in NSLDS records. Rank column indicates the order in which statuses are selected when collapsing across multiple loans for the same borrower.
Source. Authors’ calculations from BPS:04/09 survey.
Methods
Research Question 1
In RQ1, we identify patterns in the trajectories of student loan repayment by using social sequence analysis (SSA). Abbott (1995) pioneers the use of this method in the social sciences in his research on career trajectories; recent applications of this method include work by Monaghan (2020) and Humphries (2019). SSA treats as the unit of analysis the entire longitudinal trajectory of repayment statuses for each borrower. The approach taken is a standard application of SSA: Treating the temporally arranged sequence of statuses for each borrower over 56 quarters as a 56-character string, we compute the (dis)similarity of each pair of strings (i.e., pair of borrowers) and group them by similarity. With seven possible statuses over 56 quarters, there are 7^56 unique possible sequences, although only ~7,970 unique strings are observed. Akin to cluster analysis, after constructing repayment histories, the aim of SSA “is to reduce each sequence to some simplest form and then to gather all sequences with similar ‘simplest forms’ under one heading” (Abbott, 1995, p. 105). Cluster-analysis methods apply to continuous variables; as the outcome variable in this instance is a string of categorical statuses over time, the analysis requires some transformations (Abbott & Tsay, 2000). We apply the standard optimal matching (OM) method to quantify the similarity of repayment patterns, calculate a matrix of the similarity of each pair of statuses, and then cluster borrowers based on that matrix.
The OM algorithm estimates similarities by assigning a cost to the changes to a string of repayment statuses required to equalize it to another string and then computes the “edit distance”—that is, it quantifies the changes required for one string to turn into another string. The algorithm assigns the “cost” of the edit distance empirically, following the approach of Aassve et al. (2007) and Monaghan (2020). Equation 1 defines the probability of transitioning from status a to b as the ratio of the number of individuals transitioning from a to b to the number starting in status a (as in Aassve et al., 2007):
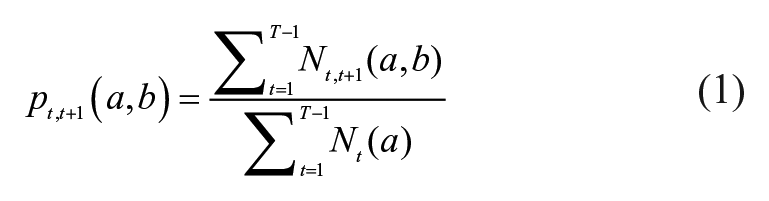
The replacement cost between a and b is determined by all transitions between the two statuses, as defined by Equation 2:

Equation 2 has several important implications for the analysis that follows. First, rarer transitions (less likely changes between statuses based on the data) carry a higher cost. The replacement cost of any pair of statuses is less than 2, so long as
Costs for Replacement of Student Loan Repayment Statuses

Note. Cost matrix is estimated from transition probabilities for each pair of statuses. PIF, paid in full; PIF—C, paid in full through consolidation; Repay, in repayment; Defer, in deferment or forbearance; Repay—no progress, in repayment with negative amortization/forbearance; Prepay, prepayment.
Source. Authors’ calculations from BPS:04/09 survey.
Based on the costs of insertions, deletions, and replacements, we create a symmetric matrix with N rows and N columns (~ 9,990 by ~ 9,990 in our case) that measures similarity between all observed pairs of strings. In other words, the matrix contains a (dis)similarity measure for each individual repayment history relative to every other individual borrower’s history. We then use agglomerative clustering methods (Ward’s distance) to identify clusters of similar patterns. Our preferred clustering solution identifies five distinct patterns. We explored several alternative clustering solutions, but five clusters maximized between-group differences and yielded the most compelling groupings of repayment histories.
Research Questions 2 and 3
After grouping borrowers into repayment history clusters, we study the student- and institution-level characteristics associated with each cluster and the relationship between clusters and other financial outcomes. A multinomial logit model is used to explore the conditional relationships between student and institution characteristics and repayment clusters. The probability of being assigned to cluster m out of j possibilities is:

where b designates a reference outcome (i.e., cluster). The terms
Limitations
Although this analysis expands our understanding of student loan repayment histories, it has several limitations. Some relate to the data source used. No survey waves are tracked past 2009, even though repayment histories are tracked through 2016, and virtually no information is available regarding labor market outcomes of respondents. Specifically, the absence of data on income or earnings is a significant deficiency, and its omission could bias coefficients. We address this concern in a couple of ways. First, omitted variable bias “can be eliminated (or at least mitigated) when a suitable proxy variable is given for an unobserved explanatory variable” (Wooldridge, 2015, p. 512). We include covariates for educational attainment and field of study as proxies correlated with income. Further, the intent of RQ2 is to document borrower and institutional characteristics associated with different repayment patterns. Conditioning on income introduces its own endogeneity to these associations. For example, we find that Black borrowers and those attending for-profit institutions face especially adverse repayment outcomes. Conditioning these relationships on income may change their magnitude or significance, but, critically, the underlying unconditional disparities remain. In other words, earnings may be the mechanism that explains disparities, but for the purposes of understanding the (in)equities of the student loan system and identifying the types of institutions associated with the most adverse loan repayment outcomes, its omission is not a significant limitation.
A second limitation is the broadly inductive nature of the analysis. This starts with the numerous transformations that we make to the raw data; each transformation reduces granularity temporally (from months to quarters) and cross-sectionally (from loans to a single borrower), which could obscure some patterns. Practically, however, this reduced granularity makes identification of repayment clusters simpler and arguably easier to interpret.
Further, repayment histories are right-censored, as many borrowers still hold student loans past 2016. Over a longer observation window, patterns identified in RQ1 could change. Figure 1B provides a measure of this right-censoring, plotting the proportion of the sample observed in repayment by quarter. We accommodate this limitation by backdating repayment histories to the point of initial enrollment, which ensures a balanced panel at the student-quarter level (see Online Appendix D). We recognize, however, that others analyzing these same data may construct repayment histories differently, use different algorithms to compare histories, and arrive at different conclusions. We hope that the extensive descriptions of methods and data transformations here and in the Online Appendices demonstrate that our approach is a straightforward application of SSA using standard specifications of edit distance and clustering methods.
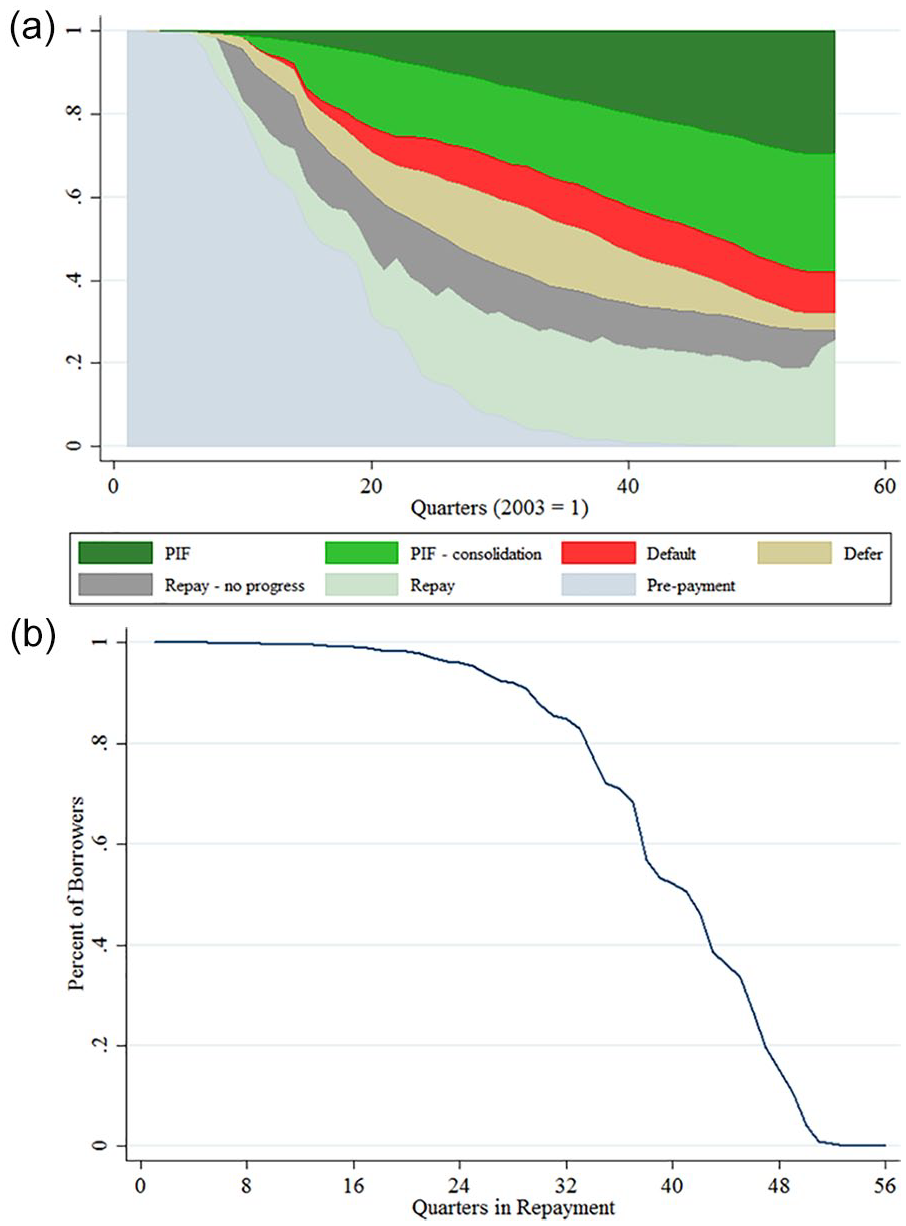
Repayment statuses by quarter for all borrowers (n ~ 9,990).
Results
Visualizing Repayment Histories
Figure 1 displays the distribution of repayment statuses by quarter since initial enrollment for all borrowers. There is a long lag for many borrowers from college to repayment—it takes about 16 quarters for half of borrowers to enter repayment; by 24 quarters, 75% have done so. Within the observation period, about one-quarter of all borrowers fully repay their loans, with another ~25% taking on a new consolidation loan on which they still face payments. The proportion of borrowers in default increases monotonically through the first 12 years of repayment, whereas deferment peaks in the middle period of the panel. All borrowers begin in a pre-payment status of varying length. For clarity, Panel B of Figure 1 summarizes the length of actual repayment statuses observed across the sample. More than 97% of borrowers are in one of the repayment statuses for at least 5 years; approximately 50% of the sample is observed in repayment for 10 years. The status distribution plot can be subset by characteristics of interest, as illustrated in Online Appendix C. The flow of transitions across statuses is reported in Online Appendix B. Some statuses are persistent, such as “paid in full,” as borrowers who pay off their loans are unlikely to exit that state, barring reenrollment and new borrowing. Perhaps more worrying is the stability of default as a status; the probability of exiting default in any given quarter never exceeds 0.10.
The most likely pathway out of default is full repayment of loans through a lump-sum payment (especially for defaulters with relatively low balances) or a consolidation loan carrying its own repayment obligations. About half as frequently, borrowers rehabilitate loans by making the necessary number of consecutive payments. Repayment is most frequently interrupted by spells of deferment or negative amortization/forbearance. Such interruptions to repayment are consistent with the “swirling” patterns of attendance that characterize the postsecondary experiences of many students (e.g., Goldrick-Rab, 2006; Monaghan, 2020), particularly for lower-income individuals and those attending less selective or 2-year institutions. Once borrowers find themselves in negative amortization/forbearance, about half eventually return to making payments or consolidate their loans, although an equal share enter default or deferment.
Patterns of Holistic Repayment Histories
Based on these histories, we then cluster borrowers by the similarity in their repayment patterns. Our preferred solution yields five distinctive clusters: persistent defaulters, perpetual payers, rapid full payers, late full payers, and consolidators. Figure 2 shows the distribution of statuses by cluster and the individual-level repayment histories of ~150 representative borrowers for each cluster.

Repayment patterns of five clusters (n ~ 9,990).
Persistent defaulters account for 12% of all borrowers. The defining characteristic of this cluster is that borrowers have repeated and long periods of default that remain unresolved. Default is preceded by multiple periods of rising balances, with 72% of the time spent in repayment for this cluster accounted by negative amortization or forbearance. Persistent defaulters average 21 quarters in default; by the end of the observation period, 81% remain in default, and 13% fully repay their loans (but half do so through consolidation). This cluster includes the largest shares of Black (29%), Latinx (18%), and multiracial (3%) students; Pell Grant recipients (65%); and first-generation college-goers (68%). It is also the cluster with the largest share of for-profit enrollees (43% attended a for-profit institution) and with the lowest degree attainment, as 68% did not complete a credential by 2009. Almost half (47%) of all borrowers who ever default are persistent defaulters.
The cluster of perpetual payers experiences long spells of regular loan payments (on average 15 quarters). This group seems to closely follow the repayment terms of federal student loans, but perpetual payers frequently undergo deferment (60% defer at least once, on average for 2 years), and 1 in 10 defaults. Twenty-nine percent of perpetual payers pay their originating loans in full, primarily through consolidation. The high incidence of consolidation loans, deferment, and borrowing for graduate school (25% of this cluster takes on graduate loans) means that perpetual payers carry repayment obligations well beyond the observation period for this analysis. Their parents may face similar obligations, as 22% of perpetual payers make use of Parent PLUS loans. This is the largest cluster, accounting for 38% of borrowers. It includes the largest share of bachelor’s degree holders (42%) and the second-lowest share of borrowers with no credentials (40%). Otherwise, this cluster is fairly representative of borrowers across demographic and institutional characteristics.
The next two clusters comprise borrowers who fully repay their loans. Rapid full payers (13% of borrowers) repay loans quickly, spending on average less than 6 quarters in repayment. This cluster starts the repayment process with the lowest average balances, owing approximately $7,400. The low debt levels reflect short periods of college attendance: Most leave college with no credentials (47%) or with a short-term certificate (15%), and few ever enter deferment to pursue further education. Approximately 17% of these borrowers default on their loans and resolve it through a single lump-sum payment. Late full payers (16% of borrowers), on the other hand, experience long spells of repayment (14 quarters on average) with a high incidence of negative amortization/forbearance (85% experience it at least once) and default (35%) that eventually terminates with payment in full. Black borrowers are underrepresented among these two clusters.
Finally, 22% of borrowers are consolidators who pay off their original student loans by taking on a consolidation loan. Consolidation allows borrowers to combine numerous loans (potentially issued at different times, charging different interest rates, and collected by different loan servicers) into a single loan, which can greatly simplify repayment. Consolidation is also a path to rehabilitation of defaulted loans and can help students establish eligibility for IDR plans or PSLF. On average, consolidators spend less than a year in repayment before consolidating. Thirty-four percent of these borrowers initially enrolled in the for-profit sector, the second-highest rate, and 28% enrolled in 2-year institutions, the lowest rate among clusters. Consolidators have the highest level of degree attainment, as 61% of them earned a credential by 2009. But half go through periods of negative amortization, and 15% of them default at least once. The cluster also has the highest reported use of private student loans (45%) and Parent PLUS loans (25%) and the second-highest incidence of graduate loans (17%). These various sources of student debt mean that borrowers may face complicated financial decisions regarding loan repayment. NSLDS tracks only a subset of consolidated loans; based on those, 20% of consolidators paid off their consolidated loans by 2016. In other words, 1 in 5 consolidators resembles late full payers. The remaining 80% still face payment obligations on consolidated loans and may experience patterns similar to the other four clusters, but these are unobserved.
Borrowers’ loan balances in Figure 3 reflect the repayment trajectories of each cluster. Balances are indexed to the quarter when borrowers first leave prepayment and are tracked for up to 8 years (sample sizes become small past 32 quarters). Persistent defaulters have increasing loan balances after entering repayment, driven by compounding unpaid interest, capitalized interest, fees, and additional loans taken during deferment. As a result, persistent defaulters owe, on average, 30% more 8 years after they first start repaying loans than they did originally. Perpetual payers also appear to make little progress toward reducing their indebtedness, owing about 10% more 8 years into repayment—and likely much more, considering the high prevalence of private, Parent PLUS, and graduate loans among these borrowers. This cluster also has the highest use of IDR plans (14%). This trait may account for their slow progress in paying down debt and has implications for who eventually benefits from loan forgiveness through IDR plans. Of note, these balances reflect principal and interest only, excluding punitive fees that borrowers may face in various statuses. For example, a lump-sum payment to resolve default includes a collection fee of 24.3% of principal and interest (Delisle et al., 2018).
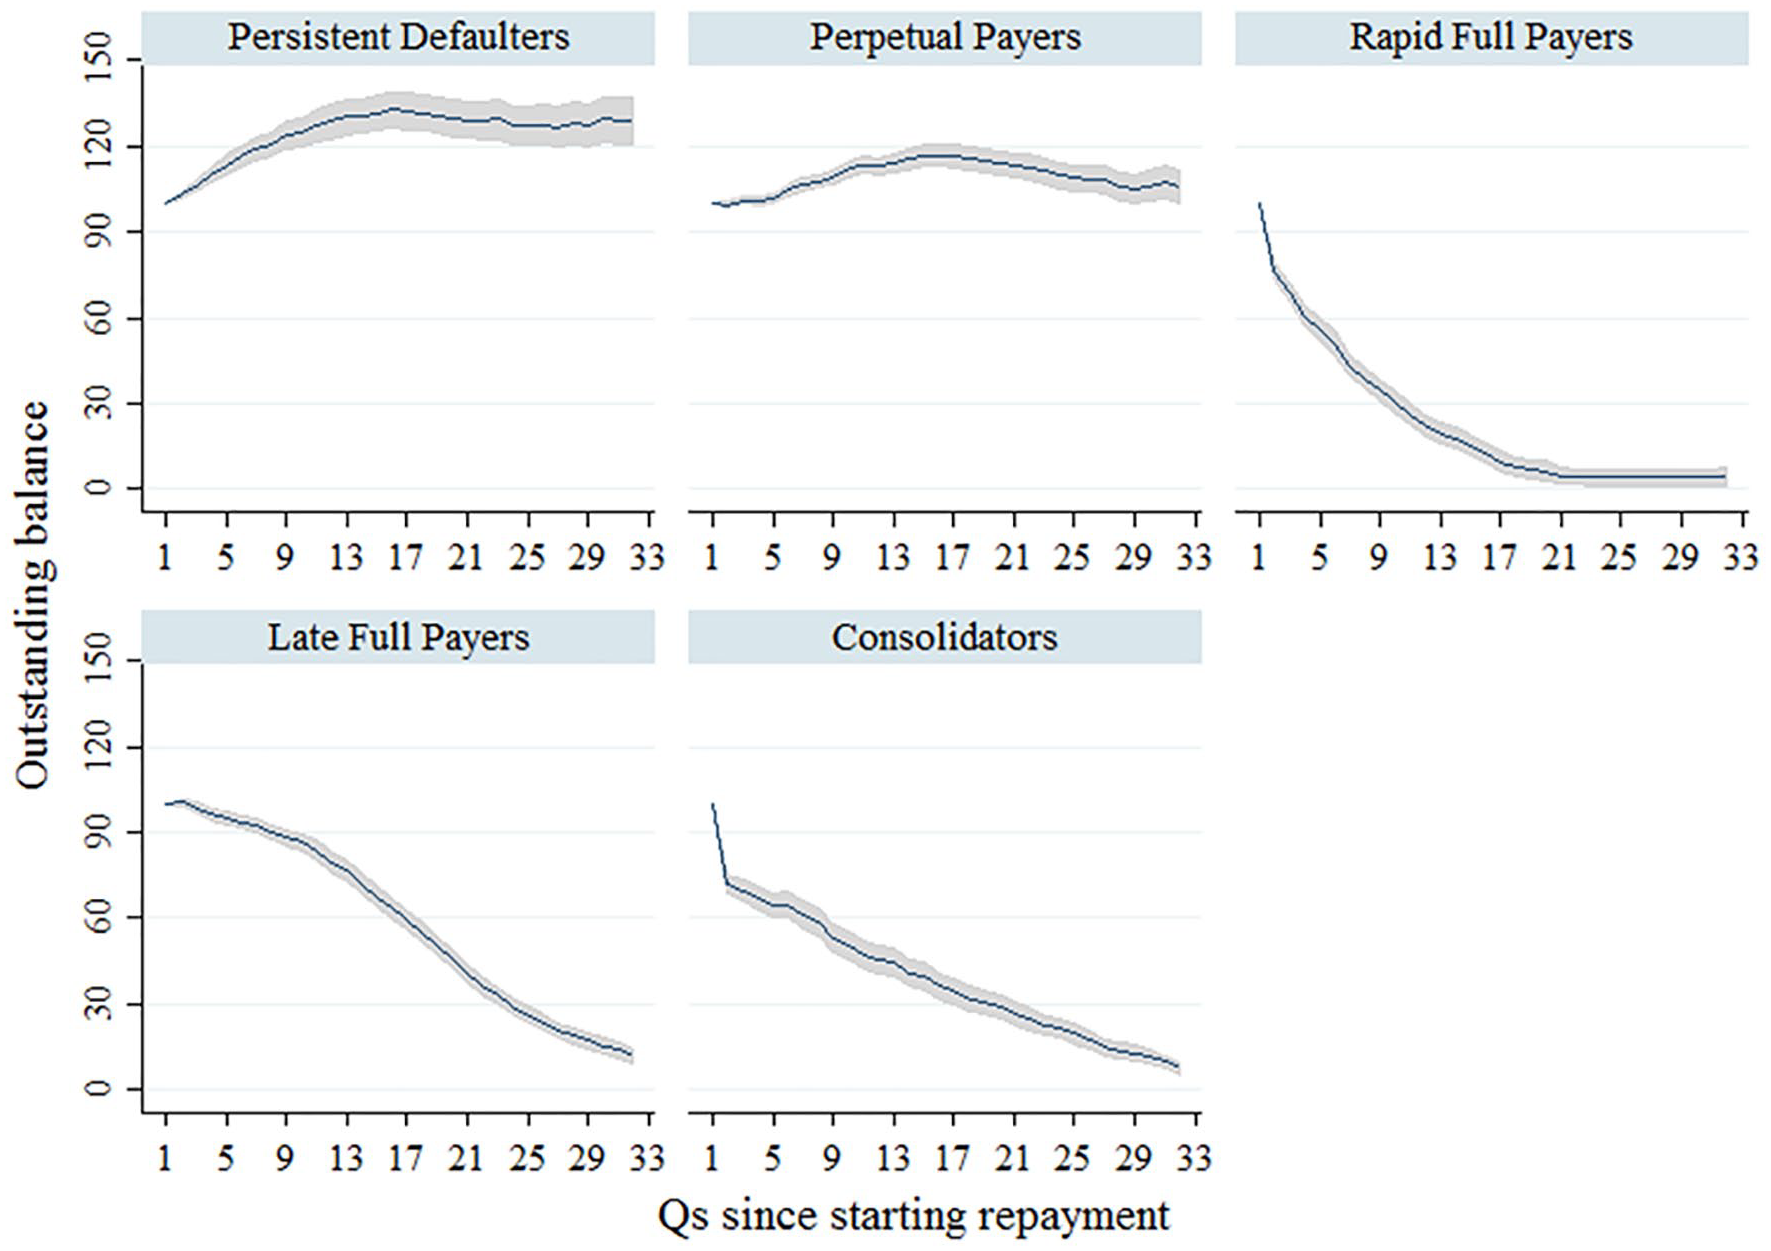
Quarterly outstanding loan balances by repayment cluster.
Rapid full payers exhibit a sharp reduction in balances within the first four quarters in repayment. Within 5 years of entering repayment, this cluster has mean outstanding loans that are essentially zero. Part of the reason for the rapid decline is that many of these borrowers make full lump-sum payments, in some cases after default. Late full payers exhibit a smoother continuous decline in average outstanding balances; by that same 5-year mark, this cluster has paid off 60% of their total loan balances. Finally, the loan balances of consolidators indicate a sharp drop in balances within one or two quarters of entering repayment, as borrowers quickly consolidate. Average outstanding balances decrease linearly thereafter, as additional borrowers consolidate after infrequent and brief periods of repayment, deferment, or default. Because balances on consolidated loans are not observed, it cannot be determined whether these borrowers are progressing toward repayment similarly, more quickly, or more slowly than perpetual payers.
Modeling Cluster Characteristics
To disentangle the conditional relationship between characteristics of interest and repayment clusters, we use regression modeling. Based on Equation 3, a multinomial model is used to regress repayment clusters on a set of student-level variables, institutions attended, patterns of attendance, borrowing behavior, field of study, and degree attainment. For simplicity and ease of interpretation, we focus on the predicted values yielded by the regression (full results are in Online Appendix F). Each point in Figure 4 represents the predicted probability of a borrower with a given characteristic being in each cluster, holding all variables at observed values.

Predicted probability of repayment cluster by select individual and institutional characteristics.
Whereas the statistics in Table 4 indicate that clusters differ from one another on several dimensions, Figure 4 illustrates more muted conditional relationships. Table 4 indicates that Black and Latinx borrowers are disproportionately represented in the persistent defaulter and perpetual payer clusters and underrepresented among rapid or late full payers. The predicted probabilities reported in Figure 4 suggest that this finding is robust to the numerous controls included in the model, but these differences are attenuated. This pattern suggests that important confounding relationships are not evident in the unconditional statistics presented in Table 4. Net of all controls, the most pronounced disparities across students and institutions are in the persistent defaulter cluster and, to a lesser extent, among the rapid full payer group. The results also make clear that the most salient characteristic associated with holistic repayment patterns is race/ethnicity—specifically, the burden placed on Black and Latinx students. This finding is consistent with and builds upon a large body of research: Student loan default and other adverse loan outcomes are more frequent for minoritized students. Earning a credential is also strongly associated with a much lower risk of persistent default, regardless of degree level.
Means and Standard Deviations for Borrower Characteristics by Repayment Cluster

Note. All statistics are weighted by WTA000. Numbers are rounded in accordance with NCES guidelines for privacy.
Source. Authors’ calculations from BPS:04/09 survey.
Panel B of Figure 4 indicates that large unconditional differences in repayment by institutional control are greatly reduced when conditioning on possible confounders in a regression framework. For example, borrowers who attended for-profit institutions seem to have similar repayment outcomes to those attending public 2- or 4-year colleges. This similarity is partly the result of operationalization of these variables; they indicate whether students ever attend a particular type of institution, and for-profit institutions enroll a large number of transfer students. We disentangle this relationship further in the Online Appendices. Online Appendix C shows that students who never attend for-profits have lower incidence and shorter spells of negative amortization/forbearance and of default, although similar shares of borrowers fully repay their loans. Online Appendix E shows that holding all else at observed values, borrowers who never attend for-profits have systematically lower probabilities of being persistent defaulters for virtually all student and institutional characteristics.
Other Financial Outcomes
Student loan repayment occurs in the context of students’ lives during formative early adulthood years. Persistent defaulters carry student loan default and its consequences into their mid-30s; the oldest quarter of these borrowers finds itself dealing with default well into their 40s. Perpetual payers owe as much on student loans at age 35 as they did when they started paying off loans in their early 20s, as do many consolidators. We briefly explore additional life course outcomes measured in the 2009 wave of the BPS:04/09 in Table 5 by examining home ownership, credit card debt, the influence of student loans on employment, and borrower attitudes toward higher education (summary statistics and regression-adjusted marginal effects are reported in Table 5; full regression results are found in Online Appendix F).
Means and Standard Deviations for Select Financial Outcomes in 2009 by Repayment Cluster

Note. All statistics are weighted by WTA000. Numbers are rounded in accordance with NCES guidelines for privacy. Marginal effects for repayment cluster are estimated from logistic/multinomial regression that also includes controls for race/ethnicity; gender; first-generation status; Pell Grant recipient status; age; dependency status; adjusted gross income in 2004 (logged); indicators for attendance of 2-year, public 4-year, not-for-profit 4-year, and for-profit institutions; tuition charges in 2004 (logged); total amount borrowed (logged); indicator for use of private loans; number of institutions attended; full-time/part-time enrollment indicator; indicators for highest degree earned; and field of study fixed effects. Regression is weighted by WTA000. All other variables are held at observed values. ~p < .1. *p < .05. **p < .01. ***p < .001.
Source. Authors’ calculations from BPS:04/09 survey.
Persistent defaulters, perpetual payers, and consolidators are most likely to indicate that student debt has affected their decisions regarding employment or career plans; these same groups are also least likely to own a home. Perpetual payers and consolidators are the clusters most likely to carry credit card balances month to month, partly because persistent defaulters are least likely to have access to a credit card at all. Borrowers across all repayment clusters are more likely than non-borrowers to report that their undergraduate education was not worth the cost: perpetual payers have the lowest rate (22%), and persistent defaulters have the highest (31%) relative to the 17% of non-borrowers who say the same. Differences in perceptions of the value of higher education across clusters are attenuated and statistically insignificant in a multiple-regression framework.
Discussion and Conclusion
To the best of our knowledge, this paper provides one of the most comprehensive overviews of student loan borrowers’ repayment experiences. It reveals the frequency of change that borrowers face in meeting their repayment obligations—a process made even more complicated by the variety of IDR plans now available to borrowers. We document that student loan repayment is frequently interrupted by spells of deferment, negative amortization/forbearance, and default that can last years. We find that half of all borrowers see their outstanding balances rise after they enter repayment, even though these same borrowers make payments on their loans for years. The COVID-19 pandemic has exacerbated this repayment crisis, as almost 90% of borrowers have been making no payments toward student loans during the pandemic (Nova, 2020). Although forbearance made available by the U.S. Department of Education has provided critical relief to borrowers during an unprecedented crisis, its future is uncertain. Once this forbearance is lifted, borrowers may face renewed debt obligations during a tenuous economic recovery. Further complicating this issue is uncertainty around the future state of loan servicers and their ability to restart repayment processes for millions of borrowers simultaneously.
Even as we recognize the diversity of repayment experiences that borrowers have, we are able to identify five overarching patterns. Persistent defaulters account for 12% of borrowers, with repayment trajectories characterized by long spells of default that are largely unresolved within the observation period and who owe on average 30% more in 2016 than when they started repayment. Perpetual payers make up 38% of borrowers, who have the steadiest student loan repayments patterns. On average, balances for this group are about 15% higher at the end of the repayment period, even as 30% of them fully repay their debt, driven by deferment spells during which borrowers reenroll and take on additional loans. The last three clusters—rapid full payers, late full payers, and consolidators—differ most meaningfully in their path to full repayment, whether they do so rapidly (rapid full payers), slowly and after facing some adversity (late full payers), or through consolidation, with the latter group facing largely unobserved repayment obligations on their consolidated loans.
This analysis of holistic repayment histories over discretized repayment outcomes reflects to a fuller extent the disruptions that borrowers experience when settling their student debt. Our approach intends to show that no two repayment trajectories are the same. Perhaps most evident is the case of default. Among defaulters, repayment experiences can range from late full payers, who scrounge up sufficient funds for a lump-sum payment of principal, interest, and collection fees, to persistent defaulters, who experience long stretches of default and are subject to possible wage garnishment or tax offsets with very high fees. Perpetual payers illustrate the loan repayment experiences of the large number of borrowers with “swirling” patterns of college attendance, with 62% deferring and 10% defaulting on loans at least once. The two clusters who fully repay their loans also have varied experiences, including 60% to 85% having negative amortization or forbearance and 15% to 29% defaulting. Consolidators are the largest group and the one about which the least is known. At least 40% of consolidators are, in effect, perpetual payers who still owe on their consolidated loans at the end of 2016. A small minority of borrowers follow the standard loan 10-year repayment terms as currently designed, meaning that most borrowers experience administrative burden when interacting with this complex system. Furthermore, student loan repayment is not limited to the early years of adulthood: Default and its consequences follow persistent defaulters into their mid-30s and 40s, and many perpetual payers and consolidators face repayment obligations well into middle age.
Our analysis makes no inference into the matter of whether student loans are, on net, beneficial. Rather, we hope that our analysis makes clearer the multiple dimensions of “cost” inherent to student debt as currently structured in the United States: Beyond loan balances and loan terms, the uncertainties, complexities, and multiple transitions that borrowers navigate are surely not costless. Similarly, our exploratory analysis under RQ3 reinforces that trade-offs between student loan debt and other financial outcomes can play a role in individuals’ financial situations through the critical ages of early to middle adulthood. Put simply, carrying student loan debt for decades after initial borrowing is sure to have ramifications. These ramifications imply that ex post costs and benefits may differ significantly from ex ante expectations. Future research could leverage other data sources to investigate the welfare implications of these repayment patterns beyond the limited outcomes that we explore in Table 5. Our analysis has no causal claim, but these patterns reinforce the need for research into the impact that student debt has over the life course and for public support for higher education.
Holistic repayment histories also add to our understanding of the racialized dimensions of the student loan repayment crisis. Disparities between Black and White borrowers in student loan default have been observed for a long time, and our analysis confirms that the experience of student loan default is qualitatively different by race/ethnicity, even when outcomes superficially look equivalent. Among defaulters, Black borrowers see their balances grow by 51%, relative to 25% for White borrowers. Whereas the median White borrower in either full payer cluster pays on average 101% of their balances, Black borrowers pay 108% (relative to total principal and interest balances; collection fees associated with repayment events pose yet more costs). Among borrowers who pay off their loans, Black borrowers in the rapid and late full payers clusters are more likely to experience long-term default: 65% default before paying off their loans, spending more than 3 years in default, in contrast to White borrowers, 15% of whom default and whose default spells last less than 2 years (all authors’ calculations based on BPS:04/09). Latinx payers also have high levels of default (28%) before reaching full repayment. As a result of these patterns, borrowers of color can make payments well exceeding what they start out owing and bear a disproportionate share of the punitive mechanisms underlying the student loan system.
Stated generally, the administrative burden of the student loan system makes it relatively easy for students to access student loans but subsequently sets borrowers on challenging repayment pathways. Modest reforms could reduce administrative burden by simplifying forbearance, expanding paths out of default, and streamlining the relationship between borrowers and loan servicers. The standard repayment plan could also enroll borrowers directly into presumably more-advantageous IDR plans, although these plans can also be mismanaged, leave borrowers facing long repayment terms, and not deliver on their promised balance forgiveness (National Consumer Law Center, 2021). More ambitious reforms can range from the numerous proposals for broad-based loan forgiveness (e.g., Charron-Chenier et al., 2020; Goldrick-Rab & Steinbaum, 2020) to tuition-free public education financed by government investments, although such reforms seem unlikely in the current political environment. As to institutional accountability, these findings add to the numerous critiques of the current CDR standards, which ignore the intensity and duration of default as well as the other negative loan outcomes that borrowers may experience.
In the absence of meaningful changes to the student loan system, practitioners at college campuses may be one avenue for long-term support for borrowers—for example, through loan exit counseling that prepares borrowers for the gauntlet of loan repayment. Existing and emerging qualitative research on the lived realities of borrowers financing their education and interacting with the student loan repayment system while navigating formative stages of the life course must guide the reform of policy and practice.
Supplemental Material
sj-docx-1-ero-10.1177_23328584221093325 – Supplemental material for Like Any Other Trap: The Circuitous Path of Student Loan Repayment
Supplemental material, sj-docx-1-ero-10.1177_23328584221093325 for Like Any Other Trap: The Circuitous Path of Student Loan Repayment by Fernando Furquim, KC Deane, Brian P. McCall and Stephen L. DesJardins in AERA Open
Footnotes
Acknowledgements
This research was supported in part by grant R305B150012 from the Institute of Education Sciences to the University of Michigan. Any opinions, findings, and conclusions or recommendations expressed in this material are those of the authors and do not necessarily reflect the views of the Institute of Education Sciences. We thank the AERA Open editors and reviewers for their feedback on this manuscript. We also thank Mike Bastedo, Sue Dynarski, Kevin Stange, participants in the Causal Inference in Education Research Seminar at the University of Michigan, and staff at the Department of Education for helpful comments on earlier drafts. Finally, we thank the graduate students on Steve DesJardins’s and Brian McCall’s research team for their input.
Open Practices
Authors
FERNANDO FURQUIM is the director of institutional effectiveness at Minneapolis Community and Technical College. His research interests include higher-education accountability, institutional and programmatic accreditation, and the role of institutional research at American colleges.
KC DEANE is a doctoral candidate and IES predoctoral fellow at the University of Michigan’s Center for the Study of Higher and Postsecondary Education. Her research interests include the study of student financial aid, state higher-education policy and finance, and the role of the public college in the American city.
BRIAN P. MCCALL is a professor of higher education, economics, and public policy at the University of Michigan. His research in higher education focuses on issues in college choice, persistence, and graduation.
Stephen L. DesJardins is a professor of education and of public policy at the University of Michigan. His research interests include student transitions from high school to college, what happens to students once they enroll in college, the economics of postsecondary education, and the application of new statistical techniques to the study of these issues.
References
Supplementary Material
Please find the following supplemental material available below.
For Open Access articles published under a Creative Commons License, all supplemental material carries the same license as the article it is associated with.
For non-Open Access articles published, all supplemental material carries a non-exclusive license, and permission requests for re-use of supplemental material or any part of supplemental material shall be sent directly to the copyright owner as specified in the copyright notice associated with the article.