
Abstract
Little research in education has focused on school neighborhoods. We employ a novel systematic social observation tool—the internet-based School Neighborhood Assessment Protocol (iSNAP)—within Google Street View to quantify the physical characteristics of 291 preschool communities in nine U.S. cities. We find low to moderate correlations (r = −.03 to −.57) between iSNAP subscales and Census tract poverty, density, and crime, suggesting that the characteristics captured by the iSNAP are related to, yet ultimately distinct from, existing neighborhood structural measures. We find few positive associations between iSNAP community characteristics and 1,230 low-income preschoolers’ end-of-year outcomes. Specifically, resources for outdoor play (e.g., playgrounds, open fields) on school grounds predicted stronger child self-regulation skills, whereas global ratings of safety and care for both the school grounds and surrounding neighborhood predicted stronger approaches to learning skills. Indicators of physical order were not associated with child outcomes.
Keywords
As more and more children in the United States participate in publicly funded preschool (Friedman-Krauss et al., 2019), the field of early childhood education has become increasing invested in studying preschool quality as a means of promoting more positive and equitable outcomes for young children (Duncan & Magnuson, 2013). Much of this research has focused on identifying the characteristics within school walls that predict student learning and development, especially for low-income populations (Hanno et al., 2021; La Paro et al., 2012; Sabol et al., 2013; Sabol & Pianta, 2015). However, relatively less is known about the environments surrounding schools and whether they may also shape young children’s outcomes.
In the current study, we introduce the internet-based School Neighborhood Assessment Protocol (iSNAP), a virtual systematic social observation approach for operationalizing the physical features of young children’s preschool communities using Google Street View. Specifically, we use the iSNAP to quantify levels of safety, care, order, and resources in both the grounds and neighborhoods surrounding 291 preschools across nine U.S. cities. We then explore the extent to which these physical features of preschool communities measured by the iSNAP are associated with other neighborhood characteristics (i.e., poverty, density, crime), as well as with the learning and social-emotional outcomes of 1,230 low-income preschoolers. In exploring these questions, we aim to more explicitly characterize the experiences of low-income children outside of their school walls and, in doing so, push back against existing unidimensional and deficit-oriented portraits of low-income and minoritized neighborhood environments (Leventhal et al., 2015).
Communities as Central Contexts for Children’s Learning and Development
Over the past several decades, research from sociology, public health, and psychology has highlighted the ways in which neighborhood processes shape children’s outcomes. This work—which has focused almost exclusively on residential communities—has found that neighborhood structural characteristics such as poverty, density, and crime are robust predictors of child and adolescent outcomes, including higher rates of internalizing and externalizing symptoms, as well as lower prosocial behaviors, cognitive skills, and school achievement and attainment (Brooks-Gunn et al., 1993; Dubow et al., 1997; Dupéré et al., 2010; Elliott et al., 1996; Kohen et al., 2008; Leventhal & Brooks-Gunn, 2000; McCoy et al., 2015; Sampson & Groves, 1989).
However, a major limitation of the existing literature on neighborhood structural characteristics is that it paints a largely unidimensional and deficit-oriented portrait of communities based on their sociodemographic composition (Leventhal et al., 2015) and often fails to acknowledge how these characteristics are inextricably bound to sociohistorical and current realities regarding race and racism. In the United States, segregationist housing and zoning policies; uneven and lower-quality investments in low-income and racially minoritized neighborhoods; and discriminatory financial, labor, and real estate practices have led to persistent spatial inequalities in the opportunities available to children and families across communities (Sharkey & Faber, 2014). By ignoring these broader macrosystemic forces, research on neighborhood structural characteristics risks blaming low-income, racially minoritized residents for the challenges they face in their communities. Furthermore, characterizing neighborhoods based on their structural characteristics alone may falsely imply that low-income environments are monoliths characterized predominantly by high and homogenous levels of risk (Minh et al., 2017; Sharkey & Faber, 2014). In the present article, we attempt to move beyond the structural characteristics of children’s residential communities by considering a set of physical features emphasized in psychological and sociological theories as being more proximally relevant to children’s lived experiences. In doing so, our goal is to better characterize the heterogeneity of positive and negative experiences that low-income preschoolers have in their school communities (Jencks & Mayer, 1990; Leventhal & Brooks-Gunn, 2000; Shonkoff et al., 2000).
For the purposes of this study, we focus on two sets of physical characteristics that, although somewhat infrequently studied in the empirical literature, have been identified in neighborhood theory as relevant to children via their role in shaping social interactions (Leventhal & Dupéré, 2019). First, we build on social (dis)organizational models to consider neighborhood physical safety, care, and order as a set of factors that may enhance children’s sense of stability and security and minimize their exposure to environmental stressors (Bronfenbrenner & Morris, 1998; Evans, 2006; Ross & Mirowsky, 2001). Specifically, physical indicators of safety, care, and order have been shown to associate with neighborhood-level social processes that positively influence the moment-to-moment interactions that children have with adults, peers, and the physical environment (Bronfenbrenner & Morris, 2006; Burton & Jarrett, 2000; Leventhal & Brooks-Gunn, 2000; Sampson et al., 1997). Second, we build on neighborhood institutional models to consider the role that physical resources for play like playgrounds might have for providing children with positive spaces to learn and move (Duncan & Raudenbush, 1999; Jencks & Mayer, 1990; Leventhal & Brooks-Gunn, 2000). Indeed, video recordings have shown that availability of outdoor play resources (e.g., greenspace, playgrounds) can visibly enhance children’s social interactions and symbolic play and, in turn, their expressive language, self-regulation, attention, and behavior (McCormick, 2017; Miller et al., 2017).
Beyond their likely role in shaping children’s development, neighborhood physical characteristics are also more tangible compared to the structural characteristics often considered in neighborhood research (e.g., poverty, crime), making them potentially more modifiable targets for educational policy and intervention. Although it is increasingly clear that broader systemic changes are needed to more directly combat the root causes of spatial inequities (see, for example, Gennetian & Yoshikawa, 2021; Williams et al., 2019), place-based strategies that focus on physical features of communities are also gaining popularity as a narrower means for reducing opportunity gaps (C. Brown et al., 2019; Bustamante et al., 2019). The Urban95 initiative, for example, aims to reimagine cities from the viewpoint of the average 3-year-old (i.e., 95 centimeters tall), targeting an array of physical characteristics to make urban environments around the world safer and more child-friendly (Vincelot, 2019). Nevertheless, empirical evidence around which physical characteristics to prioritize in these interventions remains limited, potentially introducing inefficiencies in programmatic design. Indeed, officials interested in supporting child-friendly cities are often encouraged to use “kitchen sink” approaches to simultaneously target multiple community processes (e.g., safety, cleanliness, access to parks/playgrounds, etc.) at high cost (C. Brown et al., 2019). Further evidence demarcating the specific community characteristics that are most commonly observed in communities and/or linked with child outcomes could help to streamline these interventions, improving cost-benefit ratios and scalability.
Existing Approaches to Measuring Neighborhood Physical Characteristics
To measure neighborhood physical characteristics, researchers have historically relied upon primary data collection strategies such as systematic social observations (SSOs), which were popularized by sociologists in the late 1990s. In their seminal papers introducing the SSO, Sampson and Raudenbush (1999) used observers riding in SUVs to code the presence or absence of graffiti, garbage, abandoned cars, and litter as indicators of “physical disorder” across Chicago. These observed characteristics were found to correlate with residents’ perceptions of disorder and collective efficacy using survey data, as well as police-reported crime rates, even after controlling for community poverty (Raudenbush & Sampson, 1999; Sampson & Raudenbush, 1999). SSO research has since found additional associations between observed indicators of physical disorder and individuals’ violent victimization, fear of crime, reduced physical activity levels, and sexual risk taking (Molnar et al., 2004; Sampson et al., 2002).
A major limitation of traditional SSOs is that they are time- and resource-intensive to implement, limiting their utility in large-scale social science research. Fortunately, recent technological innovations have been used to “modernize” SSO methods, with several efforts in health and sociology using Google Street View as an unobtrusive, cost-effective replacement for in-person data collection (e.g., Bader et al., 2015; Kelly et al., 2012). For example, Odgers and colleagues (2012) used a virtual SSO in Google Street View to identify positive associations between residential neighborhood physical disorder (e.g., presence of garbage, abandoned cars) and 12-year-old British children’s antisocial behavior. Importantly, this virtual SSO also incorporated coders’ global ratings of neighborhood danger (i.e., whether they felt the neighborhood was overall “a safe place to live” or “somewhere they would feel safe walking at night”), which were found to predict local resident surveys of neighborhood problems/dangerousness and child antisocial behavior as or more strongly than observed indicators of disorder and decay. These early findings suggest that virtual SSOs may be a useful, scalable means for capturing both traditional, granular indicators of neighborhood physical characteristics, as well as the types of global ratings of neighborhoods previously used in community survey methods (Morenoff et al., 2001; Sampson et al., 1997). At the same time, this work also comes with the challenge of ensuring that such global ratings—which are inherently subjective in nature—are reliably able to capture neighborhood characteristics as opposed to the biases of individual coders who may not be from the communities they are rating.
Need for Measures of Preschool Communities
In the present study, we create a new virtual SSO to understand the physical characteristics of preschool communities, specifically. As more American children receive care outside of their homes (National Survey of Early Care and Education Project Team, 2016), preschool communities—including both the property on schools’ grounds, as well as the neighborhoods around them—are becoming increasingly salient contexts for learning and development (Dowda et al., 2009; Määttä et al., 2019). Nevertheless, school communities have historically been ignored in both the neighborhood literature (which has focused almost exclusively on residential communities) and in the early childhood education literature (which has focused almost exclusively on classrooms). Responding to this gap in understanding—as well as recent calls to understand and improve preschool quality in the United States (Barnett, 2013; Weiland, 2016)—the present study aims to extend the literature on residential neighborhoods to consider whether the physical characteristics of children’s school communities could provide as complementary indicators of preschool quality.
To date, only a handful of studies have explored preschool neighborhood structural characteristics (e.g., McCoy et al., 2015, 2021; Vaden-Kiernan et al., 2010; W. Wei et al., 2021), and even fewer have studied physical characteristics. A notable exception is work using the Early Childhood Environmental Rating Scale (ECERS; Harms et al., 1998), which includes several items about outdoor space and materials to support play. Although evidence on the links between the ECERS total score and child outcomes is weak at best (see Brunsek et al., 2017, for a review), prior work has shown that greater availability and size of playground equipment as measured by individual ECERS items may be associated with higher physical activity levels in young children, albeit with modest effect sizes (Dowda et al., 2009). Nevertheless, other important dimensions of school grounds—including levels of physical safety, care, and order—have not yet been systematically studied.
The Present Study
The present study builds upon recent developments in neighborhood measurement to introduce the iSNAP, a virtual SSO for measuring theoretically salient but understudied physical dimensions of young children’s preschool communities, including both their school grounds (i.e., the school building and its surrounding land) and school neighborhoods (i.e., the block encircling the school). We use the iSNAP to code the presence and absence of physical indicators (e.g., litter, landscaping, playground equipment, open fields) alongside coders’ global ratings of community characteristics within 291 preschool communities across nine U.S. cities from the National Center for Research on Early Childhood Education’s Professional Development Study (NCRECE PDS). After using factor analysis to confirm the structure of the iSNAP subscales, we test their interrater reliability, internal consistency, and concurrent validity relative to an established set of neighborhood structural measures, including Census poverty and population density, as well as police-reported homicide rates (Aim 1). Finally, using data from 1,230 low-income preschoolers participating in the NCRECE PDS, we test the extent to which iSNAP school community characteristics are predictive of young children’s end-of-year language and literacy, self-regulation, and approaches to learning outcomes, while controlling for a set of observed child- and neighborhood-level covariates (Aim 2).
By exploring these descriptive aims, we view this work as making several contributions to the existing literatures on education and neighborhoods. First, we introduce the iSNAP as a proof of concept for how education researchers might leverage freely available geospatial technology like Google Street View to produce more cost-effective and scalable measures of children’s learning environments, broadly defined. In particular, building on work from the ECERS, we expand existing models of early educational “quality” to quantify features of the environments outside of school walls that theory suggests may be relevant for children’s interactions and well-being. Second, we address recent calls in the neighborhood literature (e.g., Leventhal & Dupéré, 2019) to move beyond the structural characteristics of children’s residential communities to consider the physical characteristics of children’s preschool environments, which—despite their theoretical grounding and potential sensitivity to intervention—remain relatively understudied in the empirical literature. Unlike prior work that has largely considered low-income children’s neighborhoods as monoliths of risk, we also consider multiple physical characteristics (i.e., safety, care, order, resources) and settings (i.e., school grounds, school neighborhoods) simultaneously. In doing so, we aim to characterize children’s preschool environments more comprehensively and precisely, laying the foundation for future work that can causally identify the most cost-effective targets for place-based interventions.
Methods
Sample and Procedures
School address and child outcome data were drawn from the NCRECE PDS (Pianta & Burchinal, 2007–2011), a multiphase randomized control trial of two professional development interventions (a course and coaching) for early childhood teachers from nine U.S. cities across two cohorts beginning in 2008. To validate the iSNAP (Aim 1), we used the addresses of all standalone preschools and public elementary schools in which at least one NCRECE PDS teacher worked. For analyses predicting child outcomes (Aim 2), we focused only on schools participating in Phase II of the NCRECE PDS (the coaching phase), as this was the first phase in which child outcome data were available. (The NCRECE PDS did not collect child outcome data during Phase I, the course phase.)
Child outcomes were reported by teachers or collected by trained data collectors in quiet settings within children’s schools in either English or Spanish at the end of Phase II, which corresponded to the spring of either the 2009 or 2010 school year, depending on cohort. School addresses were geocoded using ArcGIS software (version 10.5; ArcGIS, 2017). School community physical characteristics were coded using the iSNAP at the level of the school, as each school was considered to have its own school community (i.e., school grounds & school neighborhood). School addresses were also matched with neighborhood structural characteristics based on their Census tract.
A total of 291 schools with teachers who participated at any point in the NCRECE PDS were used to validate the iSNAP (Aim 1). Schools in our sample predominantly served low-income children from nine midsized, sociodemographically diverse U.S. cities (M number of schools per city = 32.33; SD = 17.10; range = 11 to 67): New York City, NY, Hartford, CT, Chicago, IL, Stockton, CA, Dayton, OH, Columbus, OH, Memphis, TN, Charlotte, NC, and Providence, RI. Schools were embedded in 260 Census tracts with an average household poverty rate of 30.39 percent (SD = 15.07; range = 2.40 to 70.50), an average population density of 19,182.66 people per square mile (SD = 27,624.02; range = 0.46 to 144,200.00), and an average annual crime rate of 25.13 homicides per 100,000 people (SD = 28.27; range = 0 to 150.83). The majority of participating schools were Head Start programs (59.23%), whereas 39.83 percent were located in public elementary schools.
Child outcome data were available for 1,230 children within 195 of the 291 NCRECE PDS schools (67.01%). This sample was used for analyses using iSNAP scores to predict child outcomes (Aim 2). On average, the 1,230 children included in this sample were 4.18 years old (SD = 0.46; range = 2.65 to 5.10) at the start of the academic year (September 1), and just under half (49.19%) were male. A total of 46.12 percent of children were Black, 34.46 percent were Latino/a, 11.16 percent were White, and 8.26 percent were categorized as representing another racial/ethnic group. Children’s average income-to-needs ratio was 1.11 (SD = 1.00; range = 0.06 to 5.07), indicating that most children were from poor or low-income households. Table 1 includes additional descriptive statistics on sample neighborhoods, schools, and children. Table S1 in the online supplemental material (OSM) includes details about the differences between schools with and without child outcome data.
Descriptive Statistics of Analytic Sample

Measures
iSNAP
Development
We developed a preliminary version the iSNAP using three item sources. First, we drew from existing literature to identify neighborhood physical features that have been previously linked with children’s development. For example, given the prevalence of literature on physical order, we included items targeting physical indicators such as graffiti or presence of pedestrian crosswalks (Leventhal & Brooks-Gunn, 2000; Odgers et al., 2009; Perkins & Taylor, 1996; Sampson & Raudenbush, 1999). Second, we included items from the virtual SSO by Odgers and colleagues (2012), which we adapted to enhance relevance for the U.S. context (e.g., removing reference to “pubs” or “council estates”) and school communities (e.g., expanding global ratings to ask whether the coder would send his/her child to the school). Third, after conducting hundreds of exploratory “virtual walks” in Google Street View, we generated novel items reflecting school community features that we thought may be salient for children and that we observed to vary across communities (e.g., the presence of playground equipment, content of billboards).
We piloted these initial items in a small set of NCRECE PDS school communities, reviewing data on interrater reliability for individual items across five study coders. After this pilot, we revised and added new items to improve internal consistency, relevance, objectivity, conceptual breadth and depth, and item variability. For example, consistent with best practices in the field (e.g., AERA et al., 2014), to improve internal consistency we added new items that used different terminology or approaches to target similar phenomena (e.g., items on both small pieces of litter and larger abandoned materials).
Items
Table S2 in the OSM shows the final set of iSNAP items coded in the present study. Items were divided into four sections. The first included 15 global rating questions that coders answered following a single walk around the neighborhood and viewing of the school grounds. These items asked coders about their overall impressions (e.g., “the school neighborhood appears well cared for”; “I would send my child to this school”). The second section included 38 items targeting the school grounds (e.g., presence/absence of student work in school windows, playing fields, graffiti, murals; general condition of structures). The third section included 36 items on the school neighborhood (e.g., presence/absence of pedestrian crosswalks, abandoned cars, billboards; quality and upkeep of buildings, yards, sidewalks). The final section included 11 administrative questions (e.g., year of Google Street View observation used). iSNAP items differed in their response scale, with most using either 0/1 (e.g., absent/present) or Likert-type scales (e.g., 1–5).
Training
iSNAP coders included 11 undergraduate and graduate students recruited to represent different disciplinary, geographic, and sociodemographic backgrounds. Coders were trained over two sessions totaling 5 hours. During Session 1, coders were introduced to the concept of an SSO and to the iSNAP’s school grounds codebook and items. In Session 2, coders were introduced to the iSNAP’s school neighborhood codebook and items. All coders practice coded five school communities, with around 80% agreement between the ratings of the trainees and the master coder.
Coding
As noted above, the iSNAP includes items targeting school grounds—the school building and surrounding land belonging to the school (e.g., athletic fields, playgrounds, parking lots, temporary classrooms)—and school neighborhoods—all property (excluding the school grounds) that can be observed from the streets in the one-block perimeter surrounding the school. Coders were provided with PDF maps tracing the school grounds and neighborhood (see Figure 1), which were developed independently by a single research coordinator to ensure consistency. All iSNAP items were independently coded for each school community by two randomly assigned coders, which allowed for exploration of interrater reliability while helping to ensure that error introduced by individual coders’ biases was randomly distributed across the dataset.
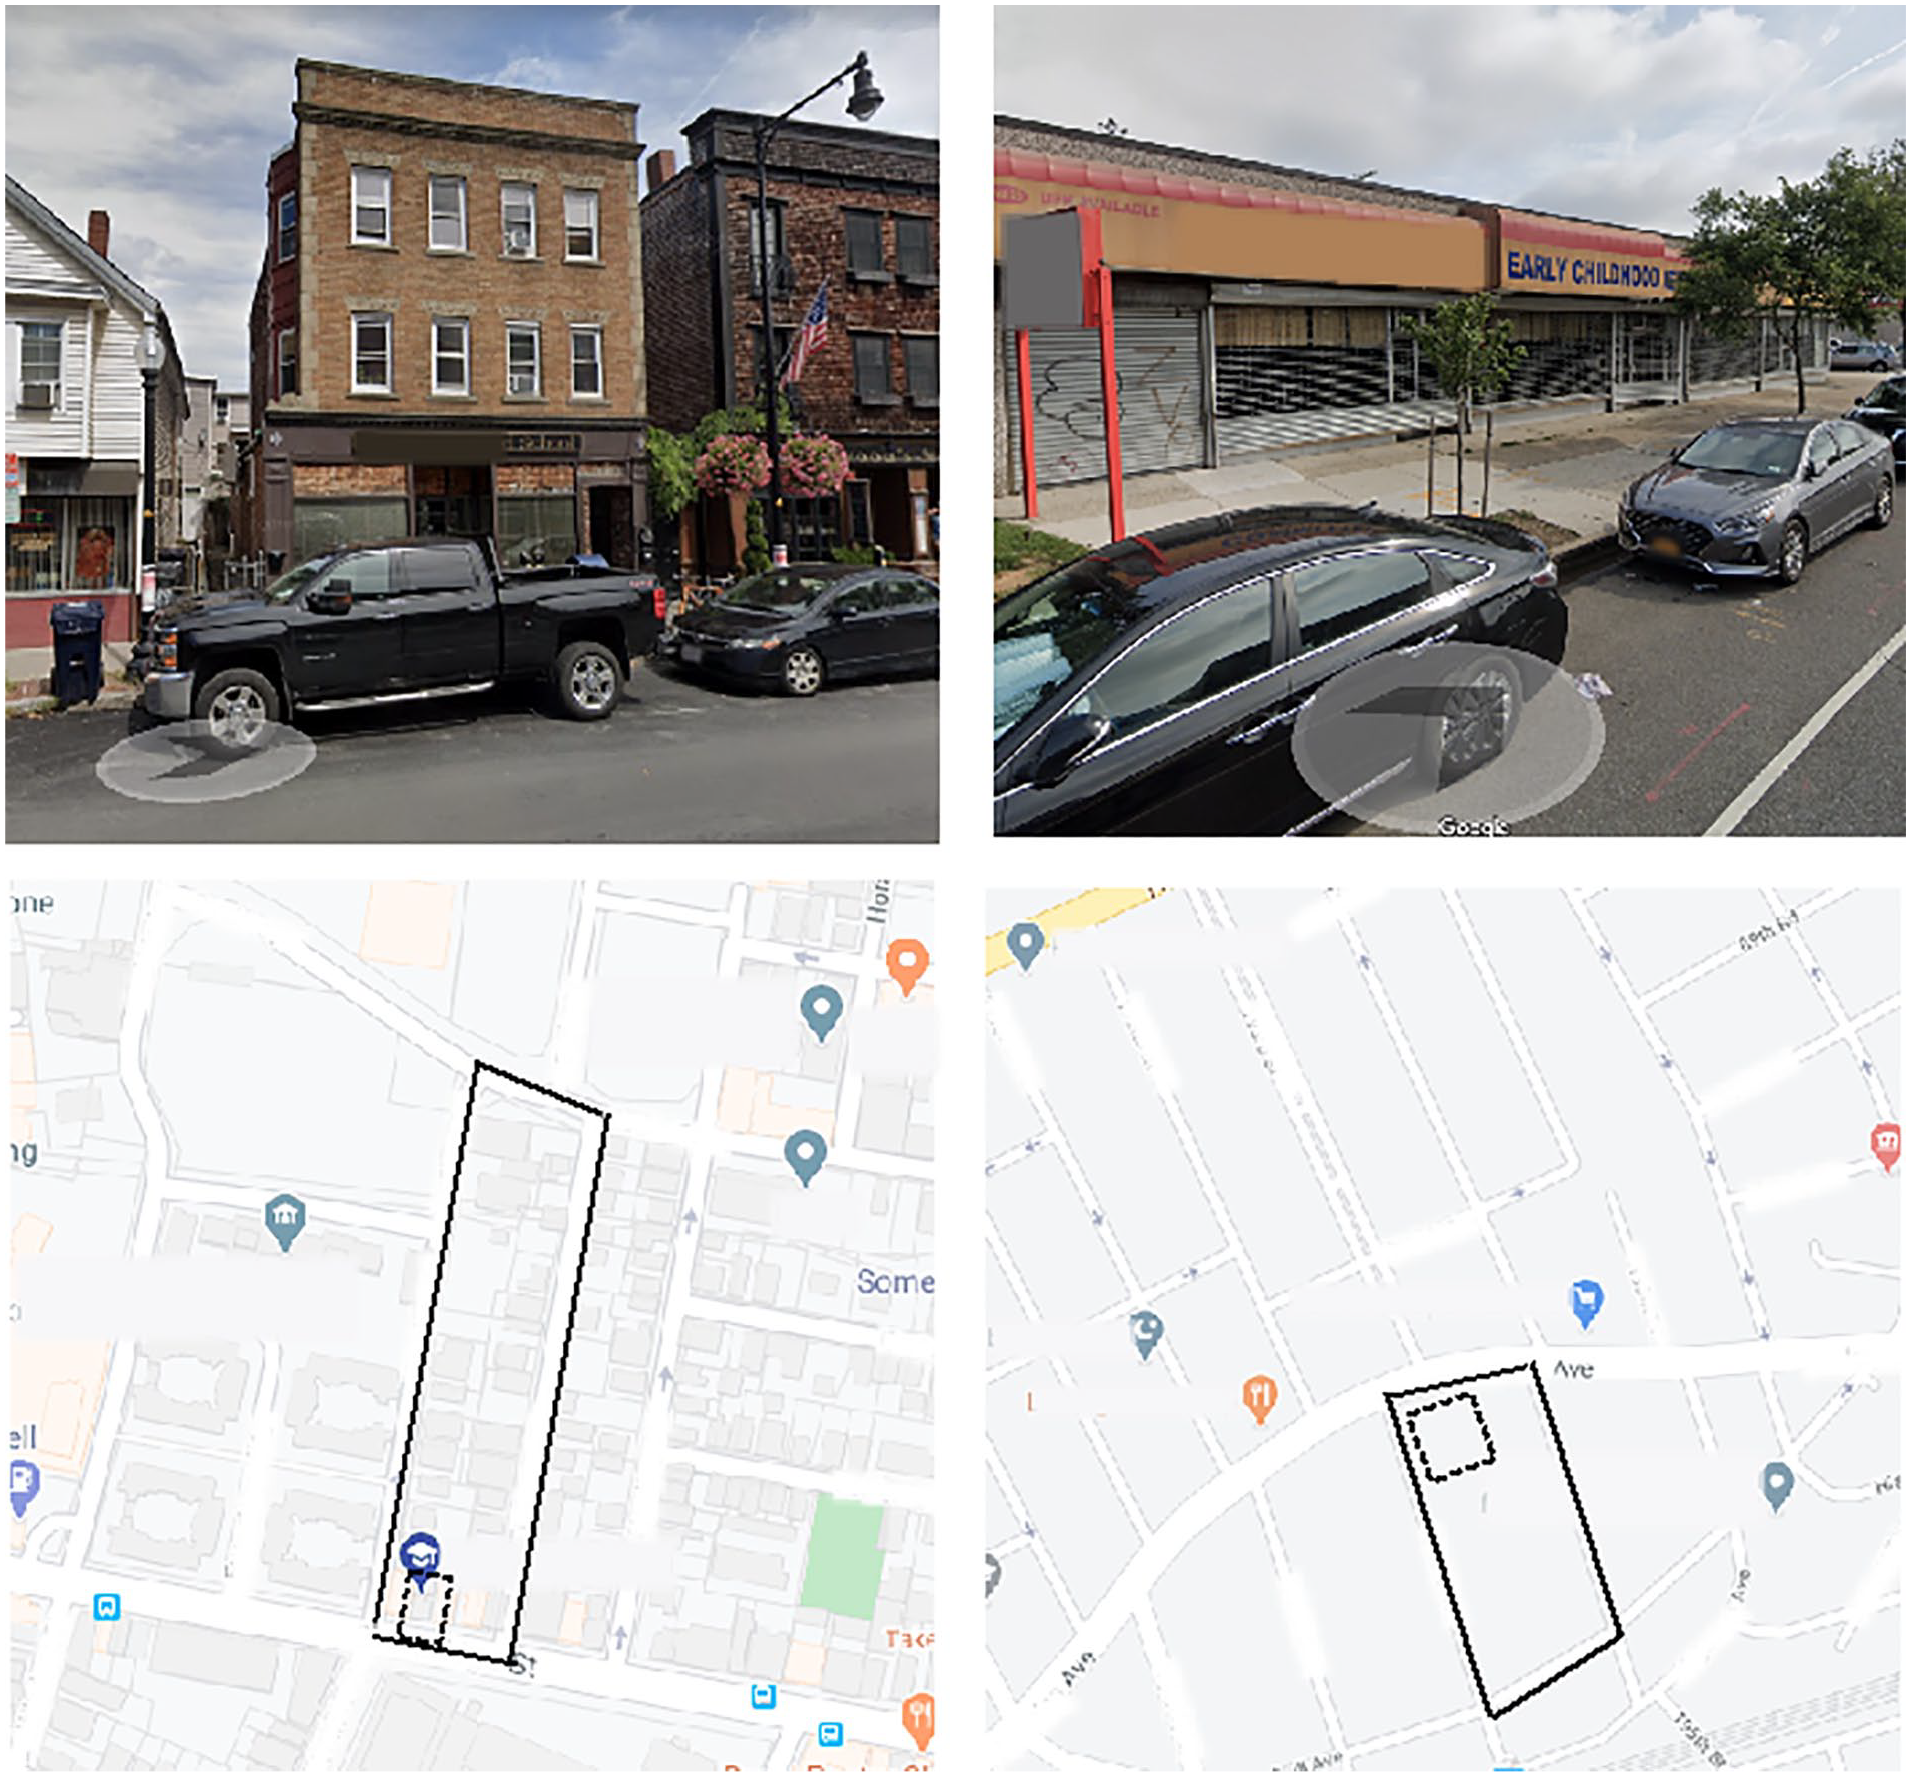
Screen shots and maps of school communities.
To begin, coders input the school’s address into Google Street View and placed themselves in front of the school entrance. They then used the historical feature to go back to the time point closest to 2007, which marked the year prior to the start of the NCRECE PDS study. Coders circled and zoomed in Google Street View as much as needed to provide a comprehensive view of the school grounds and neighborhood. Coding of each school community took approximately one hour. All materials necessary for coding the iSNAP (e.g., user guide, codebook, sample codes) are included in Appendices A through D of the OSM.
Child outcomes
Language/literacy
Four tasks measured children’s language and literacy outcomes: the Peabody Picture Vocabulary Test of receptive vocabulary (Dunn & Dunn, 1997); the Woodcock-Johnson-III Picture Vocabulary task of expressive vocabulary (Woodcock et al., 2001); the Test of Preschool Early Literacy (TOPEL) Phonological Awareness task of word elision and blending ability; and the TOPEL Print Knowledge task of alphabetic knowledge, written language conventions, and writing skills (Lonigan et al., 2007). Each of these four measures was standardized and averaged into a single score representing children’s aggregate language and literacy skills (α = .80). Confirmatory factor analysis confirmed the goodness of fit and factor loadings of a four-indicator model of language and literacy. (Contact first author for details.)
Self-regulation
Self-regulation was assessed using the Pencil Tap (Smith-Donald et al., 2007), which captures inhibitory control by asking children to tap a pencil once when the assessor taps twice and vice versa. Scores on the Pencil Tap represented the proportion of correct responses out of 16 trials (α = .92).
Approaches to learning
Approaches to learning were reported by teachers using the 29-item Preschool Learning Behaviors Scale (PLBS; McDermott et al., 2000), which reflects children’s competence motivation, attention persistence, and attitude toward learning. Items were scored using a 0 (doesn’t apply) to 2 (most often applies) scale and summed such that higher scores represented more positive approaches to learning (α = .85).
Neighborhood structural characteristics
School neighborhood poverty was represented by the proportion of households within the school’s Census tract that fell below the U.S. poverty threshold using averaged data from the 2005 to 2009 American Community Survey (ACS; U.S. Census Bureau, 2009). The 2010 Decennial Census was used to capture school Census tract population density (individuals per square mile; U.S. Census Bureau, 2010). School neighborhood crime was measured using the Washington Post’s crime database, which includes police-reported homicide data for 55 U.S. cities (Washington Post, 2018). We geocoded the location of all homicides that occurred between 2007 and 2009 in the five NCRECE PDS cities with available data: Charlotte, Chicago, Columbus, Memphis, and Stockton. Homicide rates were calculated by dividing the average number of annual homicides that occurred within the school’s Census tract during this 3-year period by the total population (in units of 100,000) according to ACS estimates.
Child-level covariates
Child-level covariates were reported by the primary caregiver and included children’s age, sex, race/ethnicity, household income-to-needs ratio, and whether or not the child spoke English at home.
Analytic Plan
Validating the iSNAP (Aim 1)
We used several steps to examine the factor structure, reliability, and validity of the focal iSNAP subscales. First, we eliminated items showing little variability (i.e., items in which the target object was identified in <2% of schools) or selective missingness (i.e., items that were missing or not observable for >10% of schools). Second, we used a Q-sort procedure with three to six research team members to group iSNAP items into theoretically motivated constructs (Nahm et al., 2002), eliminating items that did not fall into these construct groupings. Third, we conducted confirmatory factor analyses (CFAs) in Mplus (version 8.1; Muthén & Muthén, 1998–2017) to confirm the factor structure of the subscales generated by the Q-sort. Because all iSNAP items were double coded, we created two separate datasets by randomly selecting one coder’s scores for each. We used results of a CFA in the first dataset to modify our models (e.g., drop items with standardized factor loadings <.30, include error covariances based on modification indices when conceptually appropriate) and refit these modified models in the second dataset. Model fit was considered appropriate if the root mean square error of approximation (RMSEA) was less than .08, the comparative fit index (CFI) and Tucker Lewis index (TLI) were .90 or greater, and the standardized root mean square residual (SRMR) was less than .08 (Hu & Bentler, 1999). (For models with binary indicators, we evaluated the weighted root mean square residual, or WRMR, instead of the SRMR.)
Fourth, we rescaled individual items within each subscale to be on the same response scale (e.g., rescaling Likert scale items so that they ranged from 0 to 1) and to ensure that higher scores reflected more positive characteristics, and then averaged items across coders and within subscales within the full dataset. We chose to use item averages given their interpretability and ease of replicability in future research. Nevertheless, we note that our observed subscale average scores were highly correlated (r > .90) with the factor scores generated through CFA. Results of sensitivity analyses using observed factor scores were also highly similar to primary results (see Tables S3 and S4 in the OSM for details).
Fifth, we examined the interrater reliability and internal consistency of the newly created subscales. Interrater reliability was examined using bivariate correlations between observed subscale scores across coders and unconditional intraclass correlations (ICCs) representing the proportion of total variance in subscale scores between groups (school communities). ICCs of <.50 were considered poor reliability, .50 to .75 were considered moderate, .75 to .90 were considered good, and >.90 were considered excellent (Koo & Li, 2016). Internal consistency was examined using Cronbach’s alpha for each subscale.
Finally, we assessed concurrent validity within the full dataset by examining the bivariate correlations between the observed scores of the iSNAP subscales and existing neighborhood structural measures (i.e., poverty, density, homicide). These analyses were conducted in Stata (version 15; StataCorp, 2017).
Using the iSNAP to predict child outcome (Aim 2)
To examine whether the iSNAP subscales predicted child outcomes, we used a series of two-level linear regression models with children nested in schools. These models also included city fixed effects. (See Table S5 in the OSM for the ICCs of child outcomes within schools and cities.) In the first of these models, children’s outcome scores at spring of their preschool year were regressed one by one on their school communities’ iSNAP subscale scores. Although causal inference is notoriously difficult to establish in neighborhood research (see Leventhal & Dupéré, 2019, for a discussion), our second set of models attempted to minimize omitted variable biases by controlling for neighborhood-level structural characteristics (poverty, density, homicide), child-level covariates (age, sex, race/ethnicity, mother’s years of education, household income-to-needs ratio, home language), and teachers’ treatment status in the NCRECE PDS (i.e., a binary indicator for whether the child’s teacher participated in the course and/or coaching interventions). Despite the inclusion of these covariates, we acknowledge that the results of our Aim 2 analyses are descriptive in nature, as they likely fail to account for other important confounds (e.g., residential neighborhood characteristics, systematic discrimination). These analyses were also conducted in Stata.
Missing Data
Table 1 shows the rates of missing data in the sample. No schools were missing data on the iSNAP. Missingness rates for child-level covariates ranged from 0 to 9.02 percent. No neighborhoods were missing data on density, and 1.03 percent of neighborhoods were missing data on poverty. Neighborhood crime had a particularly high rate of missingness (47.04%) due to the availability of these data in only five of the study’s nine cities. To handle missing covariates in Aim 1 analyses examining concurrent validity, we used listwise deletion. For Aim 2, we used multiple imputation by chained equations (MICE) to create 20 datasets with complete covariate information. Children’s outcome information was not imputed. Because children were nested within school neighborhoods, we first imputed school/neighborhood variables so that each observation represented one of the 195 schools with child outcome information. We then imputed missing child-level covariates at the child level. These school- and child-level datasets were merged for Aim 2 analyses. Results of Aim 2 analyses using complete case analysis (i.e., listwise deletion of cases with missing values) were largely consistent with the main findings (see Table S6 in the OSM).
Results
Validating the iSNAP (Aim 1)
Descriptive statistics showed low levels of variability for three iSNAP items (e.g., no schools had broken windows) and high levels of systematic missingness for an additional 10 items (e.g., specific playground features were frequently missing since many schools did not have visible playgrounds). These 13 items were therefore removed from further consideration in the Q-sort process, which revealed the emergence of constructs related to safety, care, order, and recreational resources in the remaining items. Specifically, using the Q-sort process, 36 iSNAP items were grouped into five different subscales, three of which reflected characteristics on the school grounds and two of which focused on the school neighborhood. Building from work by Odgers and colleagues (2012), global ratings of safety and care captured coders’ overall impressions of both the school grounds (e.g., “I would send my child to this school”) and the school neighborhood (e.g., “the proximal neighborhood appears well cared for”) after a single walk around the school community. In line with previous research on neighborhood (dis)order (Evans, 2006; Leventhal & Brooks-Gunn, 2000; Ross & Mirowsky, 2001), indicators of physical order included items representing the presence/absence and quality of various positive and negative features (e.g., litter, landscaping, bars on windows, graffiti) in both the school grounds and the school neighborhood. Finally, resources for outdoor play focused on the availability of spaces and materials for play (e.g., playground, open field, paved area) on the school grounds only. Items not reflecting these core constructs (e.g., neighborhood land use, neighborhood businesses and resources, messaging/advertisements, etc.) were excluded from further consideration in the present study.
To explore the fit of these subscales to our data, we began with a CFA in a dataset formed by randomly selecting one of the two coder scores for each item, which showed mixed evidence for model fit. After dropping poorly loading items and including error correlations amongst a select set of items that shared likely sources of variance unrelated to the latent construct of interest (e.g., amongst items with similar wordings; T. Brown, 2015), model fit improved. (Contact first author for full results of these split-half CFAs.) Results of the final set of CFAs within the dataset formed by averaging coders’ scores are shown in Table 2. CFAs in this overall dataset revealed adequate standardized factor loadings (all >.30) and, with some exceptions (e.g., a somewhat elevated RMSEA in the school neighborhood subscales), adequate model fit.
Confirmatory Factor Analysis, Reliability Analysis, and Descriptive Statistics for iSNAP Subscales (N = 291 School Communities)

Note. Full item wording available in Table S2 in the OSM. Original item scale noted in parentheses after item description; (r) indicates item that has been reverse coded so that higher scores represent a more positive score. In calculating sum scores for the iSNAP constructs, all scores were rescaled to 0–1 for the Indicators of Physical Order subscales. RMSEA = root mean square error of approximation; CFI = confirmatory fit index; TLI = Tucker-Lewis index; SRMR = standardized root mean square residual; ICC = intraclass correlation.
After generating observed scores for each iSNAP subscale, we then explored evidence for different forms of reliability, which are detailed at the bottom of Table 2. iSNAP subscale correlations ranged across coders from .77 (for resources for outdoor play in the school grounds) to .85 (for indicators of physical order in the school grounds), indicating relatively strong agreement. ICCs at the subscale level were moderate, ranging from .53 (for global ratings of safety and care in the school grounds) to .66 (for indicators of physical order in the school grounds). In general, ICCs were somewhat lower for the more subjective global ratings of safety and care (M ICC = .55) than they were for the more objective indicators of physical order and resources for outdoor play (M ICC = .63), although correlations amongst coder scores were generally similar across these categories (M r = .80 vs. .81, respectively). Finally, internal consistency was acceptable for all subscales, ranging from .71 (for resources for outdoor play) to .94 (for global ratings of safety and care in the school neighborhood).
Lastly, Table S7 in the OSM shows child-level correlations between iSNAP school community characteristics and other key study variables. Figure 2 and Table S8 in the OSM show the neighborhood-level correlations between iSNAP subscales and neighborhood structural measures, including Census tract poverty rates, population density, and homicide rates. Neighborhood poverty was moderately and negatively associated with both global ratings of safety and care and indicators of physical order in the school neighborhood (r = −.44 and −.43, respectively, p < .001). Associations between neighborhood poverty and school grounds characteristics were less strong, at −.27 (p < .001) for global ratings of safety and care, −.20 (p < .001) for indicators of physical order, and just −.03 (p = ns) for resources for outdoor play. Population density was moderately negatively correlated with global ratings of safety and care and indicators of physical order in both the school grounds and neighborhood (r = −.42 to −.57, p < .001). We observed a smaller negative correlation between population density and resources for outdoor play (r = −.22, p < .001). Finally, homicide rates were less strongly associated with the iSNAP subscales than either neighborhood poverty or density, with correlations ranging from −.07 (p = ns) for resources for outdoor play to −.22 (p < .01) for indicators of physical order in the school neighborhood.

Correlations between iSNAP school community characteristics and neighborhood structural measures (N = 291 school communities).
Using the iSNAP to Predict Child Outcomes (Aim 2)
Table 3 presents the results of multilevel regression models predicting child outcomes as a function of school community characteristics measured by the iSNAP. Each cell in Table 3 represents the coefficient of an iSNAP subscale score from a different regression model, accounting for covariates or not. We focus here on the results of our models that include child- and neighborhood-level covariates given that they are somewhat less prone to selection bias. Of the 15 associations tested (5 iSNAP subscales × 3 child outcomes), just three statistically significant findings (p < .10) were observed. In particular, global ratings of safety and care in both the school grounds and the school neighborhood were positively and significantly associated with children’s approaches to learning. In particular, each one-unit increment (out of five) in the global rating of either the school grounds or neighborhood was associated with 0.15 SDs higher scores in children’s approaches to learning. We also observed a positive, marginally significant relation between resources for outdoor play in school grounds and children’s self-regulation. For these results, children attending schools with all measured resources for play were expected, on average, to score approximately 0.19 SDs higher in self-regulation than their peers from schools with no resources. No other statistically significant associations between iSNAP subscales and child outcomes were observed in the models with covariates. Furthermore, pseudo-R2 values calculated as the difference in school-level variance explained before and after including the iSNAP subscales were small across all models (range = .00−.08). Pseudo-R2 values calculated from the fully controlled and unadjusted models indicated covariates accounted for a sizable proportion of between-school variation in child outcomes (range = .31−.91).
Results of Multilevel Linear Regression Models Predicting Child Outcomes from iSNAP School Community Characteristics (N = 1,230)
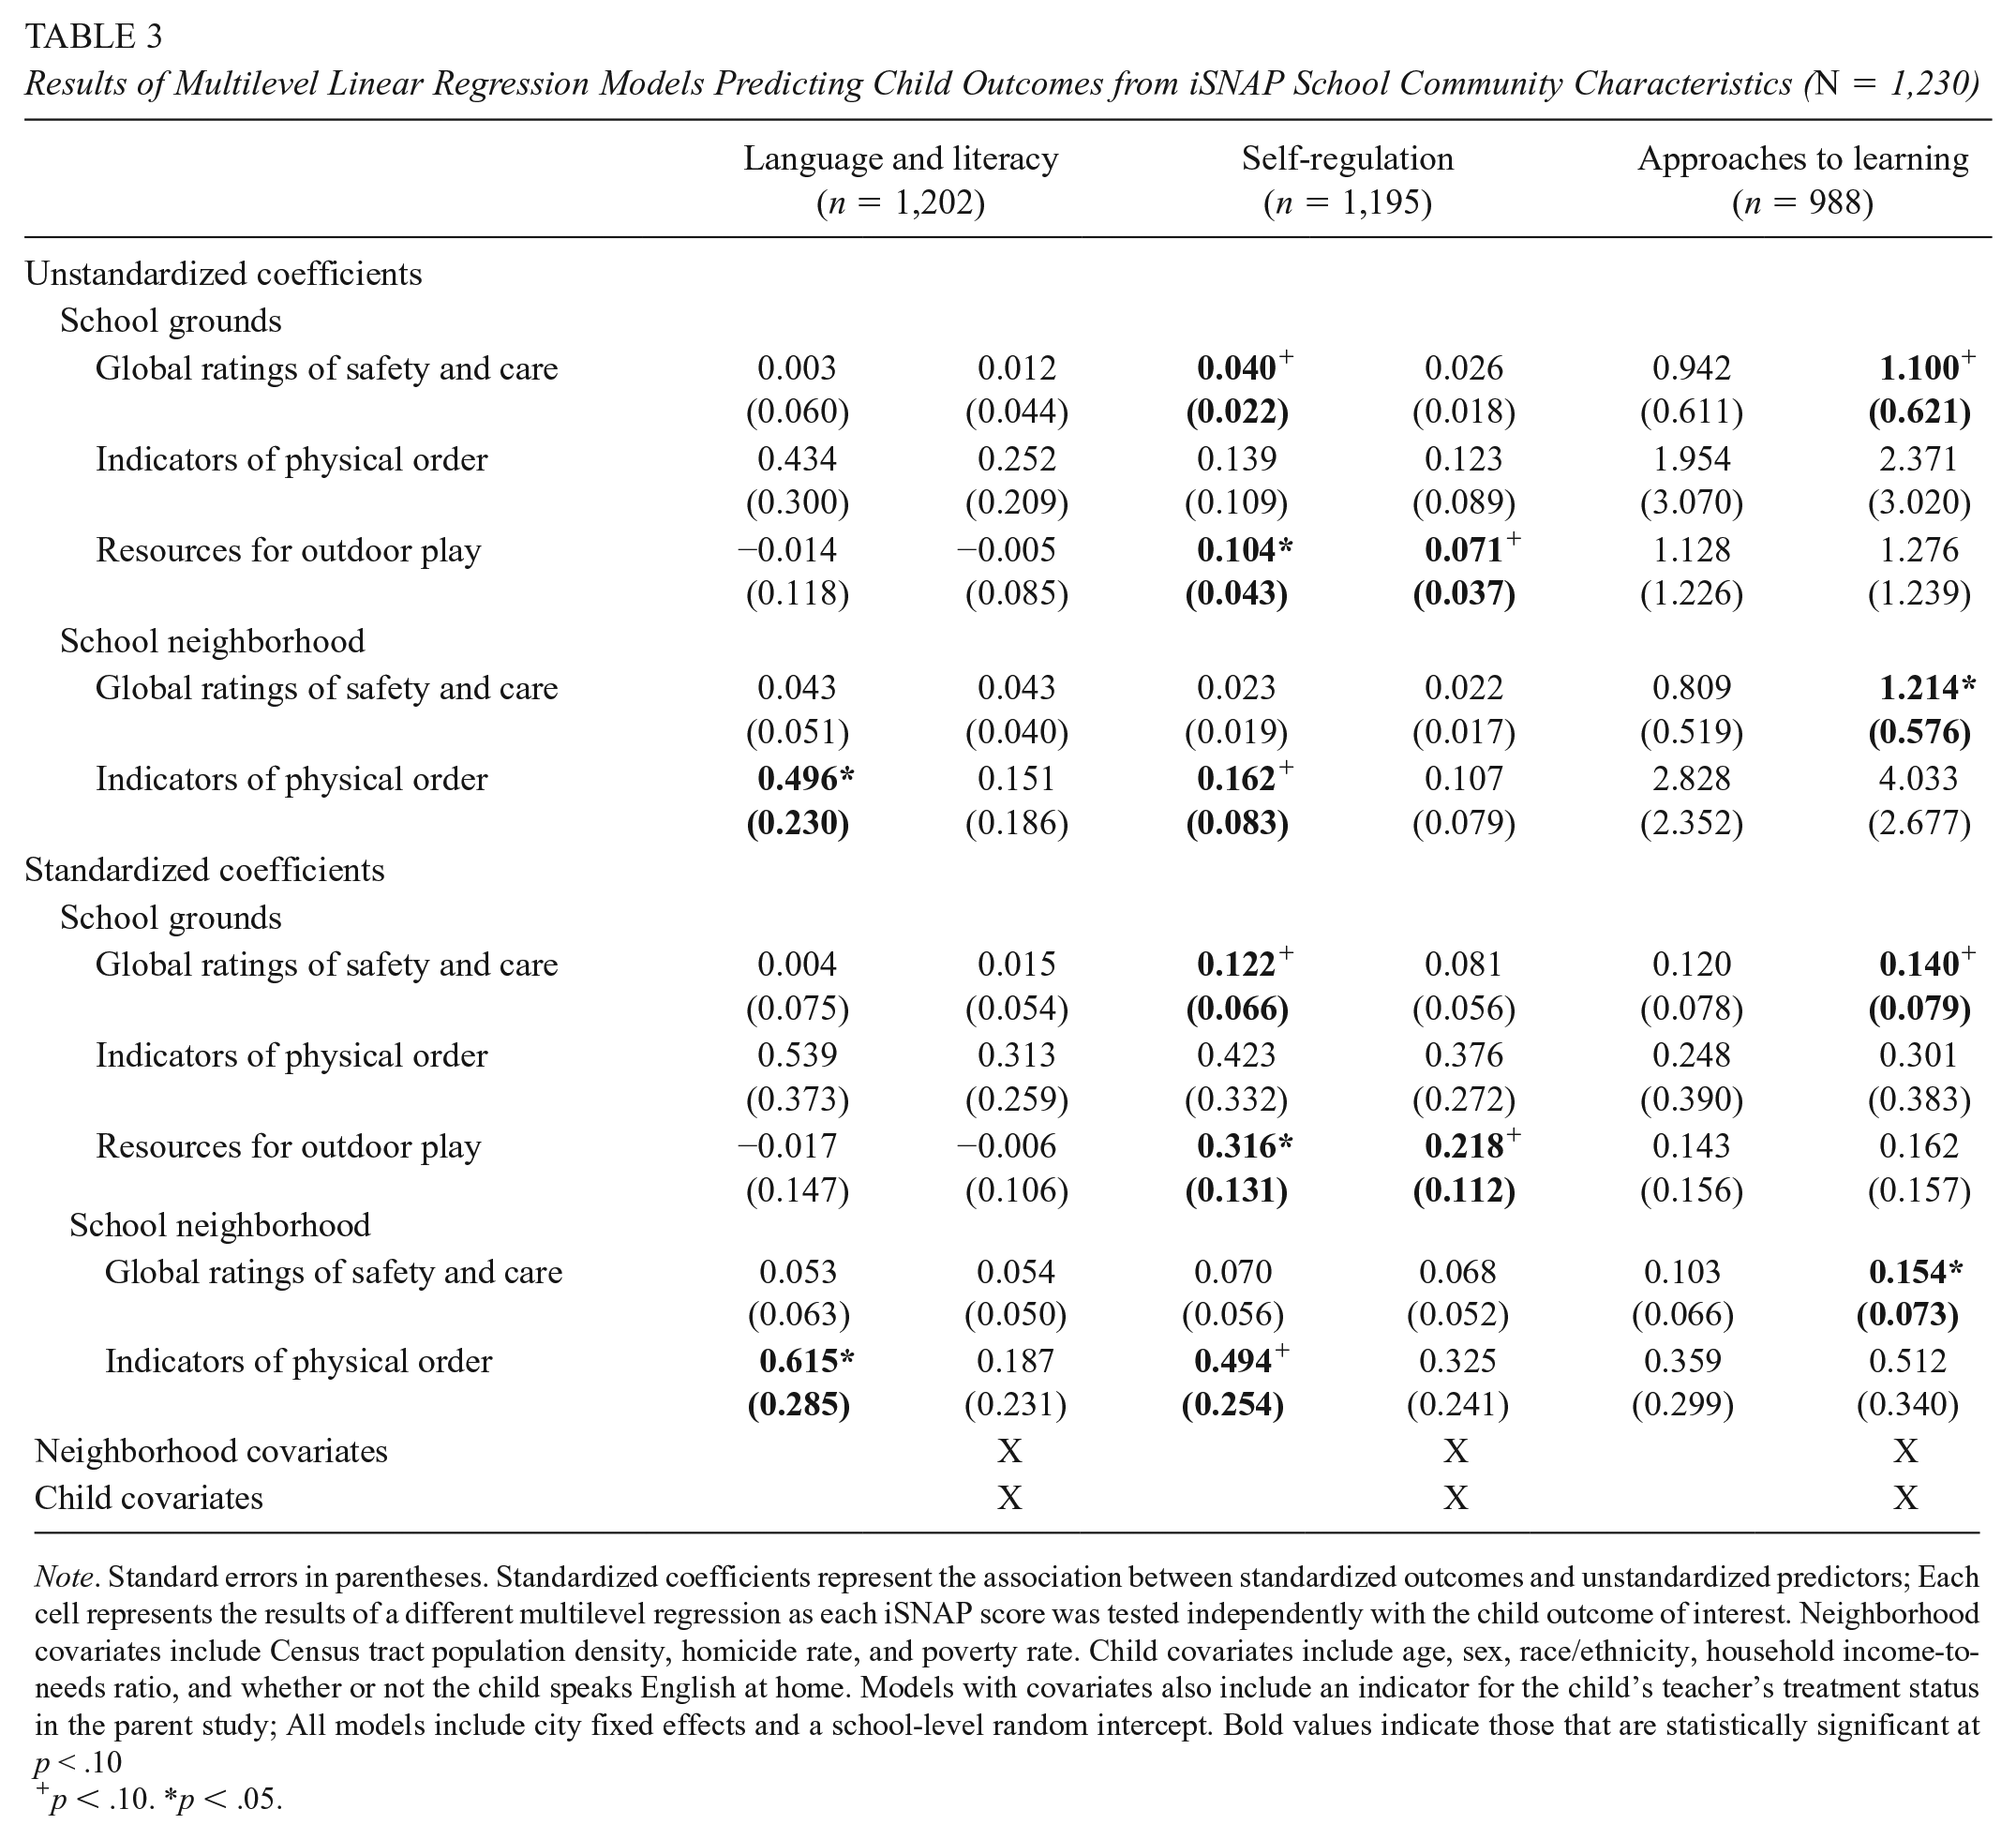
Note. Standard errors in parentheses. Standardized coefficients represent the association between standardized outcomes and unstandardized predictors; Each cell represents the results of a different multilevel regression as each iSNAP score was tested independently with the child outcome of interest. Neighborhood covariates include Census tract population density, homicide rate, and poverty rate. Child covariates include age, sex, race/ethnicity, household income-to-needs ratio, and whether or not the child speaks English at home. Models with covariates also include an indicator for the child’s teacher’s treatment status in the parent study; All models include city fixed effects and a school-level random intercept.
Bold values indicate those that are statistically significant at p < .10
p < .10. *p < .05.
Discussion
In this study, we present a new virtual tool for quantifying the physical features of young children’s school community contexts—including both the grounds and neighborhoods immediately surrounding their school buildings—and link these characteristics with both the structural characteristics of school neighborhoods and low-income preschoolers’ language and literacy, self-regulation, and approaches to learning outcomes. In doing so, this descriptive work is intended to set the stage for a new body of research that can reliably measure children’s school communities as additional key contexts for interaction, learning, and development.
Our results suggest that the iSNAP may serve as a reliable and valid means for measuring several physical dimensions of school communities that are currently underrepresented in the neighborhood and educational literatures. First, similar to prior SSO approaches in residential contexts, we used the iSNAP to capture indicators of physical order in both school grounds and neighborhoods using items targeting the presence of positive characteristics like landscaping, the absence of negative characteristics like graffiti and litter, and the general condition of buildings. Our results show that coders were able to reliably identify these indicators of physical order in school communities using the online platform of Google Street View in ways that were related to—but ultimately distinct from—established measures of neighborhood structural characteristics (i.e., poverty rates, population density, and homicide rates). As such, the iSNAP may provide as a relatively scalable and easy-to-use alternative to traditional SSO methods for characterizing heterogeneity in the indicators of physical order that prior work in residential communities has linked with community-level social interactions (e.g., Odgers et al., 2012; Raudenbush & Sampson, 1999; Sampson & Raudenbush, 1999).
Importantly, however, after controlling for a basic set of child- and neighborhood-level covariates, we did not find that the indicators of physical order captured by the iSNAP were predictive of any of the three child outcomes studied. These findings convey a different story than the extant literature on residential neighborhood physical (dis)order, which has previously shown links with adolescent behavior, risk taking, and health (Furr-Holden et al., 2012; Hill & Angel, 2005; Milam et al., 2012). On one hand, it is possible that indicators of physical order are less salient in school versus residential neighborhoods, for academic and social-emotional versus health outcomes, or for young children versus adolescents or adults. On the other hand, it is also possible that the existing evidence base on physical (dis)order has overestimated its association with individual outcomes through failing to account for potential confounding characteristics (Leventhal & Brooks-Gunn, 2000). Indeed, this hypothesis is consistent with the fact that we do observe associations between indicators of physical order and children’s language/literacy and self-regulation outcomes in our uncontrolled models, just not our controlled ones. Future research combining more internally valid study designs with a wider range of data is needed to understand the robustness of associations between physical order and children’s learning, as well as with more proximal outcomes such as adult-child interactions, child exploration and play, and community social processes.
Second, we also found evidence for the reliability and validity of a set of items capturing available resources for outdoor play on school grounds, including the presence of playgrounds, open fields, and paved play areas. Prior research has demonstrated that the availability of play-related equipment is positively associated with preschoolers’ physical activity (Määttä et al., 2019). In turn, active play has been shown to strengthen regions of the brain that are associated both with motor coordination and cognitive control (Becker et al., 2014; Best, 2010; Burdette & Whitaker, 2005). Consistent with these findings, the present study identified significant positive associations between the resources for outdoor play on school grounds and preschoolers’ performance on a self-regulation task of inhibitory control at the end of the school year. Collectively, these results highlight the provision of outdoor resources for play as one potential means of supporting self-regulation during the developmentally sensitive preschool period, as well as the importance of considering play-related equipment on school grounds as a potential marker of educational quality. Nevertheless, given the descriptive nature of this study and the lack of robust associations between resources for outdoor play and other child outcomes, further research is needed to establish these links before making explicit practice-related recommendations.
Finally, building on community survey methods and a virtual SSO by Odgers and colleagues (2012), we took a broader view of neighborhood conditions by asking coders to report on their global ratings of safety and care of school communities, such as whether they might feel safe letting a child walk alone in the environment or the extent to which the school neighborhood is well cared for. Although we acknowledge the subjectivity of these ratings (and subsequent potential for observer biases to introduce error into estimates), our results showed that coders were able to provide global ratings of safety and care that were relatively similar in their reliability to the more objective indicators of physical order and resources for outdoor play. Furthermore, we found that children attending schools whose grounds and surrounding neighborhoods were scored by coders as high in overall safety and care tended to be rated by their teachers as showing greater approaches to learning, including their motivation, attention persistence, and attitudes toward learning. This finding is similar to prior research from the residential SSO literature, which has shown that children living in communities perceived to be low in safety were rated by parents and teachers to have higher levels of antisocial behavior (Odgers et al., 2012). Future research is needed to examine the biological and social mechanisms that may explain these associations. Work is also needed to understand why coders’ more holistic impressions appear to contribute different information than that provided by more objective coding of specific physical indicators, as well as whether coders’ perceptions align with those of actual neighborhood residents (Ndjila et al., 2019).
Overall, it is important to note that the majority of associations tested between the iSNAP and children’s outcomes were null. On the one hand, this general lack of differences in child outcomes could suggest that the school community characteristics measured by the iSNAP are not salient—or, at the very least, less salient than other contextual factors—for promoting children’s language and literacy, self-regulation, and approaches to learning outcomes. On the other hand, it is possible that the present study was underpowered to capture the likely small associations between children’s school community experiences and outcomes. Indeed, Leventhal and Dupéré (2019) concluded in their recent review of the literature that the role of neighborhoods in shaping child outcomes is “quite modest” (p. 160), with neighborhood socioeconomic status typically accounting for less than 10% of the variation in children’s outcomes. This conclusion is also consistent with research using SSOs in residential neighborhoods, which has shown bivariate associations between neighborhood characteristics and child outcomes of around .10 or below (Odgers et al., 2012). Although research using larger and more representative samples is needed to test these competing hypotheses, it is clear from our results that the direct role of school community physical characteristics for shaping child outcomes is indeed modest at best.
Even absent robust links with child outcomes, however, we argue that measures like the iSNAP can provide important information regarding the characteristics of the learning environments in which an increasing percentage of young children spend their time. For example, our analyses of concurrent validity suggested that schools embedded in high-poverty, densely populated, and/or high-crime Census tracts on average showed lower levels of order, safety, and care than their counterparts in more affluent, sparsely populated, and/or safe neighborhoods, findings consistent with prior research from sociology and public health (Ross, 2000; E. Wei et al., 2005). Overall, however, these associations were small to moderate in size, indicating that the iSNAP is likely to capture features of school communities that are ultimately distinct from those represented by the Census and other administrative sources. In other words, our results suggest that there is likely to be relatively large heterogeneity in the levels of order, safety, care, and resources for play that are found within school neighborhoods categorized as “at risk” based on structural characteristics, reinforcing the diversity of low-income communities and the importance of avoiding monolithic conceptualizations of low-income environments and one-size-fits-all approaches to intervention in these settings.
Furthermore, we found that neighborhood poverty and homicide rates were generally more strongly related to physical features of the neighborhood surrounding schools than they were to the characteristics of the school grounds themselves. In particular, resources for play in the school grounds were not significantly correlated with neighborhood poverty or homicide rates. This finding suggests that school grounds—which are likely maintained by the school and regulated by higher-level entities—may represent a fundamentally different context than the neighborhood environments surrounding them. Future research is needed to understand the extent to which characteristics of school grounds relate to levels of quality observed within school walls, including the dimensions of classroom structural and process quality that are frequently cited as mechanisms for reducing opportunity gaps (Howes et al., 2008).
Limitations
This study is limited in several important ways. First, although Google Street View allows for virtual observations of geographically distant settings for coders, it does not replicate the experience and detail of in-person observation and therefore may introduce error into assessment. Second, although we made multiple efforts to establish interrater reliability and minimize measurement error (e.g., recruiting coders from diverse backgrounds, randomly pairing coders and randomly assigning them to different school communities, averaging coder scores for analysis), iSNAP scores—particularly global ratings—may have been systematically biased. Like other observer ratings, iSNAP scores reflect outsiders’ perceptions of the built environment and fail to consider the lived experiences of (often low-income and/or racially minoritized) community members. Future work using triangulated and participatory methods (e.g., children’s narratives or photos of their everyday experiences in their school neighborhoods, local community members’ ratings of care and safety) is needed to understand the ecological validity of the iSNAP and to ensure that the voices of community members are appropriately reflected by empirical data (Burton & Jarrett, 2000; Dennis et al., 2009; Loebach & Gilliland, 2010). Work to explicitly untangle the effects of coders on iSNAP scores is also needed, for example, by intentionally pairing coders from different backgrounds to document the extent of rater biases.
Third, children and families do not randomly select into school communities (Sampson & Sharkey, 2008). As such, by failing to account for unobserved characteristics that are associated with both school communities and child outcomes (e.g., characteristics of children’s residential neighborhoods or family environments), we may be overestimating the relations between these variables. Future work using more internally valid approaches for linking the iSNAP and other neighborhood processes with child outcomes is needed (Leventhal & Dupéré, 2019). Fourth, because our sample was drawn from predominantly low-income communities in nine cities and focused on a relatively narrow set of preschool outcomes using data more than a decade old, the generalizability of our results to the full U.S. population, to a broader range of child outcomes (e.g., math skills, health, behavior problems), to different ages, and to modern preschool contexts is limited. In particular, results of our CFAs should be replicated in more recent samples to ensure that the factor structure of the iSNAP identified in this study is appropriate in various contemporary contexts. It would also be useful to explore whether the associations between iSNAP characteristics and child outcomes are consistent across different settings and time.
Lastly, our measure attempts move beyond sociodemographic characteristics as proxies for children’s everyday experiences, which have been widely criticized in the literature (e.g., Leventhal & Brooks-Gunn, 2004) and may contribute to the broader invisibility of nondominant groups in the psychological and educational sciences (Brady et al., 2018; Vélez-Agosto et al., 2017). Yet we by no means capture the sociohistorical realities of persistent and systematic discrimination (e.g., racism) that lead to many geospatial inequalities, including in indicators of disorder or underinvestment in neighborhood maintenance. Future work is needed to more systematically acknowledge, study, and intervene upon the broader macrosystemic forces that continue to shape these inequities. Furthermore, although the iSNAP focuses on more malleable dimensions of neighborhoods that could serve as targets for intervention, it does not supplant the need for comprehensive antiracist policies, including equal housing opportunities and investments in neighborhood infrastructure.
Conclusions and Implications
These results highlight the potential of technologically-based tools like the iSNAP for leveraging existing geospatial resources to operationalize the characteristics of educational settings in novel ways. In particular, although the iSNAP is likely to be a more resource-intensive method for measuring school neighborhood environments than, for example, Census data on poverty, it is substantially more scalable than classic SSO approaches that have been previously used to measure physical characteristics (e.g., Sampson & Raudenbush, 1999). Indeed, when applied to additional contexts, populations, and data sources, tools like the iSNAP hold promise for both hypothesis testing and discovery generation, helping us to understand how existing approaches for improving the quality of resources and interactions within school walls may benefit from complementary programs and policies that target features outside of these environments.
Supplemental Material
sj-docx-1-ero-10.1177_23328584221085247 – Supplemental material for Assessing School Communities Using Google Street View: A Virtual Systematic Social Observation Approach
Supplemental material, sj-docx-1-ero-10.1177_23328584221085247 for Assessing School Communities Using Google Street View: A Virtual Systematic Social Observation Approach by Dana Charles McCoy, Terri J. Sabol, Emily C. Hanno and Candice L. Odgers in AERA Open
Footnotes
Acknowledgements
The development of this article was supported by the Institute of Education Sciences, U.S. Department of Education through Grant R305A160013. The NCRECE PDS study was supported by the Institute of Education Sciences, U.S. Department of Education through Grant R305A060021 to the University of Virginia. The opinions expressed are those of the authors and do not represent views of the U.S. Department of Education. We are grateful to Dr. Jason Downer, Andrea Busby, Atiya Addie, Allie Cooperman, Sarah Guminski, Marisa Sclafani, Wendy Wei, and each of our coders for their contributions to this work.
Authors
DANA CHARLES M
TERRI J. SABOL is an assistant professor of human development and social policy at Northwestern University; email:
EMILY C. HANNO is a postdoctoral researcher with the Saul Zaentz Early Education Initiative at the Harvard Graduate School of Education; email:
CANDICE L. ODGERS is a professor of psychological science at the University of California, Irvine, and a research professor at Duke University; email:
References
Supplementary Material
Please find the following supplemental material available below.
For Open Access articles published under a Creative Commons License, all supplemental material carries the same license as the article it is associated with.
For non-Open Access articles published, all supplemental material carries a non-exclusive license, and permission requests for re-use of supplemental material or any part of supplemental material shall be sent directly to the copyright owner as specified in the copyright notice associated with the article.