
Abstract
The school discipline literature has expanded rapidly in recent decades, yet the conceptualization and measurement of school discipline patterns remains overlooked. In this paper, we present a comprehensive analytic framework to examine school discipline patterns that encompasses school-level metrics that capture the prevalence and disparity in exclusionary discipline and regression-based approaches that examine the likelihood that students experience exclusionary discipline. We apply the framework to New York City and, based on school-level metrics, find that Black students have the highest prevalence and the highest disproportionality. Results from regression models affirm that Black students are most likely to receive office discipline referrals and suspensions and experience differential processing of suspensions for similar categories of infractions. The findings illustrate the nuances of the disciplinary process in schools and inform the consideration of a range of available analytic tools that educational stakeholders may employ to better measure and understand exclusionary discipline.
Keywords
As policymakers and practitioners craft solutions to racial inequality in school discipline, there is a need for a granular understanding of the use of exclusionary discipline in schools in order to design school discipline reforms and target support within districts. Although the empirical literature on school discipline has expanded rapidly in recent decades, the conceptualization and measurement of the rates of and disparities in school discipline outcomes continues to develop (Curran, 2020; Girvan et al., 2019; Nishioka, 2017). Prior studies examining the strengths and weaknesses of school discipline metrics have focused predominantly on disparities using risk ratios, risk differences, or raw differential representation and illustrated that different metrics lead to different conclusions about racial disparities (Curran, 2020; Girvan et al., 2019). Nishioka (2017) provided a guide to identify racial disparities in exclusionary discipline. Girvan and colleagues (2019) described metrics evaluating racial disproportionality with a focus on technical aspects, such as reliability and validity, and used data from a sample of schools to illustrate how metrics may respond to changes in rates of disciplinary incidents, overlap in the information provided by metrics, and the stability of metrics over time. Curran (2020) used data from Maryland to demonstrate how the choice of metrics shapes insights on racial disparities in schools and districts.
There is an urgent need to rethink the extent to which school discipline metrics accurately capture the complexities of the disciplinary process in schools. This disciplinary process from perceived misbehavior to exclusionary disciplinary consequences spans not only the measurement of racial disparities but also the relationship between the prevalence, differential selection, and differential processing of office discipline referral (ODRs) and suspensions. Disparities in school discipline may exist at various points in the disciplinary process, and within the robust school discipline literature, the prevalence and disparities of different forms of exclusionary discipline have been measured and considered in multiple ways. Notwithstanding, prior approaches to understanding the prevalence and disparities of exclusionary discipline in schools tend to focus on a singular dimension of the disciplinary process (e.g., school level vs. student/incident level) or outcomes (ODRs or suspensions) rather than an overview of the connection between the various dimensions of the disciplinary process, or ways students may be punished. The complexity of the disciplinary process in schools necessitates a commensurate comprehensive framework that may enhance the understanding and discourse of the various areas inequities in school discipline may thrive.
Indeed, racial disparities in suspensions have acquired greater significance during the COVID-19 pandemic given the substantial loss of learning time, additional trauma and stress, and the worsening of myriad existing social, health, and economic racial inequalities (Lake & Dusseault, 2020; Welsh, 2021). The killing of George Floyd and the prominence of the Black Lives Matter movement have placed a microscope on anti-Blackness permeating society and schools and necessitate a more critical interrogation of school discipline in order to better understand the scope and drivers of racial/ethnic patterns of suspensions and expulsions. The COVID-19 pandemic along with emerging reports of its resultant learning loss and uptick in disciplinary incidents as students return to in-person learning (Jones, 2021; McFadden, 2021) as well as mixed results of alternative approaches to exclusionary discipline, such as restorative practices (Welsh, 2021; Welsh & Little, 2018b), adds to the importance and need for an integrated approach to capture and consider the prevalence of and disparities in exclusionary discipline.
In this paper, we present and apply a comprehensive analytic framework to examine patterns in school discipline. The main objective is to provide a framework that captures the complexity of the disciplinary process and illustrate the various crevices in which inequities may thrive. As such, the framework considers and discusses the juxtaposition of metrics and analytical approaches at multiple levels (e.g., school, student, and disciplinary incident) spanning multiple outcomes (ODRs and suspensions) and places a microscopic lens on the interrelated issues in the disproportionate use of exclusionary discipline. First, we clarify the distinction between and relation among common approaches to assess disciplinary patterns and inequities at the school and student levels and categorize available school discipline metrics with a focus on commonly used measures. Afterward, we use the case of New York City (NYC) spanning from the 2011-2012 to 2018-2019 academic years to empirically demonstrate the framework and highlight the distinctions among the various dimensions of school discipline. The application of the framework to NYC is guided by the following research questions:
(a) What combination of metrics and analytical approaches may capture the prevalence and disparities in exclusionary discipline in schools?
(b) In addition to school-level analyses, to what extent and how do regression-based approaches provide additional insights on inequality in exclusionary discipline?
The findings presented herein add to the nascent literature on the conceptualization and measurement of school discipline in several ways. Prior empirical studies have focused on a limited set of discipline metrics capturing disparities using either a sample of schools (Girvan et al., 2019) or statewide student-level data (Curran, 2020). Given the importance of the district level for the school discipline reforms (Welsh, 2020), our focus on NYC using an expanded set of metrics coupled with a rich, infraction-level longitudinal data set illuminates the variation in school discipline across schooling contexts throughout a demographically diverse and urban district. Our study also responds to the call for a set of metrics that can provide an accurate and complete picture of the disproportionality and disparities in schools with regard to disciplinary infractions and consequences (Girvan et al., 2019). The analytic framework clarifies the conceptual differences in the prevalence and racial disparities in school discipline outcomes and provides an organizing tool for a growing yet fragmented school discipline literature (Welsh & Little, 2018a, 2018b). The framework may be helpful for practitioners and researchers to get a lay of the disciplinary landscape and an in-depth understanding of the disciplinary process in schools. For instance, insights from the framework (e.g., reduction in ODRs vs. suspensions vs. both) provide a means to empirically understand whether students are being disproportionately referred to the office or students of color are receiving harsher punishment for similar infractions and may inform which group of educators to target support and professional development (teachers vs. school leaders, etc.). Without an organizing framework, there is an incomplete understanding of the different ways students may experience exclusionary discipline. It is important to note that although the application of the analytic framework in this study centers the understanding of racial differences in suspensions, the framework can also be applied to examine differences across other student traits (gender, special education status, English language proficiency) and intersectionality in school discipline outcomes, the salience of which has been highlighted by recent studies (Anderson, 2020; Welsh, 2020).
The rest of the paper proceeds as follows. First, we outline a typology of school discipline measures and analytic approaches capable of capturing various dimensions of school discipline at both the school and student levels. We then describe the case of school discipline in NYC as well as the data and methods used in this study. Last, we present results before discussing scholarly, policy, and practice implications.
The Dimensions of School Discipline: An Analytic Framework
We conceptualize school discipline as a complicated process involving complex interactions among students, teachers, and school leaders (Skiba et al., 2014) rather than a singular, discrete event with uniformly prescribed consequences for well-defined categories of misbehavior (Kinsler, 2011). Figure 1 provides the conceptual underpinnings of the school discipline process. Overall, the disciplinary process—the sequence from perceived student misbehavior to disciplinary consequence—occurs within the context of schools’ policies and practices (e.g., school discipline reforms and instructional strategies) and overarching school climate that may foster, reduce, or maintain the use of exclusionary discipline.

Conceptualizing the disciplinary process in schools.
A robust body of studies has examined the contributors to discipline disparities and has highlighted the importance of school-level policies and practices (Skiba et al., 2014; Welsh & Little, 2018b). The use of popular school-level, nonexclusionary programs, such as restorative justice and positive behavioral interventions and supports, has expanded considerably in the past decade in the United States, and these programs are intended to reduce the use of and racial disparities in suspensions through improvements in school climate or the quality and character of school life (Gregory & Evans, 2020; Welsh & Little, 2018b). School personnel may play a role in perpetuating a toxic discipline cycle between themselves and students who are overly disciplined. Okonofua and colleagues (2016) used social-psychological literature to develop a framework that describes the recursive process that maintains a toxic relationship between teachers and Black students who are repeatedly disciplined. The “vicious cycle” describes how student negative behaviors influence teacher worries, leading to harsher treatment of racially stigmatized students that then reinforces negative mindsets and behaviors among Black students (Okonofua et al., 2016).
The main practices of exclusionary discipline include (a) ODRs, or removals from classrooms by teachers with the possibility of further action by school leaders, and (b) suspensions (Girvan et al., 2017; Sugai et al., 2000; Welsh & Little, 2018a). Actual student behavior is rarely observed; thus ODRs start with student misbehavior as perceived by teachers and administrators. The majority of studies have examined suspensions as the primary disciplinary outcome (Welsh & Little, 2018a). Although there are generally two types of suspensions (ISS and OSS) and millions of students receive ISS nationwide, only a handful of studies focus on ISS or differentiate between the two suspension types (Anderson et al., 2019; Anyon et al., 2021; Cholewa et al., 2018; Jabbari & Johnson, 2020; Noltemeyer et al., 2015; Smith et al., 2021). Even though a growing number of studies are including both ODRs and suspensions as outcomes in the same study (Anyon et al., 2014, 2016; Bradshaw et al., 2010; Nishioka et al., 2021; Vincent & Tobin, 2011), within the robust school discipline literature, most studies tend to focus on either ODRs (Cook et al., 2018; Gion et al., 2020; Gregory et al., 2014, 2019) or suspensions (Green et al., 2021; Gregory et al., 2018; Hashim et al., 2018; Lacoe & Steinberg, 2018).
Most of the variation in disproportionality in school discipline is explained by the variation in subjective ODRs (Girvan et al., 2017), and there are vulnerable decision points in the disciplinary process that predict disproportionate discipline (Smolkowski et al., 2016). Owens and McLanahan (2020) examined the drivers of racial disparities in suspensions and expulsions and found that the differential treatment and support of students with similar behaviors accounted for the majority of disparities in exclusionary discipline. In many ways, disparities in exclusionary discipline begin with ODRs when teachers judge and respond to students’ behavior differently based upon student characteristics, such as race/ethnicity, to decide which perceived misbehavior is managed within the classroom and which is referred to the school administration for further action.
The available metrics and analytic approaches are various, interrelated, and yet distinct in that they intend to gauge different aspects of the disciplinary process. For instance, students may receive an ODR but may not receive a suspension for an infraction; studies that focus on the former versus the latter necessarily capture different yet related outcomes unfolding at various stages in the disciplinary process. Yet, the discussion of school discipline rarely differentiates among the many available measures and how they in some instances point to divergent problematic patterns. Additionally, even though multiple suspensions is a path through which school discipline is linked to adult crime and suspension (Mittleman, 2018), relatively few within the robust school discipline literature, studies have focused on the frequency of suspensions and the experiences of students receiving multiple disciplinary consequences within a given school year (Kennedy-Lewis, 2012, 2013; Noltemeyer et al., 2015; Skiba et al., 2014; Wilkerson & Afacan, 2021).
Categorizing School Discipline Metrics and Analytic Approaches
In this section, we present a categorization of commonly used school discipline metrics and analytic approaches and describe the salient differences and relations across the various ways that school discipline patterns may be measured and examined. Table 1 categorizes the school discipline metrics and analytic approaches most frequently used by educational researchers based on a review of school discipline articles and reports in the past decade (Girvan et al., 2019; Nishioka, 2017; Welsh & Little, 2018b). The analytic measures and tools used to capture patterns of school discipline vary widely across the multitude of empirical studies (Girvan et al., 2019; Nishioka, 2017). The majority of peer-reviewed articles and policy reports on school discipline typically employ only one measure to examine racial disparities in discipline (Curran, 2020; Girvan et al., 2019; Gregory et al., 2010). To be clear, Table 1 does not include all available school discipline metrics and analytic approaches but rather captures the crystallizing consensus among researchers based on the extant school discipline literature.
Analyzing and Measuring School Discipline Patterns

The analytic framework classifies two main methods of capturing patterns of exclusionary school discipline: (a) school-level metrics of disciplinary actions and (b) student- and incident-level predictions of disciplinary consequences. School-level metrics can be disaggregated further to measure two central dimensions of school discipline: (a) the prevalence of disciplinary actions and (b) disparities in disciplinary actions. Prevalence refers to the overall and disaggregated-by-student-group disciplinary actions within a school. Measures of prevalence capture the use of exclusionary discipline in schools based on the written documentation of disciplinary incidents by teachers and administrators. Disparities refers to the comparison of disciplinary outcomes across student characteristics (e.g., student race/ethnicity) (Nishioka, 2017). Various school discipline metrics can be used to represent the two dimensions of school discipline at the school level.
Although within the robust school discipline literature, disproportionalities are used interchangeably with disparities (Skiba et al., 2014; Welsh & Little, 2018b), we acknowledge that these terms may denote interrelated aspects of exclusionary discipline patterns. For instance, measures of disproportionality may directly benchmark the prevalence of exclusionary discipline for a target group to the overall prevalence observed among the broader student population (Girvan et al., 2019). In this way, disproportionality refers to the prevalence of exclusionary discipline specific to one target group (the level of prevalence specific to a target student group of interest relative to the student group’s appearance in the overall population), whereas disparities are differences in prevalence across two student groups. Although these represent distinct manifestations of disciplinary patterns, we use “disparities” interchangeably with “disproportionality” in the analytic framework, as a pattern of disproportionality in one group always necessitates there is a disparity with respect to at least one other group. Nevertheless, further distinguishing between metrics of disproportionality and metrics of disparity may be helpful to more fully capture the nuance of discipline patterns that may arise across student groups in certain settings.
Although school-level metrics are a useful starting point to provide information on school discipline patterns for educational stakeholders, they are limited in the information they provide on the potential contributors to and explanations for the school discipline patterns observed. Data play an important role unpacking the explanatory factors underlying discipline disparities. Rocque and Paternoster (2011) noted that “much of [the] research on racial discrimination in school is based upon analyses that fail to control for important variables, particularly student behavior, or have failed to simultaneously consider both individual student and school-level factors” (p. 637). Student-level predictions of the likelihood of experiencing a disciplinary consequence further reveal the nature of systemic inequities in the disciplinary process, as differences in suspension rates, for example, may arise across student subgroups due to differences in either schooling environments, student traits, or school practices involving the systematic differential processing of perceived student misbehavior that are not accounted for by purely descriptive school-level measures.
Predictions for differential exposure of students to disciplinary consequences and differential processing of disciplinary consequences for similar forms of infractions are subsumed under the category of student-level predictions of exclusionary discipline patterns. These student- and incident-level analyses provide insights on the likelihood of students receiving ODRs and suspensions while accounting for student and school characteristics and the nature of disciplinary infractions. A growing number of studies link disciplinary consequences to a particular infraction (Anderson & Ritter, 2017, 2020; Anyon et al., 2016; Kinsler, 2013; Skiba et al., 2014; Welsh, 2020). Methods predicting differential exposure to suspension among students and differential processing of similar forms of infractions are better able to establish the extent to which race-based differences in suspension outcomes are unrelated to differences in perceived student misbehavior and school environment.
Overall, school-level metrics provide descriptive measures of disciplinary actions occurring at the school level and do not intend to account for differences with regard to the severity of infractions, student characteristics, and schooling environments, which student-level predictions aim to do. Thus, in many ways, school-level school discipline metrics provide insights on whether the rates of exclusionary discipline may be high and uneven across student groups, whereas the student-level analytic approach provides insights on the potential contributors to inequality in disciplinary consequences. We elaborate on these school-level metrics and student/incident-level regression-based approaches below, and detail how they . . . complement each other and work in tandem to uncover the extent and nature of disciplinary actions and consequences within schools.
Prevalence of Disciplinary Actions
There are several approaches to assess the prevalence of exclusionary discipline within a school, starting with a number of count-based measures. First, frequency of discipline, or total number of disciplinary actions occurring within a school, such as an ODRs or suspensions, provides a straightforward depiction of the extent to which exclusionary disciplinary consequences are meted out to students. However, two alternative measures—the number of disciplined students as well as the total number of chronically disciplined students (i.e., students disciplined more than once within a school year)—can more accurately assess the prevalence of exclusionary discipline in schools and provide insights on whether a high frequency of discipline reflects disciplinary outcomes being dispensed to a large number of students overall or repeatedly to a smaller subset of students.
Rate-based measures of the prevalence of disciplinary actions are perhaps the most commonly used within the literature, as they adjust for a school’s student enrollment size. The discipline rate represents the proportion of students who have experienced a disciplinary consequence and can simply be calculated as the number of unique students disciplined divided by the total number of students within the school. Similarly, the chronic discipline rate represents the proportion of students within a school who have been disciplined more than once within the same school year.
At a rudimentary level, all aforementioned count-based measures can be disaggregated to a specific target group, for instance, frequency of disciplinary actions experienced by Black students or unique number of Black disciplined students. Similarly, rate-based measures of prevalence of discipline can be disaggregated to a target group by adjusting for a target group’s enrollment size within a school. Several prior studies have used the discipline risk index (e.g., Girvan et al., 2019), which can be expressed as the proportion of students from a target racial or ethnic group (e.g., Black, Latinx) who have experienced the type of exclusionary disciplinary action being examined:

However, the discipline risk index is not a direct measure of disproportionality in and of itself, as it does not directly account for the overall prevalence of discipline in a school. The chronic discipline risk index similarly calculates prevalence measured as the proportion of students from a target racial or ethnic group who have experienced multiple exclusionary disciplinary actions within a given school year. While there is no universal consensus on the number of ODRs or suspensions that constitutes chronic or persistently disciplined, most prior studies have defined persistently disciplined students as students who received two or more suspensions in a school year (Kennedy-Lewis, 2013; Kennedy-Lewis et al., 2016).
Disparities in Disciplinary Actions
Measures of disciplinary disparities capture the extent to which disciplinary patterns are unequal across two mutually exclusive student groups. The most common methods of operationalizing disparities in school discipline include risk ratios and risk differences. Risk ratios are used by the Department of Education to assess disproportionality (Girvan et al., 2019; McIntosh et al., 2018). First, the absolute risk difference (ARD) operationalizes disparity in terms of the difference in risk indices across two groups of students, denoted here as A and B:

The ARD is rather easy to interpret. Suppose a school has an ODR risk index for Black students of 0.35 and ODR risk index for White students of 0.10. The Black-White ODR ARD for such a school would be 0.25, indicating that the risk Black students receive an ODR is 0.25 higher than that of White students within the school. Stated differently, the rate at which Black students enrolled in the school received an ODR is 25 percentage points higher than would be expected had they been referred at the same rate as White students. Unfortunately, a main limitation of the ARD is that it does not inform the relative magnitude of discipline rates between groups (Girvan et al., 2019); an ARD of 0.25 could equally reflect a school in which 65% of Black students and 40% of White students received an ODR or, more moderately, a school in which 30% of Black students and 5% of White students received an ODR.
The relative risk ratio (RRR) provides an alternate approach to assess discipline disparities as the ratio of risk indices across two student groups:

An RRR with a value of 1 indicates no difference in risks between the two groups, values greater than 1 indicate a higher risk for the target group A compared with group B, and values less than 1 represent lower risk for group A compared with group B. More specifically, each additional unit increase in the RRR above 1 indicates the number of times greater the risk is for group A compared with group B. As in the previous example, a school with an ODR risk index of 0.35 for Black students and 0.10 for White students will have a Black-White ODR RRR of 3.5, indicating that each Black student in the school was 3.5 times more likely to receive an ODR than a White student in the same school. Unlike the ARD, the RRR provides a direct assessment of the relative magnitude of discipline between two groups. However, its advantage is not without limitation, as the RRR does not elucidate the absolute magnitude of difference in discipline risk across two groups (Girvan et al., 2019). To demonstrate, a school with an ODR risk of 0.35 for Black students and 0.10 for White students and a school with an ODR risk of 0.70 for Black students and 0.20 for White students would both yield the same RRR of 3.5 despite having different overall rates of discipline for both student groups. A further weakness of the RRR is that it is relatively unstable, particularly when the total number of students in either target group is small.
The drawback of both the ARD and the RRR is that they do not express discipline disparities in terms of the raw number of students who are disciplined in comparison to a reference student group. The raw differential representation (RDR) aims to do so by estimating the number of students in group A who experience discipline but would not have if they were subject to discipline at the same rate as students in group B. The RDR can be calculated from either the ARD (Equation 4) or the RRR (Equation 5):


As an example, an ODR RDR of 25 for Black students suggests that 25 more Black students received ODRs than would have been expected given the ODR rate for White students.
Distinguishing between metrics of disproportionality and metrics of disparity may be helpful to more fully capture the nuance of discipline patterns that may arise across student groups in certain settings. Disproportionality of discipline concerns the prevalence of discipline within one student group; disparities in discipline pertains to the differences in prevalence of discipline across two target groups. The discipline disproportionality ratio (DDR) serves as an alternative metric to capture the rate at which students are disciplined relative to how often they appear in the overall student population within a school. Thus, disproportionality in discipline can be expressed as the ratio between the percentage of students experiencing a disciplinary action that are within a target group compared with the percentage of students in the overall population that are within the same target group:

The DDR can be also expressed as the discipline risk index for the target group divided by the overall discipline rate. As a matter of interpretation, a DDR with a value greater than 1 would indicate that the share of students experiencing a disciplinary action disproportionately comprises the target group compared with the rate at which the target group appears within the overall student population of the school. For instance, a disproportionality ratio value of 1.5 indicates that the share of students who are disciplined within the target group is 50% higher than the share of a school’s students who are within the target group overall.
By definition, a pattern of disproportionality for a target student group always necessitates there is a disparity with respect to at least one other student group. For example, two target groups may both be disproportionately disciplined (i.e., DDR greater than 1), but there may also be disparities across both groups to reflect that one group is disproportionately disciplined to a far greater extent than the other group (though for this to be true, a third group would have to be associated with a DDR below 1). Here, a disparity exists and both groups are disproportionately disciplined, though to different degrees. Examining disparity metrics in isolation would not reveal this nuance, nor would examining a disproportionality metric for a target group inform the level of disparity across two groups—though a disparity can be inferred if one compares disportionality metrics across two groups rather than directly quantifying a measure of disparity such as the ARD, RRR, and RDR.
Differential Exposure to Disciplinary Consequences
The aforementioned metrics provide an illustration of inequitable discipline patterns at the school level. However, these school-level metrics do not estimate whether observable disparities are associated with differences in school context or student background. Regression approaches can provide further insights on whether differences in exposure to disciplinary consequences occur across student groups above and beyond differences associated with other student and school characteristics. Such analyses can be conducted using student-level data comprising a sample of all students within a school system by estimating a model of the following form:

where the probability of student i in school s is disciplined during year t is modeled as a function of observable student characteristics (Xist) and time-variant school characteristics (Sst). The specified model also includes the γ t term to adjust for nonlinear trends in discipline and the ϕ s term to account for time-invariant school characteristics—both observable, such as school level, and unobservable, such as time-invariant school culture or neighborhood factors—that could ostensibly confound the likelihood that students face disciplinary consequences. The term of interest, however, is subgroup it , which identifies whether student i is within a mutually exclusive subgroup during year t. The subgroup it vector term, for instance, may represent a categorical indicator taking on distinct values for a student’s racial or ethnic background or, alternatively, may equally represent a categorical indicator for whether a student is receiving special education services. The vector coefficient β1, therefore, would predict the isolated difference in the likelihood of a student experiencing exclusionary discipline across the student subgroups of interest. In this regard, β1 could shed light on the systematic use of exclusionary discipline and possible variations across student racial/ethnic groups above and beyond other factors.
Differential Processing of Disciplinary Infractions
The estimation of student exposure to disciplinary consequences does not take into consideration the severity of infraction that the student allegedly committed. A similar regression-based approach may be used to estimate whether disciplinary consequences are differentially processed for students committing similar levels of infractions. Resembling analytic approaches modeling disparities in disability identification (e.g., Morgan et al., 2017), the analysis of differential processing of disciplinary consequences would allow researchers to directly assess inequities in disciplinary experience across student groups that are credibly unrelated to differences in the severity of the reported infraction or perceived misbehavior. Such an analysis can be conducted using infraction-level data comprising a sample of students who received an ODR within a school system by estimating a model of the following form:

The model is similar to the model expressed in Equation 7, with the exception of the level hist term and its interaction with the student subgroup indicator of interest. Here, the probability of student i in school s is disciplined for infraction h during year t is modeled as a function of the level of severity of infraction as defined by the school system’s disciplinary code. Furthermore, the model devotes a degree of freedom for the differential influence of the severity of infraction for specific student subgroups by including the interaction term. As before, the vector coefficient β1 serves as the coefficient of interest, as it reveals whether students of a particular subgroup are more likely to receive disciplinary consequences for similar categories of infractions. However, the coefficient of the interaction term, β3, further reveals whether differences in exclusionary discipline associated with subgroups of interest vary based on the level of severity of the infraction that students are alleged to have committed.
For the remainder of this article, we utilize NYC as a descriptive case to demonstrate disciplinary patterns using the presented analytic framework. In doing so, we aim to highlight the strengths and weaknesses across the summarized metrics and analytic approaches to understand disciplinary patterns within the NYC public school context. We show how school-level metrics of prevalence and disparities of exclusionary discipline capture aggregate patterns and trends across many schools, and student- and infraction-level modeling approaches capture more detailed patterns of students’ differential exposure to exclusionary discipline and whether they face differential processing of similar categories of infractions.
School Discipline in NYC: Context and Data
The NYC school system comprises 32 school districts operating in tandem through the NYC Department of Education (DOE) throughout five geographic boroughs. When Michael Bloomberg first entered office in 2002, the state legislature granted him mayoral control over the NYC public school system; former Bill De Blasio retained similar levels of control as mayor. Yet across both mayoral administrations, the NYC school system has notably shifted away from exclusionary disciplinary policies in key ways. These policies have been intended to reduce suspensions for minor misbehavior and low-level infractions, such as insubordination, and shorten the length of suspensions for serious infractions.
Our period of study, 2011-2012 through to 2018-2019 coincides with a shift away from suspensions, a trend seen in other districts nationwide, such Los Angeles (Welsh & Little, 2018b). In 2012, under the Children First education reform, students could no longer be suspended for first-time low-level offenses (uncooperative/noncompliant or “disorderly” behavior) and maximum suspension for K-3 was reduced to 5 days from 10 days for midlevel offenses (“disruptive” behavior). Emerging research on these Bloomberg-era reforms has found that reduced suspensions resulted in small positive effects on student performance in math and reading and was associated with improvements in school culture (Craig & Martin, 2019).
In the subsequent De Blasio administration, beginning in 2015, the NYC DOE moved toward promoting restorative justice and social-emotional learning approaches. As part of this initiative, the city initially allocated $47 million toward staff training on restorative disciplinary practices and mental health supports. In addition, with the appointment of former schools chancellor Richard Carranza in 2018, anti-bias training for educators and administrators as well as culturally responsive education has become further embedded in the fabric of NYC DOE education policy reforms. School discipline policy changes over the period of study included (a) requiring that principals obtain written approval from the Office of Safety and Youth Development (OSYD) to suspend a student for “uncooperative/noncompliant” and “disorderly” behavior, (b) requiring principals seek OSYD approval for suspensions of any student from kindergarten through third grade, (c) eliminating most suspensions for K–2 (“Principal’s suspensions are not permitted for students in grades K-2, except in limited circumstances”), and (d) limiting lengthy suspensions—students cannot be suspended for longer than 20 school days, except when required by law or for Level 5 infractions that involve seriously dangerous and/or violent behavior.
Data, Key Measures, and Analytic Samples
We use administrative data provided by the NYC DOE and maintained by the Research Alliance for New York City Schools to examine school discipline patterns in NYC. We restrict our sample to include only middle and high schools with traditional grade configurations (Grades 6–8 or 9–12) and combined grade configurations (Grades 6–12), as these are the only schools for which annual school discipline records are available from the 2011-2012 to the 2018-2019 school years (an 8-year panel). The key data elements are drawn from school discipline records; education administrative records of students, teachers, and schools; and the annual NYC School Survey of students and teachers. Next, we present the key measures, analytic sample, and empirical strategy used for this study.
ODRs and suspensions
ODRs and suspensions are the primary disciplinary outcomes of interest. In NYC, reported incidents or infractions—also referred to as ODRs in the discipline literature—are classified into five levels based on the severity, ranging from Level 1 (uncooperative/noncompliant behavior) to Level 5 (seriously dangerous or violent behavior). Rather than the typical ISS and OSS distinction used by school districts, the NYC DOE distinguishes between three forms of school disciplinary responses that may result in a student’s removal from the classroom: (a) a “teacher removal” of a student from a classroom, wherein the removed student can remain in the school building and attend other classes not taught by the teacher requesting the removal; (b) a “principal’s suspension,” intended for less severe offenses, which can last between 1 and 5 days and the duration of which is left to the sole discretion of school administrators; and (c) a “superintendent’s suspension,” intended for more severe offenses, which requires approval beyond principals and lasts longer than 5 days but less than a school year. The available data identify the latter two types of more severe disciplinary responses: the principal’s and superintendent’s suspensions. We report results from the combined total of principal’s and superintendent’s suspensions given that the overwhelming majority comprise principal suspensions (73% to 81% within a given school year); however, we disaggregate between the two types of suspensions in auxiliary analyses. The results from these analyses are qualitatively similar and available upon request.
School-level information
School administrative records provide a range of data on the nature of school environment and the characteristics of students enrolled in schools, including (a) grade configuration, (b) student enrollment size, (c) whether a school provides free lunch to all students (i.e., universal feeding school), (d) the demographic composition of students served (race/ethnicity, special education status, free or reduced-price lunch [FRPL] eligibility, temporary housing status, and English language proficiency), and (e) measures of school performance (average attendance, percentage proficient in English language arts and mathematics for middle schools, and graduation rates for high schools). Additionally, human resources data provide demographic and background information as well as job codes and school assignments for all employed education personnel within NYC. Average years of teaching experience as well as the percentage of teachers with a particular education level (bachelor’s, master’s, or more than a master’s degree) serve as school-level measures of school-level teacher quality, and the percentage of teachers of a particular racial/ethnic background (Black or Latinx) and percentage male teachers provide measures of the demographic composition of teaching staff within a school.
Finally, drawing on the annual NYC School Survey, we construct measures of school context based on student and teacher responses. The survey captures opinions across numerous areas based on an overarching framework for school improvement; however, we focus on the 11 student survey items and nine teacher survey items that were consistently available over the 8-year panel of study. To capture elements of the school organizational context, we conduct an exploratory factor analysis (EFA), the results for which along with a list of the underlying survey items are presented in appendix Table A1. We conducted the EFA on individual-level responses (teachers and students) but separately for teacher and student survey items, as teacher and student survey data are not linkable. The factor analyses yielded three distinct factors representing students’ perception of risky student behavior within the school, students’ perception of the school environment, and teachers’ perception of the school environment. As teacher responses are made available by the NYC DOE in anonymized form and cannot be linked to other forms of data at the individual teacher level, and to address concerns with endogeneity, we follow previous studies leveraging data from the NYC School Survey (e.g., Kraft et al., 2016) by aggregating the standardized factor values to the school-year level. Thus, the aggregated factors represent school-level measures of risky student behavior and perceived school environment, from both the student and the teacher perspective.
Sample and analytic strategy
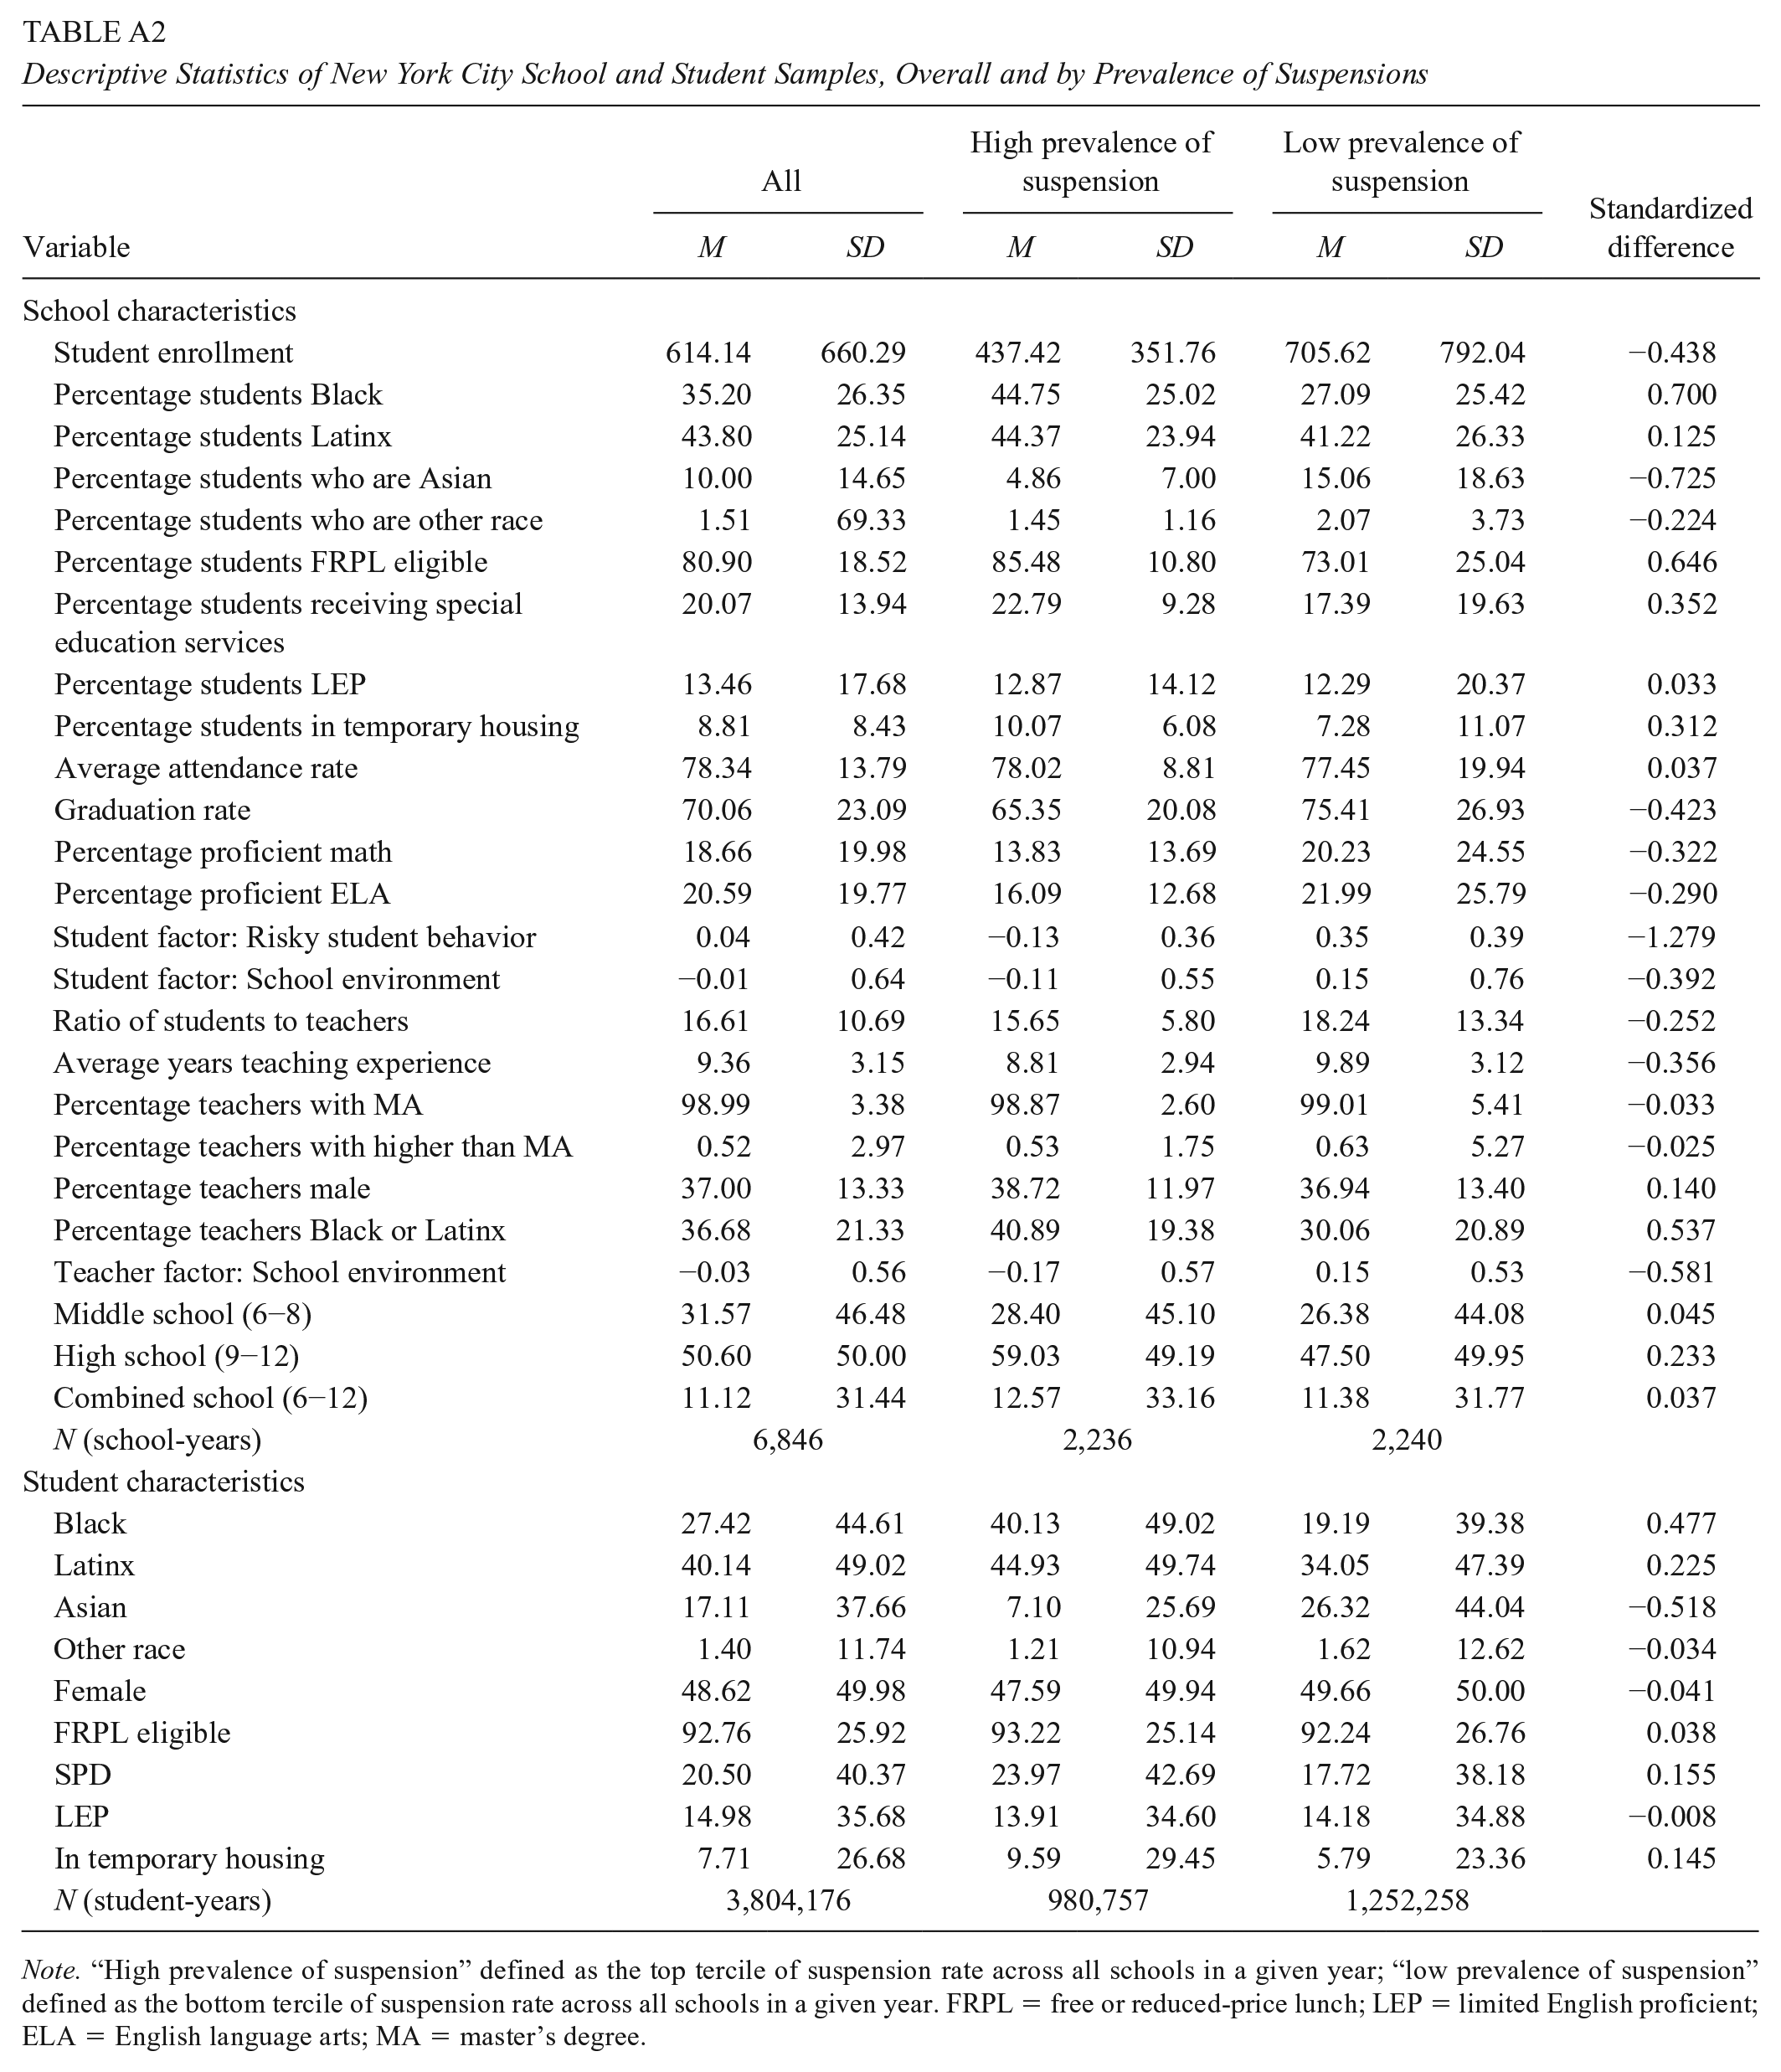
The final school-level analytic sample for this study comprises 993 unique middle and high schools, and the final student-level analytic sample represents about 1.12 million unique middle and high school students. These samples represent a diverse demographic of students served within the public school system in NYC: On average, about 27% of students are Black, 40% are Latinx, and 17%are Asian. Appendix A2 provides a fuller set of sample descriptives of both school- and student-level characteristics.
We empirically demonstrate the analytic framework presented. Using school-level data, we examine how school discipline metrics of prevalence and disparities of suspensions vary over time. The findings illustrate how metrics of prevalence and disparities of discipline point to distinct dilemmas across school environments. We estimate logistic regression models using student- and infraction-level data as described earlier to examine questions related to students’ differential exposure to disciplinary consequences (ODRs and suspensions) as well as differential processing of disciplinary consequences (suspensions) for similar forms of infractions. We juxtapose the school-level descriptive results with those of the regression results to further explicate the nuances in the measurement of exclusionary school discipline within an urban district setting.
Empirical Illustration of Analytic Framework
Prevalence and Disparity of Suspensions
Figure 2 illustrates different measures of prevalence capturing the use of exclusionary discipline within schools throughout the NYC school system over time. Both count-based and rate-based metrics (plots A and B, respectively) show a consistent decline of suspensions over the period of study. In 2012, the average number of suspensions a school meted out was over 60, which declined to an average of approximately 40 suspensions per school by 2019. This decline was largely concentrated in a reduction in students receiving suspensions for the first time in a single school year. The average number of students receiving a suspension within schools was about 40 in 2012 and decreased over time to approximately 25 by 2019, whereas the number of chronically suspended students (i.e., students receiving more than one suspension in a school year) remained comparatively constant at an average value of 10 from year to year. As expected, the reduction in suspensions is also reflected in rate-based metrics as the suspension rate declined from an average of about 8% to 5% of students within a school from 2012 to 2019, and the chronic suspension rate showed a similar but more moderate decline, from an average of about 2% to 1.5% of students within a school being chronically suspended over the same time span.

Prevalence of suspension within schools over time.
Figure 3 illustrates disproportionality in suspensions by student racial/ethnic background over time as measured by the suspension rate index, chronic suspension rate index, and suspension disproportionality ratio. Plot A suggests that, though all the major identifiable racial/ethnic groups experience declines in suspensions over time, the average Black suspension rate is highest overall, whereas average Latinx and White suspension rates are almost identical in any given year. Similarly, though average chronic suspension rates are lower for all student groups, they remain notably higher for Black students compared with all other racial/ethnic student groups (as shown in plot B). The disproportionality ratio measure (plot C) captures the extent to which a specific student group experiences suspensions at a greater rate than what that group appears in the broader population of students within a school. A value above 1 signals disproportionality for a student group, whereas a value at or below 1 indicates that students within the group experience suspensions proportionally (or less than proportionally) to the group’s share within the broader student population within a school. Overall, Black students are disproportionately suspended relative to their share of enrollment by 50%, whereas, on average, White and Latinx students are suspended proportionally to their enrollment. The disproportionality ratio arguably serves as a superior metric to the more common risk index, as it adjusts for the share of student enrollment that a student group comprises within a school. As shown, the disproportionality ratio reveals consistently high suspension rates for Black students relative to White students.

Prevalence in suspension by student race/ethnicity over time.
To illustrate differences in the prevalence of exclusionary discipline experienced across student racial/ethnic groups, Figure 4 presents the average values of three main disparity metrics over time—ARD, RRR, and RDR for suspensions in plots A, B, and C, respectively—with White students serving as the reference group. The results highlight the prominence of Black-White disparities in suspensions. In comparison, the disparity in suspensions experienced across Latinx and White student groups within schools is, on average, minimal or nonexistent in any given year. According to the suspension ARD, the average school suspension rate for Black students is about 0.04 higher than that for White students. Using the suspension RRR, on average, Black students are suspended at twice the rate of White students within the same school. When expressed in raw terms, the suspension RDR suggests that, on average across all schools, six more Black students received suspensions than would have been expected given the suspension rate for White students within the same school.

Disparities in suspension by student race/ethnicity over time.
Although choosing among alternative disproportionality and disparity metrics may seem a matter of pure preference, there are consequential distinctions that researchers and policymakers should be mindful of (Curran, 2020; Girvan et al., 2019). To demonstrate, we explore patterns revealed across a variety of disproportionality and disparity metrics across school contexts based on varying levels of prevalence of exclusionary discipline activity. Figure 5 presents two suspension disproportionality metrics for Black students—risk index (plot A) and disproportionality ratio (plot B)—and three disparity metrics comparing suspensions between the subgroups of Black and White students—ARD (plot C), RRR, (plot D), and RDR (plot E)—over time disaggregated by the prevalence of suspension taking place within a school in a particular year. The “high prevalence” school group comprises schools with a suspension rate in the top tercile of the distribution of schools, and the “low prevalence” school group includes schools in the bottom tercile of the distribution of school-level suspension rate in a given year. As shown, the average rate of suspension for Black students in NYC is nearly 10 times higher in schools with a high prevalence of suspension (plot A), yet the Black suspension disproportionality ratio (plot B) suggests that Black students are disproportionately suspended to a far greater extent in schools with low prevalence of suspension (on average, about 200% higher than their share of the overall school population) than in schools with high prevalence of suspension (about 140% higher than their share of the overall school population). This discrepancy is due to the disproportionality ratio’s adjustment for Black students’ representation in the overall school body. Put simply, although a small share of Black students tend to be suspended in “low prevalence” schools, the share of students who are disciplined in these schools (albeit a small share of the overall student population) tend to be disproportionately Black.
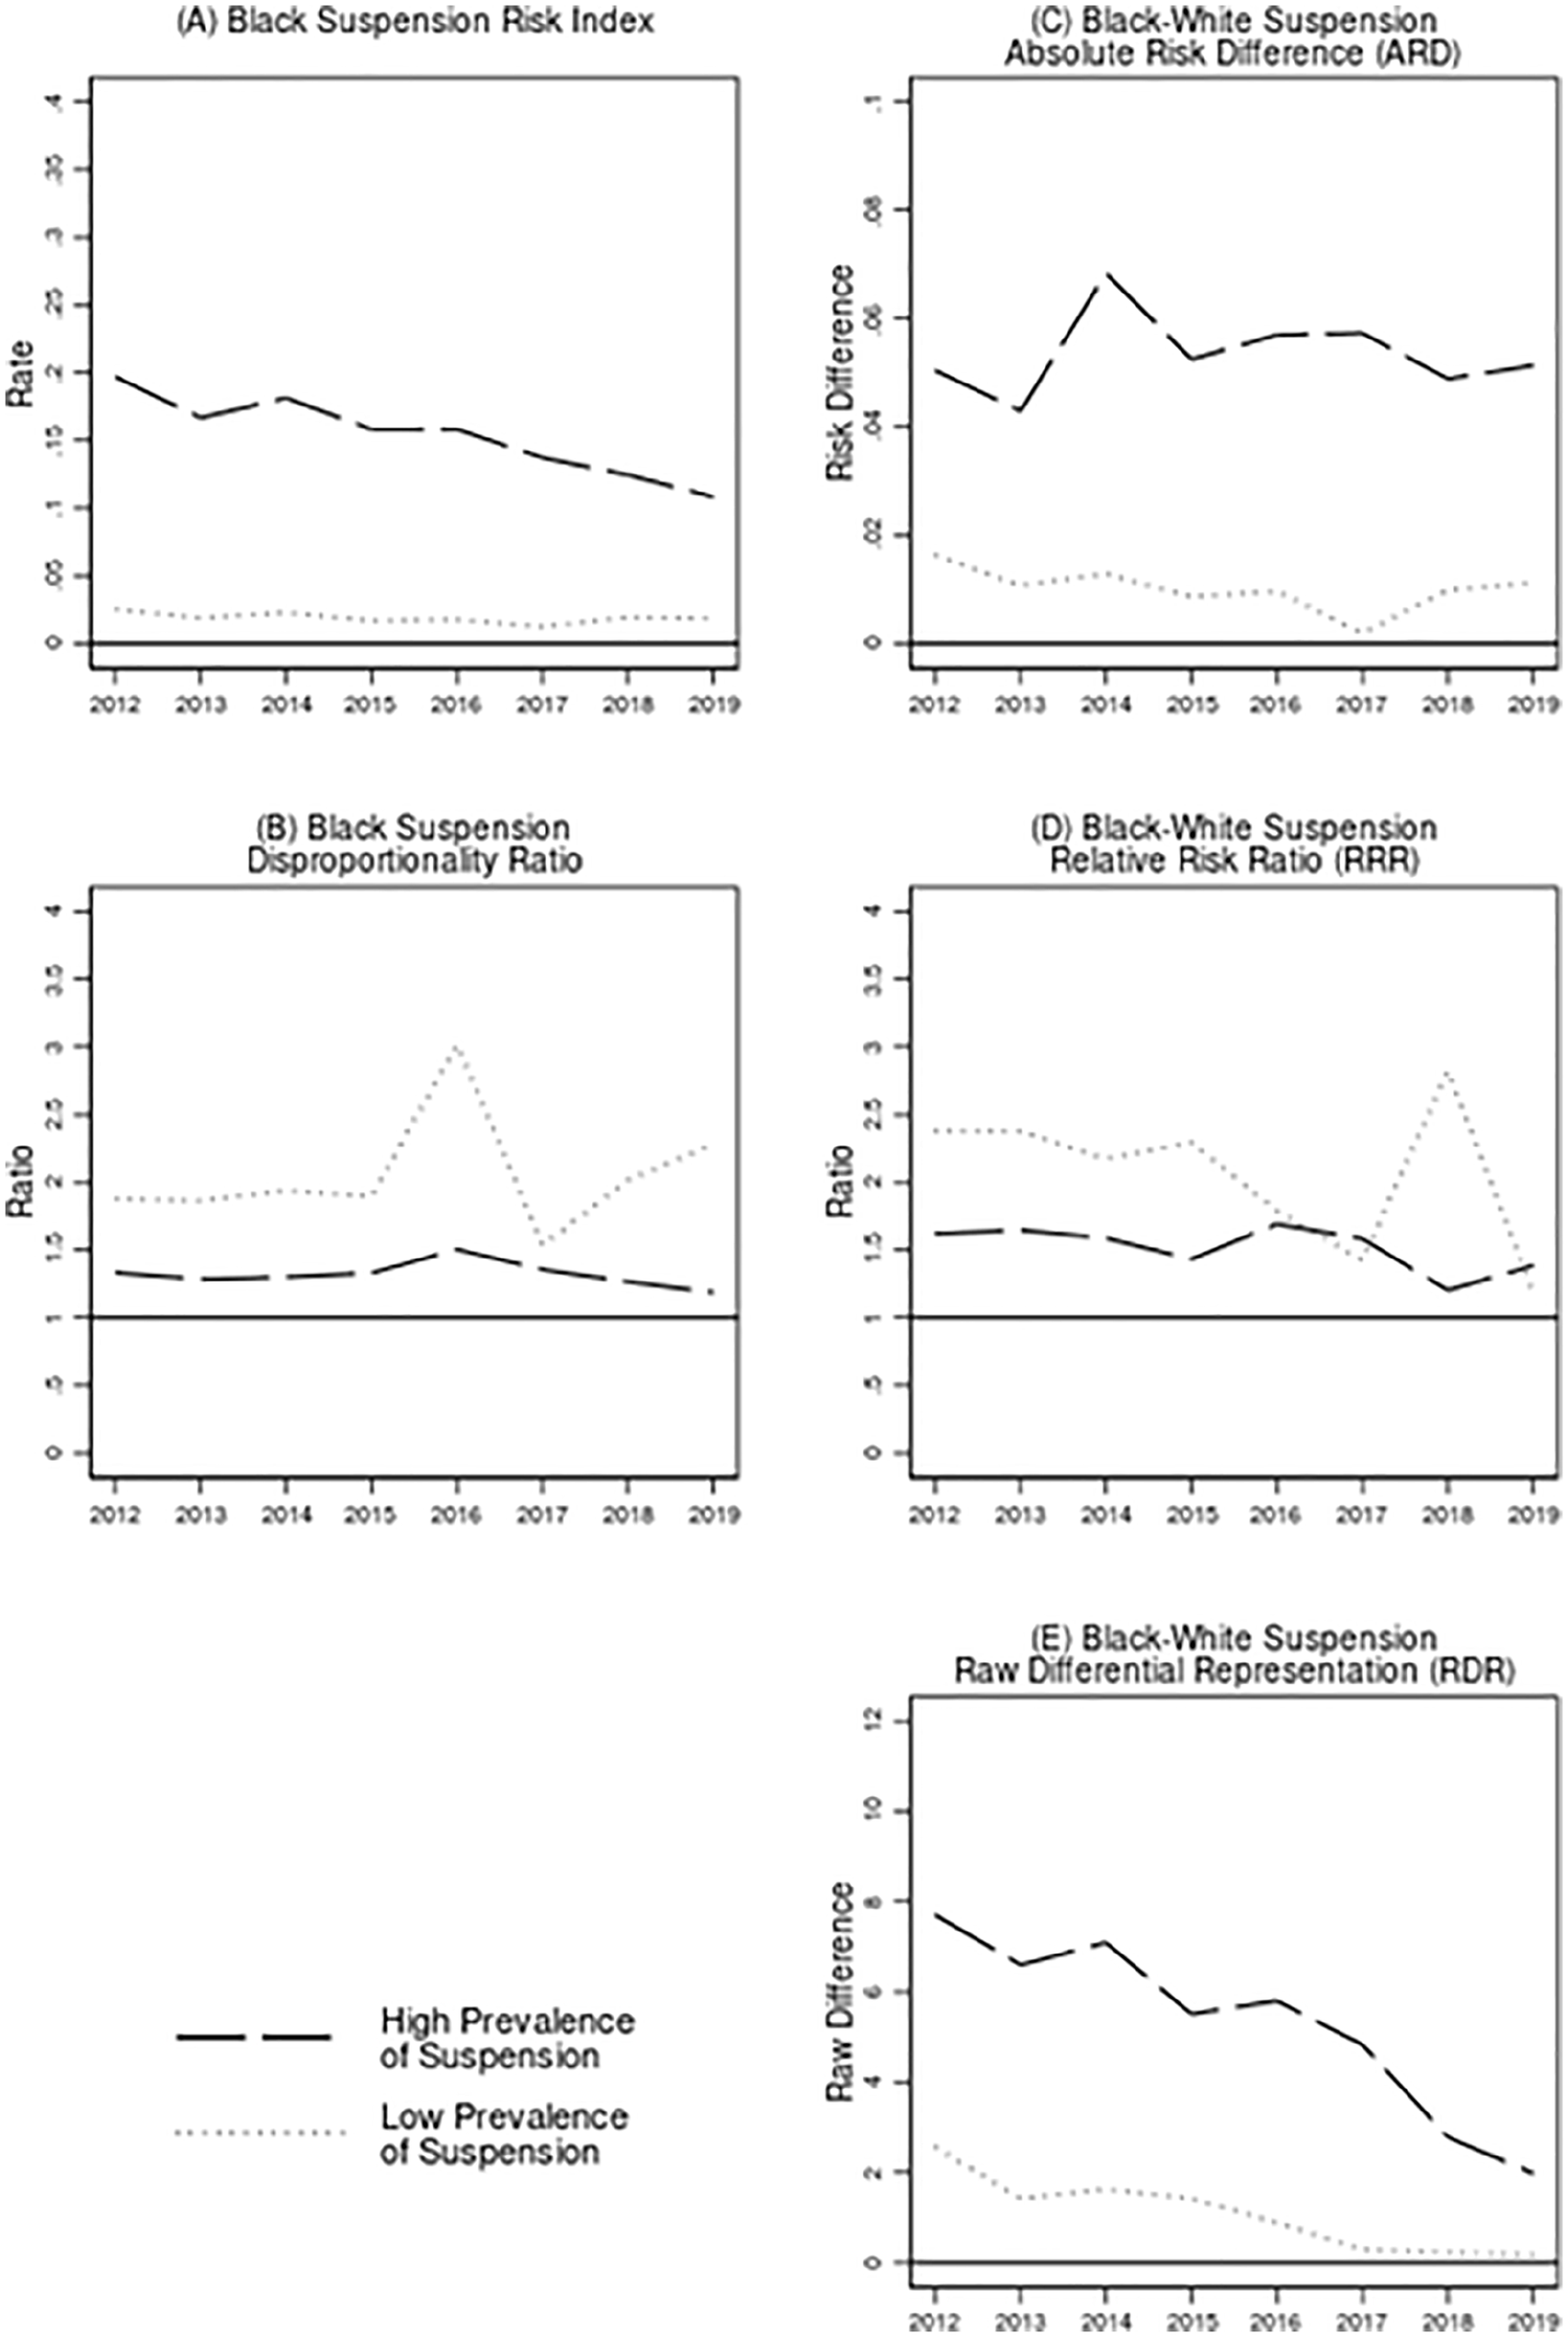
Black disproportionality and Black-White disparity of suspension by prevalence of suspension within school over time.
The disparity metrics across “high prevalence” and “low prevalence” school groups demonstrate yet another nuance worth noting. Plots C through E display patterns of Black-White suspension disparity among schools that serve both Black and White students in a given year. Both the Black-White ARD (plot C) and the Black-White RDR (plot E) suggest that schools with a high prevalence of suspension tend to have larger disparities than schools with a lower prevalence of suspension. However, the Black-White RRR (plot D) suggests otherwise. The contradiction in this case is algebraic in nature, as the RRR is incalculable for schools for which the denominator in Equation 3 is zero (i.e., schools with no suspended White students or schools with no White students at all). Schools excluded from the calculation of the RRR wherein no students in the reference group are suspended also tend to be schools with a low prevalence of suspension overall but also schools with lower Black discipline rates—the average Black discipline index is 1.3% in low-prevalence schools that have no White students who are suspended but 14.7% in high-prevalence schools. A recreation of Figure 5 among a sample omitting schools with zero suspensions for the reference group (White students) confirms this to be the driving factor behind the contradictory conclusions drawn from the RRR and the other disciplinary disparity metrics (all metrics consistently indicate higher Black-White disciplinary disparity in schools with a low prevalence of suspension in the restricted sample, as shown by appendix Figure A1). Due to the RRR’s disregard of schools with no suspended students in the reference group, we argue that ARD and RDR provide a more comprehensive encapsulation of discipline disparities across all school settings, even for those where the reference group experiences no form of exclusionary suspension.
Differential Likelihood of Receiving ODRs and Suspensions
Table 2 presents the results of the regression analyses examining the prevalence and differential processing of exclusionary discipline. In columns 1 and 2, we present estimates from regressions predicting the likelihood of students receiving ODRs and likelihood of students being suspended. This analytical approach sheds light on differential selection or the extent to which some students are more likely to receive exclusionary discipline (without accounting for the severity of infractions). Of all students in NYC, Black students and, to a lesser degree, students of other racial backgrounds (i.e., multiracial or Native American) are more likely to receive ODRs and suspensions than White students. Latinx students are, to an even lesser degree, more likely to receive suspensions than White students but no more likely to experience significantly different exposure to ODRs. FRPL-eligible students, students receiving special education services, and students living in temporary housing are predicted to experience a higher likelihood of exclusionary discipline compared with other students as well. Conversely, female, Asian, and foreign-born students and students with limited English proficiency are less likely to receive an ODR or experience suspension compared with other students. Students with higher proficiency levels are less likely to receive exclusionary discipline, whereas those with a higher number of ODRs in the prior year are more likely to receive ODRs and suspensions.
Predicted Probability of Students Receiving an ODR/Suspension in NYC (2011-2012 to 2018-2019)

Note. Coefficients expressed as odds ratios and standard errors (not shown) clustered at the school-year level. All models control for student grade and adjust for school fixed effects and are estimated using Stata/MP 16. ODR = office discipline referral; FRPL = free or reduced-price lunch; LEP = limited English proficient; ELA = English language arts; MA = master’s degree.
A number of school characteristics are also predictive of whether students are increasingly likely to experience exclusionary discipline, including a higher percentage of FRPL-eligible students and students receiving special education services, a lower average attendance rate, a stronger perception of risky behavior among students within the school, lower years of experience among teaching staff, a less diverse racial and gender composition of teachers, and a more negative perception of the school environment among teachers.
Differential Processing of Suspensions
Column 3 of Table 2 presents estimates from models predicting the likelihood of students being suspended conditional on infraction type, which indicates whether students experience differential processing of reported infractions. These regression analyses shed light on the extent to which certain students are receiving harsher punishment for similar disciplinary infractions. Unsurprisingly, the most predictive factor for whether students are disciplined for an infraction is the infraction’s level of severity (i.e., students are more likely to be disciplined for higher levels of severity). Unlike predicted exposure to exclusionary discipline, predicted differential processing conditional on an infraction’s severity is largely a function of student characteristics; the percentage of students with limited English proficiency and foreign-born students, attendance rate, and graduation rate are among the few school-level characteristics that predict whether infractions are differentially processed. When considering all observable student characteristics, the results indicate that Black and Latinx students, students of other racial backgrounds, FRPL-eligible students, and students in temporary housing are more likely to be suspended conditional on the severity of the disciplinary infraction compared with their reference student groups. Female students, students receiving special education services, and foreign-born students are less likely to be suspended than nonfemale students, students receiving general education services, and native-born students, respectively. It is important to note that race at the individual level and the school level both shape disciplinary outcomes in schools, though fewer than a handful of studies have examined the link between racial threat and disciplinary outcomes (Welch & Payne, 2010, 2018). The majority of studies testing the racial threat hypothesis and social control in schools via school discipline have focused on the percentage of Black students (Peguero & Sherhakkar, 2011; Welch & Payne, 2010). Less attention has been paid to the percentage of Hispanic students in schools, which has yielded inconsistent results (Welch & Payne, 2018).
Discussion
This study highlights the nuanced disciplinary experiences of students and the need for a comprehensive analytic framework that is commensurate with the complexity of the disciplinary process in schools. We present an analytic framework for school discipline patterns that clarifies the conceptual and empirical distinctions between the prevalence and disparities in ODRs and suspensions. Student-level regression analyses further reveal inequities between students within similar school environments that are unrelated to differences in disciplinary infractions. Our findings build on those of Girvan et al. (2019) and are congruent with Curran’s (2020) observation that “[RRRs], RDs and RDR can miss important differences in schools’ use of discipline.” (p. 384).
The presented analyses make evident that patterns of discipline disparity uniquely manifest across schools with varying levels of prevalence of exclusionary discipline. Patterns explored across schools with varying levels of disciplinary prevalence reveal the choice of metric matters as well. That is, schools with a high rate of suspensions are shown to have higher disproportionality and disparities based on the risk index, ARD, and RDR metrics but lower disparities based on the disproportionality ratio and RRR metrics. These differences are attributable to the degree to which the disproportionality metrics adjust for a school’s overall demographic composition, which we argue the disproportionality ratio best executes, as well as the degree to which the disparity metrics consider schools wherein no reference group students are suspended, which we argue the ARD and RDR metrics are better capable of doing.
The analytic framework also illustrates the complexity and variation in students’ disciplinary experiences in schools. In doing so, the plight of Black students’ experiences with regard to exclusionary discipline becomes even starker. Black students have the highest prevalence and the highest disproportionality in NYC. The results from the regression models illustrate that Black students are also most likely to receive ODRs and suspensions and also experience differential processing of suspensions. Additionally, the results suggest that there is also an income and gender imbalance in exclusionary discipline in NYC. Similar to Black students, FRPL-eligible students, students in temporary housing, and male students are more likely to receive ODRs and suspensions as well as experience differential processing of suspensions. The results for Latinx students underscore key nuances in their disciplinary experiences highlighted by prior studies (Welsh & Little, 2018a, 2018b). Although Latino students have low prevalence and disparities, regression results indicate that Latinx students disproportionately receive ODRs and suspensions as well as experience differential processing of suspensions for similar categories of infractions. Thus, the disciplinary experiences of Latinx students are a pertinent concern not because of high prevalence or disproportionality but due to differential processing of ODRs. The findings illustrate that the choice of school discipline metrics not only affects the conclusions drawn, but different metrics capture different dimensions of students’ disciplinary experiences in schools—prevalence and disparities in exclusionary discipline as well as exposure to exclusionary discipline and differential processing.
As described earlier, over the period of study, NYC made a host of policy and program changes to reduce the use of exclusionary discipline and the accompanying racial inequities in disciplinary outcomes. The application of the analytic framework presented in this study informs the debate on the effectiveness of school discipline reforms and helps policymakers and practitioners understand the various ways students may be subjected to exclusionary discipline. For instance, the reduction in the prevalence of suspensions over the period of study corresponds to implementation of disciplinary reforms during the Bloomberg and De Blasio mayoral administrations that aimed to limit the use of exclusionary discipline. Interestingly, the rates of chronically suspended students remained relatively consistent over the period of study. Although the prevalence of suspensions has declined in the NYC school system, there remain stark differences in students’ likelihood of receiving suspensions. Our study raises questions about the efficacy of alternative approaches to exclusionary discipline to reduce racial inequality in suspensions. Considering that both the Bloomberg and DeBlasio administrations made concerted efforts to reduce the use of exclusionary discipline in favor of more restorative approaches, these trends in the dimensions of exclusionary discipline are concerning. The persistence of racial disparities in exclusionary discipline in spite of a slew of school discipline reforms is a cause for concern and warrant further investigation.
Applying the Framework to Educational Practice and Research
A series of metrics and analyses can be used in practice to better understand the school discipline process; the choice of metric and analytic approach will vary based on the local context and the goals of education research. The application of the framework in practice starts with the acknowledgment that metrics provide information on two interrelated challenges: (a) identifying the prevalence of exclusionary discipline and the extent of discipline disparities and (b) developing targeted interventions. A key distinction between school-level metrics that provide insights on differences in disciplinary experiences across student groups and student-level analyses that foster a granular understanding of the contributors to discipline disparities is the extent to which each set of analytic tools may inform targeted and efficacious interventions. The study illustrates that school- and student-level data and analyses can be combined to provide in-depth insights on the interrelated dimensions of the disciplinary process in schools. The school discipline analytic framework illustrates that even though the decline in prevalence is an encouraging sign, policymakers should be attuned to concerning disparities and inequities to exposure to ODR and suspensions as well as the differential processing of suspensions that may still exist. In other words, the prevalence of suspensions should not be the only or the primary indicator of improvement in school discipline. Our findings suggest that to garner an accurate picture of the school discipline landscape in schools and districts, educational stakeholders should be focusing on indicators within the interrelated dimensions of school discipline patterns. Indeed, multiple measures are needed to capture the full story of discipline in schools and different scenarios may call for divergent policy responses.
School-level metrics can help districts and schools determine whether there is racial inequality in exclusionary discipline. Similar to prior studies (Nishioka, 2017), we recommend starting with school-level discipline data disaggregated by student race. Specifically, a Black, White, Latinx, and multiracial students risk index will help educational stakeholders gauge the overall prevalence of exclusionary discipline and begin identifying racial disparities. Where data and local context allow, the prevalence of exclusionary discipline should focus on differentiating suspension types (ISS or OSS). Given that research has highlighted the importance of a student’s disciplinary history and multiple suspensions (Mittleman, 2018; Wilkerson & Afacan, 2021), the chronic discipline rate can provide insights specific to the frequency of repeat offenders. Second, similar to prior studies (Curran, 2020; Girvan et al., 2019), we recommend using multiple measures of disparities (e.g., ARD and RRR) to examine racial disparities in school discipline in order to mitigate the shortcomings of each measure. We favor the common approaches of ARD and RRR over novel approaches (Girvan et al., 2019) for ease of understanding across educational stakeholders and alignment with the yardstick of federal policies. These two sets of indicators at the school and district levels will allow educational leaders to determine the presence of racial inequality in exclusionary discipline.
Student-level and infraction-level data regression analyses provide insights on the nature of discipline disparities and may inform how schools and districts may craft alternative approaches to exclusionary discipline. We recommend that educational leaders focus on two key disciplinary outcomes—ODRs and suspensions—and differential processing. Linking infractions to consequences is the crux of these analyses. In order to learn more about the conversion of ODRs into suspensions, we recommend predicting the likelihood of ODRs using the entire sample of students. In order to learn more about whether discipline disparities are driven by differential selection versus differential processing, we recommend using regression analyses predicting the likelihood of suspensions conditional on the severity of infractions using a sample of students who have received ODRs. Additionally, it is important to pay particular attention to suspension types and the use of ISS versus OSS. Although ISS is characterized as a lesser form of exclusion, it still entails restricting students’ learning opportunities by removing them from classrooms (Anyon et al., 2021; Welsh & Little, 2018a). Moreover, ISS may be as prevalent as OSS in some schooling contexts, and the racial disparities in OSS are often duplicated in ISS (Anyon et al., 2021; Welsh, 2021).
In order to more accurately specify the dimensions of school discipline that are the focus of research studies in hopes of organizing the rapidly growing empirical literature on school discipline, we encourage researchers to pay particular attention to the dimension of school discipline to bolster the comparability of school discipline patterns across contexts. The analytic framework outlined and demonstrated in this study provides a holistic consideration of the conceptually interrelated yet distinct depictions of discipline patterns. Applying this framework can reduce fragmentation across the different fields, foster fruitful comparisons of the nuances of the disciplinary process across different contexts, and ultimately, inform more targeted and effective school discipline policy. It is important to note that even though enrollment is the predominant school factor used in adjustments for prevalence, future studies may also consider pertinent factors. For instance, the duration of the school year is a pertinent factor that may shape prevalence (Girvan et al., 2019) and may vary significantly across districts and regions. In addition to enrollment, future research may also consider possible adjustment for the school year as educational stakeholders continue to refine how school discipline is measured. Without greater attention and specificity, researchers and educational stakeholders are likely confounding different dimensions of school discipline and using terms interchangeably that mean different things.
Footnotes
Appendix
Descriptive Statistics of New York City School and Student Samples, Overall and by Prevalence of Suspensions
| Variable | All | High prevalence of suspension | Low prevalence of suspension | Standardized difference | |||
|---|---|---|---|---|---|---|---|
| M | SD | M | SD | M | SD | ||
| School characteristics | |||||||
| Student enrollment | 614.14 | 660.29 | 437.42 | 351.76 | 705.62 | 792.04 | −0.438 |
| Percentage students Black | 35.20 | 26.35 | 44.75 | 25.02 | 27.09 | 25.42 | 0.700 |
| Percentage students Latinx | 43.80 | 25.14 | 44.37 | 23.94 | 41.22 | 26.33 | 0.125 |
| Percentage students who are Asian | 10.00 | 14.65 | 4.86 | 7.00 | 15.06 | 18.63 | −0.725 |
| Percentage students who are other race | 1.51 | 69.33 | 1.45 | 1.16 | 2.07 | 3.73 | −0.224 |
| Percentage students FRPL eligible | 80.90 | 18.52 | 85.48 | 10.80 | 73.01 | 25.04 | 0.646 |
| Percentage students receiving special education services | 20.07 | 13.94 | 22.79 | 9.28 | 17.39 | 19.63 | 0.352 |
| Percentage students LEP | 13.46 | 17.68 | 12.87 | 14.12 | 12.29 | 20.37 | 0.033 |
| Percentage students in temporary housing | 8.81 | 8.43 | 10.07 | 6.08 | 7.28 | 11.07 | 0.312 |
| Average attendance rate | 78.34 | 13.79 | 78.02 | 8.81 | 77.45 | 19.94 | 0.037 |
| Graduation rate | 70.06 | 23.09 | 65.35 | 20.08 | 75.41 | 26.93 | −0.423 |
| Percentage proficient math | 18.66 | 19.98 | 13.83 | 13.69 | 20.23 | 24.55 | −0.322 |
| Percentage proficient ELA | 20.59 | 19.77 | 16.09 | 12.68 | 21.99 | 25.79 | −0.290 |
| Student factor: Risky student behavior | 0.04 | 0.42 | −0.13 | 0.36 | 0.35 | 0.39 | −1.279 |
| Student factor: School environment | −0.01 | 0.64 | −0.11 | 0.55 | 0.15 | 0.76 | −0.392 |
| Ratio of students to teachers | 16.61 | 10.69 | 15.65 | 5.80 | 18.24 | 13.34 | −0.252 |
| Average years teaching experience | 9.36 | 3.15 | 8.81 | 2.94 | 9.89 | 3.12 | −0.356 |
| Percentage teachers with MA | 98.99 | 3.38 | 98.87 | 2.60 | 99.01 | 5.41 | −0.033 |
| Percentage teachers with higher than MA | 0.52 | 2.97 | 0.53 | 1.75 | 0.63 | 5.27 | −0.025 |
| Percentage teachers male | 37.00 | 13.33 | 38.72 | 11.97 | 36.94 | 13.40 | 0.140 |
| Percentage teachers Black or Latinx | 36.68 | 21.33 | 40.89 | 19.38 | 30.06 | 20.89 | 0.537 |
| Teacher factor: School environment | −0.03 | 0.56 | −0.17 | 0.57 | 0.15 | 0.53 | −0.581 |
| Middle school (6−8) | 31.57 | 46.48 | 28.40 | 45.10 | 26.38 | 44.08 | 0.045 |
| High school (9−12) | 50.60 | 50.00 | 59.03 | 49.19 | 47.50 | 49.95 | 0.233 |
| Combined school (6−12) | 11.12 | 31.44 | 12.57 | 33.16 | 11.38 | 31.77 | 0.037 |
| N (school-years) | 6,846 | 2,236 | 2,240 | ||||
| Student characteristics | |||||||
| Black | 27.42 | 44.61 | 40.13 | 49.02 | 19.19 | 39.38 | 0.477 |
| Latinx | 40.14 | 49.02 | 44.93 | 49.74 | 34.05 | 47.39 | 0.225 |
| Asian | 17.11 | 37.66 | 7.10 | 25.69 | 26.32 | 44.04 | −0.518 |
| Other race | 1.40 | 11.74 | 1.21 | 10.94 | 1.62 | 12.62 | −0.034 |
| Female | 48.62 | 49.98 | 47.59 | 49.94 | 49.66 | 50.00 | −0.041 |
| FRPL eligible | 92.76 | 25.92 | 93.22 | 25.14 | 92.24 | 26.76 | 0.038 |
| SPD | 20.50 | 40.37 | 23.97 | 42.69 | 17.72 | 38.18 | 0.155 |
| LEP | 14.98 | 35.68 | 13.91 | 34.60 | 14.18 | 34.88 | −0.008 |
| In temporary housing | 7.71 | 26.68 | 9.59 | 29.45 | 5.79 | 23.36 | 0.145 |
| N (student-years) | 3,804,176 | 980,757 | 1,252,258 | ||||
Note. “High prevalence of suspension” defined as the top tercile of suspension rate across all schools in a given year; “low prevalence of suspension” defined as the bottom tercile of suspension rate across all schools in a given year. FRPL = free or reduced-price lunch; LEP = limited English proficient; ELA = English language arts; MA = master’s degree.
Acknowledgements
The authors gratefully acknowledge the Research Alliance for New York City Schools and the New York City Department of Education for their cooperation and assistance with providing the necessary data to conduct these analyses. The views expressed herein are those of the authors and should not be attributed to their institutions or data providers. Any and all errors are attributable to the authors.
Authors
LUIS A. RODRIGUEZ is an assistant professor of education leadership and policy studies at New York University. His research focuses on the K–12 teacher labor market and policies intended to improve quality, retention, and diversity within the teaching workforce.
RICHARD O. WELSH, PhD, is an assistant professor of education leadership and policy studies at New York University. His research focuses on the economics of education; K–12 education policy, including student discipline and school choice policies; and key mechanisms such as student mobility.