
Abstract
Computational thinking (CT) is a set of cognitive skills that every child should acquire. K–12 classrooms are expected to provide students opportunities (tasks) to think computationally. We introduce a CT competency assessment for middle school students. The assessment design process started by establishing a cognitive model of CT domain mastery, in which three broad skill types were identified to represent CT competency. After multiple-choice item prototypes were written, pilot tested, and revised, 15 of them were finally selected to be administered to 564 students in two middle schools in the Midwestern United States. Using a cognitive diagnostic scoring model, mastery classifications for each student were determined that can be used diagnostically by teachers as a pretest and, perhaps in the future, to compare the outcomes of CT instructional programs. The results inform an initial understanding of typical learning progressions in CT at the middle school level.
Keywords
The future workforce requires a new core set of skills because of today’s rapid changes in innovation and technology. K–12 education should equip students to acquire these skills for the challenges they will face (National Research Council, 2010). One of these skills is computational thinking (CT). In recent years, multiple stakeholders have made efforts to integrate CT into K–12 education (e.g., science, technology, engineering, and mathematics plus computing; STEM+C program offered by National Science Foundation, 2018). A report released by the National Science and Technology Council (2018) described the federal government’s 5-year strategic plan for STEM education, which includes a clear focus on CT development. One of the document’s key ideas is that CT should be an integral element of all educational activities, with the goal of building “a more STEM-literate public” (p. 24).
Considerable empirical research has examined the ways of bringing CT strategies to all educational activities. These inquiries into CT have been centered around (1) how to best prepare future educators in CT awareness (e.g., Uzumcu & Bay, 2021) and (2) the integration of CT across various specific content areas. For example, a taxonomy of CT competencies in math and science was implemented in high schools to enhance science learning (Weintrop et al., 2016). An agent-based computer instructional tool was designed with the aim of integrating CT through simulation in middle schools’ physics and biology classes (Sengupta et al., 2013).
Many studies have concluded that computer science (CS) instruction or technology classes (e.g., robot-related programming instruction) should be deliberately structured in a way that CT is fostered. Although students may acquire CT strategies while creating digital artifacts, they may be more likely to do so when those design products are outcomes of a developed CT curriculum. Favorable CT learning outcomes have been reported in various settings, including after-school CS programs (Mouza et al., 2016) and the use of simulation instructional units in the middle school classrooms (Berland & Wilensky, 2015).
As outlined above, K–12 education is expected to provide students opportunities, through tasks, to think computationally. To advance CT education, researchers (e.g., Hsu et al., 2018) have advocated that instruction and assessment should inform each other to enhance students’ learning experiences. Within this scope, one of the crucial aspects is establishing a CT assessment framework. As Bonner et al. (2021) have pointed out, “while a number of conceptually based curricula that draw on CT concepts have been developed and are now being taught in schools in the United States, the assessment of CT is still in its infancy” (p. 27).
In this present research, we introduce a computational thinking competency assessment (CTCA) for middle school students. The goal is that the results can be used diagnostically by teachers as a pretest and, perhaps in the future, to compare the outcomes of CT instructional programs. The results also inform an initial understanding of typical learning progressions in CT at the middle school level.
The remainder of this paper is structured as follows: first, we summarize existing assessments in CT literature. Second, we describe the design features of the CTCA, response data from which are intended to be analyzed using cognitive diagnostic modeling (CDM; e.g., Deonovic et al., 2019). Third, we present the design process for the CTCA in detail, such as item development and revisions. Finally, we evaluate the psychometric properties of the assessment, based on students’ response data. This research will allow us to provide initial evidence regarding the question:
What is the learning progression of CT competency among middle school students?
Existing Assessments in Computational Thinking
Existing instruments to measure K–12 students’ CT reflect the diverse range of instructional approaches implemented. Two main perspectives about CT development have emerged in the literature (e.g., Kite et al., 2021; Huang & Looi, 2021): (1) the context of programming instruction may foster CT development, but (2) it is also feasible to develop real-world problem-solving tasks that do not require students to possess any prior ability to produce digital artifacts. We review first assessment instruments that involve programming, followed by instruments that can be used outside of programming instruction contexts.
Brennan and Resnick (2012) proposed what is arguably the first CT assessment framework for young learners (between the ages of 8 and 16). They used Scratch (https://scratch.mit.edu/), a block-based programming language. Using observations and digital artifacts–based interviews, the authors extracted three strands to represent students’ CT. The strands consist of (1) CT concepts (e.g., loops) that are common in many programming languages; (2) CT practices, or how students engage the CT concepts to create the digital artifacts; and (3) CT perspectives, or how young computational thinkers view the world around them.
Inspired by Brennan and Resnick’s work, Zhong et al. (2016) further refined these three strands and proposed a Three-Dimensional Integrated Assessment (TDIA) framework for the 3D Alice environment (www.alice.org). The TDIA contained six tasks generated from two categories: code completion, in which fifth and sixth graders were given an incomplete code, and error correction, in which a 3D interface was provided with a storytelling scenario (e.g., rabbits in the garden). Another assessment of CT in the 3D Alice environment, the Fairy Assessment by Werner et al. (2012), gives middle school learners incomplete blocks of code to complete. As part of the computer game programming instruction, the Fairy Assessment assesses thinking algorithmically, as well as making effective use of abstraction and modeling. Both of these assessments require students to have received prior instruction in Alice programming.
An assessment designed by Bonner et al. (2021) is intended to support self-regulated learning, which highlights the metacognitive aspects of CT competency. The assessment contains: (1) a series of forethought questions (10 items); (2) CT performance tasks that require students to produce digital artifacts based on a Fish Game or Clicker Game that were adapted from learning units in the Advanced Placement CS Principles curriculum (Code.org); and (3) a series of reflection questions (12 items). The CT performance tasks are aligned with the CT concepts proposed by Brennan and Resnick (2012).
The empirical studies mentioned previously offer a variety of contexts to assess CT. They also require rubrics to score students’ work. In contrast, some researchers have developed multiple-choice items. The advantage of multiple-choice items is their ease and the availability of quick scoring methods. Román-González et al. (2017) developed a CT test consisting of 28 multiple-choice items for students from Grade 5 to Grade 10. The items were generated from seven CT competencies (e.g., loops-repeat until). The psychometric analysis of the students’ response data showed that the internal consistency reliability of total scores from the instrument is strong.
Buffum et al. (2015) developed Computer Science Knowledge Assessments for middle school students. The assessment aimed to measure the effectiveness of a CS education intervention in the ENGAGE game-based learning environment. The authors developed a set of multiple-choice items with a reasonable testing time suitable for middle school classrooms and piloted them with a representative sample of students. The assessment was aligned with AP CS Principles Draft Curriculum Framework. The content of items includes, for example, sequencing and iteration.
The programming context (e.g., block-based language programming) is a feasible context for assessing students’ CT. However, recent policy documents call for CT to be integrated across school subjects, including subjects in which programming instruction may not be suitable; even in programming instruction contexts, a pretest is needed before students learn any formal computational knowledge (e.g., Lu & Fletcher, 2009; Kite et al., 2021). Thus, another CT assessment development perspective in the literature is centered around using other real-world applications as contexts in which to assess CT. For example, recently Tran (2019) developed a Computational Thinking Assessment for students in Grade 3. The assessment contains 10 items (e.g., fill in the blank), which were written to measure five computational concepts—sequence, algorithm, looping, debugging, and conditionals—and that rely on real-world applications such as exercising at the gym.
Another CT assessment that does not require pre-knowledge of programming is Gouws et al.’s (2013) assessment developed for first-year college students in an introductory CS course. They explicitly aimed to “assess the raw skills that students possess before they have learned anything as part of the formal academic course” (p. 273). The test measures six areas such as patterns and algorithms. The test contains 25 real-world application items (e.g., frog jumps) that can be objectively scored. As the pioneer work in assessing CT, this work highlighted the use of a CT test before students learn any programming knowledge.
Relatedly, a number of authors have developed assessment instruments containing modified Bebras tasks. Bebras tasks were originally developed in Europe as a style of international competition to spur students’ interest in informatics (Dagienė & Futschek, 2008; Vaníček, 2014). The tasks are embedded in a storytelling context (e.g., a beaver controls a grid of lamps). Dagiene et al. (2017) categorized Bebras tasks with the intention of supporting either curriculum teaching or practice for the Bebras contest. They also defined CT as (1) abstraction, (2) algorithmic thinking, (3) decomposition, (4) evaluation, and (5) generalization. Solving the tasks does not require that students possess any programming knowledge. Although Bebras tasks are promising as a mode of CT assessment, because they were not originally intended for formal assessment, the tasks’ early documentation did not provide information about how student response data supports the scores’ meaning. Thus, scholars designing assessments based on Bebras tasks have had to collect validity evidence to support their use in assessing CT competency (work that is ongoing).
One assessment being developed based on Bebras tasks, the Assessment of Computing for Elementary Students (ACES; Parker et al., 2021), measures the CT concepts of loops and sequences for students in Grades 3–5. The ACES contains 10 questions, including both block-based coding questions and Bebras-style questions. Wiebe et al. (2019) also developed a CT assessment for middle school students using Bebras tasks. The 25 multiple-choice items were developed from both Bebras tasks and the CT test (developed by Román-González et al., 2017, mentioned previously). The authors explicitly acknowledged that the Bebras tasks were designed for competition, not for assessment, and validity evidence should therefore be collected. Thus, they collected students’ response data and used item response theory (IRT) models to assess the dimensionality of the data and support score interpretation.
As the literature discussed previously shows, the content framework and design principles adopted in CT competency assessment vary considerably. The weight of validity evidence supporting existing assessment instruments also varies. Some existing assessments are appropriate for use across instructional contexts, particularly when programming is not a goal of instruction, and some can be objectively (and therefore rapidly) scored. The limitations of all the existing assessment instruments are that (1) they yield only total scores, and (2) they do not report sufficient well-established psychometric properties (e.g., model-data fit statistics).
Our CTCA brings together a content framework drawing on the CT literature, a scoring system based on CDM, and associated explicit score interpretations about multiple discrete attributes, or cognitive skills, of CT. Our goal is that data from the assessment could be used to inform theory about students’ learning progressions in CT across developmental stages, to evaluate CT instructional interventions, and to assess classrooms by the teachers. Although it might be possible to analyze item response data from existing CT assessments using CDMs, the psychometric problems of “retrofitting” CDMs to data from assessments that were not designed to be scored using these methods are well known (e.g., de la Torre & Karelitz, 2009), so developing a new assessment that was intended from the beginning to provide fine-grained diagnostic scores seemed prudent.
Design Process
The design of the CTCA follows the most recent Standards for Educational and Psychological Testing, jointly published by the American Educational Research Association, American Psychological Association, and National Council on Measurement in Education (hereafter, the Standards; American Educational Research Association [AERA], American Psychological Association [APA], & National Council on Measurement in Education [NCME], 2014). In order to design a coherent assessment, multiple design decisions should be explicitly articulated. In assessment design language, the argument-based approach to validation (Kane, 2013) refers to “the proposed score interpretations and uses that are validated” (p. 1).
Domain Analysis
During domain analysis, assessment developers make decisions about how to obtain substantive information within the performance or content domain of interest (Mislevy & Riconscente, 2015; Pellegrino et al., 2016). Although previous research has explored characteristics of CT relating to communication, collaboration, and participation, we adopted the CT definition proposed by Barr and Stephenson (2011). Namely, CT is a series of mental operations used to solve a problem, so that the problem may be automated on a computer. This definition is also used in the national standards published by the Computer Science Teacher Association (CSTA; 2011). We specified that the assessment should be usable across school subject areas and should not require previous programming instruction.
Assessment developers must collaborate with subject-matter experts (SMEs) to identify the information that can be used for assessment design (Mislevy & Riconscente, 2015). During the domain analysis, domain modeling, and Q-matrix validation phases of this study, three panel reviews were conducted to collect input from SMEs. The Q-matrix is an alignment table between the attributes and the items. Each panel review meeting with SMEs was in person and lasted about 60 minutes. The SMEs were two middle school teachers who had experiences in CT education and two academic researchers who had expertise in CT as well as CS.
National or state standards reflect what students should know and be able to do at certain grade level(s). To delineate an assessment content framework for the CTCA, in order to identify learning goals for students at middle school grades, the assessment design started by examining a performance objectives document. The CSTA K–12 Computer Science Standards (2011) were used because empirical research on CT conducted in K–12 has often used those standards as the starting point in characterizing the curriculum or assessment (e.g., Tran, 2019; Chen et al., 2017).
The standards have three levels in each of five strands. The CTCA is developed to measure Level 2 (i.e., middle school level) in the computational thinking strand, which contains 15 standard statements. Among the 15 statements, 9 of them require either (1) the use of a computer (e.g., “Analyze the degree to which a computer model accurately represents the real world”), or (2) the integration of CT in other content areas (e.g., “Interact with content-specific models and simulations to support learning and research”). These nine statements were not considered in the CTCA design because they were not aligned with the design decisions made previously.
The next design decision was: Among the remaining six standard statements, which ones should be selected to guide the next design activities (e.g., item development) for the CTCA? It would have been possible to use all six standard statements. However, covering more standards statements would have required more assessment items. Considering the tradeoff between ensuring a reasonable testing time and administering a comprehensive test, three standard statements were selected to be further structured into claims, as shown below:
Claim 1: Students are able to use visual representations of problem state, structures, and data.
Claim 2: Students are able to describe and analyze a sequence of instructions being followed.
Claim 3: Students are able to examine connections between elements of mathematics and computer science, including binary numbers, logic, sets, and functions.
In an achievement test design, a claim about score interpretation typically reflects students’ standing with respect to specific learning standards that have been put forth (Kane, 2013). For example, one possible claim in math is that “Students are able to identify when two expressions are equivalent” (e.g., x + x + x = 3x). The score interpretation, therefore, involves claims about students’ fluency in algebraic manipulation. In an argument-based approach to validation (Kane), such claims connect what is valued in instruction (or standards), what the items are designed to elicit, and what their scores on the assessment represent.
Domain Modeling
Next, a domain modeling design activity was carried out. The purpose was to examine how each claim should be unfolded (Pellegrino & Wilson, 2015). Claims cannot be directly used to guide the item development. At the end of this design activity, a set of fine-grained testable elements (categories) were extracted from the claims. Each testable element was then treated as a latent attribute of CT competency. A CT model of domain mastery consists of these attributes, labeled below as A1, A2, and A3:
A1: Students are able to identify the underlying corresponding pattern (e.g., trend or relation) in a given stimulus material. The material can include graphs, letters of the alphabet, or maps.
A2: Students are able to execute steps in an algorithm. That is, a series of ordered steps is given in an algorithm in order to generate its output, in which none of the steps can be skipped.
A3: Students are able to evaluate variables in an algorithm by examining the predefined conditions.
These three attributes were extracted based on the existing literature. For A1, we used the ideas provided by Gouws et al. (2013), Selby (2015), and Hsu et al. (2018). Attribute A2 was inspired by Looi et al. (2018), Wolz et al. (2011), and Rich et al. (2020). For the third attribute (A3), we used the ideas provided by Threekunprapa and Yasri (2020a, 2020b) and Kotsopoulos et al. (2017).
The first round of panel review was conducted. The SMEs reviewed the summary of the literature, and three selected standard statements. They agreed that the selected standard statements can represent the domain of CT for the sake of content coverage. The SMEs also expressed consensus agreement that the extracted testable elements could be used to guide the development of item prototypes.
The Intended Cognitive Diagnostic Scoring Model
After identifying testable elements of the CT performance domain, and before writing items, we decided on an intended statistical model for generating summary scores from students’ assessment item responses. Traditional one-dimensional IRT models locate a student’s ability on a latent continuous scale. The model estimates a single score to represent each student’s ability on the construct measured by an assessment, the latent variable score, denoted as
In CDMs, an attribute simply describes an identified thinking skill or knowledge state in educational assessment. In a simple algebra example, shown in Table 1, these attributes are addition, subtraction, multiplication, and division. To operationalize latent attributes in assessment design, a CDM assessment requires the implementation of a “Q-matrix,” a formal cognitive model to describe the qualitative relationship among items (Haberman & von Davier, 2006). A Q-matrix has
A Toy Example for the Q-matrix in the CDM

Note. CDM = cognitive diagnostic modeling.
In the CDM, each student’s performance is decomposed into k attributes, so their scores are estimated as a vector
To estimate the profile scores, more than 10 different parametric scoring models have been proposed (von Davier, 2019). The deterministic inputs, noisy “and” gate (DINA; Junker & Sijtsma, 2001) model is used in this research. The DINA model is a conjunctive model, meaning that students must possess all the attributes required by an item j in order to maximize their probability of getting a correct answer. A student’s latent response

If
Since the CTCA assessment items are multiple-choice items, a student may guess an item response correctly absent the required attributes (e.g., simply because of luck). Alternatively, a student may get an answer wrong when they possess all the required attributes for that item. Therefore, two item parameters are used to characterize item j in the DINA model. The parameter

The parameter

Simply put, the slipping parameter is the probability that a student makes a mistake despite possessing all the required attributes. The guessing parameter is the probability that a student answers an item correctly when one or all required attributes are absent. The DINA model then gives the probability of responding correctly to item j for person i as shown in Equation 4:

We chose the DINA model among other models in the CDM because it is parsimonious, with only two item parameters that are straightforward to interpret (de la Torre et al., 2010; de la Torre, 2009). In addition, Paulsen and Valdivia (2021) used simulation studies to demonstrate that the DINA and non-parametric cognitive diagnosis models have acceptable classification accuracy when sample size is as small as 25 test-takers, which might realistically be observed in the classroom settings where we expect the CTCA to be used. Also, several of the parametric CDM scoring models, including the DINA model, the log-linear, and G-DINA models, are interrelated within the General Diagnostic Model (GDM) framework, so the DINA model has a well-understood relationship to other possible scoring models (von Davier, 2014, 2019).
Item Prototype Writing
In total, 34 item prototypes were developed based on the testable elements and an initial Q-matrix. Figure 1 describes the CTCA design methodology. The assessment design started from the definition of CT and three selected claims to represent CT competency. Moving to the right is synonymous with moving from general to specific. Three fine-grained categories extracted from the literature were used to represent how claims are elaborated for assessment design purpose. Thus, the formal cognitive structure of CT is a list that contains these three discrete attributes. In the third and fourth layers, the scoring model (i.e., the DINA model) that is the parametric psychometric modeling and CT competency are tied together by a Q-matrix.

The computational thinking competency assessment (CTCA) design methodology.
Subsequently, the second round of panel reviews was conducted where the SMEs were required to judge (1) the quality of the Q-matrix, that is, the alignment between items and attributes, and (2) the quality of the item prototypes. The panel’s feedback was as follows: (a) five item prototypes should be deleted because the design rationale was not suitable for CT, and (b) 10 items should be re-structured. Their design rationale was promising for eliciting CT competency, but the items needed to be better orchestrated. For illustration, Table 2 contains two of the problematic item prototypes along with the specific comments provided by the SMEs.
Specific Comments Provided by Subject Matter Experts
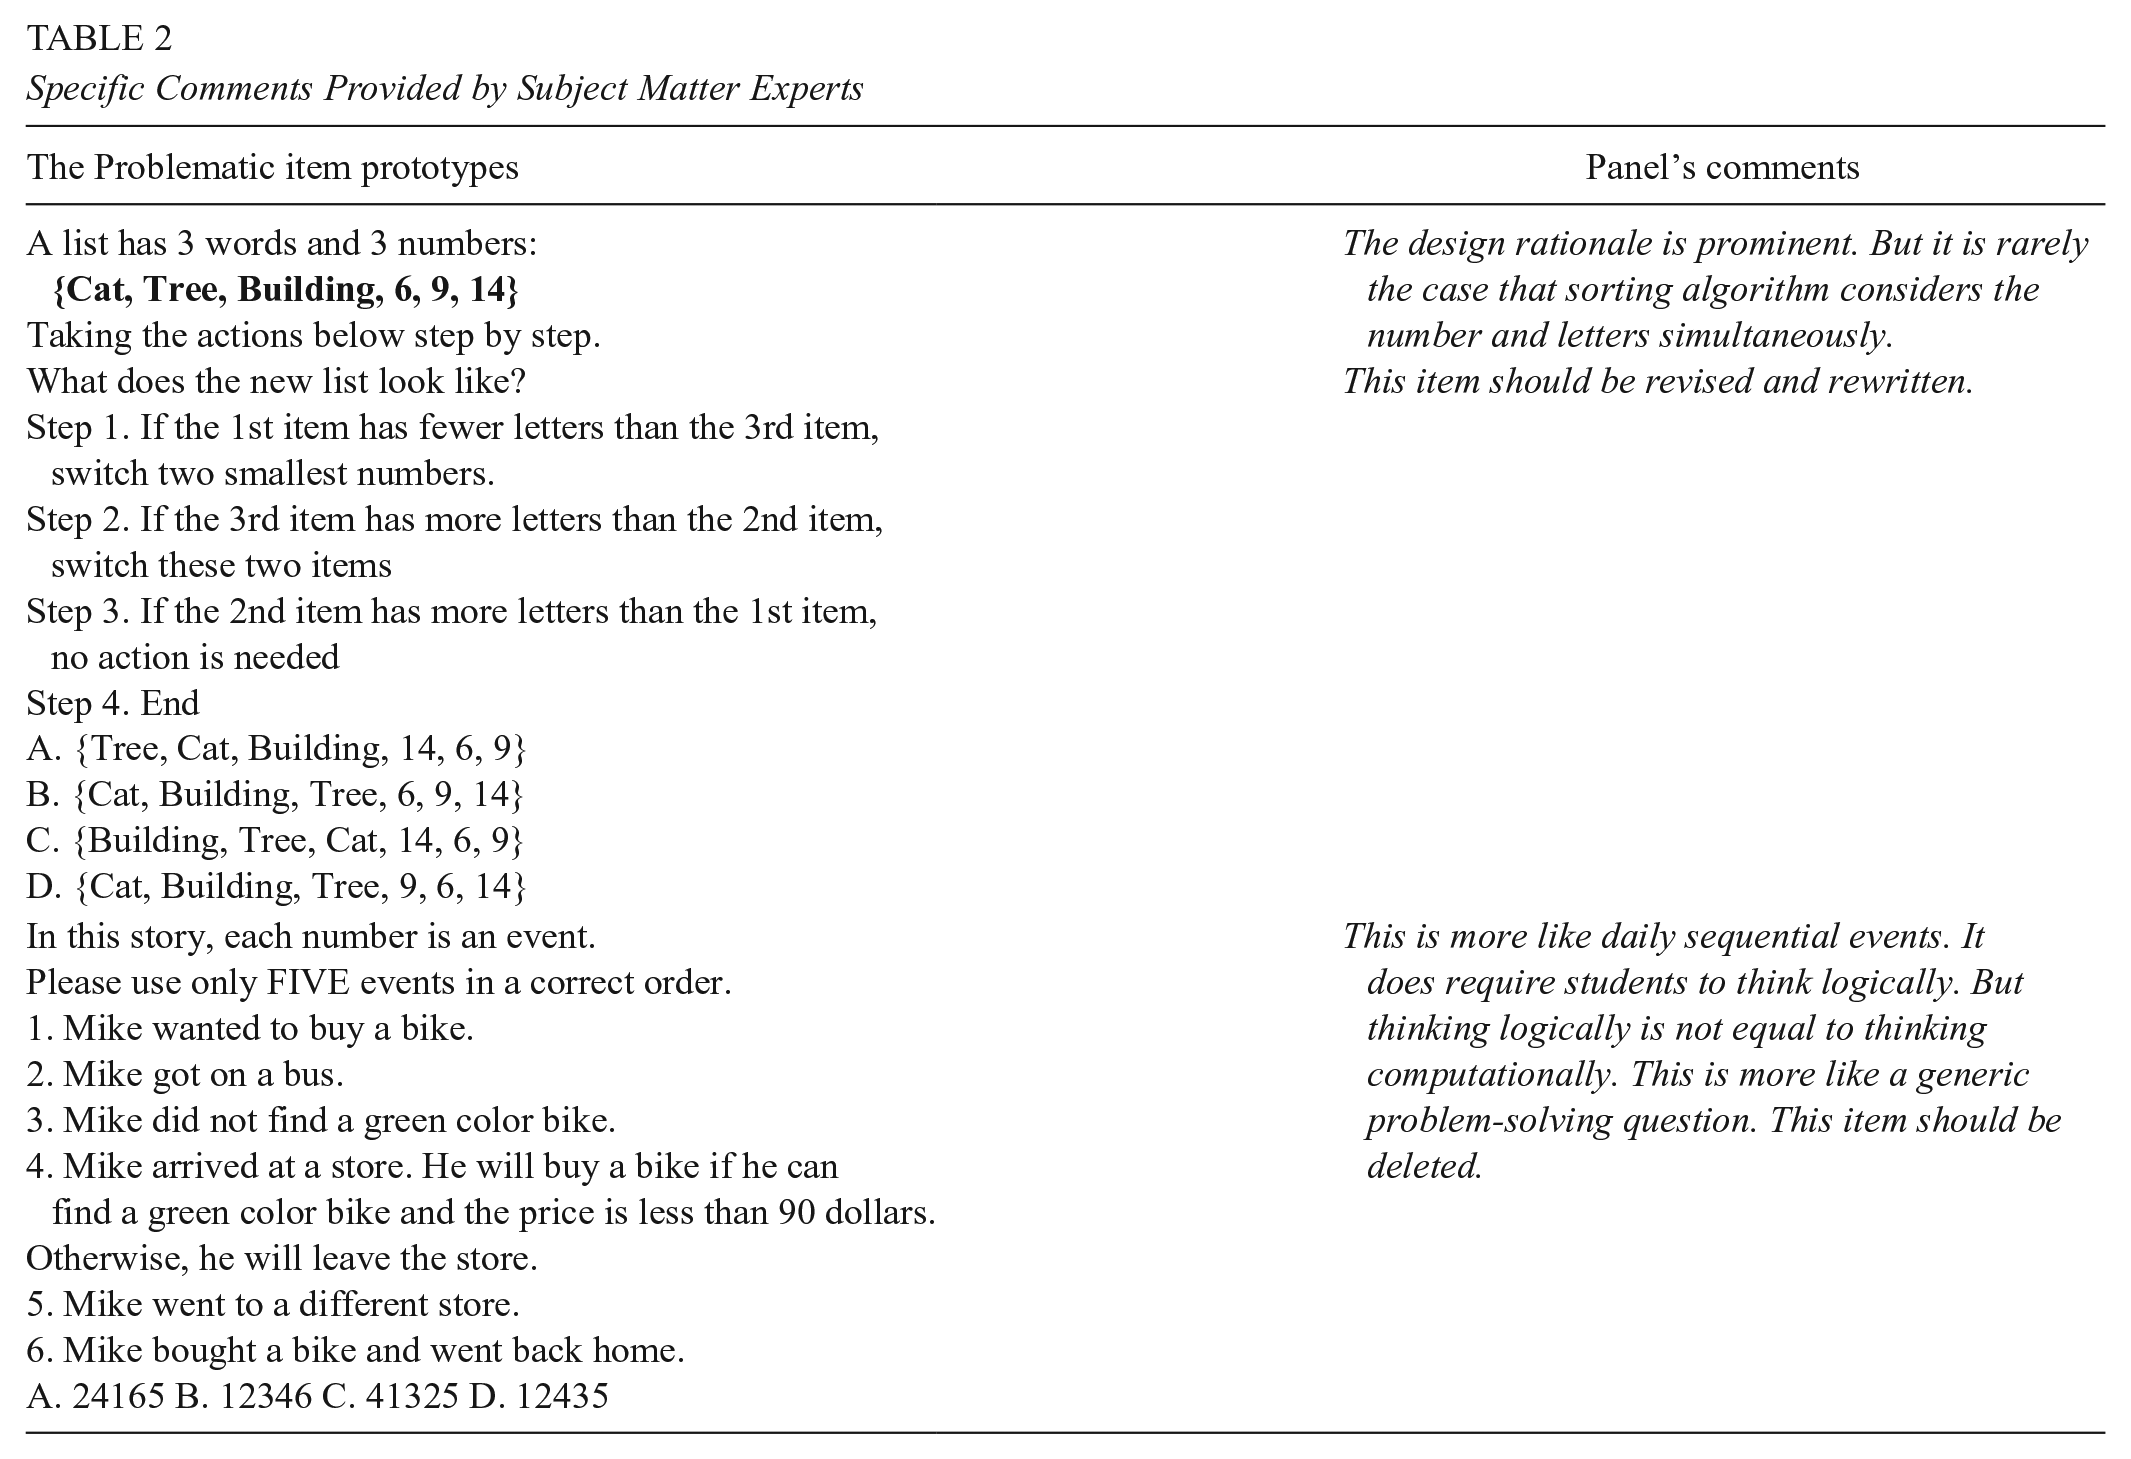
After receiving the input from the SMEs, the item prototypes were revised, and 29 items were assembled for use in the next design activity—that is, the cognitive lab protocol.
Cognitive Lab Protocols
The Standards (AERA, APA, & NCME, 2014) clearly state that validation processes should include evidence of response processes (e.g., verbal data, students’ artifacts). Subsequently, this source of validity evidence allows assessment developers to evaluate the extent to which they can adequately model students’ response processes. Establishing that students were using the expected response processes during assessment might support our proposed interpretation of the CTCA scores to be generated as measuring mastery of specific attributes. In this design activity, the participants were 10 middle school students. Five of them were boys; five were girls. All spoke English, the language of the CTCA, as their first language. The cognitive protocols asked students to “think aloud” as they were responding to each assessment item. Each interview session was about 70 to 90 minutes.
The results based on the verbal data and the artifacts provided by the students during the interviews showed that test-takers’ response processes were as anticipated for most of the item prototypes. Most of the prototypes were able to elicit students’ CT. Figure 2, the artifact produced by a student when they were solving an item, gives one example of student work.

A student’ s artifacts.
However, the interview results also indicated that six item prototypes should be revised, because the item stem contained too much unnecessary information. In addition, three items were flagged for deletion because the empirical evidence did not confirm the hypothesized mental operations. Table 3 shows an example of one deleted item.
A Deleted Item

Item revision was completed based on the results of the cognitive interviews. This design activity yielded a version of the CTCA with 27 multiple-choice items, which were ready to be tried out in a middle school classroom.
Pilot Testing
The first round of data collection with the CTCA, a pilot test, had a sample size of 79 students. A second round of data collection involving more students, and a refined version of the instrument, followed; its results are presented in the next section. The purpose of the pilot testing was to empirically determine: (1) the testing time, and (2) any nonfunctioning options across all items. The assessment was administered to 79 seventh-grade students in a financial literacy classroom at a middle school in the Midwestern United States. The sample contained 44 male and 35 female students. The classroom teacher monitored the pilot testing. According to the SMEs, the hypothesized testing time was 45 minutes for 27 items. According to the classroom teacher’s verbal feedback, the actual time used by students to complete the items was 40 minutes.
In the CTCA, each multiple-choice item contains one correct answer and three distractors (i.e., incorrect options). A “nonfunctioning option” means no students chose that distractor in a given item. By examining the pilot data, all distractors appeared to be functioning well; namely, every distractor on the CTCA was chosen by a certain number of students.
It is common practice to shorten a classroom-based assessment to make it more suitable for practical use. To shorten the instrument, the third round of panel review was conducted. Finally, 15 items were selected because the SMEs judged that these items possessed the strongest alignment to the attributes in CT. In other words, what the items were designed to elicit (shown in the Q-matrix) reflected what SMEs thought they were measuring. Figure 3 is the Q-matrix associated with these 15 items. A cell is marked as 1 if the attribute was measured by that item, and 0 otherwise.
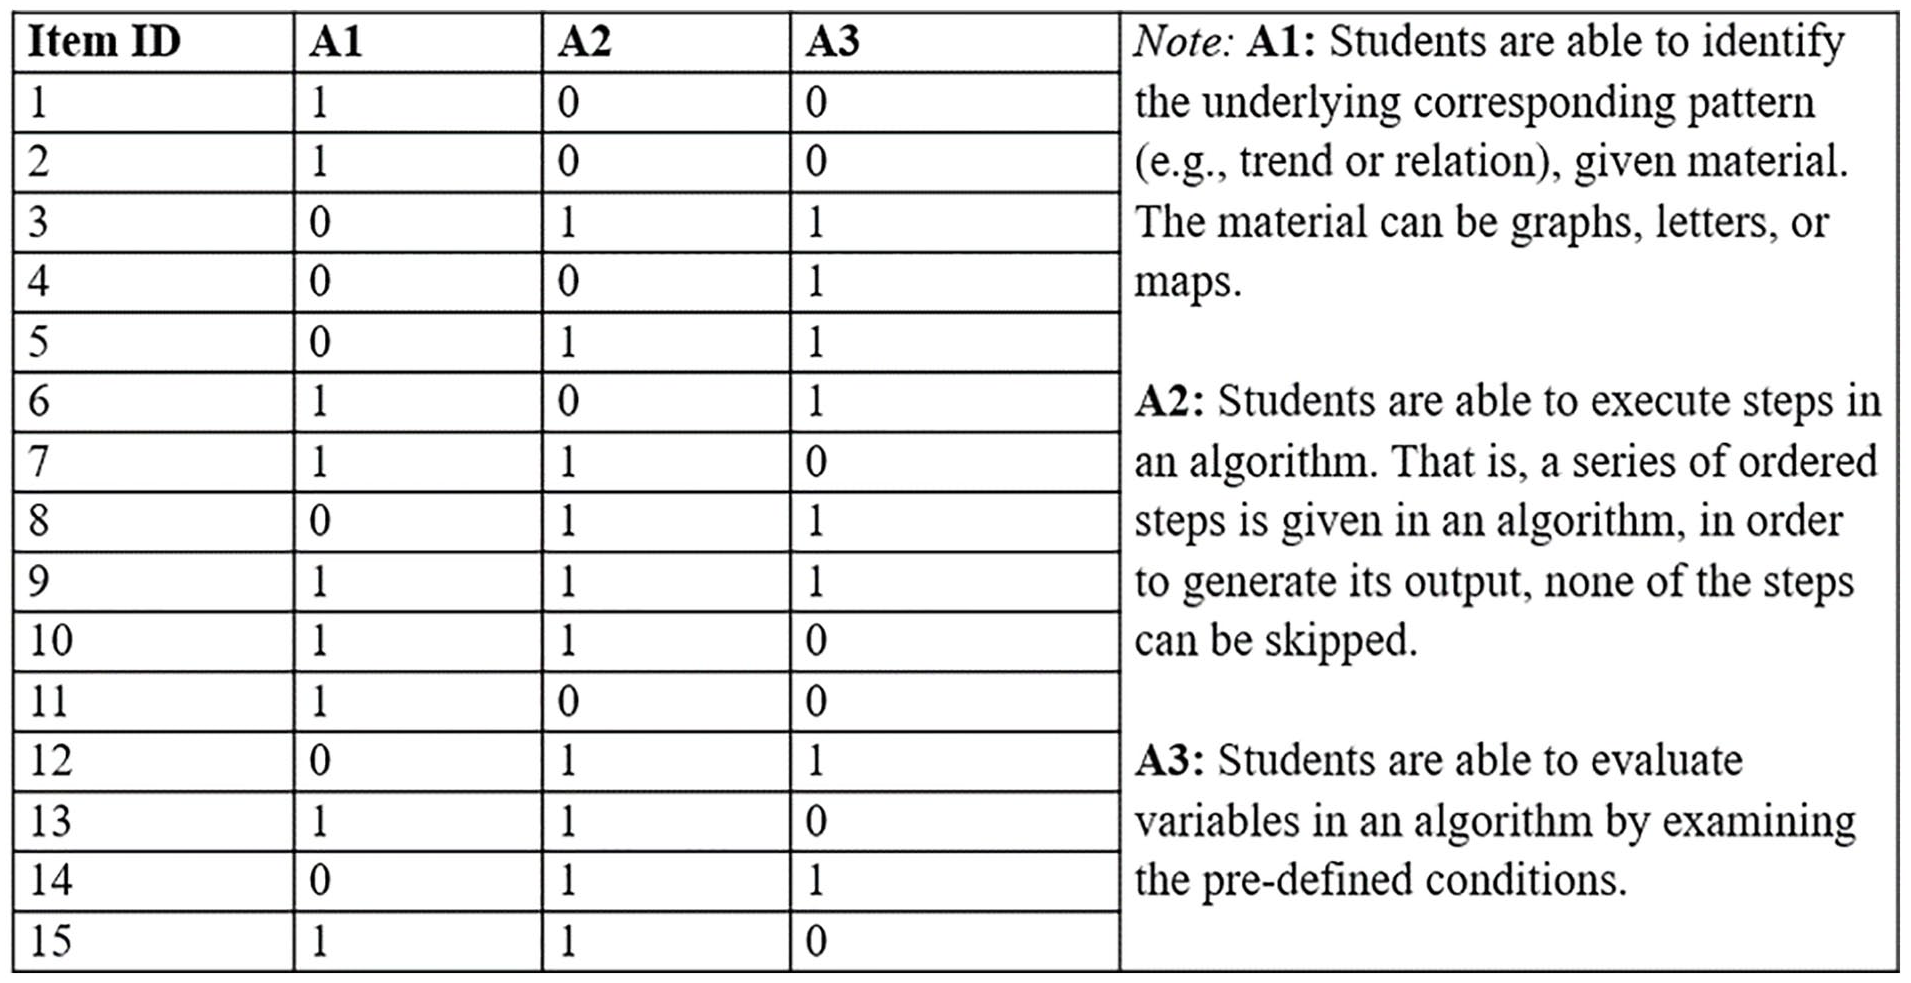
Q-matrix: 3 attributes and 15 items.
Thus, the operational version of the CTCA assessment contained 15 multiple-choice items, delivered to students in a pencil-and-paper fashion. To prevent fatigue from influencing validation of the Q-matrix, six test forms with different item orders were produced. After student response data was collected, DINA models were used for item analysis and to hypothesize a learning progression for students’ process of acquiring aspects of CT.
Results
Sample
A sample of students from two middle schools in two different school districts in the Midwestern United States completed the items. The percentages of students in the two schools who had free or reduced-price lunch plans were 75% and 50%, respectively. The assessment was administered at the beginning of the school year as a pretest in six classrooms: three mathematics, one technology, one English, and one CS classroom. None of the students had received instruction on CS or CT.
Because teachers monitored their students’ test taking as well as collecting students’ answer sheets, the data collection process was constructed to avoid missing data. If a teacher found that an answer sheet contained missing items, the teacher asked the corresponding student to complete the item (or items) and resubmit their work. Furthermore, in this research context, the six participating teachers reached a consensus that if students completed the test within 5 minutes, the students were not making serious effort, and therefore the response data were not meaningful. To avoid including rapid-guessing response data in the item analysis and the scoring model, teachers discarded any answer sheets submitted in less than 5 minutes. In total, 67 answer sheets were discarded for this reason. Furthermore, 19 students had an Individualized Education Program (IEP), so assistant teachers read the test aloud to them. In all, this data collection procedure produced response data from 564 students.
Psychometric Properties
In the CTCA, the response data collected from operational testing came from 564 students, 283 of whom were male and 281 of whom were female. Figure 4 shows how the total scores are distributed, across all students, on a box plot. A total score is simply the observed sum score across 15 items for each student. For each item, a student receives 1 if answering it correctly, otherwise 0.

Distribution of total scores for 564 students.
Six different test forms were administered, as described previously. ANOVA results indicated mean total scores on the six forms were significantly different, F(5, 558) = 8.29, p < .001, suggesting the existence of an item position effect. We then conducted a Tukey post-hoc test, with the results showing that “Form 6” produced a higher group mean than other forms. Boxplots of total scores by form are shown in Figure 5. The mean difference between each pair of test forms and its confidence interval is reported in Figure 6.

Boxplots of total scores by form.

Mean score comparison across different test forms.
Differential Item Functioning Detection Procedure
In this section, the item-level psychometrics properties are reported. In order to examine whether any item showed bias toward either gender group, a differential item functioning (DIF) procedure was used. The DIF procedure involves statistically identifying the content of some items that is not central to the measured attribute and that may be less familiar to a particular group of students. Consequently, students with the same level of ability might receive different scores because of their group membership. Thus, the presence of the DIF on any item may suggest that the item should be revised or deleted before future use of the instrument (Walker, 2011). A variety of methods can be used to conduct DIF procedure (e.g., see details in the review paper by Berríoa et al., 2020; Zenisky et al., 2004).
For our CTCA response data, a package, psychotree, written for the R environment by Zeileis et al. (2012), was used to check the DIF. This package employs a tree-based method with a recursive partitioning approach. Unlike the parametric regression approach to detect DIF, in this method the guide to interpretation suggests that if there is more than one terminal node in the tree, DIF may exist for a particular item. Based on the response data, only one terminal node was found. Thus, no DIF was found for any of the items.
Validation of the Q-matrix
As mentioned previously, the SMEs had examined the items and the Q-matrix. The Q-matrix was thus ready to be empirically validated based on the students’ response data (N = 564). The validation of the Q-matrix can determine to what extent the items and attributes are aligned. De la Torre and Chiu (2016) used a stepwise Wald test to validate the Q-matrix. The algorithm has been implemented in the GDINA package written by Ma and de la Torre (2020b) for R. Thus, we used this algorithm to check the extent to which observed CTCA response data support the Q-matrix (Figure 3) specified by the SMEs.
Based on the empirical results, the items show reasonable alignment with the attributes. For example, in order to solve item 12 successfully, students are required to master the second attribute (A2) and the third attribute (A3), as described in the Q-matrix. The item was expressed as [

A mesa plot for item 12.
However, several items showed problems with alignment to their attributes. The GDINA package also provided the suggested Q-matrix: namely, how these items should be revised in order to better align with the attributes. For example, originally, on the Q-matrix (Figure 3), to solve item 7 successfully, A1 and A2 are required—that is, [

A mesa plot for item 7.
Thus, it is worth examining the content of item 7, and the design principle behind item 7. Figure 9 presents the content of item 7. (The correct answer, per the key, is option A.)

The content of item 7.
The design principle is that the given material is a series of numbers—that is, Step 1 list, Step 2 list, and Step 3 list. Students are required to identify that the comparison is made for every pair of numbers. In addition, students should move 6 from the left to the right, step by step, in order to generate the final output without skipping any step.
Finally, the suggested Q-matrix provided by the GDINA package was not adopted here. As Ma and de la Torre (2020b) have pointed out, the revisions should not be solely based on the empirical results from the estimation; rather, “whether the suggested modifications should be incorporated should be subject to the judgement of domain experts” (p. 16).
Model Parameters
Estimation of DINA model results for the CTCA data was conducted in the CDM package (Robitzsch et al., 2018) for R. To judge model-data fit, we examined the standardized root mean squared residual (SRMSR), an absolute fit index. A suggested criterion for the SRMSR is that if its magnitude is less than .09, it indicates a reasonable model-data fit (Maydeu-Olivares & Joe, 2014). The SRMSR was .037. Thus, for this sample, the model-data fit is reasonably good.
On item level, two parameters are estimated in the DINA model: the guessing (g) and the slipping (s) probabilities for each item. For interpretation purpose, these two parameters are often reflected by the item discrimination index (IDI, denoted as d), that is, the probability of correctly solving an item without the influence of guessing and slipping (i.e., d = 1 − g − s). Table 4 shows these three magnitudes across 15 items. Item 1 has high magnitude on the guessing parameter. Item 10 has high magnitude on the slipping parameter. Therefore, these two items possess very low IDI values. Low IDI values may be used as the indicators of poor quality of the assessment components (e.g., items or Q-matrix). Thus far, there is no recognized criterion value for an acceptable IDI. Norris (2021) developed 27 items to measure students’ understanding in Newton’s laws. Norris reported the mean values of IDIs across these 27 items as .47. In the CTCA, the mean is .33 across 15 items (IDI associated with each item is listed in Table 4).
Item Discrimination Index in the DINA Model

Note. DINA = deterministic inputs, noisy “and” gate.
Other than the model-data fit statistics and item-level statistics reported above, scoring results for the CTCA provided additional psychometric properties. Because subscore reporting is part of the design of the CTCA, psychometric measures about the distinctiveness of the subscores were needed (Wainer et al., 2000). The tetrachoric correlations among latent attributes were positive and moderate to high: the coefficient between A1 and A2 was .71; the coefficient between A2 and A3 was .46; the coefficient between A3 and A1 was .78. These magnitudes indicate that A2 and A3 are clearly distinct. Although possessing A1 is highly correlated with possessing both A2 and A3, the meaning of A1 is substantively distinct from A2 and A3. In the CDM literature, no criterion has been used to judge the magnitude of the tetrachoric correlations to evaluate attribute separation. Bradshaw et al. (2014) reported tetrachoric correlations among the attributes in their newly developed CDM-based instrument. The range of the coefficients was from .62 to .78.
To answer the research question proposed in the beginning of the paper, Figure 10 and Figure 11 are presented. Figure 10 shows the distribution of pattern scores, which represents the distribution of mastery status across students. In the DINA model, the number of latent patterns depends on how many latent attributes the assessment aims to elicit. In the CTCA, a CT model of domain mastery with three attributes was established. Thus, a student can be classified in any one of eight latent pattern groups to indicate his or her mastery status: {000}, {100}, {010}, {001}, {110}, {101}, {011}, or {111}. Using this scoring method, mastery status on a particular attribute is indicated by a 1, and nonmastered status by a 0. For example, the pattern score {100} represents the group of students who mastered A1 but failed to master the rest of the attributes.

Classification on latent pattern scores.

Mastery status on each attribute.
Because the CDM uses a probability model to estimate mastery status, the estimated latent scores are expressed in a 0–1 scale, where magnitudes below 0.5 indicate an attribute has most likely not been mastered. The results can also be expressed as a percentage. For example, according to Figure 10, about 43% of students have mastered all three attributes of CT competency. For the remaining students, about 15% of students will need the highest levels of instructional support in their CT learning because they mastered none of the attributes; about 35% of students mastered only one attribute. Figure 11 shows the attribute-level mastery status across this sample. Among all students, about 51% of students mastered A1, 62% mastered A2, and 64% mastered A3.
For individual score reporting, a set of subscores (i.e., the latent mastery probability estimated by the DINA model) is reported to represent each student’s mastery status along with the total score (i.e., the observed sum scores). Figure 12 is an example of a score report. The first row of the score report is the student ID, which a teacher can link to a student’s name. The second row reports the total score of the student. The third row includes further detail about the wrong and right answers. The last row displays the indicators of mastery status. The results shown in the example suggest that the student has not mastered A1 yet.

Score report card for a student.
Discussion
In the present research, we began the assessment design by establishing a formal cognitive structure of CT. Three extracted attributes were used to characterize CT competency. In this section, we discuss how the results provided in this research relate to the existing literature. The CTCA is distinct from, and has some advantages over, existing CT assessment instruments. The CTCA includes subscores to represent each individual student’s mastery status on the relevant attributes. As shown in Figure 12, the score reporting for each student contains their total score, along with the subscores estimated in the CDM framework. As the literature (e.g., Gotch & Roberts, 2018) has suggested, students with the same total scores may have different areas of weakness. The CTCA is a CDM-based assessment that intends to offer the subscores, and the design of the CTCA aims to support the subscores. The process of subscore reporting thus communicates a student’s weakness and strength in a single score.
Other than individual score reporting, the CDM-based estimation also provides information on this group of students’ attribute mastery proportions and mastery patterns. Compared with the traditional measurement that a single score is used to reflect a student’s ability, the CDM-based results are informative in this research. Particularly, the results suggest that fewer middle school students have mastered pattern recognition (A1) than either of the other CT attributes, which may suggest that pattern recognition tends to be acquired later in students’ learning progression for CT, at least in these school districts.
An assessment-centered classroom for middle school teachers can both measure and promote learning (e.g., Turner, 2014). The proposed score use for the CTCA will enable teachers to gain information about students’ current CT competency before instruction begins. Instead of giving the same problem-solving activities to all the students in a class, a teacher can use the CTCA mastery score profiles to assign different problems (or activities) for different students to practice. Teachers can do this with a deliberate focus. For students who fail to master the first attribute (A1: pattern recognition), teachers can use English language grammar rules as a context for students to practice (see examples provided by Rich & Hodges, 2019). For students who fail to master the second attribute (A2: sequence of instructions), teachers may ask students to complete the selection sort algorithm examples provided by Looi et al. (2018). Teachers may also provide some examples that combine metaphorical language and programming together for students to practice (Pérez-Marín et al., 2018). The conceptual metaphors and the gestures may help students understand computing processes as motion along a path (Manches et al., 2020). For students who fail to master the third attribute (A3: evaluation of variables), teachers can use computer-based exercises (e.g., Scratch) to help students recognize that variables in general do not hold a value (data); rather, variables point to values. Previous research (Hambrusch et al., 2009) suggested that students had difficulty evaluating variables in CT, because they treated variables in CT like variables in mathematics. Whereas in mathematics, variables in an equation are bound to a given value only once and then keep that value, a variable in CT should be treated like a storage box with a name. Its value can be changed over time.
One payoff of this research may be the capacity to inform instruction by equipping teachers with a tool to pre-assess existing CT competency. However, this initial validation of the CTCA assessment has shown some weaknesses in the current test’s psychometric properties. A few issues should be taken into consideration for future revision. As Mislevy (2007) has articulated, validation is an open-ended process. Validity evidence should constantly be collected, even for tests that have existed for many years (e.g., Canivez et al., 2019; Kleiger et al., 2018). Future empirical data should, then, be collected for the CTCA to further validate the meaning of scores and possibly to revise the items (and the Q-matrix).
The first issue relating to psychometric properties is that two of the items possessed unacceptably low IDI magnitudes because of high slipping and guessing parameter values. These items would be expected to contribute little to an accurate classification of a student’s mastery profile. Some other items’ IDI values also seemed relatively low. Generally speaking, low IDI values indicate relatively weak correlations between item responses and students’ status on the latent attributes (Henson et al., 2018). Low IDI values may appear when students’ responses are affected by attributes that have not been modeled (i.e., systematic measurement error) or random measurement error. Adding other well-defined attributes of CT to the model might improve the IDI values, but we expect the numbers of student test-takers and items might need to be increased to estimate the additional parameters.
Another possible explanation for high guessing and slipping parameters may be that the item parameters were modeled as fixed effects. An alternative scoring model, for example the random-effect DINA model (Huang & Wang, 2014), could be considered. This approach argues that slipping and guessing parameters should depend on a person’s (e.g., student’s) characteristics, such that “[T]he level of slipping may depend on the person’s degree of caution, and the probability of a correct guess may be determined by the person’s ability to eliminate distractors among the options included in an item” (p. 75). Applying this model to response data from the CTCA might enhance classification accuracy, because it allows for the possibility of individual variation in item parameters across the sample of students.
The second issue is that in the Q-matrix validation, several items appeared not to align with the attributes as predicted by the SMEs. For example, the SMEs believed responding correctly to item 7 should require a student to possess both attributes A1 and A2, but a mesa plot generated from the empirical data suggested that successfully solving item 7 only requires possession of the first attribute (A1). In the future, these items should be reconsidered by the SMEs.
A third issue is that an item position effect was evident in data from one of the six CTCA forms. In the existing literature, item position effects seem to be common, even for professionally developed large-scale assessments (e.g., Weirich et al., 2017). But little research has examined why item position effects occur (e.g., Debeer & Janssen, 2013). In our forms with different item orders, the first cluster of items in Form 6 may possess some features that motivated the test-takers, who in turn had better test-taking engagement. For example, the visual stimuli contained in certain item stems might have been particularly compelling to test-takers. Another possibility might be cueing, namely, solving certain items first reduced the difficulty of particular subsequent items. Bearing this in mind, future research use of the CTCA should administer a single form.
Conclusion
In this study, we sought to measure CT competency among middle school students by developing a new assessment specification. In order to preserve the proposed scoring interpretation, during the assessment design process, multiple item prototypes were deleted or revised by using subject-matter experts’ opinions. In addition, the outcomes of the students’ think-aloud process for assessment development provided another source of validity evidence. Based on students’ verbal data and artifacts, some items were deleted or revised because the empirical evidence indicated they failed to elicit the hypothesized response process (i.e., the mental operations). Psychometric properties of the item response data were evaluated as additional validity evidence. The results from the CTCA can be a basis for establishing a current learning profile for each student that may be used by teachers, or even students, to plan the next steps of instruction and practice for each student.
In terms of practical utility in classrooms, the CTCA’s potential for subscore reporting helps teachers identify specific computational thinking skills a student has not yet mastered, so that those skills can be targeted by follow-up instruction. In the future, more work is needed to assess the effectiveness of specific curricula that provide students with opportunities to think computationally. Future studies in CT assessment should also endeavor to collect more evidence about relevant cognitive aspects while students solve CT problems. This final goal may, perhaps, be realized by examining the trajectories of CT acquisition across grade bands to better understand how these cognitive processes develop.
Footnotes
Acknowledgements
The authors would like to thank the reviewers for their insightful suggestions.
Ethics Statement
This work was approved by Purdue University Human Research Protection Program-Insititutional Review Boards with approval number-1809021063.
Funding
This work was partially funded by Shanghai Jiao Tong University New Faculty Research Program-AF3500015.
Authors
TINGXUAN LI is an assistant professor in the School of Education at Shanghai Jiao Tong University. Her current research interests include educational measurement, learning, and cognition, as well as test design.
ANNE TRAYNOR is an associate professor in the Department of Educational Studies at Purdue University. Her current research focuses on test content alignment methods, test item instructional sensitivity, and validation methods for scoring rubrics.