
Abstract
For the past two decades, student perception surveys have become standard tools in data collection efforts. At the state level, however, “student voice” is still used sparingly. In this study, we examine the ways in which including student survey results might alter state accountability determinations. Reconstructing the accountability system in Massachusetts, we draw on a unique set of student survey data, which we add to the state’s formula at a maximally feasible dosage in order to determine new school ratings. As we find, student survey data shift school accountability ratings in small but meaningful ways and appear to enhance functional validity. Student survey results introduce information about school quality that is not captured by typical accountability metrics, correlate moderately with test score growth, and are not predicted by student demographic variables.
Driven in large part by No Child Left Behind, present state accountability systems developed in a relatively narrow and largely homogenous fashion, focusing chiefly on student standardized test scores. Accountability formulations have evolved over the past two decades; in addition to test-based proficiency rates, which capture the percentage of students scoring at or above benchmarks, a majority of state systems now include growth scores that incorporate students’ prior achievement as well as other academic metrics such as high school graduation rates. Additionally, when the Elementary and Secondary Education Act was reauthorized in 2015 as the Every Student Succeeds Act (ESSA), the law directed states to incorporate one “non-academic” measure into their systems (Every Student Succeeds Act, 2015). Still, ESSA required that academic measures continue to be given “much greater weight” in accountability determinations. As a result, state accountability formulas remain heavily tilted toward student standardized test scores.
In response to the perceived narrowness of these measures, many have pushed for further revisions to state accountability systems. Such a push has come from multiple constituencies. Scholars have made the case for a broader set of measures (Rothstein et al., 2008; Schneider, 2017), while documenting the unintended consequences of narrowly tailored systems (Booher-Jennings, 2005; Dee et al., 2013; Jennings & Bearak, 2014). Journalists have detailed the gaming and abuse of these systems (Aviv, 2014; Layton, 2013; Leung, 2004). Parents have articulated a desire for more comprehensive information (Richardson & Bushaw, 2015). And educators have made the case that evidence-based decision making within schools is limited by the available data (Vanlommel & Schildkamp, 2019).
Many districts have demonstrated an interest in the use of perception surveys as means of supplementing existing measurement and accountability systems, but only a handful of states capitalized on the opportunity created by ESSA to include surveys in their accountability formulas (Education Commission of the States, 2018). And even when included, surveys often account for a small fraction of the overall accountability calculation. Nevertheless, their inclusion raises important questions about the potential of perception surveys to influence state accountability systems.
This article seeks to accomplish two aims. The first, and simpler of the two, is to examine student perception surveys as a source of data. To what extent do school-level survey results offer a new perspective on schools? To what extent are such data merely reflecting student demography?
The second and more challenging aim is to assess the impact of student perception surveys on state accountability systems. How and to what extent might the inclusion of these surveys alter school-level accountability determinations? We ask this question knowing that high-stakes use may distort survey results (Koretz, 2008), and that the survey in question—designed for maximal face validity—was implemented in a “no stakes” setting. Consequently, this exercise must be treated as a provisional first step toward better understanding how more substantial weighting of survey-based measures would change state accountability calculations, as well as how the validity of such shifts might be evaluated.
In pursuit of these aims, we recreated the accountability formula used by the Massachusetts Department of Elementary and Secondary Education—a formula that includes student standardized test scores, a student growth percentile score, and chronic absenteeism. Leveraging an ongoing research project in a subset of Massachusetts districts, we then compiled an additional set of data—specifically, data generated by student perception surveys, which were designed to measure a broad range of school quality constructs (for more about the subset of districts, see Appendix A; for a complete list of survey constructs, see Appendix B). We then included the new survey data in the accountability formula.
The survey dosage we use throughout the article is 25%. We chose this figure not because we believe it is the “right” amount, but rather because we believe it to be the maximally feasible dose based on current accountability formulas in use across the United States—a determination we discuss in more detail below. In addition, we conduct a formal bounding exercise in which we increase the survey dosage by increments of 5%, seeking to determine how accountability results might shift at varying levels of inclusion between 5% and 50%.
Before presenting our results, we first review the extant literature on test-based accountability systems, as well as the literature on the use of student surveys for accountability purposes. We then discuss our methodology and associated findings, most notably our finding that the inclusion of survey measures in accountability formulations tends to improve the ratings of a particular subset of schools—those serving higher proportions of Black/Latinx students, economically disadvantaged students, and English language learners (ELLs).
Literature Review
Constraints of Current Accountability Systems
Public polling across the 20th century suggests that Americans have long viewed school quality in a broad manner that goes well beyond academic learning, and certainly beyond student standardized test scores (Schneider, 2017). This continues in the 21st century. Rothstein and Jacobsen (2006), for example, surveyed a nationally representative sample of adults, asking them to rank a range of goals that schools can pursue—academic skills, critical thinking, social skills, citizenship, physical health, and more. As they concluded, an accountability system relying exclusively on standardized tests was “a betrayal of our historic commitments” (p. 271) vis-a-vis the broader aims of education.
As research suggests, the multiple dimensions of school quality valued by Americans are mostly distinct from each other. Despite some strong correlations between particular constructs, it appears that many aspects of school quality are orthogonal, which is to say that they are not necessarily related to one another. Take, for example, research on a single element of school quality: teacher effectiveness. As shown empirically, teachers have differential effects on a wide range of student outcomes, including attendance, course grades, and high school completion (Jackson, 2018). Moreover, teacher effects on student test scores are weakly correlated with teacher effects on other outcomes (Grissom et al., 2015; Petek & Pope, 2018). Such work suggests that teachers may be effective in some ways without being equally effective in others. It stands to reason, then, that schools are similar in their function—that a school scoring highly in one domain of school quality may score differently in others. Recent research has borne this out (Bernal et al., 2016; Gagnon & Schneider, 2019).
Narrowly designed accountability systems also produce unintended consequences. As Koretz (2008) notes, achievement test results are “incomplete measures, proxies for the more comprehensive measures that we would ideally use but that are generally unavailable to us” (p. 9). If this is true, efforts to improve performance on those proxy measures could produce a change in the proxy measure without improving the unobserved measures the proxy represents. According to Campbell (1979), “when test scores become the goal of the teaching process, they both lose their value as indicators of educational status and distort the educational process in undesirable ways” (pp. 51–52). Gamesmanship, in other words, poses a distinct threat to measurement systems and a greater threat when those systems are narrowly tailored (Hamilton et al., 2002; Lowe & Wilson, 2017).
One specific unintended consequence of the current accountability system is a narrowing of the curriculum, both with regard to untested academic subjects like social studies (Dee et al., 2013; Shealey, 2006), as well as with regard to nonacademic curricular aims like student social-emotional and physical health (e.g., Downey et al., 2008; Mintrop & Sunderman, 2009). Relatedly, schools have gamed accountability systems through their treatment of students. Some schools, for instance, have encouraged lower performing students not to take exams or pushed students into special education designations to limit the impact of their scores on school accountability (Jacob, 2005). Others have engaged in the practice of “educational triage,” focusing on students closest to proficiency at the expense of others (Jennings & Sohn, 2014, p. 125). In short, present accountability systems not only fail to capture the many dimensions of school quality valued by the American public, but also encourage a set of rational, yet troubling, responses from schools.
A final point of concern with regard to present state accountability systems is the predictable relationship between standardized achievement scores and student background variables. Despite the intention of accountability systems to improve student outcomes and shrink so-called achievement gaps, research has demonstrated strong correlations between standardized test scores and student demographic characteristics (Davis-Kean, 2005; Hegedus, 2018; Reardon, 2011). Similarly, strong correlations exist between school rankings and the socioeconomic background of the students who attend them. Although there are exceptions to this pattern, both at the student level and the school level, the broader trend is well established. Consequently, scholars have raised questions about the degree to which existing accountability systems reflect student demography more than they do school quality (e.g., Koretz, 2008; Schneider, 2017).
Surveys as a New Data Source
Student perception surveys, which systematically aggregate student experience in school, have been used with increasing frequency as a valuable source of information for organizational improvement. For example, the Tripod student survey (Ferguson, 2012) has been shown to reliably capture aspects of school climate like student sense of safety and student engagement (Phillips & Rowley, 2016; Phillips et al., 2018). In addition, the Tripod student survey has been correlated with various measures of teacher effectiveness (Bradshaw, 2017; Wallace et al., 2016). As researchers have found, well-designed surveys can illuminate aspects of student experience not presently captured by more traditional measures used by the state (Hough et al., 2017; Krachman et al., 2016; Phillips et al., 2018). When researchers successfully navigate hurdles unique to surveying adolescents in a school setting, while still adhering to standards for validity and reliability (Gehlbach, 2015; Gehlbach & Hough, 2018), surveys serve as a useful tool in school improvement.
In addition to their use in school improvement efforts, student surveys have also shown promise as measures of school quality. Since 1994, the partnership between the Chicago Public Schools and the Consortium on Chicago School Research (CCSR), based at the University of Chicago, has seen researchers working with district and community leaders to develop an empirically based framework for tracking the performance of the city’s schools—an effort that draws on annual school-level data from a number of sources, including student perception surveys (Sebring et al., 2006). Beginning in 2018, and consistent with the ESSA requirement to include at least one nonacademic measure, the state of Illinois required all districts to administer CCSR’s 5Essentials surveys on an annual basis. More recently, beginning in 2010, the California Office to Reform Education (CORE) launched an alternative accountability effort among six districts collectively serving approximately one million students (Knudson & Garibaldi, 2015). Like CCSR, CORE collects annual school-level data from a number of sources, including student surveys. In 2013, the CORE districts applied for and received a waiver from federal accountability mandates, enabling them to develop and pilot a multiple measures system of accountability. Research has found CORE surveys to be promising tools for collecting additional information about school quality (West, 2016).
Despite the flexibility introduced by ESSA, federal regulations play a significant role in limiting the potential impact of survey measures on school quality determinations. Specifically, ESSA regulations require that “academic measures,” like proficiency rates and growth scores, be given substantially more weight than “non-academic” measures (Every Student Succeeds Act, 2015). As a result, the influence of data collected through student surveys, relative to other academic measures like standardized test scores, has thus far been negligible in terms of accountability determinations (Hough et al., 2016).
As Table 1 indicates, 10 states leveraged ESSA to include school climate surveys in their state accountability formulas. In each of these states, survey data account for 5% to 10% of their overall accountability determinations. The one exception to this is North Dakota, where surveys account for 30% for elementary schools and 20% for high schools. As revealed by an examination of state websites, school climate surveys vary in length from 20 questions in Idaho, North Dakota, and South Carolina (see Idaho Board of Education, 2018; North Dakota Department of Public Instruction, 2020; and South Carolina Education Oversight Committee, 2019) to 80 questions in Illinois (Illinois State Board of Education, 2020). Most states employ surveys with approximately 35 questions. The climate survey used in this study consists of 66 questions and is therefore likely at the more robust end of the scale with regard to the breadth of the constructs it is designed to assess.
States Using School Climate Surveys for Accountability Purposes, by Percentage of Accountability Formula, K–8 and High School

Note. Adapted from Kaput (2018).
Methodology
Data
This study draws on data collected from a subset of Massachusetts public school districts committed to the development and piloting of broader school quality measures—work that includes the administration of student perception surveys. During the 2016–2017 school year, six districts administered online surveys to students in Grades 4 to 12. These surveys addressed various dimensions of school quality not presently measured by the state but identified as relevant by community, school, and district stakeholders. The final “school quality framework,” with which the survey was aligned, consists of five broad categories: teachers and leadership, school culture, resources, academic learning, and community and well-being (for more detail on individual measures, see Appendix C).
From a psychometric perspective, analyses of the reliability of student survey scales revealed high levels of internal coherence. Factor loading was performed for each scale, with internal consistency measured using Cronbach’s alpha; the majority of scales exceeded .7 (for full results see Appendix C). Across schools, we examined the variation in the average score for each scale and found standard deviations (SDs) ranging between 0.09 and 0.46 on a 5-point Likert-type scale. Such modest or moderate variation was expected, given our assumption that schools were not monolithic across dimensions of school quality.
The surveys were also examined as tools for school improvement and public engagement. As discussed by scholars like Cronbach (1988) and Kane and Wools (2020), the validity of an instrument must account not only for the precision of its measurement but also for its functional utility. The measurement perspective ensures that assessments accurately measure what they purport to measure. The functional perspective complements the measurement perspective by considering the uses to which assessments are being put, and whether they are serving their purpose as intended. Examining an accountability system—and the data components that constitute it—demands that we consider both the measurement and functional perspectives. In keeping with these dual perspectives, the surveys for this project were vetted by multiple stakeholder groups across all participating districts. Moreover, they were put through a post-hoc analysis with school administrators, who reviewed school-level survey results with attention to measurement validity, and who once more reviewed the scales with attention to their functional validity.
Analytic Sample Construction
Only data from non-high schools were analyzed for this study. That decision stems from the small number of high schools with available data (n = 27). Additionally, only six of the 27 high schools were from outside the largest urban district in the sample. The larger sample of schools serving students in kindergarten through eighth grade (K–8), by contrast, was less subject to the problems associated with small sample size, such as detecting relationships that are driven by relatively few, atypical schools. This sample of schools serving K–8 students is also highly representative of the diversity of participating districts, offering greater generalizability than the high school sample. The larger sample size of non-high schools also permitted a more nuanced examination of relationships. For instance, we wished to see how school ratings covaried with school demographics; these bivariate relationships are very difficult to examine with few cases.
The initial sample included student survey data from 108 elementary and middle schools (Grades 8 and below). Of these, six were dropped due to having fewer than 20 student respondents. Two additional schools were dropped due to not having available accountability data. Student survey data in the remaining schools were aggregated to the school level and then merged with school-level accountability data, resulting in a final total sample of 100 schools that enrolled students in grades 8 and below.
As illustrated below in Table 2, the final analytic sample has considerable demographic variability across all measures. For each of the subgroups—economic disadvantage, Black/Latinx, special education, and ELLs—we organized the sample into four quartiles, ranging from the quartile of schools with the lowest proportion of a given subgroup (on the left) to the highest (on the right). On average, the 25 most affluent schools in the 100-school sample serve 24.9% economically disadvantaged students, compared with 71.5% for the poorest 25 schools in the sample. Even more strikingly, the average composition of Black and Latinx students varies from 19.4% in the first quartile to 92.0% in the fourth quartile, with the average school enrolling 60.9% Black and Latinx students.
Average School Demographic Characteristics of the Sample, by Quartile and Relative to the State (2016–2017)

Note. ELL = English language learners. Adapted from Massachusetts Department of Elementary and Secondary Education (n.d.).
Compared with public schools in the state, we see that schools in the sample, on average, enroll substantially higher rates of economically disadvantaged, Black/Latinx, and ELL students. The proportion of special education students in our sample is comparable to the average across the state’s public schools.
Measure Construction
All state accountability measures were constructed as subsample percentiles. For instance, a percentile score of 50 for “student growth” for a school can be interpreted as that school being the median school in student growth for our sample of 100 schools. Consequently, all measures are relative to the sample and not to the more general distribution of schools in the state.
To create a survey measure for each school, a principal component analysis (PCA) was conducted on each school-mean Likert-type scale at each level of the survey framework, and PCA weights were applied and summed to generate the overall survey measure. For example, we conducted PCA on all school-level averaged survey items assigned to Measure 2A.i (student physical safety). All survey items loaded on to a single component and the weights of each item were then applied to each row to create a score for Measure 2A.i; this PCA-generated score for 2A-i was then averaged with the PCA-generated score created for Measure 2A.ii (student emotional safety) to form Measure 2A (safety); Measures 2A, 2B (relationships), and 2C (academic orientation) were then averaged to form Measure 2 (School Culture). Finally, Measures 1, 2, 3, 4, and 5 were averaged to create a total survey score for that school.
This approach treats all constructs, but not all individual survey questions, as being of equal value. This was done because all survey questions were designed to align with school quality constructs, and because scales varied in length; merely combining all questions would have given outsized weight to scales with a larger number of questions, skewing the relative importance of various constructs in the process.
The total survey score, for which the range was −2.5 to +2.5, produced an average of 0.1 and SD of 1.1. These total survey scores were then converted to a percentile. The average percentile score was 0.5 with an SD of 0.2.
In addition to the survey percentile, we examined percentile variables for each component of the Massachusetts accountability framework. We gathered these publicly available data for the 2016–2017 school year—the year that the student perception surveys examined in this study were administered. For each of the relevant measures—test score achievement, test score growth, and chronic absenteeism—we created a sample-normed percentile score. Although z scores would do more to preserve information, the use of percentiles is in keeping with how Massachusetts presents its accountability results, presumably because of they are easier to interpret.
Finally, the overall accountability score for each school was derived using the most recent accountability formula (current as of fall 2020) from the Massachusetts Department of Elementary and Secondary Education. For non–high schools, this accountability formula weights absolute achievement at 67.5%, growth in achievement at 22.5%, and chronic absenteeism at 10%. When including student surveys in our hypothetical accountability systems, we assigned them a weight of 25%—what we consider to be the maximally feasible dosage, based on inclusion rates in other states. Additionally, we conduct a formal bounding exercise to better understand how accountability results might shift when included at levels between 5% and 50%. In adding survey data to the accountability formula, we reduced the combined weight of the other accountability components accordingly. For example, when using the weight of 25% for student surveys, we reduced the combined weight of the other accountability components from 100% to 75%, while maintaining their relative proportions. Thus, when student surveys were weighted at 25%, absolute achievement was reduced to 50.625%, growth in achievement 16.875%, and chronic absenteeism 7.5%.
Analytic Approach
To understand whether and to what extent the inclusion of survey measures would shift state accountability calculations, we reconstructed the Massachusetts accountability formula and added the new variable of student surveys. Observing that this reconstructed formula produced substantive and meaningful shifts in school accountability scores, we then explored the extent to which these shifts were correlated with school demographic composition. We further examined which schools, in terms of their demographic composition, tended to move “up” or “down” in accountability calculations.
Results
Student perception surveys, designed to measure aspects of school quality not presently captured by state accountability systems, appear to succeed at the task. As we find, there are weak relationships between school-level survey results and two accountability measures—test score proficiency and chronic absenteeism—and moderate correlations with test score growth. Additionally, the survey results are only weakly correlated with student demography, indicating that they may be capturing information about schools rather than about student background. Finally, and as a consequence of this second result, we find that accountability scores for schools serving low-income and historically marginalized students tend to increase when school-level survey results are included. We review each of these findings in more detail below.
Student Surveys and Existing Information
We find a moderately positive correlation between the survey percentile and the overall accountability percentile (r = .37). Digging into the components of the state accountability formula, however, we find more variation: a small positive correlation between survey percentile and achievement percentile, a moderately positive correlation between survey percentile and growth percentile, and a near zero correlation between survey percentile and chronic absenteeism (see Table 3). These small to moderate correlations with existing accountability measures suggest that survey measures are contributing new information to the overall picture of schools and school quality (for more detail, see Appendix D).
Correlations Between School Survey Score and Existing School Accountability Measures
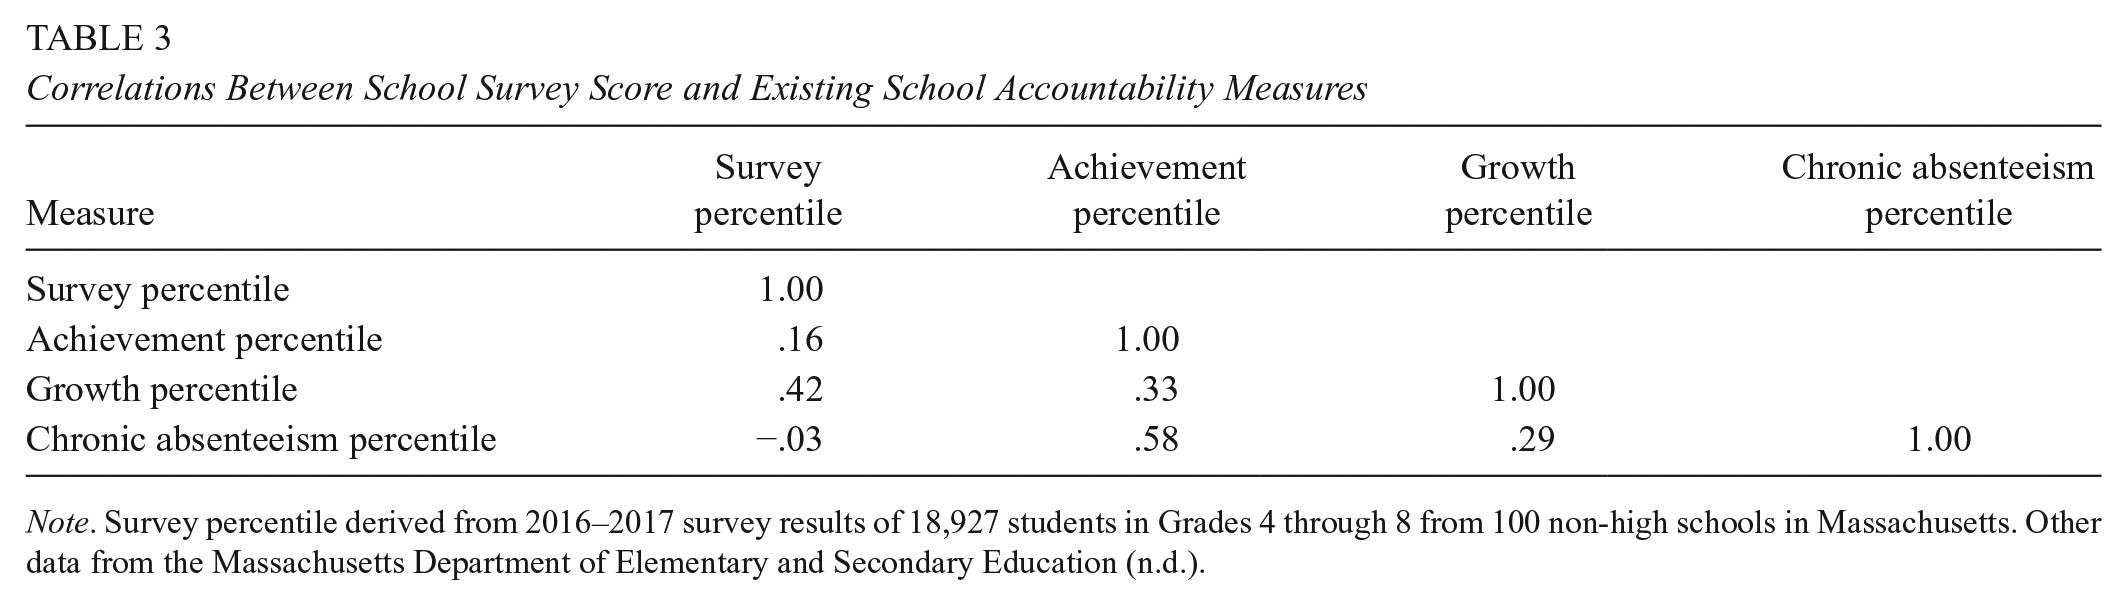
Note. Survey percentile derived from 2016–2017 survey results of 18,927 students in Grades 4 through 8 from 100 non-high schools in Massachusetts. Other data from the Massachusetts Department of Elementary and Secondary Education (n.d.).
When survey measures were added into the accountability formula at a 25% dosage, schools’ accountability percentiles shifted an average of 5.1 points—a small but nontrivial shift, which renders visible the new information represented by the surveys. Experimenting with other doses—both larger and smaller—we find that the relationship between survey results and the other components of the accountability formula is fairly linear. Examining doses from 5% to 50% (in increments of 5%), we find that with each increase of 5%, average school accountability percentiles shift approximately 1 point. For example, at a dosage of 5%, accountability percentiles shift an average of 1.0 points, with an SD of 1.0; at 10%, they shift an average of 1.9 points (SD = 1.5); at 15%, 3.0 points; at 20%, 4.0 points; and so on, up to 11.2 points at 50%. We discuss this in greater detail later in our Results section.
Student Surveys and Student Demography
Given the durable relationship between traditional accountability measures and student demographics, we explored whether and to what extent student survey measures mirrored test scores’ association with student demographic variables. As we find, and as illustrated in Table 4, the correlation between historically marginalized student subgroups and survey percentile scores is positive but weak (r = .14). The correlation between the school-wide share of ELLs and the survey percentile is positive and only slightly stronger (r = .17). The composition of special education students has almost no relationship to the survey results. These patterns differ considerably for the measures presently included in accountability formulas: the percentage of students from historically marginalized subgroups generally correlates weakly and negatively with the growth percentile, while exhibiting moderate negative correlations with achievement and chronic absenteeism percentiles. Table 4 presents the correlation coefficients between school-level student subgroup composition and two sets of outcomes: survey measures and existing accountability measures.
Correlations Between Student Subgroup Composition and Student Survey, Existing Accountability Measures

Note. Survey percentile derived from 2016–2017 survey results of 18,927 students in Grades 4 through 8 from 100 non-high schools in Massachusetts. Other data from Massachusetts Department of Elementary and Secondary Education (n.d.).
Having observed a positive shift in accountability percentile when student survey measures were included, and noting that student survey measures were associated with schools’ demographic composition, we set out to examine whether the extent to which schools’ shifts in accountability percentile depended on the demographic composition of their students.
As observed in Table 5, and echoing the findings in Table 4, we observe that the most affluent quartile of schools in our sample had an average survey percentile rank of 48.2. By contrast, the average survey percentile for the poorest quartile was 57.1. Simply put, the poorest schools tended to have more favorable survey results than the most affluent schools in the sample. A similar trend emerged for Black/Latinx and ELL concentrations: Schools with greater concentrations of these demographic subgroups had higher than average student survey results. This trend does not hold for special education populations; schools serving proportionally fewer students from this subgroup generally had higher than average survey results.
School-Level Survey Percentile, by Student Subgroup Quartiles
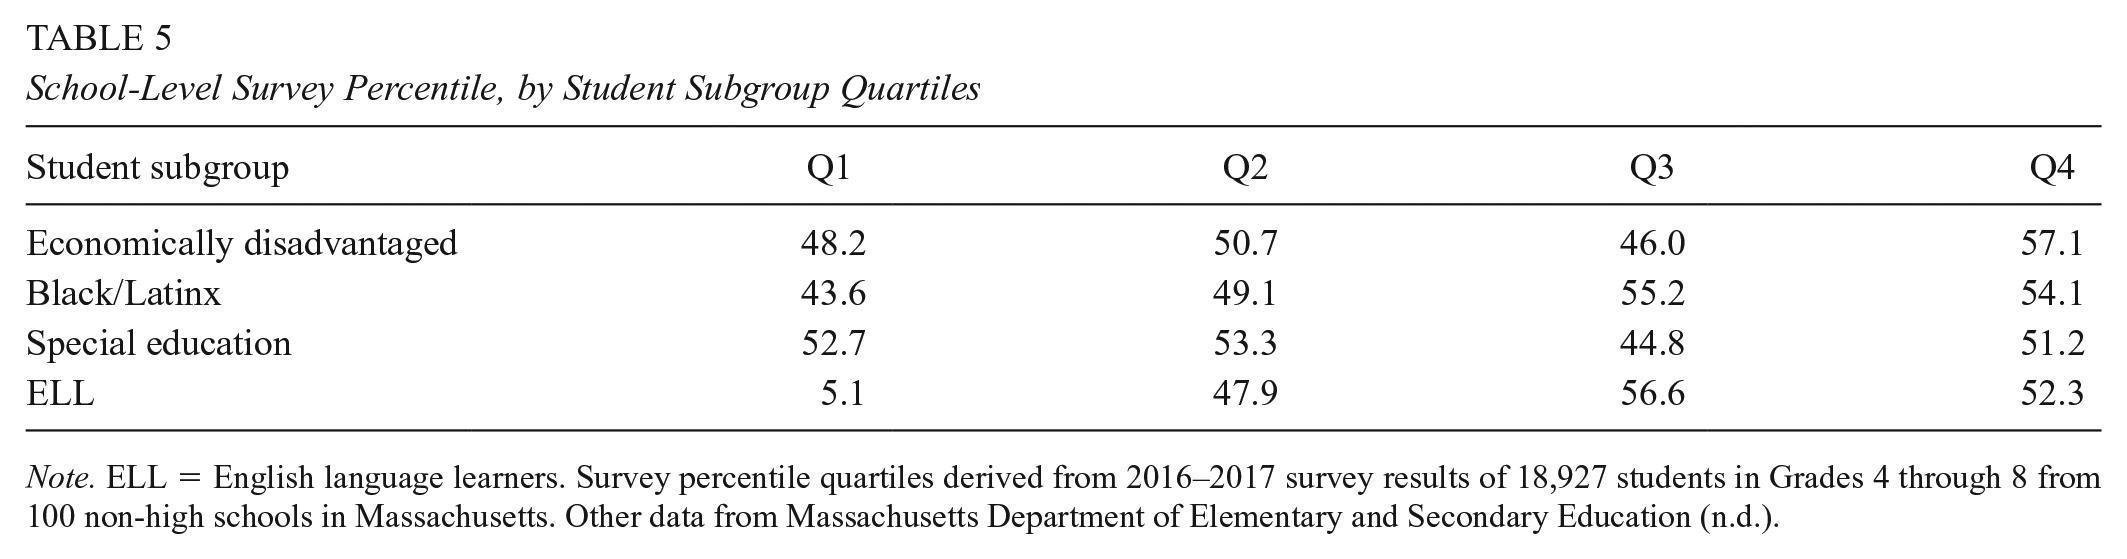
Note. ELL = English language learners. Survey percentile quartiles derived from 2016–2017 survey results of 18,927 students in Grades 4 through 8 from 100 non-high schools in Massachusetts. Other data from Massachusetts Department of Elementary and Secondary Education (n.d.).
It is important to note that, while Table 5 suggests a relationship between student subgroups and survey scores, the correlations are rather weak. However, as noted above, even these weak positive relationships are notably different from relationships between measures typically observed in state accountability systems relying heavily on standardized test scores.
While our primary concern was investigating the relationship between student demography and survey results, prior research has demonstrated the importance of examining teacher demography as well. Specifically, scholars have found that the “match” between teacher race and student race appears to have a mediating effect on student academic perceptions and behaviors (Blazar & Kraft, 2017; Egalite & Kisida, 2018). To investigate this within our data, we examined the 69 non-high schools with a majority of Black/Latinx students. In this subsample of schools, we find that the correlation between the proportion of Black/Latinx teachers and the overall survey percentile is 0.12. Additionally, we find that the correlation between the racial/ethnic “mismatch”—the proportion of Black/Latinx students minus the proportion of Black/Latinx teachers—and the overall survey percentile is −0.17. In short, survey results in schools with majority Black/Latinx populations tend to be higher for schools with more Black/Latinx teachers and less of a racial/ethnic mismatch, though these relationships are rather weak.
Student Surveys and Accountability Determinations
To better understand how survey data might function within existing accountability systems, we looked at how including survey results would affect ratings of schools. Table 6 presents a transition matrix that shows the number of schools that would move up, move down, or remain in the same accountability score band if student surveys were included at a dosage of 25%. As we find, just more than 50% of schools (n = 55) would remain within the same score band, about one quarter of schools would move down (n = 23), and one quarter would move up (n = 21).
Transition Matrix of Number of Schools that Move Up, Move Down, or Remain the Same in Accountability Score Band When Survey Dosage Is 25% of Overall Formula

Note. Survey percentile quartiles derived from 2016–2017 survey results of 18,927 students in Grades 4 through 8 from 100 non–high schools in Massachusetts. Other data from Massachusetts Department of Elementary and Secondary Education (n.d.).
We then conducted a formal bounding exercise (e.g., Gershenson, 2016) to better understand the extent to which schools’ accountability scores would shift with the inclusion of survey measure dosages, increasing the dosage by increments of 5%. As Table 7 shows, with each additional 5% dosage, approximately one school moves out of each of the percentile bands.
Changes in Number of Schools That Remain in Highest, Median, and Lowest Percentile Bands of Accountability Scores by Increasing Survey Dosage in Overall Survey by Increments of 5%

Table 8 illustrates that there is a clear relationship between the degree to which a school would benefit from the inclusion of a survey measure (25% dose) in the accountability formula and the percentage of economically disadvantaged, Black/Latinx, and ELL students it enrolls. For instance, the 24 schools that would move up by 5 or more percentile points enroll economically disadvantaged and Black/Latinx students at rates nearly 50% higher than the 26 schools that would move down 5 or more percentile points; differences related to the percentage of ELL students enrolled are even more pronounced. The rate of special education student enrollment exhibits no clear relationship to these shifts.
Average Subgroup Composition of Schools That Rise or Fall in Accountability Ratings When Survey Dosage is 25% of Overall Formula

Note. Survey weight derived from 2016–2017 survey results of 18,927 students in Grades 4 through 8 from 100 non-high schools in Massachusetts. Other data from Massachusetts Department of Elementary and Secondary Education (n.d.).
In sum, we find that the inclusion of student survey data into our reconstructed accountability system tended to improve the school quality scores of schools that serve historically marginalized subgroups. This is not surprising given that these subgroups, on average, tended to have higher survey percentiles. In our discussion, we consider the implications of these findings for policy.
Discussion
Traditional school accountability measures have been criticized on the grounds of two overarching shortcomings: narrowness and inequity. Even if state-issued standardized tests were to accurately capture academic performance, they still target only some of what the public wants from schools (Rothstein & Jacobsen, 2006; Schneider, 2017); moreover, the overreliance on a small number of measures would incentivize gamesmanship (Lowe & Wilson, 2017). And, though the introduction of growth scores has reduced the strength of the relationship between accountability determinations and student demography (Hegedus, 2018), the continued use of proficiency scores in such systems has sustained that correlation. We hypothesized—and our results seem to show—that student survey measures could address these shortcomings.
Are Existing Systems Too Narrow?
One aim of this project was to supplement existing measures with information desired by stakeholders; in other words, the surveys were explicitly designed to contribute new information to public understanding of school quality. Strong correlations between the survey measures and existing measures would have suggested that they were duplicating information. However, the weak to moderate correlations between variables appears to indicate that survey-based measures are doing what they were intended to do.
The fact that survey data reveal new information also suggests that schools are not uniformly good or bad. If school quality were consistent across dimensions, it would pose little trouble for accountability formulas that they are narrowly tailored; a single tile would reveal the entire mosaic. But as we find, knowing a school’s standardized test scores, for instance, or its chronic absenteeism rate, does not render student surveys unnecessary from an information standpoint. Whatever the merits of student survey data, it seems unlikely that all other possible measures of school quality would be different. That is, if student survey data diverge in important ways from the measures presently included in the state accountability system, other kinds of measures may be similar in that regard.
Given this, we might raise questions about the summative nature of existing accountability systems. If measures of school quality differ across dimensions, or across measurement instruments, then introducing additional data into state accountability formulas seems to be necessary but not sufficient from an information standpoint. School-level performance across measures should be clearer in order to more specifically identify strengths and weaknesses—not merely for the purpose of informing the public, but also for the purpose of supporting school improvement efforts.
Is Demography Destiny?
Existing accountability systems have been criticized for inherently disadvantaging schools serving low-income students, students of color, ELLs, and special education students. This is ironic given the fact that one of the motivating factors behind the creation of these systems was the desire to improve school performance for these communities.
While schools serving large concentrations of historically marginalized students face unique challenges, it is also possible that present accountability formulas do not adequately measure the quality of such schools. During the most recent year (2018–2019) in which accountability percentiles were calculated by the Massachusetts Department of Elementary and Secondary Education (n.d.), the bottom 15% of performers served roughly twice as many low-income, English-learning, and racially minoritized students as did the public schools overall. If schools serving historically marginalized populations are destined—by virtue of their demography—to perform worse in state accountability determinations, they may be systematically harmed by the consequences (Shepard et al., 2009). Such consequences include not just state takeover, but also downstream effects on teacher recruitment and retention, parent choices about enrollment, and public support.
As this study finds, the student survey data produced by this project were weakly correlated with demographic variables related to race, class, and language status—more in line with growth scores than with achievement percentiles or chronic absence rates. Given the fact that growth scores reflect a concerted effort to measure schools “fairly” across differences, this seems encouraging. Unlike growth scores, which display weak but negative correlations with the overall school share of historically marginalized students, our student survey measure was positively correlated with the percent of low-income students, students of color, and ELLs in a school. One possible explanation for this is the fact that Massachusetts has a more progressive school funding formula than many other states, and that may be equalizing opportunity in a manner not captured by standardized tests.
Such a result has important implications for equity. Were a policy change made to include surveys in state accountability systems, the long-enduring correlation between student demographics and perceptions of school success might be somewhat disrupted. An even more promising outcome might be a more nuanced and precise discussion of school performance that acknowledges areas of strength in schools that presently fare poorly in accountability calculations.
Can Surveys Be Used for Accountability?
As this study finds, including student survey data in state accountability formulas will likely produce small but meaningful changes in overall ratings. Strong face validity of the new measures—designed to align with school quality constructs valued by the public—and reduced correlations with student demographic variables suggest that the survey is measuring something that matters and doing so in a way that captures more about schools and less about student background. This echoes the findings of similar research efforts (e.g., West, 2016).
Changing a state accountability system is a high-stakes enterprise, and states will be understandably cautious in adopting new measures or adjusting their formulas. Yet the inclusion of student survey data appears to pose little threat of making accountability systems less informative or more strongly correlated with demography. Insofar as that is the case, they appear to merit greater inclusion—at least on a trial basis. Moreover, because student survey results correlate moderately with existing accountability determinations, they do not seem likely to trigger immediate resistance. While identical results would seemingly render survey data unnecessary, diametrically opposed results might make the inclusion of survey data more suspect in the eyes of key stakeholders and therefore less likely to be adopted.
It also seems that the inclusion of these new measures would make accountability systems harder to game. That is not to say that survey measures would be impossible to manipulate. Rather, systems with more measures may be harder to game than those with fewer measures. Similarly, although survey instruments—like all measurement instruments—are subject to some degree of bias, the inclusion of more measures may be a way of mitigating the overall bias of accountability determinations. Because student perception surveys can include a wide range of constructs, they are particularly useful tools in this regard and might be further supplemented with teacher perception surveys.
Finally, the inclusion of student survey data in accountability formulas may enhance the ability of state education agencies to offer technical assistance to schools and districts. Although such agencies measure a relatively wide array of school quality constructs, their organizational gaze is focused by accountability formulas. Given the narrowly tailored design of current accountability systems, state education agencies have tended to offer intervention and support that is similarly constrained, and which therefore only supports particular aspects of what schools seek to do. By institutionalizing a broader range of values, such agencies may more clearly see school strengths and weaknesses and may be able to deliver more effective forms of support as a result.
Limitations
This study examined a relatively small number of schools in a single state. A different sample of Massachusetts schools, or schools from another state, may have yielded different results. Similarly, the student perception survey used as a data source in this study may differ in important ways from those in use in other states or from the state-designed survey presently used in Massachusetts (Massachusetts Department of Elementary and Secondary Education, 2019). Before policy leaders act on this study, we recommend more research with these limitations in mind.
Perhaps most significantly, the survey used in this study had no stakes attached to it, and results might theoretically change in a high-stakes environment. As research into existing accountability systems indicates, measures with stakes attached to them can result in various forms of gamesmanship (Hamilton et al., 2002; Lowe & Wilson, 2017). Although this poses a significant problem with regard to translating these research findings into policy action, it may also be the case that the addition of more measures in accountability systems reduces the ability of school and district leaders to manipulate their results. Moreover, it is not beyond the realm of possibility to imagine a future accountability system in which consequences are neither high stakes nor algorithmically determined. That is, more robust information might be made available to educators and the public, who might engage in more deliberative forms of accountability (e.g., Gottlieb & Schneider, 2018). In light of this, we encourage not only more research, but also more experimentation in the form and process of educational accountability.
Conclusion
This study was guided by two aims, the first of which was to generally explore student perception surveys. As we find, scores produced by these surveys are not colinear with the existing components of present accountability systems and are weakly tied to student demography. Thus, this study supports and extends prior work on student perception surveys.
The second aim of this study was to examine the use of student surveys in accountability applications. Study limitations preclude strong claims about the inclusion of survey data in accountability formulas. Still, it does appear that student surveys would alter, but not completely overturn, existing systems. As discussed earlier, the validity of including surveys may be assessed by considering a measurement and a functional perspective. From a measurement perspective, survey measures should have high internal coherence. From a functional perspective, survey measures should be used constructively within and outside schools in order to drive school improvement. The functional perspective is aided when survey measures broaden the dimensions by which school quality is determined and do so in a way that aligns with public values. Finally, along with growth scores, the inclusion of student survey data would further mitigate the troubling relationship between accountability status and student demography.
There is no clear or natural way to determine the “right” amount of student voice data to include in state accountability formulas. As with the determination of precisely how school quality is measured, the determination of how, if at all, survey measures should be included in accountability is an opportunity for a robust community decision-making process. Our analytic decision in this study—to include student surveys at a 25% dosage—could serve as a starting point for deliberation insofar as it suggests a threshold high enough that student voice is more signal than noise but not so high as to overwhelm more traditional and familiar measures. Thus, we believe that these findings could be used as one artifact in a broader deliberation about what matters when it comes to school quality and how to measure what matters most.
Finally, we end with a note of caution. Including an additional source of information about school quality may alleviate the problem of narrowly tailored accountability; but it should not be perceived as a one-size-fits-all solution. As long as high-stakes state accountability systems pressure educators and school leaders to improve their measured performance, those measures will be subject to corruption. Moreover, as Campbell (1979) warns, such systems will continue to distort the educational process in undesirable ways. Consequently, if policy makers are truly committed to improving educational accountability systems, they must not only address the information on which such system are based, but also the broader processes that structure the relationship between states and schools.
Footnotes
Appendix A
The Massachusetts Consortium for Innovative Education Assessment (MCIEA) is a partnership between eight public school districts and their teachers’ unions, and roughly 100,000 students attend consortium schools. This article draws on MCIEA’s work to develop a more holistic accountability system in Massachusetts. The framework of this system was developed through community collaboration and draws on multiple measures, including academic, social-emotional, and school culture indicators in order to provide a fairer and more comprehensive picture of school performance. For more information on MCIEA and their work, please visit: https://www.mciea.org/school-quality-measures.html
Appendix B
Appendix C
The majority of survey scales used in this project demonstrate acceptable levels of reliability, as shown in Table A1. This table is adapted from an internal reliability analysis.
Appendix D
Correlation of Each Survey Scale With Existing Accountability Constructs (Proficiency, SGP, Absenteeism) and Overall Survey Results

| Construct | Scale | Survey percentile | Achievement percentile | Growth percentile | Chronic absenteeism percentile | Overall accountability percentile |
|---|---|---|---|---|---|---|
| Effective practices—general | 1Aii.1 | .69 | .05 | .30 | .22 | 0.26 |
| Effective practices—specific teacher | 1Aii.2 | .14 | -0.04 | –0.12 | –0.06 | –0.13 |
| Student physical safety | 2Ai | .14 | .56 | .32 | .68 | .53 |
| Student emotional safety | 2Aii | .29 | .35 | .30 | .40 | .39 |
| Student sense of belonging | 2Bi | .83 | .25 | .40 | .14 | .41 |
| Student–teacher relationships—general | 2Bii.1 | .56 | .01 | .07 | .06 | .05 |
| Student–teacher relationships—specific teacher | 2Bii.2 | .24 | –.01 | .01 | –.07 | .01 |
| Valuing of learning | 2Ci | .78 | .05 | .30 | –.23 | .22 |
| Academic challenge—general | 2Cii.1 | .35 | –.14 | .31 | .09 | .17 |
| Academic challenge—specific teacher | 2Cii.2 | .50 | –.12 | .01 | .24 | –.07 |
| Content specialists and support staff | 3Aii | .76 | .15 | .30 | –.07 | .29 |
| Engagement in school | 4Bi | .85 | .07 | .31 | –.13 | .23 |
| Appreciation for diversity | 5Ai | .36 | .15 | .32 | .11 | .31 |
| Civic participation | 5Aii | .68 | .21 | .23 | –.06 | .25 |
| Perseverance and determination | 5Bi | .67 | .10 | .18 | –.14 | .18 |
| Growth mindset | 5Bii | .37 | –.24 | .07 | –.19 | –.06 |
| Valuing creative and performing arts | 5Cii | .67 | .02 | .31 | –.18 | .22 |
| Physical health | 5Di | .82 | .17 | .34 | –.08 | .30 |
Note. SGP = student grade point. Survey scale percentiles derived from 2016–2017 survey results of 18,927 students in Grades 4 through 8 from 100 non-high schools in Massachusetts. Achievement, growth, and chronic absenteeism rates from Massachusetts Department of Elementary and Secondary Education (n.d.).
Authors
JACK SCHNEIDER is an assistant professor of education at the University of Massachusetts Lowell and the director of research for the Massachusetts Consortium for Innovative Education Assessment. He is the author of four books and the cohost of the education policy podcast “Have You Heard.”
JAMES NOONAN is an assistant professor the Department of Secondary and Higher Education at Salem State University and the associate director of research for the Massachusetts Consortium for Innovative Education Assessment. His research examines the intersection of leadership and equity, as well as the measurement and public perception of school quality.
RACHEL S. WHITE is an assistant professor in the Educational Foundations and Leadership Department at Old Dominion University’s Darden College of Education and Professional Studies. Her research examines policy making, policy implementation, voice, and power.
DOUGLAS GAGNON is a senior education researcher at SRI International where he conducts applied research and technical support. His work often examines issues related to rural education.
ASHLEY CAREY is a doctoral student at the University of Massachusetts Lowell. Her research examines equity and inclusion in K–12 schools.