
Abstract
Using a regression discontinuity design, we examine the effects on graduation and college and career readiness of two types of school performance designations under ESSA in California: (1) color ratings based on individual performance measures that are highly visible, yet do not carry direct ramifications; and (2) federally-mandated Comprehensive Support and Improvement (CSI) designations based on multiple performance measures that are less visible, but have explicit consequences for designated schools. We find significant positive effects of a red color rating (the lowest performance designation) on the outcome on which the rating was based, yet no significant effect of a CSI designation. Descriptive evidence from a principal survey and interviews with district administrators highlight two potential mechanisms behind the differential effects: (1) the relative clarity of color ratings that rely on a single performance measure; and (2) the visibility of color ratings that may induce a sense of urgency among stakeholders.
Keywords
Introduction
School accountability is arguably the most influential policy lever available to federal education policymakers. All public schools are subject to the accountability requirements laid forth in the Every Student Succeeds Act (ESSA)—the most recent reauthorization of the Elementary and Secondary Education Act (ESEA). More than 2 decades after the No Child Left Behind (NCLB) Act of 2001 inserted consequential accountability provisions into the ESEA, the debate as to whether accountability systems can promote broad improvement to students’ educational outcomes continues. Moreover, since the advent of school-level accountability policies, the theory of change behind them has followed the same general framework: (a) measuring school performance and determining performance levels focuses attention on desired student outcomes, (b) schools and districts with different levels of performance ratings face differential public pressure to improve and different ratings may come with different consequences, (c) educators experience increased motivation to improve practices and outcomes as a result of pressure created by public disclosure of performance and consequences, and (d) external assistance and additional resources allow schools to build capacity and implement improvement actions (e.g., Atchison et al., 2023; Fuhrman & Elmore, 2004; Le Floch et al., 2007). Underlying this theory of change is the assumption that school performance signals are clear, publicly visible, accessible to local practitioners, and provide actionable information for school improvement.
ESSA, the most recent reauthorization of the ESEA, introduced several important changes to federal school accountability. One such change was that ESSA moved away from NCLB-era accountability, which relied heavily on student achievement in reading and mathematics in school evaluations and enabled states to design complex systems with multiple measures. These policy shifts sought to foster state accountability systems that provide more holistic information about school performance, recognizing that school performance is not unidimensional. As a result, states incorporated new data and measures of school performance into their accountability systems, such as student growth, college and career readiness, and chronic absenteeism. A potential drawback of multiple-measure accountability systems, on the other hand, is that more complex calculations and ratings of school performance could make it difficult for stakeholders to understand why their school was designated as low performing, and to identify the best strategies to improve. In other words, the signal about school performance that educational stakeholders receive could be obscured.
A second major change was that, unlike its predecessor, the NCLB Act of 2001, ESSA provided states flexibility to determine which interventions to use in schools that are identified as low performing (Comprehensive Support and Improvement [CSI] schools), only requiring that at least one intervention in a CSI school be an evidence-based practice that meets one of three rigorous evidence tiers. In addition, CSI schools that fail to show sufficient progress needed to exit CSI status face increasingly rigorous interventions if they do not meet exit criteria within 4 years. As such, other than the development of a school improvement plan and a threat of escalating consequences at a future date, ESSA contains few requirements as to what CSI schools must do in response to their designation—a marked contrast from NCLB, which required a series of prescriptive and progressively more intensive interventions in each successive year that schools failed to meet accountability standards (Hess & Finn, 2007).
In this study, we examine the causal effects of school-level performance ratings on student outcomes in the context of California’s school accountability system under ESSA. Following the enactment of ESSA, the California Department of Education (CDE) implemented a “dashboard” system that assigns color-coded ratings to schools on seven possible indicators: student performance in reading and math, chronic absenteeism, college/career readiness, English learner progress, suspension rate, and high school graduation rate. For each of these indicators, schools receive a color-coded rating (based on their overall status as well as their progress relative to the previous year), which are posted annually on CDE’s school accountability dashboard. Under California’s system there are five colors represented in the rating system, with red indicating the lowest level of performance and blue indicating the highest level of performance. The dashboard is intended to foster public access and understanding of school performance, and the CDE website explicitly highlights their intent to provide Section 1 “parents and educators with meaningful information on school and district progress” (California Department of Education, 2024d). In Figure A1 of Appendix A in the online Appendix we provide a screenshot of the California School Dashboard for an example high school.
Under federal law, all states must identify the lowest-performing schools based on their method of measuring performance as CSI; California identifies these schools based on the number or percentage of red and orange ratings that schools receive, or on having a graduation rate below 67% for high schools. Once identified, CSI schools are required to develop a school improvement plan based on a needs assessment, and are also eligible to receive additional federal school improvement funding. CSI schools are also expected to receive additional technical assistance from the district as well as state and regional support providers (in California’s case, the county offices of education). However, in contrast to color ratings, CSI designations are notably absent from the California School Dashboard.
As such, there are two types of low-performance designations under California’s system. The first set of designations are the color ratings based on individual performance indicators, which send clear signals on the specific areas in which the school is underperforming and are highly visible through the state school dashboard. However, they do not carry any direct ramifications but convey indirect consequences through public reporting and their potential contribution to CSI designation. Second, the CSI designations are based on varied combinations of color ratings or through low graduation rate; thus obscuring the signals about the specific areas most in need of improvement. CSI ratings are also less visible as they do not appear in California’s School Dashboard website. That said, there are explicit consequences of the CSI designation including additional technical assistance and financial resources for schools and escalating interventions for schools which fail to exit the designation. Thus, these two types of designations may each have salience in promoting improvement of identified schools, but for different reasons.
We examine the effects of low-performance designations on high school graduation and college and career readiness using the cutoffs for designating color ratings and CSI designations in California high schools and a regression discontinuity design (RDD). We focus on these high-school specific measures for two reasons. First, ESSA placed increased focus on high school graduation and measures of college and career readiness. ESSA required that all schools with graduation rates below 67% be identified as CSI schools. In addition, many states, California included, selected measures of college and career readiness to include as performance indicators in their ESSA accountability system. Second, the Covid-19 pandemic disrupted the continuity of data collections for many types of performance measures, including test scores, chronic absenteeism, and student discipline. California’s data collections for graduation and college and career readiness, in contrast, continued throughout the Covid-19 pandemic. During the 2018–2019 school year, 2,489 schools in California were rated on graduation and college and career readiness, representing approximately 25% of California’s almost 10,000 public schools.
We find that receiving a red rating (the lowest of the five color ratings) based on a performance indicator significantly improved the outcomes directly associated with that indicator. For example, high schools whose graduation score fell below the red graduation rate cutoff had significantly higher graduation rates in the years that follow compared to high schools right above this cutoff. We find similar results for college and career readiness outcomes at the red college and career readiness cutoff. In contrast, our results suggest statistically insignificant (and precisely estimated zero in many cases) effects of CSI designation on these outcomes that were considerably smaller in magnitude. We also do not find evidence that red color ratings affected outcomes other than those directly associated with the indicator receiving a red rating. For example, we do not find evidence that a red graduation rating influenced college and career readiness outcomes or vice versa. To understand why color ratings might have had a stronger effect on student outcomes than CSI designations in California, we draw on descriptive information from a principal survey and district interviews.
Prior Research on the Effects of School Accountability Designations and Associated School Turnaround Efforts
As noted previously, ESSA contains several provisions that depart from prior policy, primarily in the vein of providing states with increased flexibility in identifying and intervening in low-performing schools. Under the assumption that how one intervenes in low-performing schools will make a difference in outcomes, we begin by describing the pre-ESSA federal policies surrounding the intervention in low-performing schools under NCLB, the School Improvement Grant (SIG) program, and NCLB waivers. Next, we present a review of research examining the effects of these pre-ESSA accountability and school turnaround policies, and explanations for heterogeneity of results. Lastly, we present on the small body of research that has examined effects of ESSA accountability policy.
Pre-ESSA Federal Accountability and School Turnaround Policies
NCLB entailed a series of prescriptive and increasingly intensive interventions that escalated the longer that schools failed to meet the accountability requirement known as adequate yearly progress (AYP). These interventions included allowing students to attend other schools (school choice), creating a school improvement plan, offering supplemental educational services, and ultimately replacing school leadership and staff or converting to a charter school (Hess & Finn, 2007; Rice & Malen, 2010). In addition to being perceived as prescriptive and punitive (Darling-Hammond, 2007; Mintrop & Sunderman, 2009), NCLB was also criticized for too narrowly focusing on proficiency rates for math and English language arts (ELA) assessment as the student outcome measures on which schools were rated. Several studies showed that this narrow focus led to unintended consequences, including reallocation of instructional time toward tested subjects at the expense of non-tested subjects, and focusing instructional efforts on students nearest proficiency thresholds, or taking other actions that might lead to improved accountability ratings without legitimate improvement to teaching and learning (Chakrabarti, 2007; Chester, 2005; Dee, Jacob, & Schwartz, 2013; Diamond & Spillane, 2004; Koretz, 2008; Neal & Schanzenbach, 2010; Rothstein et al., 2008). However, others noted the positive aspects of NCLB, including increased use of data, heightened focus on inequities among student groups, and prioritization of evidence-based interventions (Hamilton et al., 2007; Jennings & Rentner, 2006; Taylor et al., 2010).
Subsequent federal policies, including the SIG program and NCLB waivers, continued a fairly prescriptive approach to school improvement, requiring that schools select and implement one of four specific school turnaround models (Transformation, Turnaround, Restart, or Closure) or to implement interventions aligned with seven federally specified school turnaround principles (Hurlburt et al., 2011; U.S. Department of Education, 2012). Despite the requirements to implement specific models or certain types of interventions, prior studies also found that when given options, schools most often opted for approaches that were “easiest and least aggressive” (Cunningham, 2017). In the case of SIG, about three-fourths of SIG-awarded schools opted for the “transformation” model (Hurlburt et al., 2012), widely noted as the least prescriptive of the four SIG intervention models (O’Leary, 2010). The SIG program also included sizable grants to assist schools in implementing their selected interventions. Under NCLB waivers, states began to increase the breadth of measures included in the measurement of school performance under the accountability system, with increased attention to assessment growth in addition to achievement levels.
The Effects of Pre-ESSA Accountability and School Turnaround Policies
Studies of early accountability systems focused on statewide gains in improvement rather than the improvement of schools specifically designated as low-performing, finding that states that adopted “consequential” accountability systems and those with stronger repercussions for schools had larger statewide achievement gains than states with less stringent consequences or those that relied only on reporting results without consequences (Carnoy & Loeb, 2002; Hanushek & Raymond, 2005). Dee and Jacob (2011) examine the impact of NCLB on statewide achievement, finding that the mandated adoption of stronger accountability systems that contained consequences for low performance, led to improved outcomes in states that did not have accountability systems containing consequences for schools prior to NCLB. Collectively, these studies point to the importance of consequences and repercussions in promoting improvement in response to accountability.
Another set of studies focused on individual schools identified for improvement under state or federal accountability requirements. Several studies have examined the relationship between identification as a low-performing school and subsequent student achievement using rigorous causal inference designs under pre-ESSA federal policy regimes or with respect to state-specific accountability policies. Most of these studies used an RDD to compare achievement results of students attending schools just below and above a cutoff point, below which schools were identified as low performing, and hence assigned accountability ratings such as A through F letter grades.
For example, several studies found that F ratings in Florida led to increases in student assessment outcomes (Chakrabarti, 2007; Figlio & Rouse, 2006). Using a cross-sectional RDD, Rouse et al. (2007) determined that students attending Florida schools with F grades in the year following the accountability designation scored higher on both high-stakes and low-stakes assessments in reading and math than did students in other schools with accountability grades signifying higher performance. Moreover, Rouse et al. concluded that teachers in F schools changed their instructional practice in meaningful ways. Figlio and Rouse (2006) attribute the findings mostly to the “stigma” of receiving a low grade rather than through the threat of consequences associated with the grade, suggesting the importance of publicly reporting results in a clear way. Winters and Cowen (2012) performed a study examining New York City’s district accountability system that also used an A through F rating and similarly found that the F rating led to subsequent improvement on math and ELA assessment results noting that findings were most consistent with a “shaming” explanation.
In addition, a number of rigorous studies in multiple states examined the impact of the NCLB waivers and the SIG program, both of which shaped the transition from NCLB to ESSA. With respect to SIG, Carlson and Lavertu (2018) studied the effects of the program in Ohio—finding positive effects on math and ELA test scores as well as positive effects on school spending. LiCalsi et al. (2015) also found positive effects of the program, but in Massachusetts. On the other hand, Dragoset et al. (2019) conducted a national evaluation of SIG, examining SIG schools from more than 20 states, and found that SIG had no statistically significant impact on any of the outcomes examined, including math and reading scores, graduation, and college enrollment. Notably, both Carlson and Lavertu (2018) and Dragoset et al. (2019) found that the “turnaround” model, which required the replacement of at least 50% of school staff, had larger positive effects than the less prescriptive and aggressive “transformation” model, linking the strength of consequences to degree of improvement of schools.
Turning next to studies of accountability designations under NCLB waivers, Bonilla and Dee (2017) found positive effects of low-performance designations under NCLB waivers on math and reading proficiency in Kentucky. This contrasts with several studies that detected zero or negative effects of low-performance designations under NCLB waivers. Hemelt and Jacob (2017) found no evidence of positive impacts of the waiver policy on student achievement in Michigan, with some evidence of short-term negative impacts. Dee and Dizon-Ross (2019) also found no effect of low-performance designations under NCLB waivers on outcomes in Louisiana (Dee & Dizon-Ross, 2019). Similarly, Weiner et al. (2017) found no evidence of positive impacts of accountability designations under the NCLB waivers; they also found that schools forced to implement a higher number of interventions due to focus designation performed worse as a result. Atchison (2020) found statistically significant and substantively large negative effects of the priority school designation in New York on student achievement outcomes under the NCLB waiver policy and also noted the expectation that schools engage in a wide variety of improvement activities. Lastly, Henry and Harbatkin (2020) found negative effects of a pre-ESSA school-turnaround policy in North Carolina (which they describe as “ESSA-aligned”) also noting that the policy led to increased teacher turnover. In other words, the increased pressure of accountability could lead to unintended consequences, including increased staff turnover and a flurry of activity that lacks direction and coherence (Hurlburt et al., 2024).
In contrast to studies that related accountability and school turnaround efforts to test-based academic outcomes, few studies have examined graduation and college and career readiness as outcomes. Whereas the meta-analysis by Schueler et al. (2022) identified over 50 studies (with over 100 effect sizes) that examined math and ELA outcomes in the pre-ESSA time period, only six studies (with seven effect sizes) examined graduation as an outcome finding no statistically significant effect on graduation. The meta-analysis by Redding and Nguyen (2020) also included only seven effect sizes for graduation, but did find statistically significant and positive effects of accountability-based turnaround interventions on graduation. In addition to these meta-analyses, Deming et al. (2016) examined high school academic achievement and postsecondary outcomes in relation to accountability pressure in Texas in the 1990s, prior to NCLB. Using an event study design, they found that increased accountability pressure associated with a low-performance rating led to higher 10th grade test scores, increased likelihood of graduating high on time, and increased postsecondary success in terms of college attendance and earnings.
ESSA Accountability and the Contribution of this Study
In contrast to the extensive literature about the effects of school accountability prior to ESSA, relatively little is known about the effects of accountability following the implementation of ESSA. Notably, policymakers have sought to emphasize supports associated with ESSA accountability while shifting away from the punitive framing of NCLB-era accountability (Le Floch et al., 2024). Furthermore, the added flexibility of ESSA regarding how to identify and intervene in low-performing schools sets up the potential for even more heterogeneity in outcomes.
Thus far, three studies of ESSA accountability in two states have yielded contrasting findings. Researchers in Michigan have reported evidence of improved student outcomes prior to the pandemic associated with the state’s approach to supporting the lowest performing schools under ESSA (Burns et al., 2023; Cullum & Harbatkin, 2023). More relevant to the scope of this study, Atchison et al. (forthcoming) examined the effects of CSI designation under ESSA on student outcomes in Ohio. They found significant negative effects of the designation on student outcomes, including chronic absenteeism, attendance, ACT scores, and high school graduation. Drawing on a survey of principals in Ohio, the authors attribute these adverse effects to the lack of clarity about the designations and areas of needed improvement. Although ESSA intends that CSI schools receive supports and resources above and beyond those provided to other schools, principals in Ohio reported similar supports in CSI and non-CSI schools.
Our study complements this emerging literature on the effects of performance designations under ESSA by examining the effects of accountability-based low-performance designations in California’s unique setting on graduation and college and career readiness outcomes. In particular, California’s school accountability system under ESSA allows us to examine the effects of two different types of low-performance designations: (1) color ratings that are highly visible and easy to understand, yet do not carry any direct ramifications for schools; and (2) CSI designations that are intended to identify the set of schools with the lowest overall performance and impose requirements for implementing improvement efforts and provide supports for those schools, yet are less visible. Thus, our research sheds light on the balance between clarity and complexity under multi-measure accountability systems and the implications for school improvement. Furthermore, our study contributes to the small body of work that has focused on outcomes other than test-based achievement measures.
Federal School Accountability Under ESSA and California’s Accountability System
Enacted in 2015, ESSA transitioned from school performance evaluations relying almost exclusively on student performance on standardized tests under NCLB, to a system that requires states to include at least five accountability indicators. 1 The intent of ESSA was to provide a more comprehensive picture of a school’s overall performance, through the requirement that states include multiple measures of school performance. Under the law, states have substantial latitude in determining which measures to include when evaluating school performance. Additionally, states have flexibility in deciding how to aggregate those measures to determine a school’s overall level of performance. States are then required to identify the bottom 5% of Title I schools based on overall performance across all measures and high schools with graduation rates below 67% as comprehensive support and improvement (CSI) schools. These schools are then required to develop and implement a school improvement plan, and additional supports are intended for these schools to promote improved student outcomes. 2 In addition to identifying CSI schools, ESSA requires the identification of schools that are consistently underperforming for any student group as targeted support and improvement (TSI) schools, and schools where one or more student groups is low-performing based on criteria comparable to the CSI school identification criteria as additional targeted support and improvement (ATSI) schools. TSI and ATSI designations are not included in the scope of this study. Although simple in premise, states must make numerous technical decisions to operationalize the calculation of performance and create distinct categories of performance ratings. Each decision influences how each school’s performance level is characterized, and which schools are identified as low performing.
A second major change in ESSA is to provide more flexibility in terms of how to intervene in schools designated as low performing. NCLB and other federal policies aimed at turning around low-performing schools (SIG and NCLB waivers), contained prescribed sets of interventions. In contrast, school improvement for CSI schools under ESSA is largely anchored by the school improvement plan, allowing states and districts to tailor supports and interventions for CSI schools. In addition, ESSA makes an intentional shift in the framing of accountability to focus on the supports provided rather than the sanctions and other aspects of accountability policy that were often seen as punitive (Le Floch et al., 2024).
To evaluate school performance, California uses a “dashboard” system that assigns ratings to schools on seven possible indicators. These indicators include: (1) performance in English language arts; (2) performance in math; (3) chronic absenteeism; (4) high school graduation rate; (5) English learner progress; (6) suspensions; and (7) college and career readiness. 3 For each of these indicators, schools receive one of five color-coded ratings, ranging from blue (highest performing) to red (lowest performing) based on their overall status as well as their progress relative to the previous year.
In California’s dashboard system, a series of cut scores assigns each school to one of five categories for both performance status (how high or how low) and change in performance. Schools performing lower in both status and change receive a lower color rating for the indicator. Figures 1A and 1B illustrate how a school’s college and career readiness and high school graduation performance is rated according to performance status and year-to-year change. A school’s color rating for the college and career readiness indicator (CCI) is based on the percentage of students deemed “prepared” or “approaching prepared” for college or career. Students can demonstrate preparedness through performance on state accountability assessments, performance on Advacned Placement (AP) or International Baccalaurate (IB) exams, completing college credit-bearing courses, completion of the state’s State Seal of Biliteracy, participation in Leadership/Military Science programs, completion of A-G requirements (the set of high school courses required for admission into the University of California system), or completion of a Career Technical Education Pathway. A school’s graduation rate indicator is based on the percentage of twelfth-grade students who have graduated on time.

Definitions of Color Ratings for the College and Career Readiness Indicator

Definitions of Color Ratings for the Graduation Rate Indicator
Schools with certain combinations of red and orange (the second lowest performance rating) are designated as CSI—such that at least 5% of Title I schools receive such a designation. 4 In addition, high schools with low graduation rates, as defined by a 2-year average high school graduation rate, are also identified as CSI. 5 Describing school performance through a dashboard is intended to provide simple, easy-to understand information. However, the state has made a series of decisions related to where to place cutoffs on both the status and change dimensions for each indicator and which color to assign to each color grid. As such, a substantial amount of complexity underlies the seemingly straightforward color-coded indicator ratings.
California’s system for identifying CSI schools is unique in several ways. First, California is one of just a few states that uses a dashboard system to identify CSI schools. By contrast, most other states use an index-based system in which multiple measures are aggregated into a single index or score. 6 Second, California’s approach to measuring growth by incorporating year-to-year change at the school level across all performance indicators is distinctive. Most states use techniques that focus on growth at the student level through the estimation of student growth percentiles or value-added scores. However, those states often measure growth using only English and math assessment scores, whereas California measures growth for each of the seven performance indicators.
As previously described, one of the key levers for improvement in CSI schools under ESSA is the development and implementation of a school improvement plan. However, in California, all schools are required to develop a School Plan for Student Achievement (SPSA), and California’s Education Code allows for the SPSA to meet the requirements of the CSI school improvement plan (California Department of Education, 2024a). As such, the requirement for a school improvement plan does little to distinguish school improvement efforts in CSI schools from non-CSI schools in California. School districts in California receive federal school improvement funding through Section 1003 of Title I, Part A of ESSA. For each CSI school designated in 2018–2019, school districts received $174,545 with the intent that the money be used for improving student outcomes in CSI schools (California Department of Education, 2024b). 7 For a school with 500 students, school improvement funding amounted to just under $350 per student. A portion of federal school improvement funding is also provided to county offices of education to provide technical assistance for CSI schools and their districts in the development and implementation of CSI plans. 8 A total of $10 million was provided to county offices of education based on 2018–2019 CSI designations, amounting to $14,347 per CSI school (California Department of Education, 2023). Blair et al. (2024) found that CSI schools in California spent approximately 4% more than similar non-CSI schools within the same district, whereas nationally, CSI schools spent 2.6% more in 2019–2020. In addition, they found that school improvement funding per pupil most commonly amounted to between $100 and $400 per pupil, across states, with California being in that range.
Data and Empirical Design
Data
To examine the effects of school low-performance designations on student outcomes, we use student- and school-level administrative records for the 2017–2018 through 2022–2023 graduating cohorts of students in California. These data include A–G completion (i.e., completing a series of high school classes that students are required to successfully complete for eligible admission to the California State University and University of California systems), AP/IB test participation, college credit attainment while still enrolled in high school, and high school graduation. These data also contain demographic characteristics of students, including race, gender, socioeconomically disadvantaged (SED) status, English learner (EL) status, exceptional/special education status, grade level, and schools attended. We supplement these administrative records with 2018 dashboard data on school performance for each accountability indicator (the performance level, year-to-year change, and color rating) and the 2018–2019 CSI designations (assigned based on the 2018 dashboard data).
An important challenge in our analysis is the effect of the COVID-19 pandemic (and the subsequent school closures) on student outcomes and availability of those outcomes. Like other states, no standardized testing for accountability purposes took place in California in 2019–2020 school year (Year 2 after CSI designation) and the test-taking rate remained low in 2020–2021 with only one-fourth of students in tested grades (3 through 8 and 11) completing ELA and math assessments. Additionally, other data, including absenteeism and student discipline, were undoubtedly affected during the first 2 years of the pandemic when most schools in California provided remote and/or hybrid instruction in ways that make them incomparable to other years. As such, in our analysis we focus on two outcomes for which the state’s data collections continued throughout the pandemic: high school graduation, and measures used to determine college and career readiness. We examine the effects of color ratings and CSI designation in the 2018–2019 school year on outcomes in the 4 years subsequent to those ratings and designation (2018–2019 through 2021–2022).
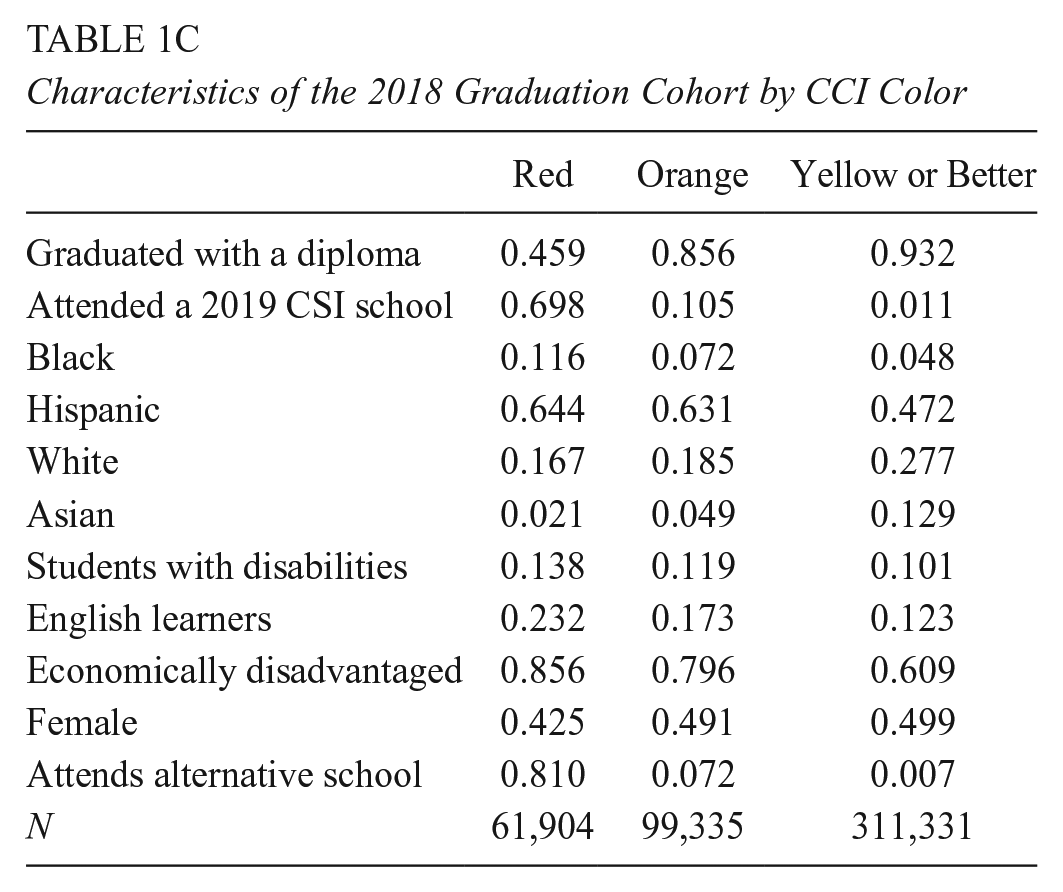
Tables 1A–1C compare graduating cohort characteristics in 2018 by schools’ CSI status (Table 1A), by schools’ high school graduation color rating in 2018–2019 (Table 1B), and college and career readiness indicator color rating (Table 1C) in 2018–2019. 9 These summary statistics show that schools receiving low-performance designations (CSI, red, or orange designations) were overrepresented by students from traditionally marginalized student groups (e.g., racial/ethnic minorities, economically disadvantaged students, English learners) and lower likelihood of graduating with a diploma compared schools with other designations. For example, only 41% of the students in the 2018 graduating cohort graduated from high schools that were designated as CSI in 2018–2019, compared to 89% for non-CSI schools. Similarly, 87% of the students in the 2018 graduating cohort in high schools who received a red color based on their graduation rates were socioeconomically disadvantaged compared to 64% in high schools who received a yellow rating or higher. These differences in baseline student characteristics and outcomes suggest that a naïve comparison between student outcomes in schools that were designated as low-performing versus students in other schools will likely yield biased estimates of the causal effects of the low-performance designation.
Characteristics of the 2018 Graduation Cohort by CSI Status

Characteristics of the 2018 Graduation Cohort by Graduation Color

Characteristics of the 2018 Graduation Cohort by CCI Color
Analytic Approach
To address this issue of selection into low-performance designations, we rely on an RDD comparing the outcomes of students in schools whose accountability ratings fell right below the performance designation cutoff (CSI or color ratings) with those right above the CSI and color rating cutoffs in California. In particular, we leverage the discrete changes in likelihood of receiving certain low-performance designations within small bandwidths around a given cutoff. We estimate the causal effect of five low-performance designations in California, where each designation is the result of being below a given cutoff: (1) CSI designation through 2-year average graduation rate; (2) red color rating for graduation rate; and (3) orange color rating for graduation rate; (4) red color rating for college and career readiness; and (5) orange rating for college and career readiness.
For each cutoff we use a different running variable representing the distance to the cutoff for a given designation. Because color ratings are assigned based on two measures—level of performance and change from the prior year’s performance—each school has two distances that will get it to a given cutoff: one distance along the level of performance axis and one distance on the change in performance axis. As such, for color ratings, we used the minimum distance to the cutoff as the running variable. For example, a school with a college and career readiness performance level of 3.5% and a change from the prior year of -2.2 percentage points has a red rating and would be in the bottom row and second column of Figure 1A. To get to the red cutoff (between red and orange) the school could increase in the performance direction by 6.5 percentage points to get to 10% (represented by cutoff between the bottom and second to bottom row), or it could increase by 4.2 percentage points in the change direction to get to a change from the prior year of +2 percentage points (represented by the cutoff between the third and fourth columns). As such, the minimum distance to the red cutoff is 4.2 percentage points and, because this school is on the red side of (below) the cutoff, it is assigned a negative value for the distance. For the color ratings, we then expressed these distances as standard deviations of the performance level variable.
We illustrate the discontinuities that underly the RDD in Figure 2 with left panel showing the likelihood of being designated as CSI based on schools’ distance from the graduation rate cutoff, the center panel showing the likelihood of being designated as red for graduation based on schools’ distance from the red graduation cutoff, and the right panel showing the likelihood of being designated as red or orange for graduation based on schools’ distance from the orange graduation cutoff. 10 For color designations, the discontinuity is sharp and there are no non-compliers resulting in a change in probability of receiving a given color rating of 1 at the point where the cutoff is reached. As a result, the intent-to-treat and the treatment-on-the-treated effects of color designation are identical. However, for CSI designation, because schools can be designated as CSI for overall low performance, some percentage of schools above the graduation CSI cutoff are designated as CSI and the probability of CSI designation changes by about 60 percentage points when crossing the CSI cutoff. 11 As a result, our estimates when using the graduation CSI cutoff use a “reduced-form” approach and estimate the intent-to-treat effect of scoring below the CSI cutoff, noting that the true causal effect of CSI designation is roughly 67% larger than these reduced-form estimates given the first-stage difference in CSI designation.

Discontinuities in Designations and Ratings and Key Cutoffs
Formally, in this setting, the effect of falling below the low-performance designation cutoff is given by:

where
We are interested in two main sets of student outcomes: (1) high school graduation; (2) college and career readiness measures including A–G completion, AP/IB test participation, and college credit attainment in high school. We estimate

Where
For each cutoff (CSI, graduation red, graduation orange, CCI red, and CCI orange) we choose a bandwidth based on the optimal bandwidth selection proposed by Calonico et al. (2017), when using graduation as the outcome measure, and check the robustness of our findings to different bandwidths that encompass the range of optimal bandwidths for different outcomes. The results of our analyses examining robustness to bandwidth selection are described later in the paper.
Regression Discontinuity Design Assumptions
In this empirical framework,

Where
Figure 3 presents the estimates of baseline equivalence, with the left column of figures presenting student outcomes and the right column presenting student characteristics. Each row of figures represents a different cutoff (e.g., the first row presents baseline equivalence at the graduation red cutoff. Out of 65 estimated discontinuities, only five are statistically indistinguishable from zero at 5% level, and only three of them represent discontinuities of an effects size larger than 0.5 for the corresponding baseline characteristics/outcome. These findings provide evidence that schools just below the cutoff are similar to those just above the cutoff along observable characteristics.
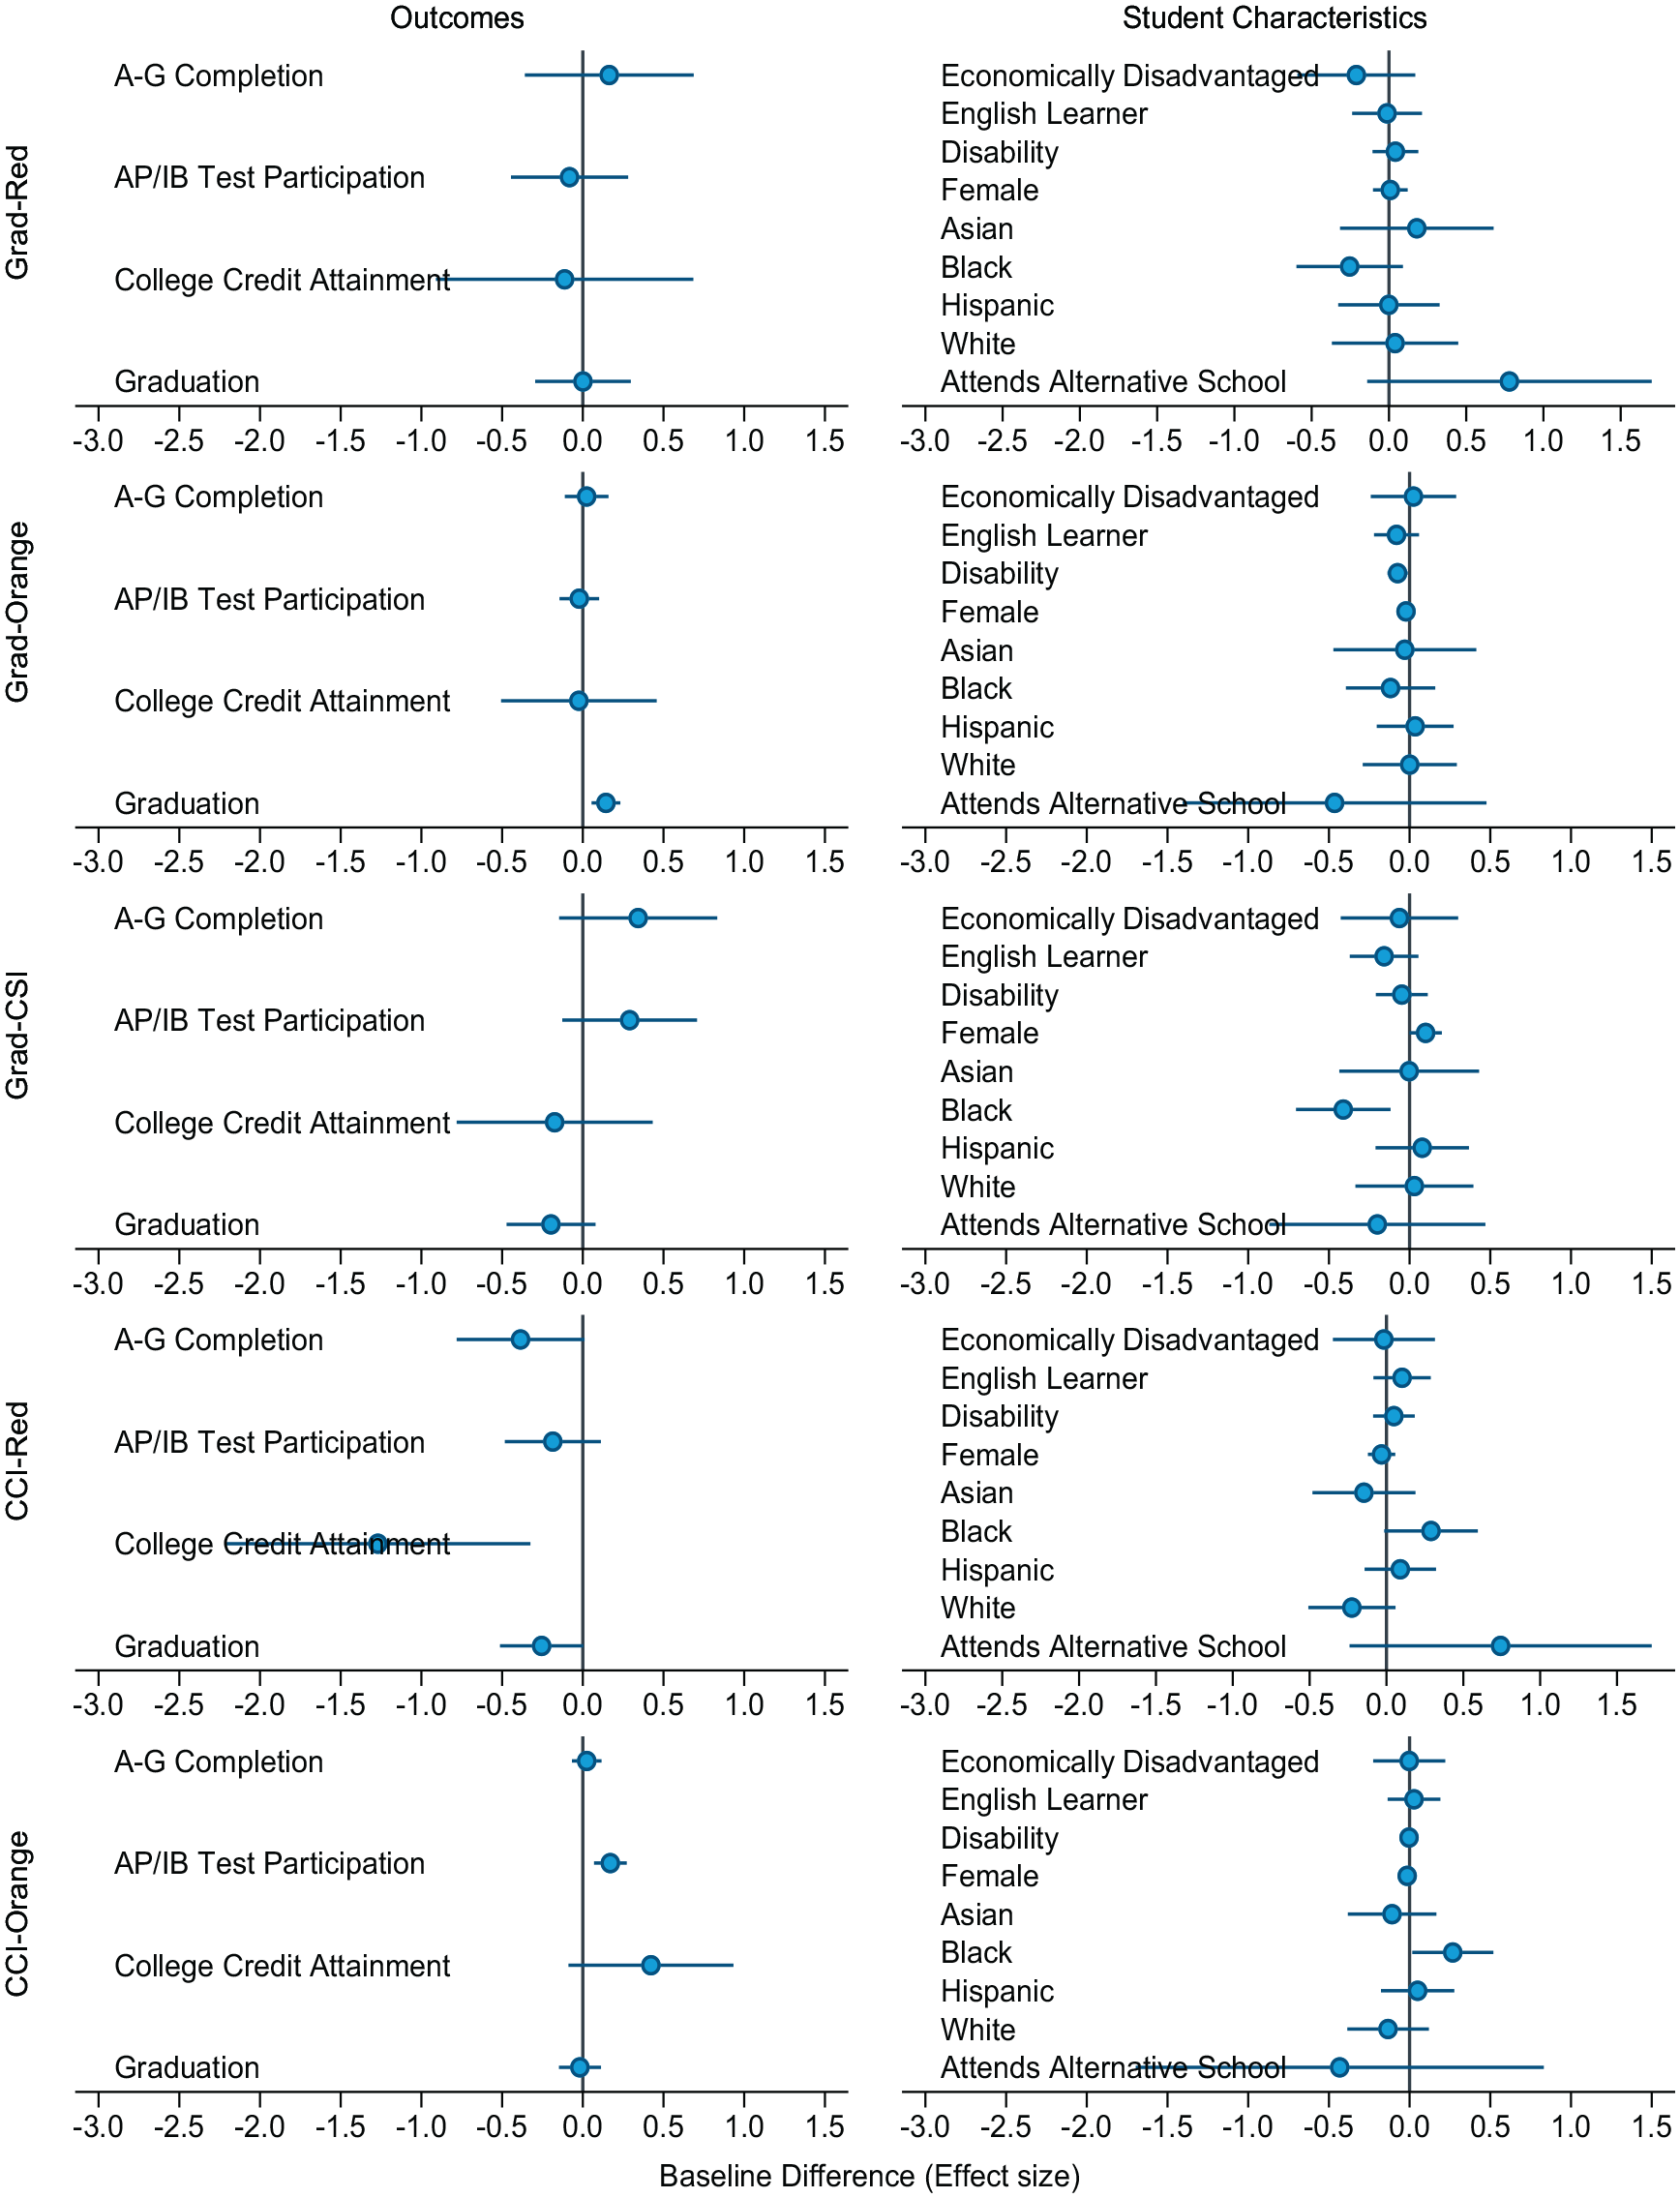
Baseline Equivalence (from 2017–2018) of Student Outcomes and Characteristics by Cutoff
Second, we check for the possibility of running variable manipulation as noted in McCrary (2008), although it is important to note that it is nearly impossible for school administrators to manipulate their performance indices given that multiple measures of performance (e.g., level and change in graduation rate) factor into each index. Figure 4 presents the distribution of schools around the CSI graduation, red and orange color rating cutoffs based on graduation performance, and red and orange color rating cutoffs based on college and career readiness performance. We find no unusual discontinuities at these cutoffs and McCrary tests reject a significant discontinuity in the density of the running variable at the cutoff in all cases (all p values greater than 0.322).

McCrary Density Tests for Discontinuities in the Density of Observations at the Cutoff
As mentioned earlier, an important challenge we faced in our analysis was how to consider the disruptions in schooling created by the Covid-19 pandemic in our analyses. For example, in California, standardized testing did not take place in Spring 2020 and only 25% of students in tested grades took the standardized tests in Spring 2021. We try to address this data quality/availability issue by focusing on student outcomes for which state data collection continued throughout the pandemic; graduation and metrics associated with CCI. Undoubtedly, the pandemic affected student outcomes and standards for success may have changed. For example, in response to high school students failing to complete required coursework during the pandemic, the state passed a law that required districts to exempt students from local graduation requirements beyond the California minimum high school graduation requirements (California Department of Education, 2024c). However, the key assumption in an RDD is that schools just above and below these cutoffs are not different in any observable or unobservable way, including the ways in which the pandemic affected these schools. As such, any changes in performance requirements and standards or efforts to mitigate negative pandemic-related outcomes should not differ on one side of a given designation cutoff versus the other. Thus, any observed differences in outcomes across a cutoff are attributed to differences in performance designations, even in the midst of the pandemic.
Supplemental Data and Analyses
Although RDD and other quasi-experimental quantitative designs using administrative data are effective in determining causal effects, they provide little information on policy implementation and actions that may contribute to or hinder the anticipated effects on outcomes. To help us better understand what is actually happening in low-performing schools, we conducted primary data collection through a principal survey and conducted semi-structured interviews with district administrators in California examining perceptions of the accountability system, the clarity and usefulness of information provided to schools, the focuses of school improvement efforts, and the types of supports received. Although descriptive in nature, the information from these primary data collection activities helps us to better understand the mechanisms that may be driving these results.
We administered the survey to the principals of all CSI schools and a set of relatively low-performing non-CSI schools (those who received at least two red or orange ratings on their accountability indicators) in California in Spring 2022, with a 65% response rate for California schools (746 responses out of 1,155 principals). The survey was also administered in Florida and Ohio with a similar response rate. In Table H1 of Appendix H in the online Appendix, we show the comparability of schools of the survey respondents to the full set of schools that were sampled. The experience of principals may also be particularly relevant to how principals responded to survey items. The disruption of data collections during the pandemic resulted in a freeze of the accountability system. At the time of survey administration, the accountability designations in place were issued several years earlier. This means that accountability designations were stable over the period of the pandemic, but also that very new principals would not have been in place at the time that schools received their designations. In Table H2 we provide information on the experience of principals who responded to the survey, showing that over two-thirds of survey respondents had 4 or more years of experience as a principal and almost half had 4 or more years of experience as the principal of their current school. Furthermore, the experience of principals responding to the survey did not substantially differ between CSI and non-CSI schools. More information about the survey analysis and findings can be found in Atchison et al. (2023) and Yang and Atchison (2024). We also conducted interviews with 14 district-level administrators representing seven school districts in California, where districts were selected on the basis of having a high number or percentage of CSI schools and intending to represent a variety of contexts in terms of district size and locale (i.e., urban versus rural).
Results
Figure 5 presents our main findings. In particular, each panel in Figure 5 presents the effect of a given low-performance designation (estimated using Equation 2) on a given outcome of interest. For example, the top left panel shows the effect of the graduation red designation on the graduation outcome. Outcomes are differentiated by the columns and designations are differentiated by the rows. Each dot represents the estimated effect for a given year since designation (Years 1 through 4) along with the 95% confidence interval of the estimate (represented by a horizontal line). In addition, we show the overall average estimated effect across the 4 years, with a solid vertical green line and the 95% confidence interval of the overall estimate with vertical dashed green lines. All discontinuities are converted to effect sizes using the cox index for binary outcomes.

Effects of Color Ratings and CSI Designation on Graduation and CCI Outcomes in the First 4 Years for the 2018–2019 Cohort
Tables C1–C4 in Appendix C of the online Appendix present the numbers behind these figures: Columns 1 and 2 present the estimated discontinuities at the corresponding low-performance designation cutoffs (and their standard errors) for each outcome; Columns 3 and 4 provide the average outcome prediction estimates for control and treatment groups, at each cutoff; Columns 5 through 7 provide the effect sizes, the effect size standard errors, and p values; Columns 8 and 9 show the total number of students and schools used for each regression; and Column 10 provides the pseudo R2 estimate. Finally, Appendix D of the Online Appendix presents the traditional RDD binned scatter plots of the outcomes of interests around the low-performance designation cutoffs in cases where we find significant effects of the designation on these outcomes.
Our analysis reveals that low-performance designations using color ratings (and especially red ratings) significantly improved the student outcomes for which the school was designated as low performing, while the CSI designation through 2-year average graduation rates did not have a statistically or educationally meaningful effect on any of the selected outcomes. For example, being designated as red based on the high school graduation performance indicator improves graduation rates with an effect size of 0.22 in the second year after the designation (p = .031), 0.31 in the third year (p = .011), and by 0.17 overall in the first 4 years (p = < .001). Students in schools receiving a red designation were about 2 percentage points more likely to graduate in Years 1 and 4, 4 percentage points more likely to graduate in Year 2, and more than 5 percentage points more likely to graduate in Year 3.
Similarly, the orange rating also improved high school graduation rates, with an average effect size of 0.067 in the first 4 years (p = 0.011). Across years, students in schools with an orange graduation rating were approximately 0.6% to 1.4% more likely to graduate. In contrast, we find no significant effect of CSI designation based on low graduation rate (an effect size of 0.019σ in the first 4 years with a p value of 0.603) or color ratings based on low performance on the college and career indicator (for the red rating we find an effect size of 0.019σ with a p value of 0.603; for the orange rating, we find an effect size of −0.032σ with a p value of 0.256 in the first 4 years).
We find similar patterns when we examine the effects of low performance designations on measures of college and career readiness, as shown by the results presented in the second through fourth columns of Figure 5 and Tables C2–C4 in Appendix C. In particular, being designated as red on the CCI increased the likelihood of A-G completion, with effect sizes of 0.27 in the first year (p = .064), 0.33 in the second year (p = 0.048), 0.30 in the third year (p = 0.079), and 0.50 in the fourth year (p = .001), with an overall effect size of 0.32 when averaged across the first 4 years (p = < .001). Similarly, the red designation increased AP/IB test participation with an overall effects size of 0.11 (p = .009) and college credit attainment with an overall effect size of 0.23 in the first 4 years (p = 0.032). Across the 4 years, being designated as red for CCI increased A-G completion by 3.8 to 8.3 percentage points, AP/IB participation by 0.4 to 3.1 percentage points, and college credit attainment by 0.6 to 2.7 percentage points. In contrast, we find no significant positive effects of red or orange designations based on graduation performance, CSI designation, or the orange designation based on the CCI on A-G completion, AP/IB participation, or college credit attainment.
Figure 6 explores potential heterogeneities in the effects of low-performance designations on student outcomes by student characteristics (race/ethnicity, economic disadvantage, and English learner status). For simplicity, we only present the overall effects, averaged across the 4 years following the low-performance designation. For the most part, we do not find striking differences in effect sizes across student groups: Like the overall effects, we generally find positive effects of color ratings on student outcomes (especially the red rating and on outcomes for which the school was rated as low performing), and few instances of significant effects of the CSI designation. Given the relatively small proportion of students represented by some of the subgroups and the many significance tests represented by the subgroup analysis, we hesitate to draw too many conclusions on the basis of this analysis. However, it appears that for both red and orange graduation ratings, the students who benefitted the most in terms of increased graduation were White and Black students and students who were not economically disadvantaged. In contrast, improved outcomes on the basis of a CCI red rating tended to be lowest among White and non-economically disadvantaged students.

Overall Effects of Being Below Various Cutoffs on Graduation, by Subgroup
Robustness Checks
Figure E1 in Appendix E of the online Appendix examines the robustness of our results to different bandwidths. In other words, we investigate how our main findings change when we vary the ranges of students/schools included around performance index cutoffs. Again, for simplicity we only present the overall results, averaged across the 4 years following the low-performance designation, rather than year-by-year results. Our main findings mostly remain unchanged with a few exceptions where positive effects of color ratings diminish when we use larger bandwidths. This is perhaps driven by the well-established bias-precision tradeoff in the RDD whereby including observations away from the cutoff will improve the precision of the estimates, yet it will likely introduce bias (Lee & Lemieux, 2010). Appendix F presents the effects estimated using a quadratic polynomial function of the running variable instead of the linear function used in the main results. Once again, our main conclusions remain unchanged for the red color ratings. However, the significant effects of an orange graduation rating on graduation outcomes are no longer significant and are almost precisely zero.
In Appendix G, we provide a falsification exercise where we check the discontinuities in our outcomes of interest at points away from the actual low-performance designation cutoffs (i.e., placebo cutoffs) in cases where we find significant effects of the designation on the outcome of interest. If the discontinuities observed in the main analysis indeed reflect the true effects of being designated as low performing (rather than some idiosyncrasies), one would expect no similar discontinuities at these placebo cutoffs. Out of the 49 discontinuities estimated as placebo cutoffs, only five of them are statistically distinguishable from zero at 5% level or lower, providing evidence that the discontinuities we observe at the actual cutoffs indeed reflect the true effect of the designation itself. In addition, in only a single instance were the estimated effects sizes at the placebo cutoffs larger than the effect size estimated at the actual cutoff.
Potential Mechanisms Explaining the Findings
Why do we find significant benefits of red low-performance ratings on student outcomes while the CSI designation has no significant effect on these outcomes? That red ratings seem to be more influential than CSI designation is an interesting finding because, unlike the CSI label which leads to additional support for designated schools and comes with additional requirements related to school improvement, a red color rating does not carry any direct consequences for low-performing schools. To help understand what is happening in low-performing schools that may contribute to the observed results, we draw on findings from a principal survey and interviews with district administrators.
Both the survey and interviews yielded key findings related to the clarity of the accountability designations in California. Overall, 71% of the California principals in our survey expressed positive views about the clarity of accountability designations. That said, interviews with district administrators revealed contrasting perspectives related to the clarity of the color ratings and CSI designations. For example, interviewed district administrators reported that California’s color rating scheme was helpful in providing a high-level snapshot of school performance. One district administrator explained: It’s the colors that help. [School staff] understand that you don’t want to be red or orange. You want to move towards the blue and green. So that helps in terms of explaining it to teachers, to parents, even for us to explain it to administrators.
In contrast, several district administrators revealed that the method for identifying CSI schools in California, which combines several color ratings into a single performance rating, was difficult for school principals to fully understand and communicate. One administrator commented, “It’s just got a lot of pieces to it, and you’ve really got to kind of delve into it. And so, I guess it’s more challenging to communicate the complexity of it in a more straightforward manner.” Another district administrator noted that principals struggled to learn the CSI identification criteria when they first went into effect, relating, [Initially,] it was very confusing for a lot of people. And even with the technical guide out and they’re going, “Okay, so let’s just look at the colors.” So they were like, “This makes no sense.” I was like, “It’ll start to make sense.”
These differences in the clarity of the color ratings versus CSI designations could help explain the differences in their effects on student outcomes. Color ratings provide unambiguous signals about the areas in which schools are underperforming, allowing principals to identify and communicate improvement strategies connected to the specific outcomes in which they are underperforming.
Our principal survey also revealed that 74% of California principals agree or strongly agree that a low-performance designation creates a sense of urgency for their school to take action. That said, in California, there were considerable differences between the visibility of the color ratings and CSI designations, which could have led to differences in awareness and sense of urgency among other educational stakeholders, including parents. For example, the California Department of Education sent letters to parents/guardians of students about the color ratings of their schools whereas districts in California were not required to notify parents of their schools’ CSI designation under ESSA. This could have led to differences in broader parental and community awareness of the two designations and may have contributed to their differential effects.
In addition, survey data suggest a fairly weak response to the CSI designation in California in terms of implementing certain interventions or providing additional supports. Under prior federal accountability policies, when given choices schools most often opted to implement the “easiest” options to meet requirements which, in large part, required implementing “the kind of stuff schools do all the time with or without grants from Washington” (Cunningham, 2017). The same seems to be true of CSI schools in California. Through a survey, principals were asked to report on the extent to which they focused on 26 different types of strategies or interventions. For only two strategies did principals in CSI schools in California report placing statistically significantly greater focus than principals of non-CSI schools: (a) implementing strategies to improve student attendance; and (b) adding new staff positions (see Table H3 in Appendix H of the online Appendix). In addition, when asked on the survey about 11 different areas in which schools may have received support, the only area in which principals of CSI schools were statistically significantly more likely to report receiving support was in developing or revising the school’s improvement plan (see Table H4 in Appendix H). However, principals of CSI schools in California were more likely to report being monitored by state or regional school improvement coordinators through site visits and telephone conferences. That said, a lower percentage of CSI school principals reported being monitored in California compared to Ohio and Florida (see Table H5 in the Appendix H).
Concluding Remarks
In this study we examine the effects of different designations for low-performing schools under ESSA on students’ graduation and college and career readiness outcomes in California. In particular, we examine two types of low-performance designations that schools can receive in California: (a) color ratings that are designated based on school performance on individual indicators; and (b) CSI designations that combine these color ratings to create a single performance rating. Our focus on graduation and college and career readiness outcomes adds to a very small body of literature that has examined the effects of accountability policies on outcomes other than test-based achievement, and is one of few studies that has focused on the effects of accountability policy since the implementation of ESSA. We find significant positive effects of color ratings—especially the red rating (the lowest performance category in California)—on student outcomes on which the color designation was based. In contrast, we find no significant effect of CSI designations on student outcomes.
These findings should be interpreted within the context of certain study limitations. First, this study took place within the unique policy context of California’s accountability system. California is the only state that uses a “dashboard” system where the primary way of defining school performance is a series of ratings on individual indicators (Erwin & Bloomquist, 2024), deemphasizing the overall summative rating (e.g., CSI designation). Most other states use an overall summative rating that is often measured using an index that combines performance across measures into a single score. As such, the results of this study with respect to CSI designation may not be generalizable to other states, where the CSI designation is determined differently and featured more prominently in the accountability system.
Second, as an RDD study, the findings represent the local average treatment effect, applying to the set of schools closest to a given cutoff. As such, the findings may not apply to schools farther away from the cutoff, which may experience accountability differently than those closest to the cutoff. For example, schools well below a given cutoff with lower performance than those closest to the cutoff may require different types of support and intervention, or may not be motivated by accountability in the same way. Finnigan and Gross (2007), for example, indicate that motivation to improve performance deteriorates if educators have a lower expectation that they can accomplish the goals. If schools farther below the cutoff have a lower expectation that they will be able to get to the cutoff, they may be less motivated to put forth the necessary effort.
Third, we do not have the means to test whether the changes were a result of true improvement in student outcomes that will lead to broader improvements in students’ life outcomes, or whether the observed improvements were more superficial (e.g., through attempts at gaming). Even in the event that some of the observed improvement was superficial, the results remain relevant in determining whether educators and students respond to accountability designations in some way.
Keeping these limitations in mind, we hypothesize that the differences in results between the color ratings and the CSI designation could be driven by differences in the clarity and visibility of these two designations, with color ratings providing clear and widely visible signals to schools regarding the specific areas in which they need improvement. In addition, we posit that the additional supports and resources provided to CSI schools are not sufficiently differentiated from those provided to non-CSI schools, and the loose requirements for implementing interventions result in few meaningful differences between CSI and non-CSI schools in the types of interventions they choose to emphasize, and the supports they receive. One of the key changes made under ESSA was the removal of most of the specific requirements regarding the school improvement process in favor of emphasizing school improvement plans and providing states and districts flexibility to choose their own approach to supporting and implementing interventions in CSI schools. Such flexibility may allow CSI schools to comply with requirements while doing little that they would not have done in the absence of their CSI designation. This is consistent with research under SIG and NCLB waivers, which demonstrated that schools often selected interventions that were perceived to be the easiest, and that the decision to take the easier route led to less improvement, on average, compared with selecting a model that included more stringent requirements.
Our findings have important implications for ESSA accountability systems, which ushered in multi-measure school accountability and gave states more flexibility regarding how to intervene and support low-performing schools. While the new era of accountability promises school evaluations that provide a fuller picture about schools’ contributions to student well-being, the challenge that remains is to present this multi-faceted information to educational stakeholders in a way that is understandable and provides clear explanations regarding why schools are identified as low performing and the areas of performance that contributed most to this designation. Our study provides an interesting contrast between two sets of designations: (a) the color designations, which are easy to understand, explicitly linked with specific areas of needed improvement, and publicly communicated through the state’s dashboard system; and (b) the CSI designation, which is arguably harder to understand, not as clearly linked to specific outcomes of needed improvement, and is less broadly communicated, but comes with some consequences as well as technical assistance and resources (even if they are relatively weak).
Clarity of the communication regarding performance may be particularly important under ESSA, which also allows schools and districts the flexibility to identify the interventions they want to implement and removes many of the most stringent requirements found in prior iterations of federal accountability policy. Under such a system, the onus is on school leaders—with support from district and regional support providers—to wade through school performance data and act strategically in identifying the needed areas for improvement, and implementing appropriate strategies. School performance data that clearly and publicly identifies which area(s) to focus on, such as a red indicator rating, may provide school leaders an obvious target for school improvement activities.
Supplemental Material
sj-docx-1-ero-10.1177_23328584251349186 – Supplemental material for The Effects of School Accountability Ratings in California Under ESSA on Student Graduation and College and Career Readiness
Supplemental material, sj-docx-1-ero-10.1177_23328584251349186 for The Effects of School Accountability Ratings in California Under ESSA on Student Graduation and College and Career Readiness by Drew Atchison, Kerstin Carlson Le Floch, Umut Özek, Justin Luu, Steven Hurlburt and Andrea Boyle in AERA Open
Footnotes
Acknowledgements
The authors would like to acknowledge the many people who helped make this study possible. We thank the state leaders at the California Department of Education who worked with us on this study; the members of the Expert Practitioner Panel who provided input on the study; the staff at NORC at the University of Chicago who supported the study, particularly Cynthia Simko; and the state, district, and school leaders who participated in this study.
Declaration of Conflicting Interests
The authors declared no potential conflicts of interest with respect to the research, authorship, and/or publication of this article.
Funding
The authors disclosed receipt of the following financial support for the research, authorship, and/or publication of this article: This study is funded with research grant R305A200254 from the U.S. Department of Education’s (ED’s) Institute of Education Sciences (IES). The opinions expressed are those of the authors and do not represent the views of IES, ED, or our partner state of California.
Open Practices
Notes
Authors
DREW ATCHISON is a principal researcher at the American Institutes for Research (AIR), 1400 Crystal Dr., Arlington, VA 22202; email:
KERSTIN CARLSON LE FLOCH is a managing researcher at AIR, 1400 Crystal Dr., Arlington, VA 22202; email:
UMUT ÖZEK is a senior economist at RAND, 1200 S Hayes St., Arlington, VA 22202; email:
JUSTIN LUU is a researcher at AIR, 1400 Crystal Dr., Arlington VA 22202; email:
STEVEN HURLBURT is a principal researcher at AIR, 1400 Crystal Dr., Arlington, VA 22202; email:
ANDREA BOYLE is a senior researcher at AIR, 1400 Crystal Dr., Arlington, VA 22202; email:
References
Supplementary Material
Please find the following supplemental material available below.
For Open Access articles published under a Creative Commons License, all supplemental material carries the same license as the article it is associated with.
For non-Open Access articles published, all supplemental material carries a non-exclusive license, and permission requests for re-use of supplemental material or any part of supplemental material shall be sent directly to the copyright owner as specified in the copyright notice associated with the article.