
Abstract
We conceptualize students’ opportunities to learn remotely during the initial school closures associated with the COVID-19 pandemic. We then examine variation in remote instruction using an original statewide survey of teachers in Tennessee, deployed just a few weeks into the closures. Using three-level logistic regression models, we explore potential predictors of regular remote instruction, including prepandemic measures of broadband access, the demographic composition of schools, and measures of district policy responses created from districts’ public COVID-19 plans. We find that teachers in schools serving more economically disadvantaged students and in rural districts are less likely to report regular remote instruction, especially via providing digital resources and holding virtual classes or tutoring. Fewer opportunities for Tennessee’s rural students appear driven in part by lower community access to high-speed broadband, but district policies to distribute technology may partially mitigate this gap in access.
Spring 2020 school closures caused by the COVID-19 pandemic forced K–12 schools to move rapidly to remote instruction. Given differences in available resources across schools and districts to organize instruction and to provide students with technology, remote instruction took different forms. Nationally, only a minority of districts provided teacher-delivered remote instruction (e.g., live online classes) or active monitoring of learning activities following school closures in spring 2020 (Gross & Opalka, 2020; Harris et al., 2020). How districts implemented remote instruction and provided resources to ensure students’ access to that instruction are likely important factors influencing whether schools could mitigate declines in student achievement due to missed instructional time (Dorn et al., 2021; Kogan & Lavertu, 2021; Lewis et al., 2021).
Of course, a precondition for remote learning is access to remote instruction (i.e., schools providing learning activities for students not physically at school and students being able to access those activities). A long literature on students’ opportunities to learn shows that students from historically marginalized backgrounds are systematically provided less access to learning opportunities at school (e.g., Carter & Welner, 2013; Duncan & Murnane, 2011). If students in lower-income families, students in rural communities, students of color, or students with specific learning needs (e.g., students with disabilities, English learners) had systematically lower access to remote instruction—because it was not provided or because families lacked the technology or digital literacy to access it—the COVID-19 school closures would represent an extreme denial of learning opportunities that likely compounded existing inequities.
Reports from parents and educators underscore these concerns about access to remote instruction. In two national surveys of parents conducted in spring 2020, higher-income parents reported greater internet access for their children to complete schoolwork and more frequent contact with teachers during pandemic-related school closures (Carnevale & Fasules, 2021; Vogel et al., 2020). A nationally representative survey of educators conducted around the same time found that school leaders from rural schools or high-poverty schools were twice as likely as suburban school leaders or those in low-poverty schools to select internet, devices, or other technology as major needs (Hamilton et al., 2020). Educator surveys in Tennessee (the site of our study) similarly reported challenges related to technology for remote instruction that varied by geography and school poverty (Patrick & Newsome, 2020).
In this study, we examine differences in teacher-reported remote instruction during school closures in spring 2020 and explore whether “digital divides” in broadband access across communities contribute to unequal opportunities to learn in a remote environment. Focusing on Tennessee, we bring together four sources of data: (1) administrative data capturing school and district characteristics, (2) prepandemic estimates of community-level broadband access, (3) responses to a statewide teacher survey conducted in spring 2020 regarding technological challenges and types of remote instruction, and (4) school district policy responses related to technology needs (i.e., devices and internet access for virtual learning) in spring 2020. We use these data to address the following:
To what degree did prepandemic broadband access predict teacher-reported remote instruction and technology needs during the spring 2020 school closures?
What were districts’ responses to address technology needs, and how did these policy responses moderate the relationship between broadband access and remote instruction?
This study makes two contributions. First, in this extreme case of school closures that pushed many schools to implement technology-reliant instruction, we examine how uneven home broadband access may have impeded students’ opportunities for learning remotely, especially in rural and economically disadvantaged communities. Second, we build on emergent work on how districts and educators responded to the COVID-19 pandemic. Recent national reports have described districts’ public responses to the pandemic (Center for Reinventing Public Education [CRPE], 2021; Gross & Opalka, 2020; Harris et al., 2020) or provided insights into educators’ experiences (Hamilton et al., 2020; Kraft et al., 2020). By bringing together multiple data sources (including open-ended responses from over 10,000 teachers), we can provide a more nuanced understanding of how teachers engaged in remote instruction, the challenges facing educators related to technology needs, and whether district policy responses mitigated these issues.
We begin by conceptualizing students’ opportunities to learn remotely during the pandemic and reviewing prior research on inputs that may shape remote learning opportunities. Next, we describe the context of the study, the data, measures, and method. We then discuss our findings, and we conclude with a discussion of implications and limitations.
Conceptualizing Students’ Opportunity to Learn Remotely During the COVID-19 Pandemic
Simultaneously a research concept and a policy instrument to promote educational equality, opportunity to learn (OTL) posits that students’ access to instruction or learning activities is an important determinant of student achievement (McDonnell, 1995; Tate, 2001). At the classroom level, OTL research often captures instructional inputs—such as instructional quality, time on task, and exposure to certain subjects/skills—to examine whether these inputs are related to measures of student learning (Elliott, 2015; Kurz, 2011). At a broader school or district policy level, many studies document differences in access to instructional resources associated with better student outcomes, such as more experienced teachers (Cardichon et al., 2020), higher academic tracks (Oakes, 2005), or more advanced courses (Hallett & Venegas, 2011). Across studies, students from low-income families and students of color, especially Black students, have systematically lower access to these instructional resources or learning opportunities (Carter & Welner, 2013; Duncan & Murnane, 2011). Although less research examines opportunity gaps geographically, there is some evidence that students in rural schools, especially those serving low-income communities, are less likely to have access to high-performing teachers or advanced courses (Fowles et al., 2014; Gagnon & Mattingly, 2016).
In this study, we similarly conceptualize students’ OTL remotely during COVID-19 school closures as a function of instructional inputs that may vary by context. As illustrated in our framework in Figure 1, students’ OTL during this time results from an interplay between the modes of instruction their school offers and their family’s access to technology needed to engage with that instruction. Technology access and instructional modes are, in turn, a function of available community resources (e.g., whether broadband is available affects family access) and district policy choices about instructional strategy and technology distribution. In this section, we discuss each component of the framework in more detail.

Conceptual model.
Family Access to Technology
Given that “access may be the prerequisite first step toward effective technology use,” unequal access to technology represents a major hurdle to successfully implementing technology-facilitated learning (Warschauer et al., 2014, p. 47). Prior to the pandemic, integration of technology into schooling had relied heavily on families providing the tools of access. Differences in student access to home computers with broadband by socioeconomic status, race/ethnicity, and geographic context raise questions about whether students have equitable access to opportunities for technology-facilitated learning (Gallup, 2019; Warschauer & Matuchniak, 2010; Wenglinsky, 1998).
Because engaging in virtual classes or video-based learning via mobile or dialup internet services is difficult, we focus on access to fixed high-speed broadband service (i.e., high-speed broadband services delivered to homes through DSL (digital subscriber line), cable, or fiber networks). We conceptualize two main factors determining broadband access: (1) availability of high-speed broadband (i.e., Is there a provider that offers fixed high-speed broadband service for your home?) and (2) subscription with a provider (i.e., Do you have a broadband subscription?).
Broadband availability varies according to location, with population density playing a key role (Reddick et al., 2020); low density raises technology deployment costs and makes the investment less profitable, making it less likely that rural communities have providers offering fixed broadband services. The Federal Communications Commission (FCC) has published annual reports as part of their ongoing commitment to improving broadband availability in rural areas. Their longitudinal data indicates rural Americans’ access to high-speed fixed broadband has increased rapidly, from 47.6% in 2013 to 73.6% in 2017, but gaps in access remain (FCC, 2019). Recent estimates from the American Community Survey (ACS) report 73% of children in rural areas have fixed broadband services at home compared with 85% of suburban children (National Center for Educational Statistics [NCES], 2019). Since 2009, the federal government has invested approximately $47 billion to improve broadband infrastructure in rural areas (U.S. Government Accountability Office, 2020). In Tennessee, state government has invested $60 million in rural broadband infrastructure since 2017 and a recent government report estimated that it would take an additional investment of $150 million to extend broadband availability to all areas in the state (Tennessee Advisory Commission on Intergovernmental Relations [TACIR], 2021).
In areas with greater availability, lacking a broadband subscription is likely due to unaffordability of services and economic constraints of individual families. Longitudinal estimates of broadband subscription illustrate how racial and income-based gaps in fixed broadband connections have persisted despite increased availability. As of 2021, 92% of U.S. adults with incomes more than $75,000 have fixed broadband subscriptions compared with 57% of adults with incomes less than $30,000 (Pew Research Center, 2021). Numerous studies of broadband access conclude that traditionally marginalized groups (e.g., Black, Hispanic, and lower-income households) are more likely to rely on slower, less reliable cellular plans for internet (Pew Research Center, 2021; Reddick et al., 2020). As such, being without a broadband subscription in an area with availability could be considered a marker of poverty that creates social and economic barriers.
Having a computer and broadband at home may also signal digital literacy. National studies estimate that racial/ethnic and socioeconomic gaps in digital literacy are similar to gaps in technology access (Mamedova & Pawlowski, 2018). Families with more technology at home may be better equipped to navigate virtual instruction (i.e., remote instruction that requires technology) offered during school closures. Additionally, parents or guardians without broadband access may have had fewer options to work from home during the pandemic and thus were less available to assist with remote instruction during this time.
Modes of Remote Instruction
When examining students’ experiences with in-person schooling, OTL research has defined and measured numerous instructional inputs such as time on specific academic standards or quality metrics measured by classroom observations (Elliott, 2015). Such nuanced measures are more difficult in the context of the COVID-19 pandemic. The pandemic upended traditional in-person instruction, and the instruction offered during school closures varied widely (Gross & Opalka, 2020; Harris et al., 2020). In their nationwide analysis of 477 school systems, CRPE reported that about one-third of districts had no expectation that teachers provide remote instruction during school closures in spring 2020, while about one-fifth of districts planned to provide synchronous instruction to at least some students (Gross & Opalka, 2020). Instructional plans varied across geographic contexts and districts serving more advantaged students were more likely to report active and personalized instructional activities (Gross & Opalka, 2020; Harris et al., 2020). Unlike these studies, our analysis captures engagement in remote instruction as reported by teachers. We anticipate the types of instruction adopted during pandemic-related school closures likely varied within districts. Furthermore, as illustrated in Figure 1, we posit that technology access in a given school or district may also have influenced the instructional approaches adopted by educators (e.g., districts in rural areas with limited broadband availability may have preemptively decided that virtual instruction would not be possible for most families).
Community Resources and District Capacity
Differences in community and district resources likely contribute to inequities in OTL. Across the United States, school districts vary tremendously in size, student composition, and per pupil revenues available to them (Baker, 2020; Chingos & Blagg, 2017). Differences in school funding across districts may partially explain opportunity gaps by student characteristics (e.g., Adamson & Darling-Hammond, 2012). Financial resources also help explain differences in districts’ capacity to undertake new initiatives or successfully respond to changes in the environment. Yet financial resources to support staffing, materials, and other needs are just one component of district capacity; the human capital (e.g., knowledge) and social capital (e.g., relationships, norms, trust) available to support district efforts are important as well (Spillane & Thompson, 1997).
In spring 2020, educators had to suddenly pivot to remote instruction when buildings closed. Their immediate responses may have largely dependent on available community resources and current district capacity. In particular, districts likely varied in how they had already integrated technology into their “educational infrastructure,” or their established systems to coordinate, support, and improve instruction (Spillane et al., 2019). Prepandemic technology investment likely influenced districts’ material resources (i.e., functional technology on hand that could be deployed to families when buildings closed), human capital (i.e., dedicated technology staff and widespread knowledge about how to use virtual platforms for instruction), and social capital (i.e., established networks and norms for using devices and platforms). Districts already investing in one-to-one initiatives and building district capacity around technology-facilitated learning may have been better positioned to quickly provide students with devices, switch instruction to virtual platforms, and mobilize staff to provide remote instruction using technology. Thus, students’ OTL may have been shaped by prepandemic community resources as well as their district’s capacity to organize accessible remote instruction.
District Policy Choices Around Technology Provision and Instruction
Within the U.S. education system, districts are primarily responsible for organizing instruction and building systems to provide high-quality learning opportunities, while schools deliver instruction and directly support students (Cobb et al., 2018; Peurach et al., 2019; Spillane et al., 2019). In the case of technology, districts can coordinate financial resources to purchase technology and hire and train staff to support its deployment. While these tasks can be undertaken by individual schools, research prior to the pandemic indicates that districts in rural communities may play an important role in mitigating geographic gaps in broadband availability. Gallup’s (2019) nationally representative survey reported that 49% of students in small towns and 46% of students in rural districts responded that they were given their own computer or tablet by their school compared with 40% in suburban districts and 27% in city districts. Similarly, a national report using surveys administered during ACT testing found larger gaps between rural and nonrural students when asking about internet access and devices at home while rural students reported having similar or slightly better access at school than nonrural students (Croft & Moore, 2019). While quality and affordability of broadband in rural communities must be addressed by significant governmental and private investment, these findings highlight how districts could potentially address inequitable access to learning via technology.
In the context of the pandemic, state governments played an important role in determining when school buildings were closed and whether instruction would continue. State government in 48 states ordered that all districts close their school buildings in response to the pandemic (“The coronavirus spring,” 2020). How states provided specific guidelines to districts about school reopening, remote instruction, and technology varied considerably, but states left many instructional decisions up to districts (CRPE, 2021). In a survey of state education chiefs, 60% of the 35 respondents indicated that reopening decisions would be left up to districts (ExcelinEd, 2020). National studies that capture district responses emphasize that districts varied considerably in their stated policies related to remote instruction and technology provision to students (Gross & Opalka, 2020; Harris et al., 2020). Thus, we anticipate that districts across Tennessee varied in the extent to which they provided technology to students during pandemic-related closure as well as their guidance to schools and teachers about remote instruction.
Context of the Study
In March 2020, COVID-19 began spreading across Tennessee. As of May 2020, Tennessee had an average COVID-19 case rate of about 500 cases per 100,000 people, slightly lower than the national average at the time (Centers for Disease Control and Prevention, 2021). All Tennessee districts closed their school buildings by March 20, 2020, in response to the public health emergency (Gonzales, 2020). The Tennessee Department of Education (TDOE) began publishing guidance and toolkits for districts related to remote instruction. 1 On one of the first of weekly calls with superintendents, TDOE laid out its instructional expectation by stating, “a reasonable expectation from the Department is that districts provide students with the opportunity to have additional activities at home. Those are all going to be local level decisions” (TDOE, 2020b). Simultaneously, the Tennessee State Board of Education (TSBE) passed emergency rules about student attendance, testing, grading, and graduation. While TDOE continued to provide guidance and resources, most decisions regarding the nature, type, and duration of remote instruction were left to districts.
In 2020, Tennessee schools served approximately 970,000 students across 1,800 public schools (TDOE, 2020a). Tennessee districts range considerably in size, geographic context, and demographic composition. Approximately 75% of Tennessee’s districts are in small towns and rural areas, and these districts serve approximately 45% of all students in the state. In Table 1, we describe the characteristics of all Tennessee districts and how district characteristics vary across geographic contexts.
Descriptive Statistics for Full Sample and by Geographic Context

Note. FCC = Federal Communications Commission; ACS = American Community Survey.
Data, Measures, and Methods
This is a descriptive study meant to document differential access to remote instruction during the spring 2020 school closures and examine how prepandemic broadband access and district policy responses addressing technology needs may explain variation across communities in students’ access to remote instruction. Given our interest in district decision making, we focused on traditional public districts in Tennessee (N = 140). We excluded charter schools, state-run districts, and specialty schools because these schools operate under alternative governance structures. 2
School and District Characteristics
We used publicly available district-level and school-level characteristics as reported by TDOE for the 2018–2019 school year. 3 These characteristics measure the demographic composition of students served by each district (or school), including percent of students who are English learners, Black, Hispanic, White, and economically disadvantaged. 4 We also included school tier (i.e., elementary, middle, high, and K–8/K–12/other) and district size (measured by number of schools). We merged this information with district-level geographic locale codes from the National Center for Education Statistics. 5 We collapsed these codes into city, suburb, town, and rural classifications and further into city/suburb and rural/town for some analyses.
Measures of Prepandemic Broadband Access
We used the two most common measures estimating access to high-speed broadband in the United States (Mack et al., 2019). The first captures county-level estimated broadband availability, that is, the estimated percentage of a county’s population with at least one provider offering fixed high-speed broadband services at their home, as reported by the FCC (2019). The second estimates fixed broadband subscription, or the estimated percentage of people within district boundaries with a computer and broadband internet subscription at home, based on responses from the ACS. Importantly, the ACS measure captures home access to a computer and fixed broadband services (i.e., high-speed internet services that do not rely on a mobile phone). For more information, see Section A of the Supplemental Material available in the online version of the article.
These measures have important limitations. Both measures obscure access issues within geographic units, and neither captures broadband quality or cost (Mack et al., 2019). Because the FCC counts a census block as having availability if at least one person in that block can purchase high-speed broadband, these estimates represent the maximum extent of broadband availability in a community (TACIR, 2021). Due to their sampling approach, the ACS’s estimates of broadband subscription have larger margins of error for less populated areas (U.S. Census Bureau, 2019). Tennessee includes many districts serving counties or towns with small populations, and this limitation creates challenges when using ACS data to capture broadband subscription in rural communities. Also, the population-level estimates from ACS likely underestimate broadband subscription among school-aged children because older Americans consistently report lower rates of broadband subscription (Martin, 2021). 6
These measures capture different aspects of broadband access and, as reported in Table 1, vary across geographic contexts. While the means of both measures are highest in suburban districts and lowest in rural districts, broadband availability exhibits much greater variation across contexts. At the district-level, these measures are only moderately correlated (r = 0.43). To illustrate this relationship, we provide a scatterplot of the two measures by geographic context in the online Supplemental Figure A1. Notably, 36 districts, all rural or town, have estimated broadband subscription rates that are higher than their estimated broadband availability. Since availability is a precondition for broadband subscription, this discrepancy may signal that the ACS overestimates broadband subscription in rural communities. Thus, we chose broadband availability as our preferred access measure in rural communities and small towns.
To illustrate how the broadband measures are distributed across geographic contexts, we present kernel density plots of each measure by context in Figure 2. As shown in Panel A, broadband availability varies much more among rural districts (M = 74.7; SD = 17.1; minimum = 38; maximum = 100) and small-town districts (M = 81.2; SD = 13.8; minimum = 36.7; maximum = 100). In contrast, all city districts (M = 97.3; SD = 2.4; minimum = 93; maximum = 100) and suburb districts (M = 97.4; SD = 1.4; minimum = 93.1; maximum = 100) are clustered at the top of range of broadband availability. For city and suburb districts, much greater variation in broadband subscription exists, as illustrated in Panel B, and this pattern suggests that affordability is a bigger challenge than availability in cities and suburbs. Thus, we chose broadband subscription as our preferred measure for city and suburb districts.

Distribution of broadband access measures by geographic context. Panel A: Broadband availability (FCC) by geographic context. Panel B: Broadband subscription (ACS) by geographic context.
Teacher-Reported Engagement in Remote Instruction
We created measures capturing teachers’ reported engagement in remote instruction during spring 2020 using data from the Tennessee Educator Survey (TES). An annual survey of all public-school educators in Tennessee developed in partnership between TDOE and the Tennessee Education Research Alliance (TERA), TES was already in the field in March 2020 when school buildings closed. TERA and TDOE worked together to create an additional set of questions asking about remote instruction and pandemic-related needs/challenges. These questions were fielded from April 4 to May 1 to all teachers, including those who had previously responded to the TES (see Section B of the online Supplemental Material for the text of relevant questions). Statewide, 40% of teachers responded to the new questions (N = 25,700). This sample includes teachers from every district in the state and 95% of all schools. We compared the survey sample with all traditional public school teachers in Tennessee across teacher, school, and district characteristics. As shown in Supplemental Table A1, elementary teachers and teachers in rural/town districts are slightly overrepresented in this sample.
Using the survey responses, we created binary indicators capturing self-reported regular engagement in three types of remote instruction: (1) physical learning resources (e.g., sending paper learning packets or textbooks home with students), (2) online learning resources (e.g., sending materials, assignments, or resources to students/families via email or learning management software), and (3) virtual classes or tutoring (e.g., synchronous learning opportunities in which the teacher meets with students via video platforms like Zoom or Teams). We distinguish the second and third type of instruction described above as virtual instruction because they require technology (i.e., a device and internet access) to be able to engage.
We also created binary indicators from a question asking teachers to choose the top two supports most helpful to support student learning. We complemented the analysis of closed-ended survey items with data from a related open-ended question, “What additional resources do you need to feel more supported and to better support your students at this time?” responses to which often mentioned technology needs and thus were germane to our analysis. Of the 25,700 teachers who responded to the COVID-19 questions, 10,018 provided substantive responses to the open-ended question.
District Policy Responses
We analyzed publicly available information to better understand how Tennessee districts responded to the pandemic during spring 2020. We focused on district-level responses for three reasons. First, as described in our conceptual framework, we posit that districts are often tasked with organizing technology as it relates to the instruction offered in their schools. Second, in the context of the pandemic, TDOE repeatedly messaged that districts were responsible for deciding how to offer instruction and for creating plans to distribute technology to access virtual instruction during pandemic-related school closures (e.g., see TDOE, 2020b). Finally, we built on other analyses examining pandemic-related policies at the district level using similar data and approaches (CRPE, 2021; Harris et al., 2020).
This analysis focuses on districts’ publicly reported plans related to distributing devices (e.g., laptops, tablets) to students and addressing broadband access issues. We examined district websites and social media pages (primarily Facebook and Twitter) because districts used these channels to communicate information to families after school buildings closed (CRPE, 2021; Gross & Opalka, 2020; Harris et al., 2020). 7 Although districts varied widely in the type and frequency of their public communication, we found some publicly available communication on local COVID-19 policies for 93% of Tennessee districts. 8
We used a directed content analysis approach (Hsieh & Shannon, 2005) that evaluated district communication based on predefined categories developed by the Center on Reinventing Public Education (see Gross & Opalka, 2020). For device distribution, we categorized districts into three categories: (1) none/not mentioned, (2) partial distribution, and (3) distribution to all students. Districts coded as “none/not mentioned” included districts that explicitly stated that they were not going to distribute devices to students and districts that had no information on device distribution. Partial distribution referred to any district plans in which certain students were identified as eligible for device distribution (often based on grade-band or need). Distribution to all students are districts that planned to provide all students with devices. For internet access, we created a binary indicator named Access Option(s) to capture whether districts reported offering community-based access points (e.g., Wi-Fi in school parking lots) or providing students directly with home access (e.g., hotspots to use at home).
Our team of analysts first sought out sources (i.e., district web sites and social media pages) in April and May 2020, participated in several norming meetings to refine the codebook after examining a common sample of five districts, and then split into two pairs to double-code 30 districts each before individually coding the remaining districts. See Section C in the online Supplemental Material for more information on our specific coding framework and approach.
This approach to measuring districts’ pandemic policy responses has important limitations well-covered by Harris et al. (2020) and CRPE (2021). Most important, we cannot distinguish between districts that decided against distributing devices or addressing internet access from those who had plans but did not publicly report these plans. We could not find any public information or resources for 10 of 141 districts (7%). 9 In addition, some districts had public policies related to COVID-19 but did not specifically mention any plans related to device distribution or broadband access options for students; these districts are categorized as “none/not mentioned.” Thus, we may be underestimating the number of districts that had policies in place in spring 2020. Finally, this analysis cannot measure the effectiveness of the implementation of these plans or identify variation across schools within the same district.
Methods
Our analysis is descriptive and associational. To provide background for our analysis, we first explored variation in prepandemic broadband access across district characteristics and geographic context. Next, we examined whether broadband access or other school/district characteristics predict teacher-reported engagement in remote instruction and technology needs during the spring 2020 school closures. We focused first on teachers’ responses to the closed–ended questions asking about remote instruction. As shown in Table A2 (in the online supplementary materials), a considerable amount of the variation in teacher-reported remote instruction can be attributed to differences across districts and schools. 10 Thus, our analysis employed multilevel models to appropriately account for this clustering (Raudenbush & Bryk, 2002). Equation 1 represents these models:


We modeled each measure of regular engagement in remote instruction for teacher i in school s in district d, as a function of a fixed intercept, vectors containing teacher (
We supplemented these results with analysis of teachers’ open-ended responses to the question about needed resources using several natural language processing techniques that allow us to identify patterns in large amounts of text data that would be difficult to code “by hand” (Lucy et al., 2020). After preprocessing the text, we first used a form of computational content analysis in which groupings of words were counted to determine how frequently they appear across all teacher comments. We then used latent Dirichlet allocation (LDA) topic modeling analysis to identify topics in the teacher comments. We assessed the validity of the topics by interpretability, frequency of representation over all the comments, strength of the probability the words are characterized in the grouping, and coherence score of the model. We then read through comments organized within each topic to evaluate its overall coherence and describe the theme of each grouping. See Section D in the online Supplemental Material for additional details.
To address the second research question, we described districts’ publicly reported policy strategies for addressing students’ technology needs in spring 2020 and how these strategies varied across geographic context and district characteristics. We then built on the models described above to examine whether these strategies moderated the relationships between broadband access and engagement. Specifically, we tested whether two district policy approaches (device distribution and hotspot access) interact with the measures of broadband availability and subscription.
Results
Describing Prepandemic Broadband Access
Most Tennesseans have broadband access, but estimated access varies by geographic context and district-level economic disadvantage. As shown in Table 1, 91% of the statewide population has broadband availability (i.e., at least one provider offers fixed high-speed broadband services in their census tract, the FCC measure), and 78% of households have a computer with high-speed broadband subscription (the ACS measure). Broadband access is highest in suburban districts and lowest in rural districts. Across both broadband measures, the patterns in the means (shown in Table 1) and distributions (shown in Figure 2) indicate that the dynamics of broadband access are similar in cities and suburbs but quite different from rural areas and small towns. Thus, we proceed with two sets of analyses: (1) rural and small-town districts and (2) city and suburb districts. We use broadband availability as the primary measure in rural/town districts and broadband subscription as the primary measure in city/suburb districts.
We also explored how these broadband measures related to the demographic composition of districts. When examining correlations among district-level measures (see online Supplemental Table A3), the strongest relationships are between broadband subscription and percent of students who are economically disadvantaged (r = −0.63). Figure 3 illustrates this relationship, and this pattern suggests that districts serving more economically disadvantaged students are less likely to have students whose families already have fixed broadband subscription at home.
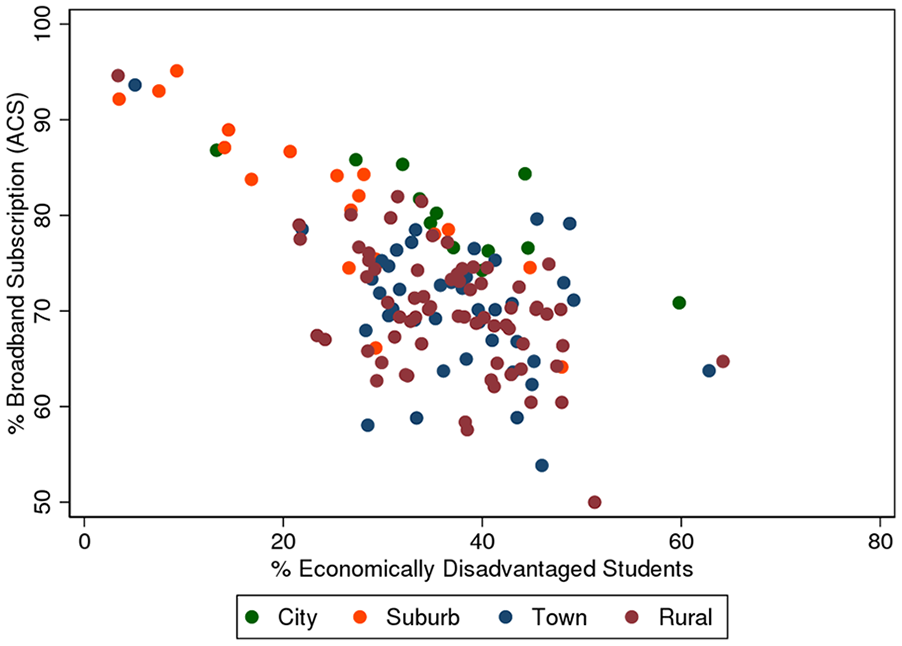
Scatterplot of economic disadvantage and broadband subscription, by geographic context.
Predicting Teacher Engagement in Modes of Remote Instruction
As shown in Table 1, not all teachers report regularly engaging in remote instruction in spring 2020 during school closures. In this statewide sample, 33% of teachers reported regularly sending physical learning resources home with students, 68% of teachers reported regularly sending electronic learning resources via email/learning management systems, and 28% of teachers reported regularly holding synchronous virtual classes or tutoring sessions with students. Engagement varied across geographic contexts, with rural teachers most likely to report regularly sending physical learning resources home and city teachers most likely to report regularly holding virtual classes/tutoring sessions.
Broadband access and economic disadvantage are both associated with regular engagement in remote instruction while the percentage of English learners, Black students, and Hispanic students were not associated with engagement. Table 2 presents results from models predicting regular engagement through sending physical learning resources (Panel A), sending electronic learning resources (Panel B), and holding virtual classes/tutoring sessions (Panel C) in rural/town districts. Table 3 presents the same set of results for city/suburb districts. To ease interpretation of these logistic regression results, we present coefficients as odds ratios and illustrate the most pertinent findings in Figures 4 and 5. 11 We first discuss results related to economic disadvantage that are similar across all geographic contexts and then discuss broadband access separately as the results vary between contexts.
Predicting Regular Engagement in Remote Instruction for Rural/Town Districts

Note. The dependent variable is a binary capturing whether teachers reported regular engagement in each form of remote instruction. All coefficients are shown in odds ratios and standard errors are presented in the parentheses. Percent of White students is omitted because it is correlated with percent of Black students at 0.93. All models estimated using three-level (teachers nested in schools nested in districts) logistic regression models. FCC = Federal Communications Commission.
p < .05. **p < .01. ***p < .001.
Predicting Regular Engagement in Remote Instruction for City/Suburb Districts

Note. The dependent variable is a binary capturing whether teachers reported regular engagement in each form of remote instruction. All coefficients are shown in odds ratios and standard errors are presented in the parentheses. Percent of White students is omitted because it is correlated with percent of Black students at 0.93. All models estimated using three-level (teachers nested in schools nested in districts) logistic regression models. ACS = American Community Survey.
p < .05. **p < .01. ***p < .001.

Predicted probability of regular engagement in remote instruction, by geographic context and economic disadvantage. Panel A: Predicted regular engagement in remote instruction in rural/town districts, by economic disadvantage. Panel B: Predicted regular engagement in remote instruction in city/suburb districts, by economic disadvantage.

Predicted probability of regular engagement in remote instruction, by geographic context and prepandemic broadband access. Panel A: Predicted regular engagement in remote instruction in rural/town districts, by prepandemic broadband availability. Panel B: Predicted regular engagement in remote instruction in city/suburb districts, by prepandemic broadband subscription.
Economic Disadvantage and Remote Instruction
School-level economic disadvantage (i.e., the percentage of students identified as economically disadvantaged) is negatively associated with the likelihood of teachers regularly sending electronic learning resources or holding virtual classes/tutoring in all geographic contexts. As shown by the differences across models (Columns 3–4 and Columns 5–6 in Tables 2 and 3), this negative association does not appear to be mediated by measures of broadband access or subscription. As illustrated in Table 2, a 10 percentage point increase in the economically disadvantaged students served by a school in a rural/town district is associated with a 16% decrease in the odds that teachers reported regularly sending home electronic learning resources and an 18% decrease in the odds that teachers reported regularly holding virtual classes/tutoring sessions, all else equal. These associations are similar in city/suburb districts (see Table 3), with a 10 percentage-point increase in economically disadvantaged students associated with a 13% decrease in the odds that teachers reported regularly sending home electronic learning resources and a 23% decrease in the odds that teachers reported regularly holding virtual classes/tutoring sessions.
Figure 4 illustrates the magnitude of these differences in predicted probabilities across the full range of economic disadvantage for rural/town districts (Panel A) and city/suburb districts (Panel B). With all other covariates held at their means, the predicted likelihood of regularly holding virtual classes/tutoring is 33% for rural/town teachers in schools with the fewest economically disadvantaged students and 13% for rural/town districts in schools with the most economically disadvantaged students. In city/suburb districts, the predicted likelihood of regularly holding virtual classes/tutoring is 48% for teachers in schools with the fewest economically disadvantaged students and 11% for teachers in schools with the most economically disadvantaged students. 12
Broadband Availability and Remote Instruction in Rural/Town Districts
Broadband availability is positively and significantly associated with the likelihood of regular engagement in remote instruction requiring technology in town and rural districts. Panel A of Figure 5 illustrates the magnitude of these differences in predicted probabilities across the full range of broadband availability for rural/town districts. With all other covariates held at their means, the predicted likelihood of regularly sending electronic learning resources is 42% for teachers in rural/town districts with the lowest level of broadband availability and 75% for teachers in rural/town districts with the highest levels of broadband availability. The predicted likelihood of regularly holding virtual classes/tutoring is 9% in rural/town districts with lowest levels of broadband availability and 29% in rural/town districts with the highest levels of broadband availability, all else equal. This suggests that, regardless of an individual student’s access to broadband, students who live in rural areas or small towns with less broadband availability were less likely to have access to virtual instruction during school closures. As shown in Column 2 of Table 2, there is a positive association between broadband availability and the predicted probability of sending physical learning resources home, but it is not significant at conventional levels (p < .05).
Broadband Subscription and Remote Instruction in City/Suburb Districts
In cities and suburbs, broadband subscription is negatively and significantly associated with the likelihood of regularly sending physical learning resources home and holding virtual classes/tutoring, all else equal (see Table 3 and Figure 5). This negative association with regularly sending physical learning resources could indicate that districts opted to send physical learning materials because of low levels of household access to computers and broadband. The negative association between broadband subscription and regularly holding virtual classes/tutoring sessions is unexpected so we further examined descriptive patterns across districts. The negative association appears to be driven by a handful of districts with high estimated broadband subscription in which a relatively low percentage of teachers reported regular engagement (see online Supplemental Figure A2). Overall, the visual patterns shown in Figure A2 suggest little relationship between broadband subscription and regular engagement in the two types of virtual instruction for teachers in city/suburb districts.
Teacher-Reported Technology Needs
Finally, to complement the analyses on remote instruction, we explored patterns in the teacher survey results asking about needs related to remote instruction. As shown in Table 1, more than half of teachers identified better internet access for students and student access to suitable devices as a top support needed for remote learning. While teacher-reported needs for devices were similar across contexts, teacher-reported needs for better internet access were highest in rural areas (where 67% of surveyed teachers identified better internet access for students as a top need) and lowest in suburbs (44%). In their open-ended responses to the question asking about needed resources, teachers often mentioned needs related to technology. In our content analysis of teachers’ responses, we found that 44% of all comments mentioned internet-related words (e.g., “internet,” “online,” “Zoom”) and 35% of all comments mentioned computer-related words (e.g., “computer,” “device,” and “tablet”). We examined how the prevalence of these comments varied across geographic contexts, levels of economic disadvantage, and levels of broadband availability and subscription (see online Supplemental Figure A3). Although at least one third of teachers across all contexts included internet-related words in their responses, over half of teachers in rural districts (53%) and in districts with the lowest levels of broadband availability (54%) included internet-related words in their open-ended comments.
District Policy Plans Related to Technology
Starting in March 2020, Tennessee districts had to decide how to provide remote instruction for students after school buildings closed. In our coding of district policy responses, we saw wide variation in districts’ publicly stated COVID-19 plans. Table 4 describes the characteristics of districts with different publicly stated plans related to device distribution and internet access. Of the 140 districts in the analysis, 22 districts had public plans to distribute devices to at least some students (“partial distribution”), and 13 districts had public plans to distribute devices to all students. 13 For internet access, 16 districts had public plans that mentioned community access points (e.g., public Wi-Fi in school parking lots) or distribution of hotspot devices for students to use at home.
District Policy Responses and District Characteristics

Note. All percentages represent column percentages (e.g., of the 96 districts with no plans to distribute devices, 8% were located in cities, 7% were located in suburbs, etc.). FCC = Federal Communications Commission; ACS = American Community Survey.
As illustrated in Table 4, districts with plans to distribute devices to all students were more likely to be located in cities or suburbs, served fewer economically disadvantaged students on average, and had higher prepandemic broadband access. Only 19% of rural/town districts had public plans to distribute devices to some or all students compared with 52% of city/suburb districts. Taken together, these patterns suggest that well-resourced districts or districts in communities with higher prepandemic broadband access were more likely to be able to mobilize quickly to put together device distribution plans in spring 2020. In terms of internet access plans, there were not clear descriptive differences between districts without plans and those with a plan to offer either community-based or in-home hotspots.
Teacher Responses Related to Technology Needs Varied by District Policy Response
To better explore the relationship between district policy responses and teachers’ needs related to remote instruction, we used LDA topic modeling to categorize teachers’ open-ended comments into themes and then examined how those themes varied across districts based on their device distribution plan. Online Supplemental Table A5 describes each topic along with associated words and representative teacher quotes. Most notable for our analysis, Topic 1 focused on the needs related to internet access and devices and Topic 7 focused on connection between family/parent support and using technology for remote instruction. In Figure 6, we contrast how the percentage of teacher comments associated with each topic varies between districts with no public plan to distribute devices and districts with plans to distribute devices to all students. Teachers in districts with no stated device distribution plan were about twice as likely to have written a comment categorized as Topic 1 compared with teachers in districts with plans to distribute devices to all students. The percentages between the two groups of districts were similar across the remaining topics.

Distribution of teacher comments across topics identified by LDA topic analysis, by district policy response on device distribution.
To demonstrate how teachers’ needs varied by context and district policy, Table 5 provides illustrative teacher quotes associated with Topics 1 and 7 from teachers in rural/town districts with no stated device distribution or hotspot plans and teachers in city/suburb districts with plans to distribute devices to all students and plans related to hotspot access. 14 In terms of Topic 1 (access to internet/devices), the challenges and needed resources identified by teachers across contexts varied. For example, many teachers in rural/town districts identified that insufficient infrastructure related to broadband availability made accessing high-speed broadband at home impossible, difficult, or expensive. In contrast, teachers in city/suburb districts with device distribution plans mentioned challenges related to getting devices out to students or students relying on parent’s phones to access the internet. Teacher comments related to Topic 7 (family/parent support and using technology for remote instruction) were more similar across contexts, and teachers noted that many families struggled to use technology or lacked knowledge or resources to support their children with remote instruction. These teacher comments underscore that technology access is only a first step toward effective engagement in remote instruction.
Teachers’ Open-Ended Responses by Dominant Topic, District Geographic Context, and District Policy Response

District Policy Responses Mediated the Relationship Between Broadband Access and Remote Instruction
We examined whether teacher-reported remote instruction varied across districts with different plans for device distribution and hotspot access. As shown in Table 4, teachers were more likely to report regular engagement in virtual classes/tutoring in districts with plans to distribute devices to all students or provide internet access. However, this pattern may exist because well-resourced districts were more likely to have public plans and to quickly organize remote instruction. We also assessed these differences in three-level logistic regression models that include district policy responses (odd columns) and interactions between broadband subscription/access and these policies (even columns), presented in Table 6 for rural/town districts and Table 7 for city/suburb districts. Figure 7 illustrates how the predicted probabilities of regular engagement in each type of remote instruction varies by district policy response for rural/town districts (Panel A) and city/suburb districts (Panel B).
Policy Responses and Regular Engagement in Remote Instruction for Rural/Town Districts

Note. The dependent variable is a binary capturing whether teachers reported regular engagement in each form of remote instruction. All coefficients are shown in odds ratios and standard errors are presented in parentheses. Percent of White students is omitted because it is correlated with percent of Black students at 0.93. All models estimated using three-level (teachers nested in schools nested in districts) logistic regression models. All models include the school/teacher characteristics shown in Table 2. FCC = Federal Communications Commission.
p < .05. **p < .01. ***p < .001.
Policy Responses and Regular Engagement in Remote Instruction for City/Suburb Districts

Note. The dependent variable is a binary capturing whether teachers reported regular engagement in each form of remote instruction. All coefficients are shown in odds ratios and standard errors are presented in parentheses. Percent of White students is omitted because it is correlated with percent of Black students at 0.93. All models estimated using three-level (teachers nested in schools nested in districts) logistic regression models. All models include the school/teacher characteristics shown in Table 3. ACS = American Community Survey.
p < .05. **p < .01. ***p < .001.
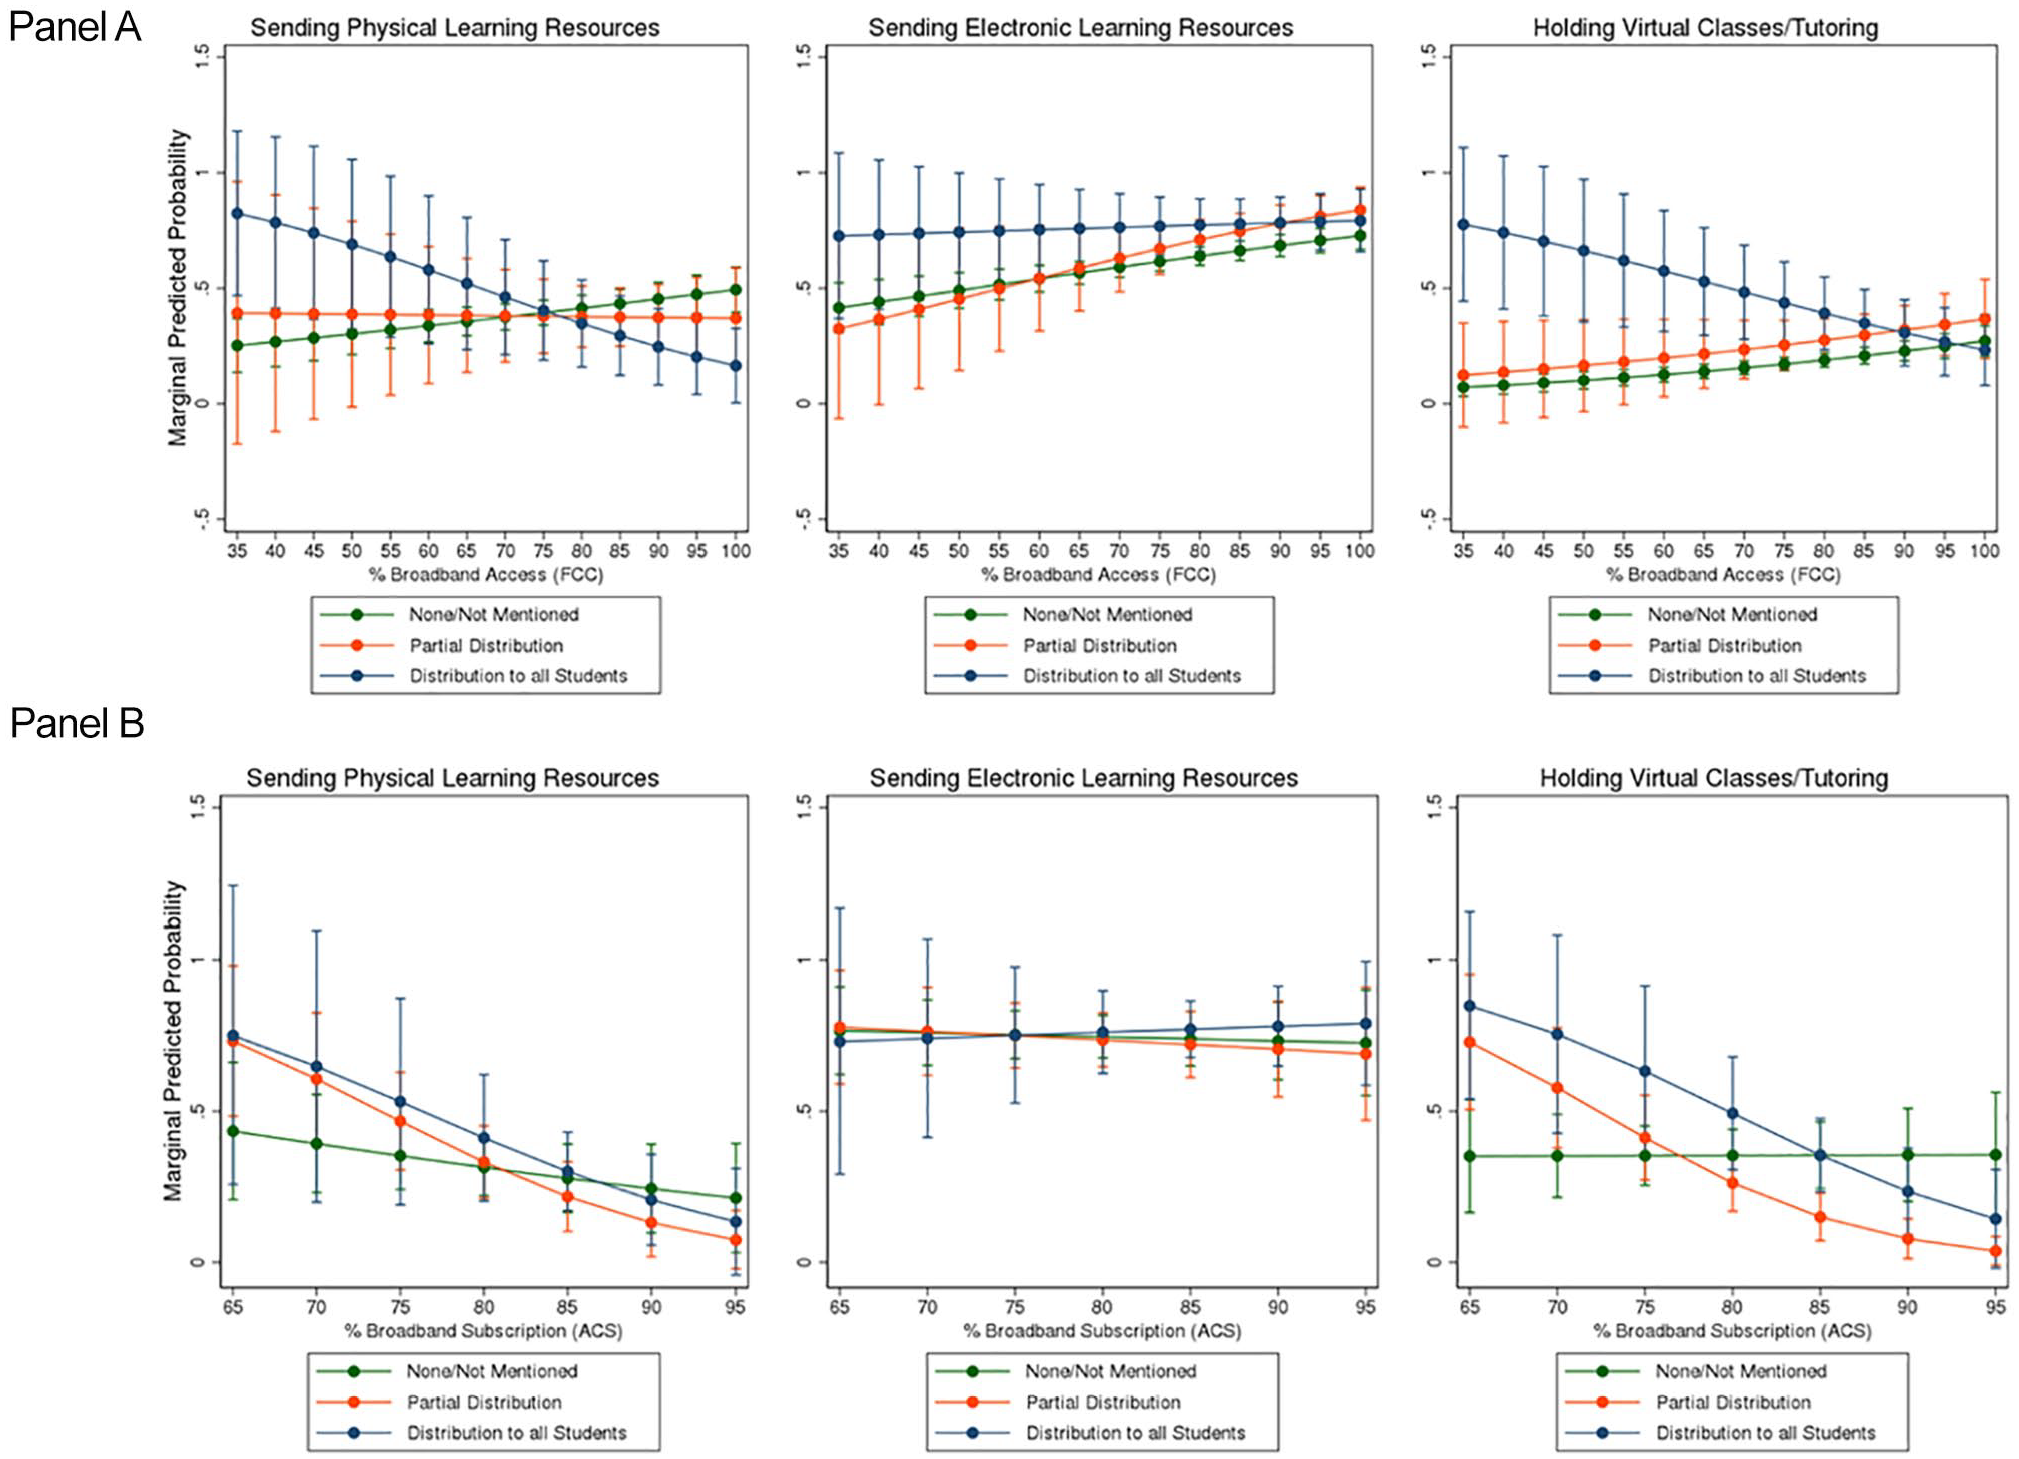
Moderation effect of district policy response on reported regular engagement. Panel A: Predicted regular engagement in remote instruction in rural/town districts, by broadband availability and district policy response. Panel B: Predicted regular engagement in remote instruction in city/suburb districts, by broadband subscription and district policy response.
Given our earlier findings, we focus on examining results related to virtual instruction. In rural/town districts, the odds that a teacher reported regular engagement in virtual classes/tutoring were 2.5 times as large in districts with plans to distribute devices to all students as in districts without any distribution plans, all else equal (see Table 6, Column 5). The significant and negative interaction between device distribution to all students and broadband access in rural/town districts in Column 6 indicates that district plans moderated the relationship between prepandemic broadband availability and regular engagement in virtual classes/tutoring. As shown in Panel A of Figure 7, the probability of regular engagement in virtual classes/tutoring is predicted to increase as prepandemic broadband availability increases for rural/town districts with no device distribution plan or partial distribution, but the pattern is reversed for rural/town districts with plans to distribute devices to all students. Turning to Table 7 and Panel B of Figure 7, patterns for city/suburb districts are similar but less robust. In column 5 (virtual classes/tutoring), the odds ratio for plans to distribute to all students is large and positive though not statistically significant. Column 6 shows some evidence of a moderation effect, with a weaker relationship between broadband subscription and the likelihood of regular virtual classes/tutoring in districts that have either partial or full device distribution plans (the interaction term is only statistically significant for partial distribution districts). The predicted probabilities plotted in Panel B (city/suburb districts) of Figure 7 suggest patterns broadly consistent with those in Panel A (rural/town districts).
Discussion
Amid the economic, social, and health challenges caused by COVID-19 pandemic, educators faced a difficult challenge of pivoting to remote instruction on a massive scale. There is increasing evidence that the pandemic and associated school closures reinforced or deepened existing inequities in public schools. Recent national analyses indicate that students of color, students who are economically disadvantaged, and students with disabilities have had disproportionately larger declines in student performance on achievement tests since the start of the pandemic (Dorn et al., 2021; Kogan & Lavertu, 2021; Lewis et al., 2021). Similarly, studies of absenteeism within districts indicate that chronic absenteeism has increased considerably among English Learners, students of color, and students who are economically disadvantaged (Jordan, 2021; Patrick et al., 2021).
We explore one potential root of these inequities: that students’ opportunities to learn remotely during the closure period systematically differed according to where they live and the demographic composition of their school/district. One contribution of this study is to combine multiple data sources to demonstrate how internet access, which varies across communities, affects the instruction available to students. Students in rural schools and in low-income areas in Tennessee have less access to home broadband, mirroring national trends (e.g., FCC, 2019; NCES, 2019; Pew Research Center, 2021). Concurrently, teacher survey analysis shows that schools with more economically disadvantaged students and in small towns or rural areas were less likely to provide opportunities to learn remotely via virtually delivered learning activities or virtual classes. Our evidence suggests that these two patterns are related. Teachers reported that student access to broadband internet, seemingly a prerequisite for virtual instruction, was a major barrier to remote instruction and appears to have been a key contributor to reduced access to remote learning opportunities in rural areas. We also find that broadband subscription is lower in districts serving more students who are economically disadvantaged, though in our regression models, broadband is not clearly an explanation for economically disadvantaged students’ less regular access to virtual instruction during the spring 2020 school closures.
If creating opportunities for virtual instruction is a goal—including virtual learning beyond pandemic-related school closures or to support in-person instruction—our results suggest the need for investment in widespread broadband access, especially in rural and economically distressed communities to address a key educational challenge of poverty. Fundamentally, opportunities to learn in an online environment require the ability to access those environments. The unexpected shift to remote instruction due to COVID-19 school closures highlighted inadequacies in existing infrastructure to facilitate that access. Our analysis of teacher-reported engagement and district policy responses further underscored equity concerns about students’ opportunities to learn remotely. Teachers were most likely to report regular remote instruction in city/suburb schools with fewer economically disadvantaged students, and districts serving these better-resourced communities were the most likely to have public plans to distribute devices or offer hotspot access during spring 2020 school closures. Compared with national estimates of district responses by Gross and Opalka (2020) and Harris et al. (2020), we found Tennessee districts were much less likely to have public plans that mentioned device distribution or hotspot access. 15 These patterns may speak to districts’ overall capacity to build technology into their educational infrastructure or respond to new challenges (Spillane et al., 2019; Spillane & Thompson, 1997). Two thirds of Tennessee’s districts have fewer than 10 schools (and these districts are almost all in small towns and rural communities), and small districts may struggle to adapt rapidly or build new infrastructure for learning. Additional regional, state, or federal assistance may be necessary to support these districts. 16
Building broadband infrastructure is a long-term project, and significant state and federal government investment will be required (TACIR, 2021). Fortunately, our results suggest that districts may be able to compensate for lack of access in the meantime. An additional contribution of the study is to examine district plans to combat lack of access and connect those plans to student instructional opportunities. We find that districts acted to ameliorate technology challenges via device distribution or provision of hotspots. Teacher-reported engagement in virtual instruction appears somewhat higher in such districts. Moreover, we find some suggestion that technology distribution plans may have moderated the relationship between existing (prepandemic) broadband access and engagement in virtual instruction, especially in rural/town districts. Future research might investigate how districts’ strategies to address technology challenges into the 2020–2021 school year affected students’ opportunities to learn virtually as the pandemic continued to unfold, and whether these strategies affected student outcomes, such as engagement with schooling and achievement.
These results have value beyond the COVID-19 pandemic, as even prior to 2020, technology use in K–12 education has become increasingly common, ranging from fully online schools to the use of technology in traditional in-person classes. The Digital Learning Collaborative (2019) estimates enrollment in fully online K-12 schools is growing by about 6% per year. About 20% of all brick-and-mortar public schools in the United States offered at least one course online by the 2017-2018 academic year, including close to 60% of high schools (NCES, 2019). In a recent national survey, 65% of teachers reported using digital tools every day to teach, and 70% of students reported using digital tools outside of school at least few days a week to complete schoolwork (Gallup, 2019). Moreover, the COVID-19 pandemic likely accelerated the integration of technology into K–12 schooling (Bushweller, 2020; Scully et al., 2021), making OTL issues related to technology and its access increasingly salient.
Our analysis faces several limitations. We focus on one state, and we do not know the degree to which our findings generalize to other contexts. Notably, data limitations prevent us from being able to explore variation within schools. We use population-level estimates of broadband access that likely slightly underestimate broadband subscription of K–12 students because Americans older than 65 years tend to have lower rates of subscription than younger people. Because we do not have family-level data, we cannot measure whether families have adequate devices for all of their children or whether students in low-income families have less computer or broadband access than their high-income peers in the same school, though the patterns we show across schools suggest that they might. More generally, without finer-grained data from individual students or families, we cannot disentangle differences in students’ opportunities to learn remotely for English learners, students with disabilities, and other student subgroups whose experiences and opportunities may not be the same as their peers. We also are limited by the relative coarseness of our measures of remote instruction. More detailed measures of how teachers provided remote learning opportunities would bring additional nuance to our analysis. Finally, our measures of district policy responses tell us only whether there was a plan, not how well that plan was executed, which would be helpful in linking policy responses to engagement in remote instruction.
These limitations suggest several fruitful avenues for future research as additional data becomes available. For example, analyses using student-level data capturing home computer and broadband access, instructional modality and remote learning experiences, and important outcomes such as engagement, attendance, and achievement will be particularly important to further understand whether and how the COVID-19 pandemic has deepened inequities in opportunities to learn. Additionally, student access to school-based supports, such as meals, counseling, or other health/socioemotional supports, were also disrupted by pandemic-related closures of school buildings (Albuquerque & Santos, 2021; Colao et al., 2020). Given the devastating economic, health, and emotional toll of the pandemic, further research could examine students’ access to these supports and policies meant to support students’ health and socioemotional needs.
Technology access is a necessary but not sufficient condition for students to actually learn and thrive in technology-facilitated learning environments (Warschauer et al., 2014). Even prior to the COVID-19 pandemic, schools, teachers, and students increasingly relied on technology to provide learning experiences. The unequal access to broadband and remote instruction in rural and economically distressed communities highlighted in this study underscore the importance of documenting inequities in access but also the need for more research to understand variation in the quality and nature of virtual learning experiences.
Supplemental Material
sj-pdf-1-ero-10.1177_23328584211064298 – Supplemental material for Broadband Access, District Policy, and Student Opportunities for Remote Learning During COVID-19 School Closures
Supplemental material, sj-pdf-1-ero-10.1177_23328584211064298 for Broadband Access, District Policy, and Student Opportunities for Remote Learning During COVID-19 School Closures by Susan Kemper Patrick, Jason A. Grissom, S. Colby Woods and UrLeaka W. Newsome in AERA Open
Footnotes
Acknowledgements
This project was made possible by the Tennessee Education Research Alliance at Vanderbilt University and the Tennessee Department of Education. We also want to thank our colleagues at the Center for Reinventing Public Education, especially Alice Opalka, for assistance with the district policy coding.
Notes
Authors
SUSAN KEMPER PATRICK, PhD, is a senior researcher at the Learning Policy Institute and a part-time professorial lecturer at American University. Her research examines inequities in the learning opportunities available to both students and their teachers.
JASON A. GRISSOM, PhD, is Patricia and Rodes Hart Professor of public policy and education at Vanderbilt University’s Peabody College and faculty director of the Tennessee Education Research Alliance. His primary research interests are school and district leadership, educator mobility, and educational equity.
S. COLBY WOODS, MPP, is a senior research specialist at the Tennessee Education Research Alliance, which is a research-practice partnership between Vanderbilt University’s Peabody College and the Tennessee Department of Education. His research focuses on using quantitative and qualitative analysis to inform K–12 policy.
URLEAKA W. NEWSOME, PhD, is an assistant professor of STEM Education and Foundations at Tennessee State University and Program Coordinator of the Secondary School Instruction for Science in the Department of Teaching and Learning. Her research interests include STEM education, multicultural science education, and K–12 engineering education.
References
Supplementary Material
Please find the following supplemental material available below.
For Open Access articles published under a Creative Commons License, all supplemental material carries the same license as the article it is associated with.
For non-Open Access articles published, all supplemental material carries a non-exclusive license, and permission requests for re-use of supplemental material or any part of supplemental material shall be sent directly to the copyright owner as specified in the copyright notice associated with the article.