
Abstract
An analysis of institutional data to understand the outcome of obstacles faced by students from historically disadvantaged backgrounds is important in order to work toward promoting equity and inclusion. We use 10 years of institutional data at a large public research university to investigate the grades earned by students categorized on four demographic characteristics: gender, race/ethnicity, low-income status, and first-generation college student status. We find that on average across all years of study, underrepresented minority (URM) students experience a larger penalty to their mean overall and STEM GPA than even the most disadvantaged non-URM students. Moreover, the URM students with additional disadvantages due to socioeconomic status or first-generation college status were further penalized in their average GPA. These inequitable outcomes point to systemic inequities in higher education for students with historically disadvantaged backgrounds and the need to dismantle institutional inertia to support them.
Keywords
Introduction and Theoretical Framework
While there have been some efforts to provide equitable access and opportunities to students from marginalized demographic groups in colleges and universities, there are still large disparities in enrollment, participation, and attainment of these students in higher education (U.S. Department of Education, 2016). In addition, racial and ethnic minority students who are underrepresented in science, technology, engineering, and math (STEM) fields drop out of their majors at a disproportionately higher rate (Asai, 2020). The consistent socioeconomic, racial, ethnic, and gender disparities point to systemic barriers within academic institutions that lead to these inequities particularly in STEM fields (Griffin, 2019). Since students do not experience college through only one dimension of their social identity, an intersectional perspective is critical to understand these complex issues. While prior research has shown inequities in college courses with regard to one or two dimensions of student identity, for example, race and gender (Van Dusen & Nissen, 2020), intersectional research focusing on several dimensions of student identity is necessary to understand how the intersection of these identities manifests in inequitable outcomes in academia.
Using the lens that inequitable outcomes are a result of inequitable access to resources, inadequate support and inequitable learning environments, we harness institutional data to investigate the outcomes of students from various marginalized demographic groups, who are disadvantaged and must overcome obstacles in their pursuit of higher education. In particular, we analyze the overall grade point average (GPA), STEM GPA and college completion rates of students with focus on four aspects of their identity: gender, race/ethnicity, low-income status, and first-generation college student status. The theoretical framework for this study has three main foundations: equity in learning, critical theory, and intersectionality.
Our conceptualization of equity in learning includes three pillars: equitable access and opportunity to learn, equitable and inclusive learning environment and equitable outcome. Thus, equity in learning would require all students to have equitable opportunities and access to resources. It would also require that students have an equitable and inclusive learning environment with appropriate support and mentoring so that they can engage in learning in a meaningful and enjoyable manner. Equitable learning outcome means that students from all demographic groups (e.g., regardless of their race/ethnicity, gender identity, first-generation college status, socioeconomic status, etc.) who have the prerequisites to enroll in courses have comparable learning outcomes. This conceptualization of equitable outcome is consistent with Rodriguez et al.’s (2012) equity of parity model. We note that equitable and inclusive learning environments and equitable outcomes are intricately tied to each other. With regard to this conceptualization of equitable outcome, we do not control for high school GPA since each demographic group should have similar performance to ensure equity via appropriate support in an inclusive environment.
Critical theories of race, gender, and so on. identify historical sources of inequities within society, that is, societal norms that perpetuate obstacles to the success of certain groups of disadvantaged people (Gutiérrez, 2009; Kellner, 2003; Schenkel & Calabrese Barton, 2020; Taylor et al., 2009; Tolbert et al., 2018). The dominant group in a society perpetuates these norms, which are borne out of their interests, and pushes back against support systems that seek to subvert these norms (Crenshaw et al., 1995; Kellner, 2003; Yosso, 2005). A key aspect of these critical theories is to examine the structures in policies and practices that lead to inequity in education instead of blaming disadvantaged individuals for what they lack (Ladson-Billings & Tate, 1995; Rios-Aguilar, 2014; Yosso, 2005). These highly problematic societal norms are founded in the historical oppression of various groups of people, and manifest today in many ways including economic disadvantages, stereotypes about who can succeed in certain disciplines and career paths, and racist and/or sexist barriers to opportunity, including educational advancement. While these norms are, by definition, specific to a particular culture or even country, they are nonetheless pervasive and oppressive and demand attention to rectify these historical wrongs. With this framework in mind, we use the lens that the academic environment in many classes may not be providing the same opportunities for all students in the classroom when investigating performance differences in this context.
Important work has been done in critical race and gender theories in the context of STEM education (Johnson, 2012; Lewis et al., 2009; Schenkel & Calabrese Barton, 2020; Solorzano et al., 2000; Tolbert et al., 2018). Some of these researchers have alerted that STEM environments may not be providing equal support to all students in those fields (Estrada et al., 2018; Green et al., 2019). Some qualitative research studies that use critical theory as a lens have used counter-story narratives and other methods to investigate microaggressions, obstacles faced by women of color in STEM, and the importance of counter spaces in these environments (Johnson et al., 2017; Mutegi et al., 2019; Ong et al., 2018). Other work employing critical theory has focused on creating culturally responsive instruction that centers students from marginalized groups to foster an equitable and inclusive learning environment (Bang & Medin, 2010; Sheth, 2019). Some researchers have argued that in STEM departments, this might include redefining what a promising science student looks like and establishing a learning environment where students from historically marginalized backgrounds feel like they belong (Johnson & Elliott, 2020).
The idea that race, gender, or another demographic characteristic alone cannot fully explain the intricacies of the obstacles that students face is rooted in the framework of intersectionality (Cho et al., 2013; Mitchell et al., 2014; Morton & Parsons, 2018). In particular, the combination of different aspects of an individual’s social identity (e.g., gender, race, first-generation college status, and socioeconomic status) leads to unique levels of disadvantages that cannot be explained by simply adding together the effects of the individual components of their identity (Crenshaw, 1990). For example, according to the framework of intersectionality, in many STEM disciplines where the societal norm expects that students are white men, the experience of a Black woman is not a simple sum of the experiences of being a woman and being Black (Charleston et al., 2014; Morton & Parsons, 2018). Therefore, it is important to investigate multiple student identities using an intersectional framework in order to understand the effects of students’ multiple dimensions of marginalization or disadvantages.
In order to understand the inequities in both STEM and non-STEM course outcomes, here we use an intersectional approach to critical quantitative framework in order to quantify the impact of intersections of student identity (Covarrubias, 2011; Covarrubias & Vélez, 2013; Sablan, 2019). In particular, when combining critical theory with quantitative methodology, it is essential to use data to represent educational outcomes on a large scale to reveal inequities and to identify social or institutional perpetuation of systemic inequities in outcomes (Stage, 2007; Stage & Wells, 2014). In the research presented here, we seek to understand the relationship between four different dimensions of student identity that can lead to obstacles in equitable higher education outcomes: race/ethnicity, gender, low-income status, and first-generation college student status. Since prior studies have investigated different aspects of students’ marginalized identities but these studies usually focus on either one or the intersection of two dimensions of student identity (Britner & Pajares, 2006; Van Dusen & Nissen, 2020), further research is necessary to understand the impact of multiple marginalized identities. This investigation posits that a combination of four marginalized demographic characteristics may be negatively influencing student outcomes particularly in STEM courses at institutions that fail to provide these students with the appropriate support and inclusive environment. For example, students disadvantaged by low-income or first-generation status are likely to experience a lack of resources relative to their more privileged peers (Dika & D’Amico, 2016; Katrevich & Aruguete, 2017; Lam et al., 2005). Women and underrepresented minority (URM) students are susceptible to additional stress and anxiety from sexism, racism as well as stereotype threat (i.e., the fear of confirming stereotypes pertaining to their identity) in an inequitable learning environment which is not experienced by their majority group peers (Astin, 1993; Basile & Lopez, 2015; Bianchini, 2013; Bianchini et al., 2002; Britner & Pajares, 2006; Cheryan et al., 2017; Cross, 1993; Felder et al., 1995; Felder et al., 1998; Green et al., 2019; Hilts et al., 2018; Johnson, 2012; Lewis et al., 2009; Mutegi et al., 2019; Sheth, 2019). In the research presented here, the different mechanisms by which students belonging to each marginalized demographic group can be disadvantaged are as follows:
Race/ethnicity. Students belonging to URM groups face pervasive racism in every walk of their life. Moreover, without an equitable and inclusive learning environment, at a predominantly White institution (PWI) where this study was carried out, they may experience stereotype threat that causes additional anxiety and robs students of their cognitive resources, particularly during high-stakes testing.
Gender. Women face pervasive sexism. Moreover, if learning environments are not equitable and inclusive, societal stereotypes against women succeeding in many STEM disciplines can result in stereotype threat.
Low-income status. Low-income students are more likely to need to work to support themselves, reducing their time and energy available to devote to their studies, in addition to the anxiety due to the financial burden of attending college. These burdens are in addition to other factors that low-income students may be more likely to face, such as attending elementary, middle and high school in low-income neighborhoods with failing infrastructure and resources.
First-generation status. First-generation students may lack the resources such as encouragement, advice, and support that are available more readily to students who are not first-generation. These lack of resources can make first-generation students more susceptible to the stress of the unknown in college and less likely to be able to take advantage of the resources that may otherwise be productive.
All of these mechanisms can produce inequitable outcomes in a noninclusive learning environment wherein students belonging to any combination of these marginalized groups are forced to work against obstacles that their peers do not have. Since students do not experience their college education in relation to only one dimension of their demographic characteristics but rather through intersected relationships of their demographic positions, these intersecting identities lead to differential access to resources and opportunities. Therefore, relying on a single demographic characteristic can obscure important connections in inequities in student achievement. In particular, the framework of intersectionality asserts that for students who belong to more than one of these marginalized demographic groups, complex interactions between these different obstacles can result in compounded disadvantages that are not a simple sum of the individual effects (Charleston et al., 2014; Cho et al., 2013; Crenshaw, 1990; Mitchell et al., 2014; Morton & Parsons, 2018). In order to measure the long-term effects of these systemic disadvantages, we investigate the academic achievement of students belonging to these various demographic groups over the course of their studies at one large public research university in the United States using 10 years of institutional data. By grouping students according to their demographic background, we will be able to investigate how different combinations of obstacles affect student GPAs overall and in STEM courses as well as the rate of college completion.
Research Questions
Our research questions regarding the intersectional relationships between demographic characteristics and academic achievement to investigate whether outcomes are equitable are as follows:
Methodology
Sample
Using the Carnegie classification system, the university at which this study was conducted is a public, high-research doctoral university, with balanced arts and sciences and professional schools, and a large, primarily residential undergraduate population that is full-time and reasonably selective with low transfer-in from other institutions (National Science Board, 2018). Since the transfer-in rate from other institutions is low (approximately 3%), transfer students were not analyzed separately (Integrated Postsecondary Education Data System [IPEDS]).
The university provided for analysis the deidentified institutional data records of students with institutional review board approval. In this study, we examined these records for N = 24,567 undergraduate students enrolled in three colleges within the university: the colleges of Arts and Sciences, Computing and Information, and Engineering. This sample of students includes all of those from 10 cohorts who met several selection criteria, namely that the student had first enrolled at the university in a fall semester from fall 2005 to fall 2014, inclusive, and the institutional data on the student was not missing or unspecified for any of the following measures: gender, race/ethnicity, first-generation college status, and low-income status. This sample of students is 50% female and had the following race/ethnicities: 79% White, 9% Asian, 7% Black, 3% Hispanic, and 2% other or multiracial. Furthermore, this sample is 16% first-generation college students and 21% “low-income” students (to be defined in the following section). We acknowledge that gender is not a binary construct, however, in self-reporting their gender to the university, students were only given the options of “male” or “female.” Therefore, those are the two options in self-reported gender data that we analyzed. There were 39 students who had met all other selection criteria but who had not indicated a gender on the survey. These students were removed from the sample and are not included in the reported sample size or any analyses.
Measures
Demographic Characteristics
Four primary measures are the demographic characteristics mentioned in the previous section, namely, gender, race/ethnicity, first-generation college status, and low-income status. All of these were converted into binary categories intended to distinguish between the most and least privileged students on each measure.
Gender. Gender was reported as a binary category to begin with in the data the university provided (either “male” or “female”), therefore no further steps were required.
First-generation. Students for whom both parents had a highest completed level of education of high school or lower were grouped together as “first-generation” college students and correspondingly students for whom at least one parent had earned a college degree were labeled non-first-generation. Although there are many ways to characterize a first-generation student, the characterization we adopted is consistent with that used by many researchers and the U.S. government (Cataldi et al., 2018).
Low-income. Students whose reported family “adjusted gross income” was at or below 200% of the federal U.S. poverty line were categorized as “low-income,” and those above 200% of the poverty line as non-low-income (Cauthen & Fass, 2007; Jiang et al., 2016). We note that the poverty line income in the United States is so low that very few of those students are likely to enroll at a PWI like ours. Thus, researchers in the past have used higher cut-offs such as 150% or 200% above poverty line (Cauthen & Fass, 2007; Jiang et al., 2016), zipcode data or pell grant information (which we did not have) to determine low-income status.
Underrepresented minority (URM). All students who identified as any race or ethnicity other than White or Asian were grouped together as “underrepresented minority” students, including multiracial students who selected White and/or Asian in addition to another race/ethnicity option. Students who only identified as White and/or Asian students were categorized as non-URM students. We recognize that aggregation of all URM students as one group and White and/or Asian students as one group can be somewhat problematic because the experiences of URM students with different races/ethnicities can be different and the experiences of White and Asian students can also be different. However, prior research suggests that with regard to higher education outcomes, all URM students are in general disadvantaged (Asai, 2020) compared with other students. Moreover, in the Supplemental Appendix (available in the online version of this article), we provide data for Black, Asian, and White students separately. We are unable to disaggregate data for other races/ethnicities included in the URM category because their numbers are very small. Also, as discussed in the results section, we find that the trends are not qualitatively different for Black students compared with the URM students taken together.
Academic performance
Measures of student academic performance were also included in the provided data including the grade points earned by students in each course taken at the university. Grade points are on a 0 to 4 scale with A = 4, B = 3, C = 2, D = 1, F = 0, where the suffixes “+” and “−” add or subtract, respectively, 0.25 grade points (e.g., B = 2.75), with the exception of A+ which is reported as the maximum 4 grade points. The courses were categorized as either STEM or non-STEM courses, with STEM courses being those courses taken from any of the following departments: biological sciences, chemistry, computer science, economics, any engineering department, geology and environmental science, mathematics, neuroscience, physics and astronomy, and statistics. We note that for the purposes of this article, “STEM” does not include the social sciences other than economics, which has been included due to its mathematics-intensive content.
Year of study
Finally, the year in which the students took each course was calculated from the students’ starting term and the term in which the course was taken. Since the sample only includes students who started in fall semesters, each “year” contains courses taken in the fall and subsequent spring semesters, with courses taken over the summer omitted from this analysis. For example, if a student first enrolled in fall 2007, then their “first year” occurred during fall 2007 and spring 2008, their “second year” during fall 2008 and spring 2009, and so on in that fashion. If a student is missing both a fall and spring semester during a given year but subsequently returns to the university, the numbering of those posthiatus years is reduced accordingly. If instead a student is only missing one semester during a given year, no corrections are made to the year numbering. In this study, we consider up through the students’ sixth year of study or the end of their enrollment at the studied institution, whichever comes first.
Analysis
The primary method by which we grouped students in this analysis was by their set of binary demographic categories. This grouping was performed in two different ways. First, use of all four binary categories (gender, first-generation [FG], low-income [LI], URM) resulted in 16 mutually exclusive groups (e.g., “female, FG + URM,” or “male, LI”). Second, use of all categories except gender resulted in eight mutually exclusive categories.
We calculated each student’s yearly (i.e., not cumulative) GPA across courses taken in each year of study from the first to sixth years. In addition, we calculated the student’s yearly STEM GPA, that is, the GPA in STEM courses alone. Then, using the aforementioned grouping schemes, we computed the mean GPA in each demographic group as well as the standard error of the mean separately for each year of study (Freedman et al., 2007). Furthermore, in the case of grouping by gender, we computed the effect size of the gender differences within each demographic group using Cohen’s d, which is typically interpreted using minimum cutoff values for “small” (d = 0.20), “medium” (d = 0.50), and “large” (d = 0.80) effect sizes (Cohen, 1988; Montgomery et al., 2012; Neter et al., 1996).
All analyses were conducted using R (R Core Team, 2019), making use of the package tidyverse (Wickham, 2017) for data manipulation and plotting.
Results
GPA Trends by Demographic Group: “Dinosaur Plots”
In order to answer Research Question 1, we plotted the mean GPA earned by students in each demographic group, including gender as a grouping characteristic (Figure 1). We start with overall GPA, rather than STEM GPA alone, in order to provide context for the results in STEM GPA and identify trends that may or may not be present when viewing STEM grades alone. Groups are ordered from left to right first by the ascending number of selected characteristics and then alphabetically. Mean GPA is plotted separately (i.e., not cumulatively) for each year of study from the first to sixth year. Setting aside the gender differences for a moment, we note that the general GPA trends by demographic group in Figure 1 follow a shape resembling the neck, back, and tail of a sauropod, and so accordingly we refer to the plots in Figure 1 as “dinosaur plots.” This shape is clearest in the plots for the first through fourth years, as the sample size drops significantly in the fifth year as the majority of students graduate.
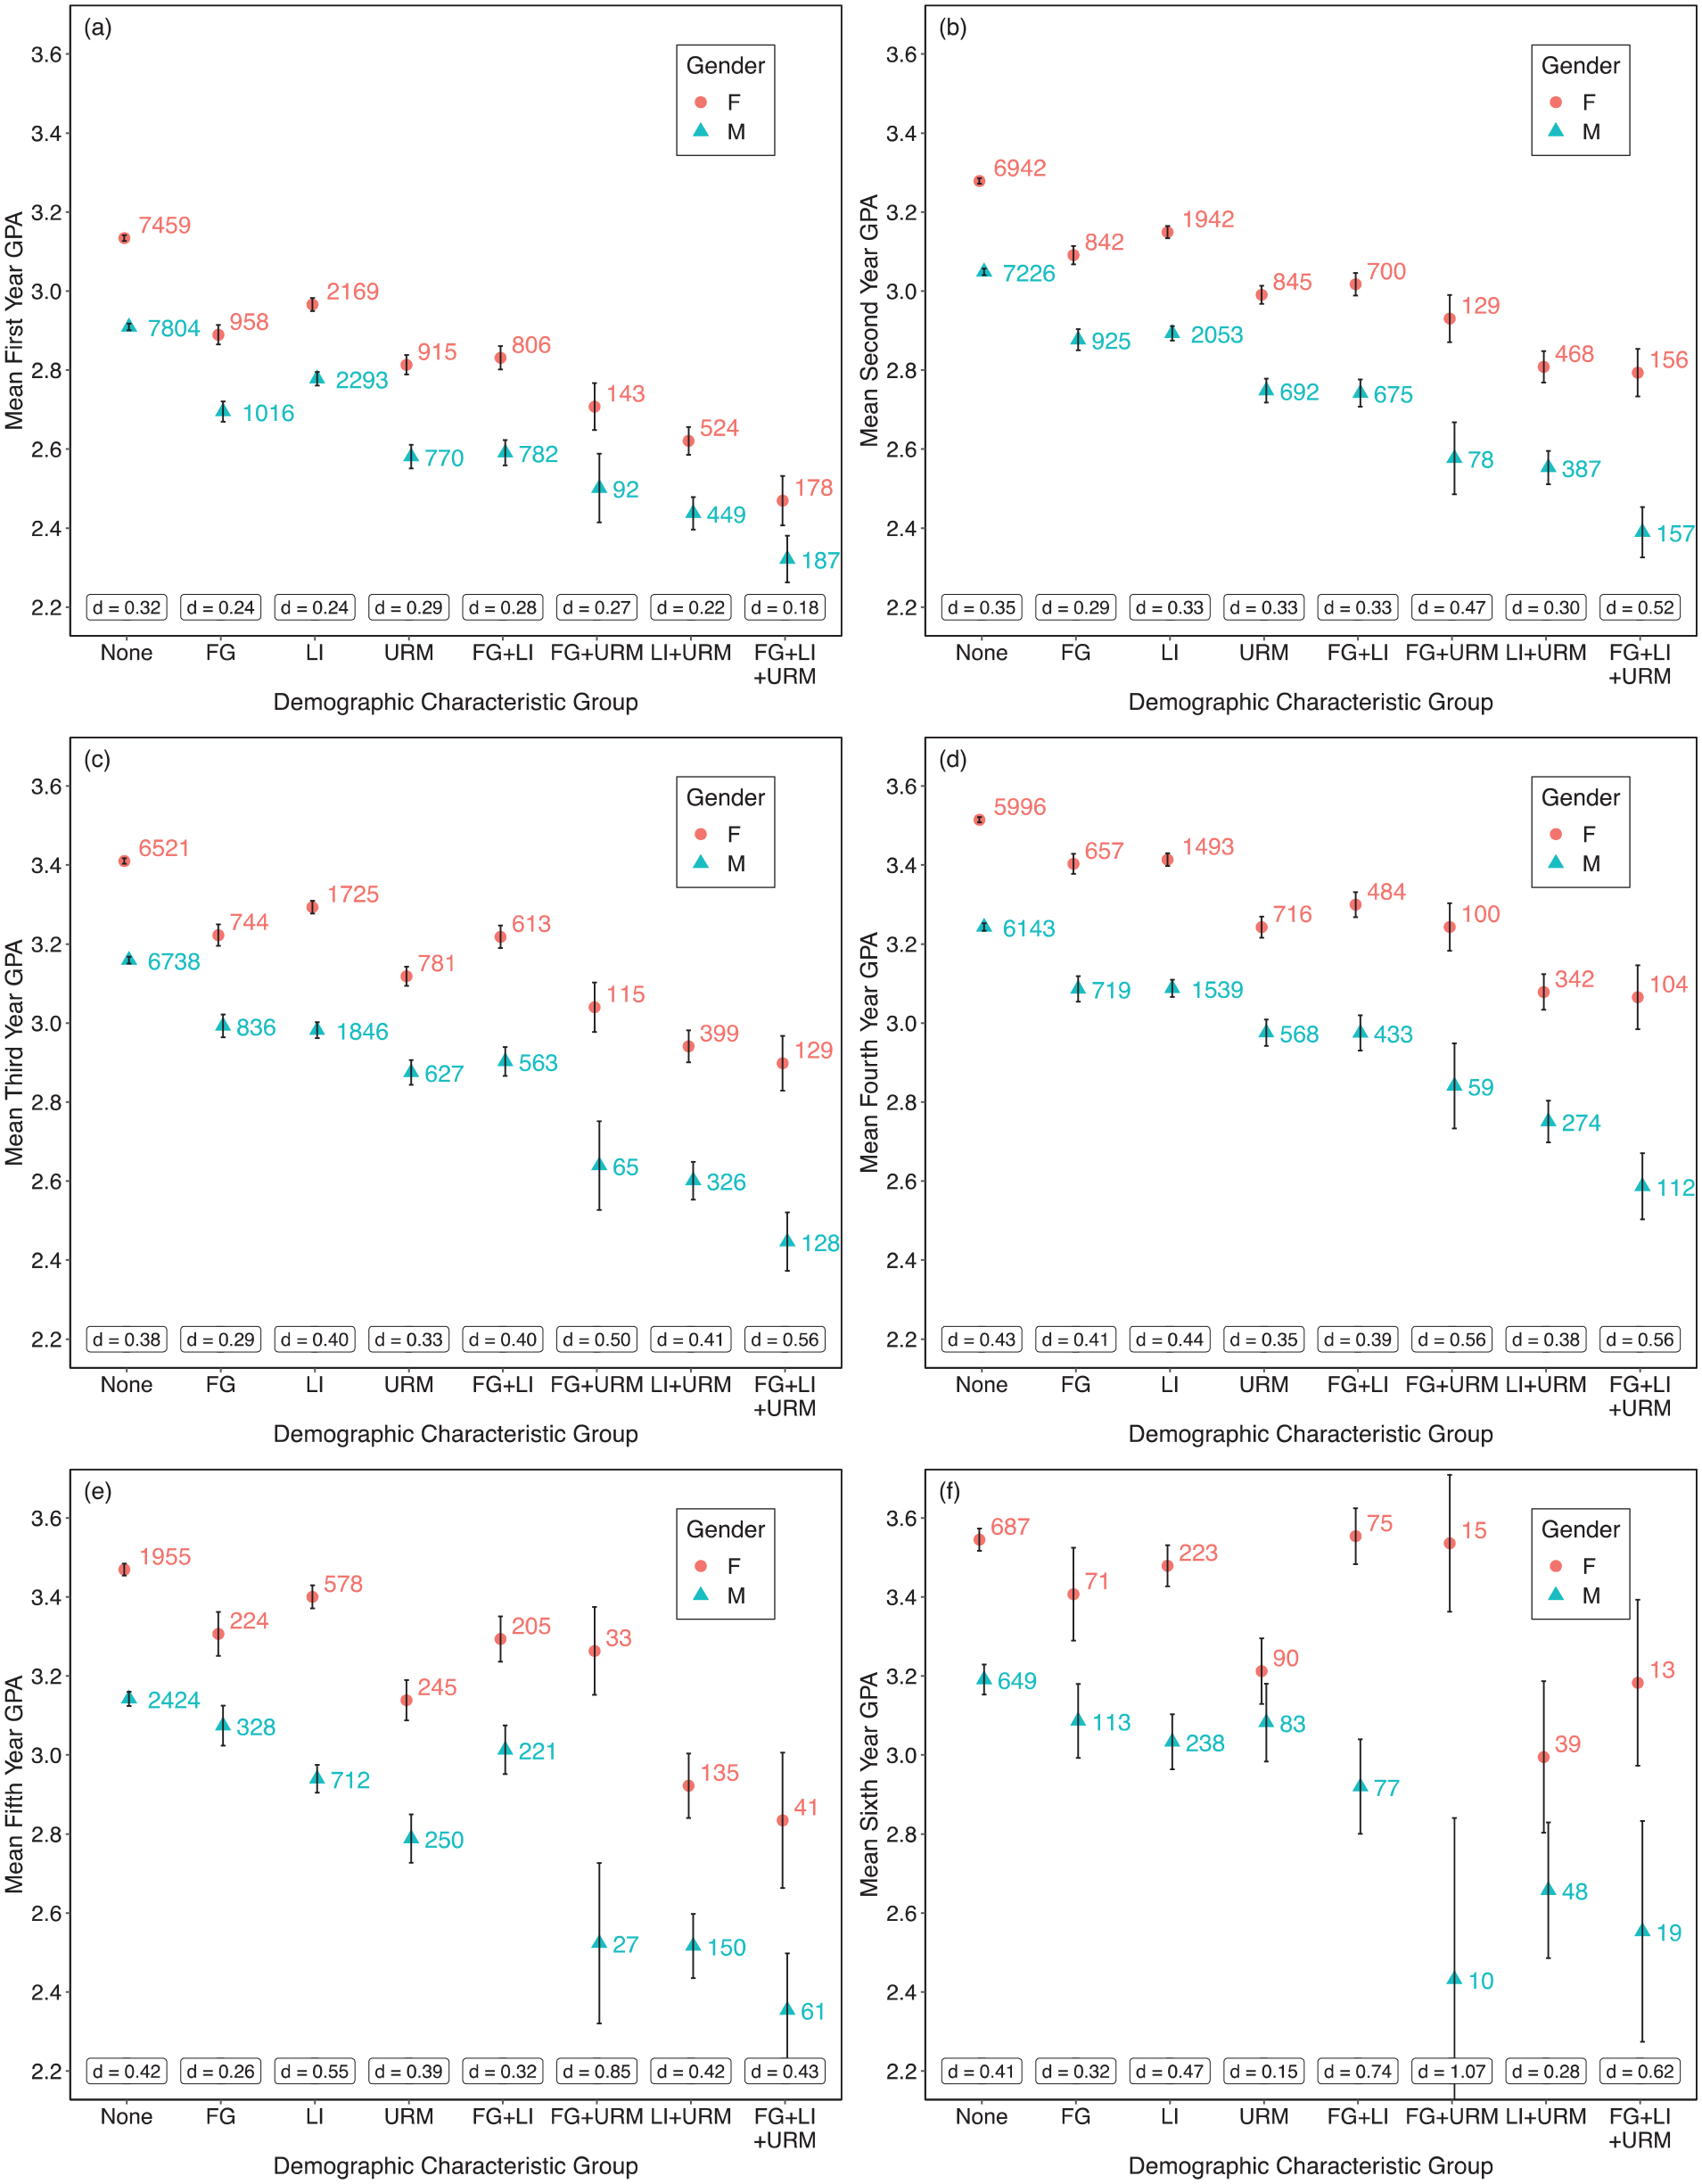
Average GPA of each demographic group.
Looking more closely at Figure 1, particularly the first 4 years, we see that the “neck” is consistently composed of the group of students with the most privileges, namely those students that are non-FG, non-LI, and non-URM. Following this, the “back” is relatively flat across the next four groups, namely students that are FG only, LI only, URM only, or FG and LI. Notably, the URM group of students typically have the lowest mean GPA within this set of demographic groups. Finally, the “tail” consists of the final three groups, FG + URM, LI + URM, and FG + LI + URM. The mean GPA in this set of groups tends to decrease from left to right in the plots. Notably, the four groups that contain URM students are consistently in the lowest four or five mean GPAs. In addition, dinosaur plots are shown for Asian and URM students in the online Supplemental Appendix A, Figure 5 and for White and Black students in the online Supplemental Appendix B, Figure 9, which show similar trends to those shown in Figure 1. We do not show data for other URM students separately because the number of students from those demographic groups is very small at our PWI.
Intersectionality With Gender
We now turn our attention to the differences between men and women in Figure 1 in order to answer Research Question 2. We note in particular that across all demographic groups women’s mean GPA is roughly 0.2 grade points higher than men’s. The effect sizes (Cohen’s d) of this difference range from small to medium (Cohen, 1988). This is similar to the gender differences found for Asian students (online Supplemental Appendix A, Figure A1) and Black Students (online Supplemental Appendix B, Figure B1). However, in the first and second years, women’s GPA is only roughly 0.1 grade points higher than men’s for Asian students (online Supplemental Appendix A, Figure A1). The difference in mean GPA earned by men and women in some of these demographic groups is substantial enough to indicate a change in letter grade, given that the grading system at the studied university uses increments of 0.25 grade points for letter grades containing “+” or “−” Furthermore, this trend holds in the fifth year (Figure 1e) and sixth year (Figure 1f), with some exceptions in demographic groups with particularly low sample sizes after the fourth year.
STEM GPA Trends
In order to answer Research Question 3, Figure 2 plots students’ mean STEM GPA in a similar manner to Figure 1. We note that the general “dinosaur” pattern discussed in Figure 1 also holds at least for the first and second years (Figure 2a and b, respectively). In the third year and beyond, the general features of the trend continue to hold, with the most privileged students having the highest mean GPA, followed by those with one disadvantage as well as the FG and LI group, followed by the remaining groups of URM students with one or more additional disadvantages. However, in these later years, the finer details of the plots noted before fall away in favor of a sharper mean GPA decrease for URM students with at least one additional disadvantage in the third year (Figure 2c) and a more gradual decrease across all groups in the fourth year (Figure 2d) and fifth year (Figure 2e). When restricting the GPA calculations to STEM courses, the sample size becomes too small in the sixth year (Figure 2f) to draw meaningful conclusions.

Average STEM GPA of each demographic group.
We further observe a trend of students earning higher grades on average in later years, although the rise from the first to the fourth year is somewhat lower in STEM GPA than in overall GPA. Notably, while in overall GPA this trend seemed to be somewhat universal across demographic groups, in Figure 2, we see a quicker rise in mean STEM GPA over time for the more privileged students than the less privileged students, particularly comparing the leftmost and rightmost groups.
Regarding gender differences, Figure 2 shows smaller gender differences in STEM GPA than those observed in overall GPA in Figure 1. While in overall GPA women earned roughly 0.2 grade points more than men on average, in STEM GPA that difference is much less consistent and typically ranges from 0 to 0.1 grade points. For many demographic groups, we observe no significant differences between men and women’s mean STEM GPA. We do observe that there is still a consistent STEM GPA gender difference, albeit smaller than in Figure 1, among the group of the most privileged students (i.e., those with “None” of the disadvantages). There is also a STEM GPA gender difference among first-generation low-income but non-URM students, however this difference is less consistent and in fact briefly vanishes in the third year. These trends hold for Asian students (online Supplemental Appendix A, Figure A2) and Black students (online Supplemental Appendix B, Figure B2).
Six Year Graduation Rates
We recognize that the GPA is not the only measure of success in college, and therefore in order to answer Research Question 4, we investigated 6-year graduation rates for students from different demographic groups. Table 1 shows the 6-year graduation rates for students who graduated from the university in our study by demographic groups. The data show reasonably similar 6-year graduation rates for students in each group. In addition, Table 2 shows the IPEDS 6-year graduation rates for students who entered the university in the fall of 2013 for men, women, race/ethnic groups. The IPEDS data show somewhat smaller graduation rates for certain demographic groups of students with lower 6-year graduation rates for Black (78%), and Hispanic/Latino students (76%). The differences in students’ six year graduation rates for different demographic groups are not as pronounced as the differences in GPA. We note that Table 1 only considers students who graduated within 6 years from the same university whereas Table 2 considers all students who enrolled at the university including those who left at any time within the first 6 years.
Six Year Graduation Rates
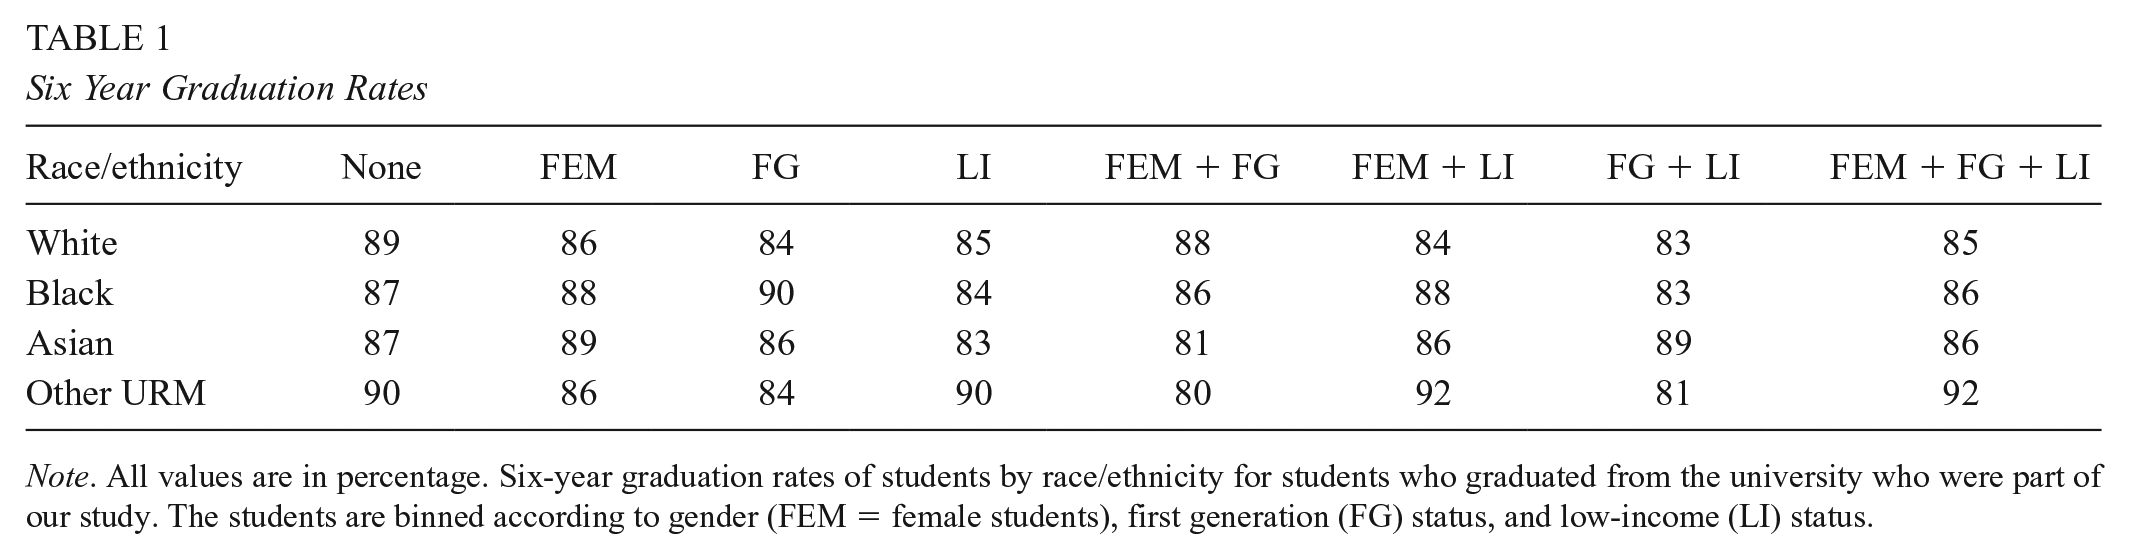
Note. All values are in percentage. Six-year graduation rates of students by race/ethnicity for students who graduated from the university who were part of our study. The students are binned according to gender (FEM = female students), first generation (FG) status, and low-income (LI) status.
IPEDS 6-Year Graduation Rate

Note. Six-year graduation rates of students by gender and race/ethnicity for all students who entered the university in the fall of 2013 according to the Integrated Postsecondary Education Data System (IPEDS).
GPA Trends by Major Over Time
In order to better understand the trends over time in both overall and STEM GPA and answer Research Question 5, we plotted the mean GPA by year in Figure 3 and mean STEM GPA by year in Figure 4. The number of students in each group in Figures 3 and 4 are in the online Supplemental Appendix C. In these plots, we have not separated men and women and instead focus on the other demographic characteristics while further grouping students into three different groups of majors in order to understand if these trends differ for students in different areas of study. Furthermore, since the sample size becomes quite small in Years 5 and 6 for many of the demographic groups of interest, we plot only the mean GPA over the first 4 years. In Figures 3a and 4a, we plot the mean overall and STEM GPA, respectively, of all students. In the other subfigures, we plot the mean GPA earned by students majoring in different clusters of majors. In particular, we plot the mean GPA of engineering (including computer science), mathematics (including statistics), and physical science (i.e., chemistry and physics) majors in Figures 3b and 4b, the remaining STEM majors in Figures 3c and 4c, and non-STEM majors in Figures 3d and 4d.

Mean GPA by major

Mean STEM GPA by major
These plots make clearer some of the trends noted earlier, especially the rise in mean GPA over time from the first to the fourth year. However, we can now see that this is not universally true since the first-generation URM students have a drop in mean GPA in the second year for physical science majors (Figure 3b), and in the third year for other STEM majors (Figure 3c). This trend is even more noticeable in STEM GPA (Figure 4), where the mean STEM GPA of the group of first-generation URM students drops in the third year for every subpopulation by major. These trends hold for Asian students in the online Appendix A, Figures A3 and A4 and for Black students in the online Supplemental Appendix B, Figures B3 and B4. However, it is difficult to draw meaningful conclusion for some groups with a small sample size like first-generation Asian students, first-generation Black students, and first-generation, low-income Black students.
Limitations
Before further discussion, we describe some limitations of the study. One limitation of our study is that we do not control for students’ high school GPA and therefore the differences in GPA cannot be attributed to college specifically. However, our conception of equitable outcome discussed earlier emphasizes that all demographic groups with prerequisites to enroll in a course should have comparable outcomes even with variations in prior knowledge if appropriate support is provided and thus we did not control for high school GPA in this study. In addition, Asian and White students were aggregated together into non-URM and all other non-White and non-Asian students were aggregated together into URM. This grouping does not capture the full complex identity of students in these groups. However, investigating students in these groups is useful to understand how marginalization along a variety of intersecting identities disadvantages students. Also, in the online Supplemental Appendix, we present data for Black, Asian, and White students separately but not for other races/ethnicities since the number of students from those groups is small at our PWI. We find that the outcomes for Black students were qualitatively similar to URM students taken together. The groupings discussed here set the stage for an even more complex discussion of the intersectionality of various demographic characteristics in the future when more data from other races/ethnicities (that we were unable to disaggregate) become available.
Discussion
The findings presented here using an intersectional lens point to systemic inequities in outcomes based on race and ethnicity, gender, first-generation college status and low-income status at a higher education institution in the United States, which is a PWI. For example, we find that the current system severely disadvantages students who are first-generation, low-income and URM students. The findings hint to the need to create inclusive and supportive learning environment and dismantle inequitable structures that disadvantage marginalized students who are already disadvantaged, when they come to college.
A major finding shown in Figures 1 and 2 is that not all of these disadvantages are equal. In particular, non-URM students who have one disadvantage, namely the first-generation status (but not low-income) and low-income status (but not first-generation), earn slightly higher grades than the URM students who are not low-income or first-generation. Notably, this trend (the “back” of the dinosaur plots) is similar in both overall grades (Figure 1) and in STEM grades alone (Figure 2). The size of this mean grade difference varies from year to year, but in STEM grades it can reach as high as about 0.25 grade points, which at the studied institution is the difference between, for example, a B and B+ or B− grade.
The group with the grades most similar to these non-first-generation, non-low-income URM students are the first-generation, low-income non-URM students, who earn both overall (Figure 1) and STEM (Figure 2) grades similar to or very slightly higher than the URM students. One possible reason is that the biases and obstacles due to being first-generation or low-income are not as severe as the obstacles faced by the URM students (many of whom can also easily be identified) in the absence of a supportive structure at a PWI.
Turning then to the “tail” in the dinosaur plots, we find that consistently the most disadvantaged students in both overall grades (Figure 1) and STEM grades (Figure 2) are the URM students with at least one additional obstacle. In this case, it appears that the intersection of being low-income and URM is the most disadvantageous combination, with no notable difference in either Figure 1 or Figure 2 among these students whether they are also first-generation. Meanwhile, the first-generation URM students who are not low-income sometimes have a slightly higher mean GPA than the low-income URM students (Figure 1).
Another avenue to investigate intersectionality is how gender interacts with the other demographic groups. Interestingly, in overall GPA (Figure 1), gender appears to have about the same effect across all demographic groups. That is, there does not appear to be a strong intersectional effect of gender identity with other identities as measured by overall GPA. However, in the online Supplemental Appendix A, Figure A1 shows that the gender gap between Asian women and men is the smallest of all races and ethnicities when considering the overall GPA. Also, Figure 2 shows that this is a context-dependent effect, with the gender gap substantially and unevenly reduced across all groups in mean STEM GPA. For most demographic groups in Figure 2, the higher overall GPA earned by women in Figure 1 has vanished completely in STEM GPA. We recognize that part of the reason that there is a larger gender gap among “all” students than among “STEM” students is that men comprise a higher share of students in STEM than women do, and that STEM grades tend to be lower than all grades (as shown earlier in the figures), so the fact that the gender gap is much smaller among STEM is to be expected. We note that while the gender gap is reduced nearly to zero for most groups in Figure 2, there does remain a small consistent gender gap favoring women in the most privileged group of students. In other groups, the gender gap in Figure 2 is inconsistent across years.
In addition, acknowledging that GPA is not the only measure of success in college, we also investigated 6-year graduation rates for students. For students in our study, we found reasonably similar 6-year graduation rates for students in each group (Table 1). In addition, for students who entered the university in the fall of 2013, there were somewhat lower 6-year graduation rates for Black and Hispanic/Latino students. However, the differences were not as large as GPA differences.
Taking a more temporal view of these GPA trends, Figure 3 (overall GPA) and Figure 4 (STEM GPA) have grouped men and women together in order to focus on the other demographic characteristics more closely. In these plots, the most noteworthy trend is again that, with the sole exception of the first year in Figure 3b, the four groups with the lowest mean GPA (Figure 3) and STEM GPA (Figure 4) across the first 4 years are always the four groups containing URM students. Notably, this trend is true regardless of which group of majors we investigate. The consistency of this result is particularly striking, showing that the most otherwise disadvantaged non-URM students have fewer obstacles to success than even the most privileged URM students among all students. Focusing further on the STEM GPA of STEM majors in Figure 4b and c, we see that while non-URM students consistently rise in mean GPA over time, the same is not true for all URM students. In particular, the first-generation URM students who major in chemistry, computer science, engineering, mathematics, or physics (Figure 4b) experience a steady decline in mean STEM GPA from Year 1 to 2 and Year 2 to 3.
Implications and Conclusion
Based on the frameworks of equitable learning, critical theory, and intersectionality, the main implication of these findings is that there could be structural inequities at the institution so that many students who come from marginalized demographic groups may not be adequately supported in college (Charleston et al., 2014; Cho et al., 2013; Crenshaw, 1990; Crenshaw et al., 1995; Gutiérrez, 2009; Johnson, 2012; Johnson et al., 2017; Kellner, 2003; Mitchell et al., 2014; Morton & Parsons, 2018; Schenkel & Calabrese Barton, 2020; Taylor et al., 2009; Tolbert et al., 2018; Yosso, 2005). The inequities faced by these marginalized students manifest as lower mean overall and STEM GPA for those demographic groups and the outcomes are more inequitable for students with multiple intersecting marginalized identities. Our conception of equitable outcome discussed earlier emphasizes that all demographic groups have comparable outcomes and thus, our findings signify the structural inequities at the institution that are disadvantaging students from marginalized demographic groups. In order to promote equity and inclusion, there is urgent need to dismantle inequitable structures and create an equitable and inclusive learning environment.
In order to create a more equitable and inclusive learning environment, other researchers have pointed to structural changes to implement at the institution and classroom level. Structural changes at the institution-level require centering disadvantaged students in the design of curricula and pedagogies. For example, antiracist and culturally responsive pedagogy that builds on students’ cultural and social capitals (Kishimoto, 2018) can be valuable. Both top-down and bottom-up efforts are required since institutional priorities are necessary to mobilize and incentivize the departments and faculty members into action. However, the departments and faculty members within different disciplines must develop their own ways of implementing culturally responsive pedagogy that centers on students’ assets and actively works to reduce the impact of bias, inequity, and disadvantage to create an environment where students from marginalized backgrounds can excel and be themselves (Johnson & Elliott, 2020). It is crucial that these students are provided appropriate mentoring, guidance, scaffolding, and support in college so that the structural hurdles they encounter can be dismantled and they are not put at a disadvantage relative to their privileged peers (Birt et al., 2019). A large scale study suggests that instructors can improve the learning environment in their courses by adopting culturally responsive pedagogy and providing mentoring and support for students who are underrepresented (Beckford et al., 2020).
It may also be beneficial for instructors to set an equity goal for their classes to explicitly track whether the demographic differences in their courses are going away. If the instructors do not meet their equity goal, they should reflect on what they are not doing that they should be doing and take inspiration from culturally responsive and antiracist pedagogy (Kishimoto, 2018). We note that the mindset of the instructor in a course plays a pivotal role in predicting student achievement. For example, in a study of roughly 150 STEM instructors by Canning et al. (2019), courses taught by instructors with a fixed mindset had twice as large of an achievement gap between students from privileged and less privileged demographic groups as compared to courses taught by instructors with a growth mindset. The instructors with fixed mindset noted that only some of the students will do well in their classes, whereas instructors with growth mindset noted that they are striving to ensure that all of the students in their courses excel. This large scale study clearly shows that only if the instructors themselves have a growth mindset about their students’ potential can they actually improve student outcome as well as come across as trustworthy to their students (students in Canning et al.’s study also noted that instructors with growth mindset inspired them significantly more than those with fixed mindset). Conducting professional development workshops for instructors that focus on inculcating growth mindset and helping them become good mentors as well as helping them view all students as their mentees can be helpful.
Moreover, in order to address the inequities in the learning environment within different courses, sociopsychological classroom interventions, for example, focusing on self-affirmation or sense of belonging may be valuable. For example, these types of interventions have been shown to improve the experiences of women in physics courses (Kelly, 2016). In a values affirmation intervention by Miyake et al. (2010), the gender gap in physics performance was reduced and benefited women. Similarly, interventions that focus on improving student sense of belonging often target the intersubjective space so that students connect with each other in a positive way despite differences in demographics. These interventions have been shown to be effective in boosting URM students’ and women’s grades in science courses (Binning et al., 2020; Harackiewicz et al., 2016; Walton et al., 2015; Yeager & Walton, 2011). In order for these types of interventions to succeed, however, a variety of factors must be considered and carefully implemented and historically disadvantaged students must be kept at the center (Aguilar et al., 2014). Some of the elements that must be considered are that the intervention uses methods that psychologists have found to be long lasting, and they not be framed explicitly as interventions to students but as activities that are part of the course.
We note that the demographic groups with more disadvantages are likely to consist of students who had precollege education from schools with fewer resources and less well-prepared teachers than those of the more privileged students (Bianchini et al., 2003; Bottia et al., 2018; Daley, 2019; Dou et al., 2019; Maltese & Cooper, 2017; Means et al., 2018). Analyses such as those discussed here can help mobilize PWI institutions to take action and inform the allocation of institutional resources to support students. Taking inspiration from prior studies, it can be valuable to create an equitable and inclusive learning environment that takes advantage of student assets using a culturally responsive pedagogy instead of using a deficit view of students (Kishimoto, 2018). In particular, it can help institutions recognize their duty to take action to create an equitable and inclusive learning environment and to encourage the use of pedagogy in which all students have a high sense of belonging and can participate fully without the fear of being judged. Additional resources to support low-income and/or first-generation college students, for example, by providing financial support including scholarships and timely advising pertaining to various academic and cocurricular opportunities are also important in order to level the playing field and work toward a goal of all students excelling in college, regardless of their gender, race/ethnicity, socioeconomic status, and first-generation status.
Supplemental Material
sj-docx-1-ero-10.1177_23328584211059823 – Supplemental material for Not All Disadvantages Are Equal: Racial/Ethnic Minority Students Have Largest Disadvantage Among Demographic Groups in Both STEM and Non-STEM GPA
Supplemental material, sj-docx-1-ero-10.1177_23328584211059823 for Not All Disadvantages Are Equal: Racial/Ethnic Minority Students Have Largest Disadvantage Among Demographic Groups in Both STEM and Non-STEM GPA by Kyle M. Whitcomb, Sonja Cwik and Chandralekha Singh in AERA Open
Footnotes
Acknowledgements
This research is supported by the National Science Foundation Grant DUE-1524575 and the Sloan Foundation Grant G-2018-11183.
Authors
KYLE M. WHITCOMB is a graduate student at the University of Pittsburgh. His research interests include understanding and improving equity in physics courses.
SONJA CWIK is a graduate student at the University of Pittsburgh. Her research interests include understanding and improving diversity and equity in introductory physics courses.
CHANDRALEKHA SINGH is a distinguished professor at the University of Pittsburgh. The goal of her research is to identify sources of student difficulties in learning physics both at the introductory and advanced levels, and to design, implement, and assess curricula/pedagogies that may significantly reduce these difficulties.
References
Supplementary Material
Please find the following supplemental material available below.
For Open Access articles published under a Creative Commons License, all supplemental material carries the same license as the article it is associated with.
For non-Open Access articles published, all supplemental material carries a non-exclusive license, and permission requests for re-use of supplemental material or any part of supplemental material shall be sent directly to the copyright owner as specified in the copyright notice associated with the article.