
Abstract
This study examines disruptions to postsecondary education plans in the United States during the COVID-19 pandemic. Using nationally representative data from the U.S. Census Bureau’s Household Pulse Survey from August 2020 through March 2021, we investigate the prevalence, forms, reasons, and disparities of education disruption across different sociodemographic groups. While nearly three in four households report education plan disruption, the forms and reasons are drastically different. Black and Latinx respondents are more likely to report plan cancellation, while Whites are more likely to report taking classes in different formats. Non-White groups are more likely to cancel plans due to health or financial concerns, while Whites are more likely to cancel plans due to concerns about changes to campus life. Results also reveal nuanced intersections of race, type of education plans, and household vulnerability in affecting education disruption, pointing to the necessity of well-targeted initiatives to address long-term consequences and resulting inequality.
Keywords
The COVID-19 pandemic has led to unprecedented shocks to society and household life, including severe disruptions to the supply and demand of postsecondary education. Lockdowns and social distancing strategies forced higher education institutions to close campuses and transit to online delivery or a hybrid mode of instruction, leading to dramatic changes to learning and campus life (Smalley, 2021). Disruptions caused by the pandemic also led to uncertainties in financial aid programs and work–study opportunities (Smalley, 2021). These changes, along with income declines during the economic downturn, lockdowns, travel restrictions, and other disruptions during the pandemic, have all led to a drastic drop in postsecondary enrollment. According to the National Student Clearinghouse Research Center (NSC Research Center, 2020), postsecondary freshmen enrollment decreased by an unprecedented 13.1% in fall 2020. Most recent data show a 4.2% drop in overall postsecondary enrollment in spring 2021 from a year ago, with community colleges seeing the largest decline at 11.3% (NSC Research Center, 2021).
Disruptions to postsecondary education could lead to unconventional education paths such as delayed enrollment and graduation. These paths not only result in immediate disadvantages but also bring further negative consequences in student performance, completion, and postgraduation socioeconomic achievements (Bozick & DeLuca, 2005; Rowan-Kenyon, 2007; Witteveen & Attewell, 2021). Previous research consistently shows varying likelihoods of unconventional education paths based on socioeconomic status (SES) of students (e.g., Bowen et al., 2009; Goldrick-Rab & Han, 2011; Rowan-Kenyon, 2007; Wells & Lynch, 2012). The social vulnerability literature on impacts of disasters also shows differences in vulnerability and resilience based on race, gender, and class (Bolin & Kurtz, 2018; Enarson, 2012; Peacock et al., 1997). The COVID-19 pandemic, therefore, could result in important disparities in postsecondary education disruptions across sociodemographic groups, which may further contribute to the long-standing systemic inequality.
This study is among the first to examine the disruptions to postsecondary education plans of U.S. household members from August 2020 through March 2021 using data from the U.S. Census Bureau’s Household Pulse Survey (HPS). Leveraging descriptive analyses and multilevel mixed-effects models, we aim to examine the prevalence, forms, reasons, and disparities of education disruptions across sociodemographic groups. In particular, we investigate racial disparities across households with different education plans and in different vulnerable situations during the pandemic. Results reveal varying degrees of disruption at the intersection of race, education plans, and household vulnerability, pointing to the necessity of well-targeted policies and initiatives to support students with disrupted education plans, alleviate the potentially long-term negative impacts, and address the exacerbating inequality during the pandemic.
Disparities and Consequences of Disrupted Postsecondary Education
Disruptions to postsecondary education plans could take different forms: students may delay enrollment, reduce course load, delay graduation, change institutions or programs, or even fail to complete postsecondary education. Studies have shown sociodemographic inequalities for some forms of education disruptions or unconventional education paths. While the so-called “gap year” during which students opt to postpone postsecondary education plans to travel or volunteer is largely a high-SES privilege (Haigler & Nelson, 2005; Heath, 2007), empirical evidence consistently shows that low-SES students are more likely to delay college enrollment after high school graduation than their high-SES counterparts (e.g., Bozick & DeLuca, 2005; Cabrera & La Nasa, 2000; Goldrick-Rab & Han, 2011; Rowan-Kenyon, 2007; Wells & Lynch, 2012). A study using the National Educational Longitudinal Survey of 1988 data shows that 31% of students in the bottom quintile of the socioeconomic distribution delayed college, while only 5% of those in the top quintile did the same (Goldrick-Rab & Han, 2011). Similarly, low-SES students are more likely to delay graduation once enrolled in college (Bowen et al., 2009), while there seem to be relatively small differences across racial and ethnic groups (Witteveen & Attewell, 2021).
Disrupted postsecondary education plans and the resulting unconventional education paths may lead to severe negative consequences. Students who delayed college enrollment are found to be less academically prepared and obtain fewer resources for college compared with those who enroll immediately after high school (Hearn, 1992; Rowan-Kenyon, 2007). Delayed college enrollment also significantly decreases the likelihood of degree completion even after controlling for sociodemographic factors (Bozick & DeLuca, 2005; Roksa & Velez, 2012; Rowan-Kenyon, 2007; Turner et al., 2004). This is in part due to a higher possibility of life course transitional events during college, such as employment, marriage/cohabitation, and parenthood, among those with delayed enrollment (Roksa & Velez, 2012). Delayed graduation or longer time-to-degree, similarly, is associated with increased costs and lower postgraduation earnings (Aina et al., 2018; Witteveen & Attewell, 2021). Needless to say, those who ultimately fail to complete postsecondary education will be losing the well-known college premium (Ashworth & Ransom, 2019; Hout, 2012; Oreopoulos & Petronijevic, 2013), resulting in long term, cumulative disadvantages.
Rational choice models based on cost–benefit analysis are widely used to understand decisions on education investment and plans (Aina et al., 2018; Becker, 1962; DesJardins & Toutkoushian, 2005; Manski, 1989; Wells & Lynch, 2012). Students and their families calculate the benefits relative to the costs of attending college or other education options and make decisions accordingly. Low-SES students are thus disadvantaged not only because they are more sensitive to the costs of higher education (including college tuitions, loans, and forgone incomes) but also because they are more likely to lack necessary information to conduct a well-informed cost–benefit analysis for a “rational” choice (Perna, 2006). For example, low-SES students are less likely to receive adequate college counseling (McDonough, 2005) and information on the college application and financial aid processes (Cabrera & La Nasa, 2000; Fitzgerald, 2004). Other scholars argue that culture could also play a role in shaping decisions on education paths. Students from different family backgrounds may form different dispositions to enroll in postsecondary education immediately or to delay enrollment; in particular, students from families with more cultural capital may regard conventional education paths as an entitlement (McDonough, 1997; Wells & Lynch, 2012). These structural and cultural factors could together contribute to the persistent overrepresentation of low-SES students among those without college degrees or with unconventional education paths such as delayed enrollment and completion.
Disparities in Disaster Vulnerability
Disparities in disaster-induced consequences could expose social and structural inequalities that may otherwise stay undiscovered; therefore, scholars have been using various types of disasters as strategic research sites to examine social processes and inequalities (Arcaya et al., 2020). In particular, social vulnerability, or the susceptibility to loss from a disaster (Blaikie et al., 2014), is at the focus of social science research. Social inequality shapes disparities in consequences of disasters and emergencies through determining differential access to information and resources; demographic characteristics such as race, gender, and SES could all play a role to affect vulnerability (Bolin & Kurtz, 2018; Enarson, 2012; Peacock et al., 1997). Moreover, social vulnerability is intersectional in the way that it combines sociodemographic characteristics with other disadvantaged social conditions, such as social isolation and poor health, to create different levels of risks in front of disasters (Arcaya et al., 2020).
Consistent with previous literature on disparities in disaster vulnerability, most recent evidence shows significant sociodemographic inequality in the consequences of COVID-19. For example, studies find higher risks of severe illness, hospitalization, and death caused by COVID-19 among Black patients than White patients (Abedi et al., 2020; Coughlin et al., 2020; Selden & Berdahl, 2020). White males are less likely to be laid off than women and non-White men during the pandemic (Dias et al., 2020). Non-White groups are also significantly less confident about their household food security than Whites during the pandemic (Morales et al., 2020).
In particular, there is severe inequality in the impact of the pandemic on education. A study using the HPS data estimates that 10.1% of U.S. children lack adequate access to the internet and a computer for online learning; the lack of access varied greatly across racial/ethnic and parental education groups, ranging from 3.8% for children of Asian parents to 15.6% for children of Black parents, and from 3.9% for children of parents with graduate degrees to 20.3% for children of parents with less than high school degrees (Friedman et al., 2021). When it comes to postsecondary education disruptions, according to the most recent data from the NSC Research Center (2021), declines in undergraduate enrollment for Spring 2021 are the smallest among Asian students at 4.8%, while White, Black, and Latinx students experience declines at similar levels at 8.5%, 8.8%, and 7.3%, respectively.
The NSC report, however, is based on enrollment numbers from the perspectives of the institutions, therefore, unable to account for the disruptions from the perspectives of U.S. households; neither does it examine different forms and reasons of education disruption. To fill in the gap and provide a more comprehensive picture of potential systemic inequalities underlying the impacts of the COVID-19 pandemic, the current study aims to examine the prevalence, forms, reasons, and disparities of postsecondary education disruptions among U.S. household members. In particular, we focus on disparities at the intersection of racial groups, different types of education programs, and households in different vulnerable situations during the pandemic.
Data and Methods
Data
This study utilizes the public microdata of the HPS, a new survey conducted by the U.S. Census Bureau in collaboration with multiple federal agencies. Launched in April 2020, the HPS aims to shed light on the social and economic impact of the COVID-19 pandemic. Based on representative samples of U.S. households, the HPS provides a near real-time snapshot of people’s experiences during the pandemic. It includes questions on people’s employment status, food security, physical and mental health, access to unemployment insurance and health care, education disruptions, and so on. Starting from Week 13 (August 19–31, 2020) of the HPS data collection period, new questions regarding postsecondary education disruption were added to the questionnaire. We thus use data from Weeks 13 to Week 27 (March 17–29, 2021), the most recent week with available data when this article was written, to conduct the analyses for this study. 1
The HPS is designed to produce estimates for all 50 U.S. states plus the District of Columbia. For each data collection period from Weeks 13 to 27, independent samples of households were selected, and each sampled household was surveyed once. For disruptions to postsecondary education plans, HPS asked respondents: Before the coronavirus pandemic, how many members of your household, including yourself, were planning to take classes this fall from a college, university, community college, trade school, or other occupational school (such as a cosmetology school or a school of culinary arts)?
We only kept households with at least one household member having such education plans before the pandemic, resulting in 243,746 households across 15 data collection periods. We further remove 3% of cases with missing values in the main outcome variables and covariates, resulting in 235,779 households in the final analytical sample.
Variables
The HPS asks respondents what types of education programs their household members are pursuing. A household can have multiple members with education plans in different types of programs. Based on the answers, we develop four binary variables indicating whether a household has members planning to take classes in occupational training, associate degree, bachelor’s degree, or graduate programs (1 = yes, 0 = no).
To measure disruptions of postsecondary education plans, we first use the HPS question: Thinking of all the members of your household who were planning to take classes from a college, university, community college, trade school, or other occupational school this fall, has the coronavirus pandemic resulted in any of the changes listed below? Select all that apply.
Seven answer options are provided: (1) plans to take classes this fall have not changed, (2) all plans to take classes this fall have been cancelled, (3) classes will be in different formats in the fall (e.g., change from in-person to online), (4) fewer classes will be taken this fall, (5) more classes will be taken this fall, (6) classes will be taken from a different institution; and (7) classes will be taken for a different kind of certificate or degree. Considering that respondents are allowed to choose more than one option, we construct a series of binary variables indicating whether household members have experienced each type of disruption (1 = yes, 0 = no). We first provide descriptive analyses on the proportions and trends of all seven answer options, and then focus on Options 1, 2, 3, 4, and 7 because they are more likely to have negative impacts.
The HPS further asks respondents about reasons for disruption in the following question: “Why did household members’ plans to take classes this fall change? Select all that apply.” Nine answer options are provided: (1) had coronavirus or concerns about getting coronavirus, (2) caring for someone with coronavirus, (3) caring for others whose care arrangements are disrupted (e.g., loss of daycare or adult care programs), (4) institution changed content or format of classes (e.g., from in-person to online), (5) changes to financial aid, (6) changes to campus life, (7) uncertainty about how classes/program might change, (8) not able to pay for classes/educational expenses because of changes to income from the pandemic, and (9) some other reason related to the pandemic. When analyzing the reasons for disruptions, we focus on households with members who have canceled all postsecondary education plans as this is the most serious type of disruption. Based on the answers, we construct a series of binary variables indicating whether members in a household have experienced plan cancellation due to different reasons (1 = yes, 0 = no).
We measure household vulnerability during the pandemic using three binary variables (1 = yes, 0 = no): whether any household member receives benefits from the Supplemental Nutrition Assistance Program (SNAP) or the Food Stamp Program, whether the respondent has no public or private medical insurance, and whether any household member experienced a loss of employment income since March 13, 2020. We categorize respondent race/ethnicity into five groups: Non-Latinx White, Non-Latinx Black, Non-Latinx Asian, Latinx, and Mixed/Other. We further control for the total numbers of adults, children younger than 18 years, and members with postsecondary education plans in the household. For descriptive statistics of all individual-level variables, see Table 1.
Unweighted Descriptive Statistics (N = 235,779)

Note. SNAP = Supplemental Nutrition Assistance Program.
Methods
To examine the disparities in education disruption across sociodemographic groups, we first conduct descriptive analysis to show the proportions and temporal trends of postsecondary education disruption in different forms and for different reasons. We then adopt multilevel mixed-effects logistic regression models with state-level random intercepts effects to predict different forms of education disruption with race, type of education programs, and household vulnerability measures. To further examine the potential intersection of sociodemographic characteristics in impacting levels of disruption, we include interaction terms between race and type of education programs, and between race and household vulnerability measures to predict forms of disruption. Last, to investigate differential patterns of the underlying reasons for disruption across sociodemographic groups, we focus on plan cancellation, the most severe type of disruption, and use multilevel mixed-effects models to predict cancellation due to each reason with race, type of education program, and household vulnerability measures.
Due to the nature of the HPS, all analyses conducted in this study are at the household level. The HPS provides household survey weights to produce estimates for all households in the United States. These weights were constructed to account for nonresponse and state demographics. In addition, the HPS created 80 replicate weights to calculate standard errors of estimates. For weekly descriptive estimates, we use household survey weights and replicate weights following the HPS recommendation. For pooled descriptive estimates across 15 data collection periods, we divide replication weights by 15 to calculate standard errors. We conduct unweighted analyses with multilevel mixed-effects models because state-level design weights are not available and unweighted multilevel models with appropriate control variables tend to result in minimal differences in inferential conclusions when compared with weighted estimates (Carle, 2009; Donnelly & Farina, 2021).
Findings
Descriptive Patterns and Trends of Education Disruptions
To examine the overall patterns of postsecondary education disruption, we first present survey-weighted percentages of different types of disruptions in Table 2. Overall, we observe significant education disruptions among U.S. households during the pandemic: only 26.3% of households with members having postsecondary education plans reported no change to plans, 34.7% reported that all plans were canceled, 36.5% reported that classes were taken in different formats, 11.2% reported taking fewer classes, and 3.6% reported taking classes for a different certificate or degree program. Relatively fewer households reported taking more classes (1.4%) or switching to a different institution (2.6%).
Types of Disruptions to Postsecondary Education Plans by Race

Note. Showing weighted percentages of households with members who have experienced different types of disruptions to postsecondary education plans. Percentages are calculated out of all households with members having postsecondary education plans before the pandemic. Different types of disruptions can coexist for a household. Standard errors for these weighted estimations are very small (at 0.1% level) due to large sample sizes and are omitted from the table.
We also present the survey-weighted trend of disruptions to postsecondary education plans in Figure 1. There are visible temporal changes to certain types of disruptions: households reporting plan cancellation increased steadily from around 32% in Week 13 (August 19–31, near the start of the fall semester) to near 40% in Week 18 (October 28 to November 9, halfway through the semester), remained stable from Weeks 18 to 21 (December 9–21, near the end of the semester), and then started to decline. 2 Correspondingly, households reporting no changes to plans declined slightly from Weeks 13 to 21 and then started to increase. Households reporting taking classes in different formats, on the other hand, decreased steadily across time. The other types of disruptions do not show clear temporal trends across the 15 data collection periods. Overall, the most serious type of disruption—plan cancellation—reached the highest levels from Weeks 18 to 21. For more detailed trends by racial groups, see Supplemental Appendix 1 (available in the online version of this article).

Trend of different types of disruptions to postsecondary education plans.
We next focus on plan cancellation and present weighted percentages of households with members who have canceled plans due to different reasons in Table 3. Among all households with members having postsecondary education plans, a highest percentage reported cancellation due to changes to income during the pandemic (16.0%), followed by cancellation due to contraction of or concerns about coronavirus (15.0%), changes to financial aid (10.2%), uncertainties about classes/programs (9.8%), and changes made by the institutions (8.1%). Relatively lower percentages of households report cancellation of plans due to disruptions to care arrangements (4.3%), changes to campus life (2.8%), or caring for someone else with coronavirus (1.0%).
Reasons for Cancellation of Postsecondary Education Plans by Race
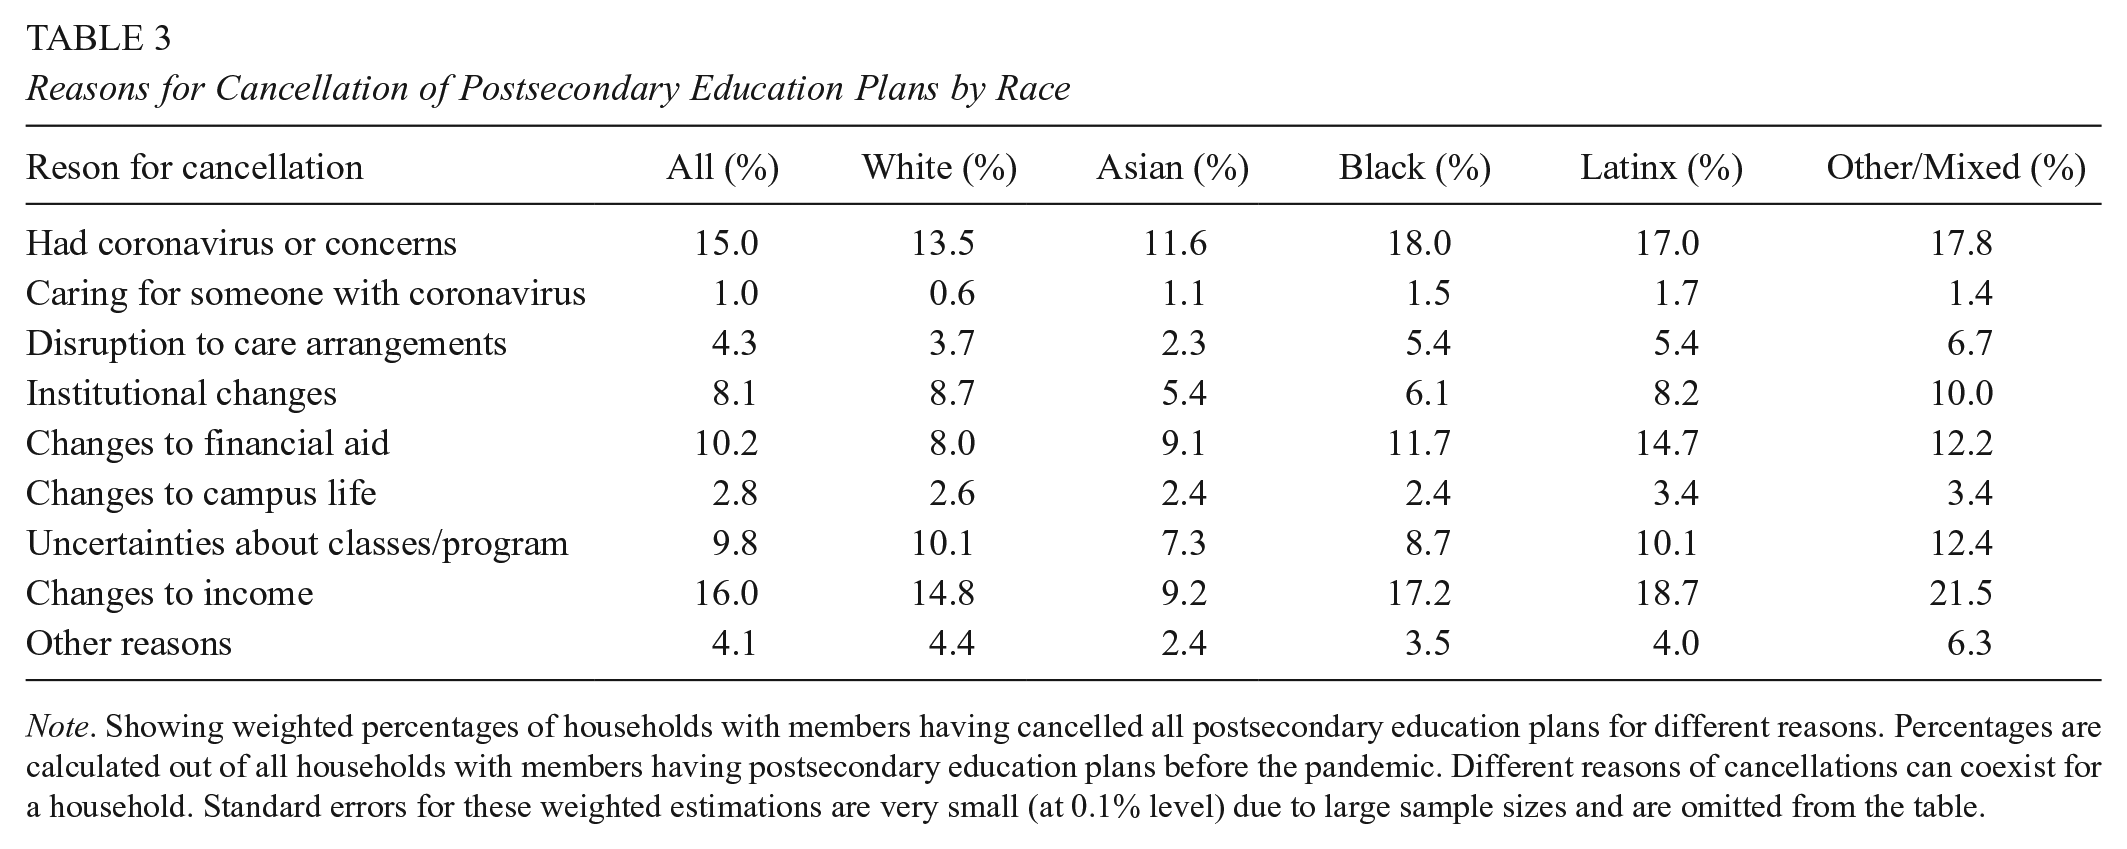
Note. Showing weighted percentages of households with members having cancelled all postsecondary education plans for different reasons. Percentages are calculated out of all households with members having postsecondary education plans before the pandemic. Different reasons of cancellations can coexist for a household. Standard errors for these weighted estimations are very small (at 0.1% level) due to large sample sizes and are omitted from the table.
We also present the temporal trends of these reasons for cancellation in Figure 2. The top two reasons for plan cancellation—changes to income, and contraction of or concerns about coronavirus—had important changes across time, increasing at first and then starting to decrease around Week 21. This is consistent with the surge of coronavirus cases in the United States in the fall and winter of 2020. The next important reasons include changes to financial aid, uncertainty about classes/programs, and changes from institutions; percentages of households reporting these reasons fluctuated slightly across time. The percentages of households reporting other reasons tend to be low (at around 5% or lower) across all periods. For more detailed trends by racial groups, see online Supplemental Appendix 2.

Trends of different reasons for cancelled postsecondary education plans.
Descriptive Racial Differences in Disruptions
To examine racial differences in risks of postsecondary education disruption, we first present survey-weighted percentages of different forms of disruptions by race in Table 2. Across all racial groups, Asian respondents are most likely to report no change to household members’ postsecondary education plans (31.4%), followed by the White (27.6%), Black (25.5%), and Other/Mixed (23.4%) groups; Latinx respondents are least likely to report no change (22.9%). When it comes to classes with different formats, 43.7% of Asians report this kind of change, followed by Whites (39.3%); relatively lower percentages of the Other/Mixed (33.3%), Latinx (32.7%), and Black (29.6%) groups report household members taking classes in different formats. Conversely, we observe high percentages of plan cancellation when respondents are in the Other/Mixed (40.7%), Latinx (38.6%), and Black (38.0%) groups, while White (33.0%) and Asian (23.2%) respondents are less likely to report plan cancellation. Percentages of households reporting taking fewer classes are similar across racial groups, ranging from lowest in the Black group (10.1%) and highest in the Other/Mixed group (12.8%). The percentage of households reporting switching to different certificate/degree programs is the lowest for Whites at 2.5%, and the highest for the Black and Latinx groups (both at 5.1%).
We next focus on those reporting plan cancellation and present the weighted percentages of cancellation due to different reasons across racial groups in Table 3. There are again clear racial differences. Relatively higher percentages of Black (18.0%) and Latinx (17.0%) respondents report cancellation due to contraction of or concerns about coronavirus. The Black, Latinx, and Mixed/Other groups are also more likely to report cancellation due to changes to income, changes to financial aids, caring for someone with coronavirus, and disruption to care arrangements than Whites and Asians. We will discuss in more detail about these racial differences along with results from the multilevel models.
Disparities in Education Disruptions Through Multilevel Models
Observations in Table 2 are consistent with results from baseline multilevel mixed-effects logistic regression models predicting different forms of plan disruptions, which are presented in Table 4. Results are presented in log-odds (LO). To be consistent, in the following discussion, we mainly present LO and sometimes convert LO into odds ratios (OR) for easier interpretation.
Mixed-Effects Models Predicting Disruptions to Postsecondary Education Plans

Note. N = 235,779. Standard errors in parentheses. Multilevel mixed-effects logistic regression models with state-level random intercepts effects. Showing log odds estimation. Each column is a separate model predicting different forms of postsecondary education plan disruption. SNAP = Supplemental Nutrition Assistance Program.
p < .05. **p < .01. ***p < .001.
Results show significantly different patterns of disruption across racial groups. Column 1 shows that Asians are 20% more likely to report no change to household members’ education plans than Whites (LO = 0.18, OR = 1.20), while Latinx respondents are 5% less likely than Whites to report no change (LO = −0.05, OR = 0.95). Column 2 shows that all non-White groups are less likely to report taking classes in different formats as a form of disruption than Whites, while Column 5 shows that all non-White groups are more likely to report switching to a different certificate or degree program than Whites. Column 4 further shows that Black respondents are 10% less likely to report taking fewer classes than Whites (LO = −0.11, OR = 0.90).
Most important, Column 3 shows that the Black (LO = 0.07, OR = 1.07), Latinx (LO = 0.11, OR = 1.12), and Other/Mixed groups (LO = 0.22, OR = 1.25) are 7%, 12%, and 25% more likely than Whites to report plan cancellation, respectively. Conversely, Asians are less likely than Whites (LO = −0.38) to report plan cancellation. It is worth noting that these racial disparities exist after controlling for household size measures, vulnerability measures, and type of program.
We also observe significant differences in the risks of disruption across different types of education plans: those with plans in occupational and associate degree programs are more vulnerable than those with plans in bachelor’s or graduate degree programs. In particular, households with members having plans in occupational programs are 68% more likely to report plan cancellation (LO = 0.52, OR = 1.68) and 42% more likely to switch to a different degree/certificate program (LO = 0.35, OR = 1.42) than households without such plans. Conversely, households with members having plans for bachelor’s degrees are 92% more likely to report no change to plans at all (LO = 0.65; OR = 1.92) and 56% less likely to report plan cancellation (LO = −0.82, OR = 0.44). Similarly, households with members having plans for graduate degrees are 93% more likely to report no change (LO = 0.66, OR = 1.93) and 29% less likely to report plan cancellation (LO = −0.34, OR = 0.71).
Understandably, households with a higher level of vulnerability during the pandemic—that is, households receiving SNAP, lacking health insurance, or having experienced loss of employment income—are less likely to report no change to postsecondary education plans and more likely to report plan cancellation. For example, households receiving SNAP or lacking health insurance are both 28% more likely to report plan cancellation (LO = 0.25, OR = 1.28); households with work loss are 51% more likely to report plan cancellation (LO = 0.41, OR = 1.51).
Interaction Between Race and Type of Program
We next include interaction terms between race and type of program into the models predicting plan disruptions. Results are presented in Table 5. Each panel shows results from a separate set of models with interaction terms between race and different types of programs. We only present the main effects of the type of program and interaction effects in the table. The main effects thus show the effects of having plans for different types of programs on plan disruption among Whites, and the interaction effects show the differences in such effects between Whites and the racial group at focus.
Mixed-Effects Models Predicting Disruption With Interaction Terms Between Race and Program Type

Note. N = 235,779. Standard errors in parentheses. Multilevel logistic regression models with state-level random intercepts effects. Showing log odds estimation. Each panel is a separate set of models with an interaction term between the race and program type (occupational, associate, bachelor’s, graduate) added to the base models shown in Table 4. All control variables are included in the models but omitted from the table. The main effects of race are omitted from the table.
p < .05. **p < .01. ***p < .001.
We observe significantly different patterns of racial disparities across plans for different education programs. For example, White respondents in households with members having plans in occupational programs are more likely to report plan cancellation (LO = 0.58) or switching to a different certificate/degree program (LO = 0.45) than those in households without members having plans in occupational programs. These disadvantages, however, are much smaller for the Black group. Conversely, while White respondents in households with members planning to pursue bachelor’s degrees are more likely to report taking classes in different formats (LO = 1.03) and less likely to report plan cancellation (LO = −0.93) compared with those in households without members having such plans, these effects are significantly smaller among the Black, Latinx, and Other/Mixed groups.
To better interpret the interaction effects, we plot the predicted probabilities of plan cancellation by racial groups and types of education plans in Figure 3 based on results from Column 3 of Table 5. Overall, households with members having plans in occupational programs are most likely to report plan cancellation, and households with members having plans in bachelor’s and graduate programs are less likely to do so. However, even among households with plans in bachelor’s and graduate programs (Panels C and D of Figure 3), the Black, Latinx, and Other/Mixed groups are still much more likely to report plan cancellation than Whites and Asians. Conversely, among households with members having plans in occupational or associate programs, Whites have a similarly high or even higher probability to report plan cancellation than Black and Latinx respondents.
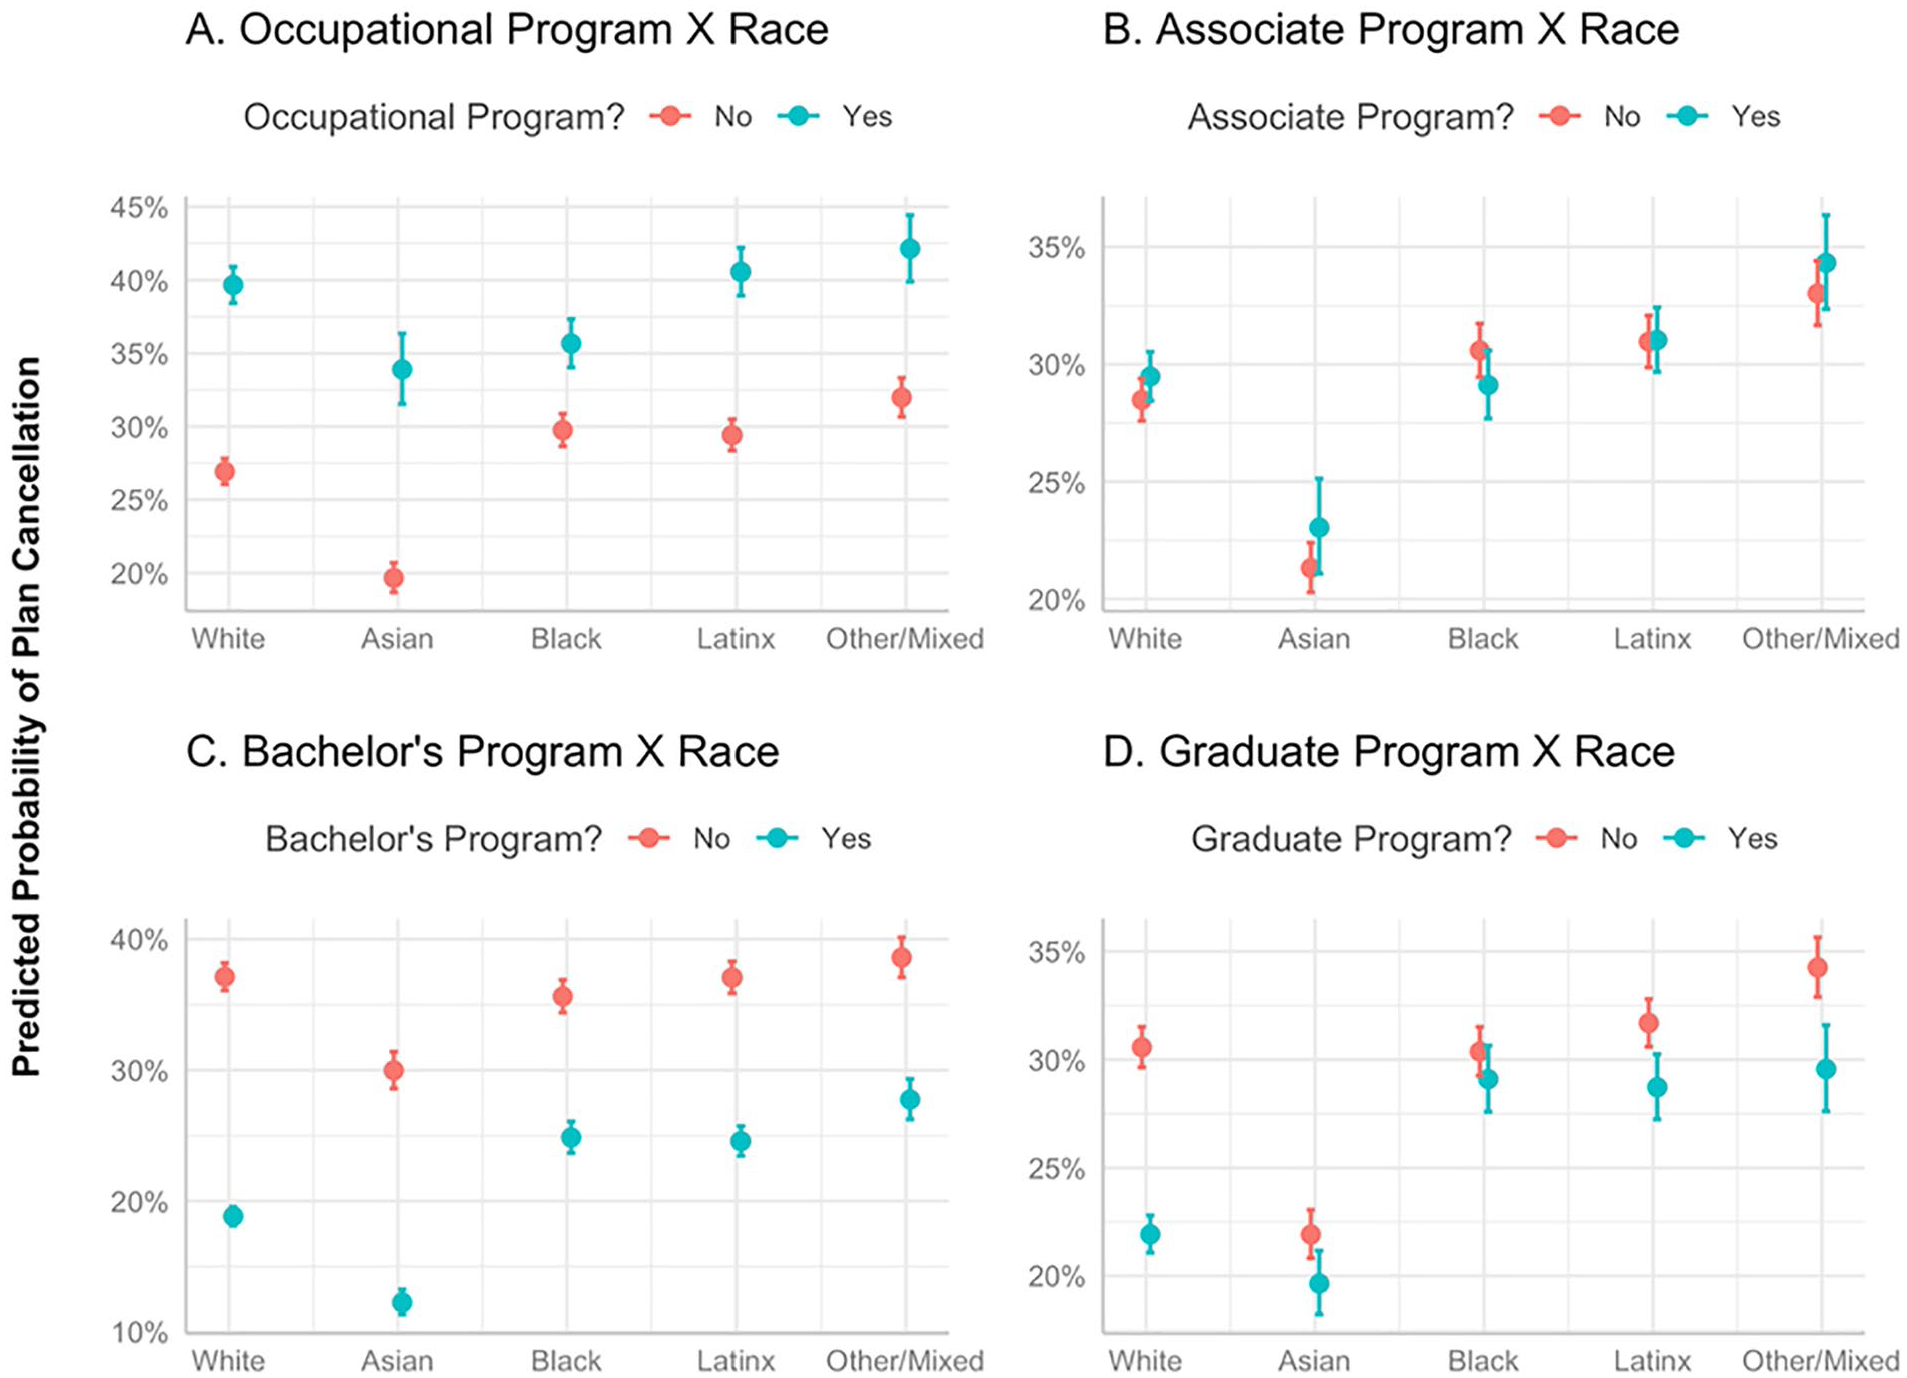
Predicted probabilities of plan cancellation by race and program type.
It is worth noting that the difference across education programs tend to be smaller in non-White than White groups. For example, Black respondents in households with and without members having plans in graduate programs have similarly high probabilities to report plan cancellation; Asians in households with and without plans in graduate programs have similarly low probabilities to report plan cancellation. Conversely, Whites in households with members having plans in graduate programs are much less likely to report plan cancellation than Whites in households without members having such plans. Similarly, the differences in probabilities of plan cancellation between households with and without plans in occupational or bachelor’s programs are smaller among the Black and Latinx groups than the White group. These results indicate that members in Black and Latinx households suffer from consistently high risks of plan disruption across different educational programs.
Interaction Between Race and Pandemic Vulnerability
To further examine the potential intersectionality of pandemic vulnerability, we next include interaction terms between race and household vulnerability measures into the models predicting plan disruptions. Results are presented in Table 6. Each panel shows results from a separate set of models: Panel A shows models with the interaction between race and SNAP status, Panel B shows models with the interaction between race and respondent insurance status, and Panel C shows models with the interaction between race and household work loss during the pandemic. We only present the main effects of the vulnerability measures and interaction effects in the table. The main effects thus show the effects of vulnerability measures on disruptions among Whites, and the interaction effects again show the differences in such effects between Whites and the racial group at focus.
Mixed-Effects Models Predicting Disruption With Interaction Terms Between Race and Vulnerability Measures

Note. N = 235,779. Standard errors in parentheses. Multilevel logistic regression models with state-level random intercepts effects. Showing log odds estimation. Each panel is a separate set of models with an interaction term between the race and one of the vulnerability measures (SNAP, no insurance, or work loss) added to the base models shown in Table 4. All control variables are included in the models but omitted from the table. The main effects of race are omitted from the table. SNAP = Supplemental Nutrition Assistance Program.
p < .05. **p < .01. ***p < .001.
We observe significant interaction effects between race and vulnerability measures. For example, Panel A shows that while households receiving SNAP are less likely to report no change to plans or taking classes in different formats and more likely to report plan cancellation compared to households not receiving SNAP, these effects are all significantly smaller among the Black and Latinx groups than Whites. Similarly, Column 3 in panel B shows that while respondents with no insurance are more likely to report plan cancellation, this effect is smaller among non-White groups than Whites. Furthermore, Panel C shows that respondents in households with work loss are less likely to report no change or having classes in different formats and more likely to report plan cancellation, taking fewer classes, or switching to a different certificate/degree program. These effects, however, are smaller among the Black and Latinx groups than Whites.
To better interpret the interaction effects, we focus on plan cancellation (Column 3) and present the predicted probability by race and the three vulnerability measures in Figure 4. Results show that while there is a larger effect of household vulnerability on plan cancellation among Whites than non-Whites, it is partly due to a higher probability of plan cancellation among the relatively better-off non-Whites than better-off Whites. For example, among those who have insurance, do not receive SNAP, or have not experienced work loss during the pandemic, the Black, Latinx, and Other/Mixed groups all have a higher probability of plan cancellation compared with Whites. Conversely, White respondents in more vulnerable households—those receiving SNAP, lacking health insurance, or having experienced work loss during the pandemic—are as likely as (or even more likely than) the more vulnerable non-White groups to report plan cancellation. These findings indicate that for Whites, pandemic vulnerability is a major determinant for postsecondary education plan disruption, while for non-White groups, even those with relatively better economic status and lower levels of vulnerability could still suffer from a higher probability and more serious types of education disruption.
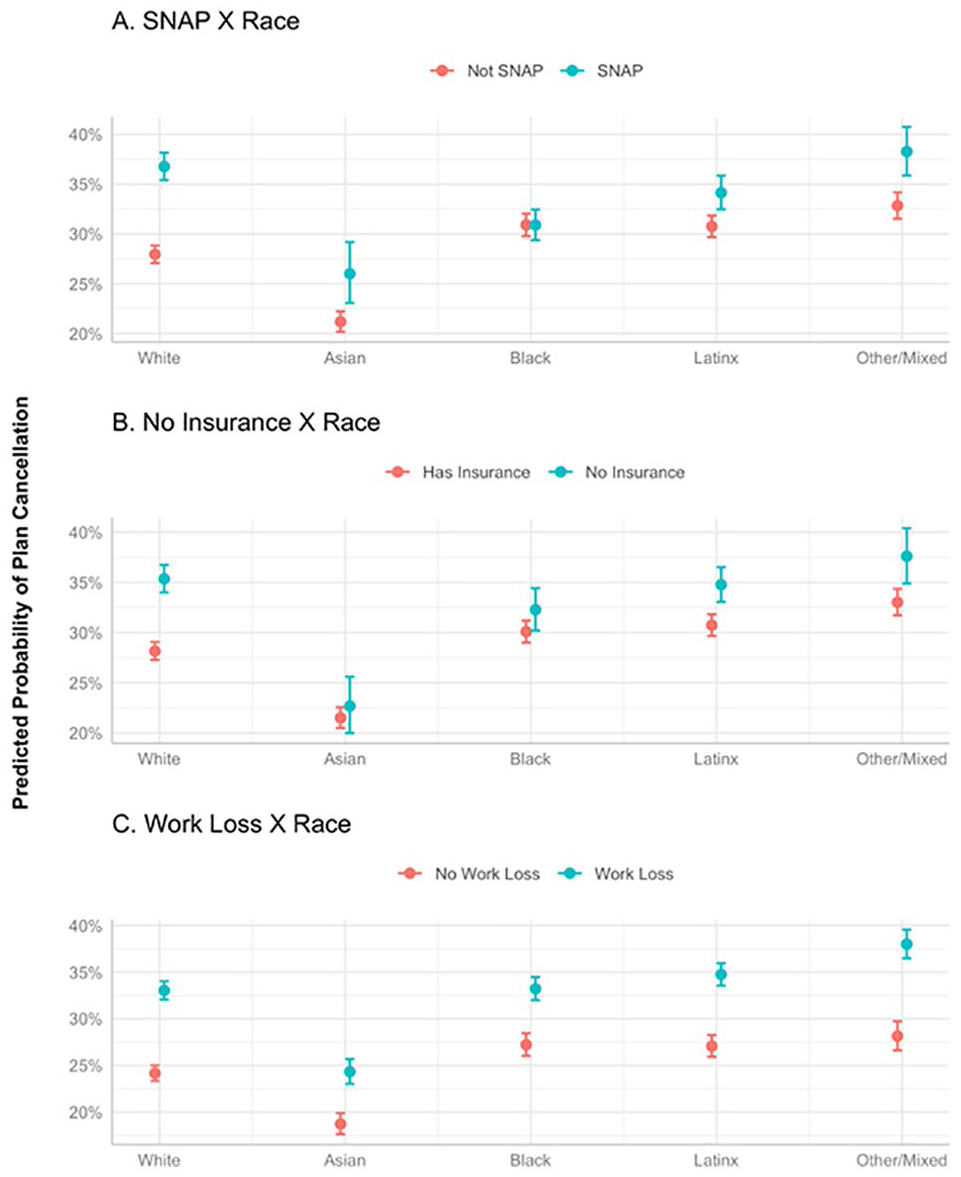
Predicted probabilities of plan cancellation by race and vulnerability.
Racial Differences in Cancellation Reasons
Last, we focus on plan cancellation, the most serious type of disruption, and examine different reasons behind it with mixed-effects logistic regression models. We combine some of the HPS question options and focus on six types of cancellation reasons: (1) directly COVID-related reasons, which include contraction of coronavirus, concerns about coronavirus, or caring for someone with coronavirus; (2) disruptions to care arrangement; (3) changes to income; (4) changes to financial aid; (5) changes made by the institution; and (6) uncertainty about campus life and learning, which includes both changes to campus life and uncertainty about classes/program. We predict cancellation of plans for each of the six reasons with race, type of program, vulnerability measures, and other control variables. Results are presented in Table 7.
Mixed-Effects Models Predicting Cancellation of Plans Due to Different Reasons

Note. N = 235,779. Standard errors in parentheses. Multilevel mixed-effects logistic regression models with state-level random intercepts effects. Showing log odds estimation. Each column is a separate model predicting postsecondary education plan cancellation due to different reasons. COVID = coronavirus disease; SNAP = Supplemental Nutrition Assistance Program.
p < .05. **p < .01. ***p < .001.
Table 7 shows that after controlling for vulnerability measures and types of education programs, we observe important racial differences in reasons for plan cancellation. Black respondents are 22% more likely to report plan cancellation for directly COVID-related reasons (LO = 0.20, OR = 1.22) and 51% more likely to report cancellation for changes to financial aid (LO = 0.41, OR = 1.51) than Whites. The Latinx and Other/Mixed groups are more likely to experience plan cancellation for all reasons except for changes to campus life than Whites. In particular, Latinx respondents are 21% more likely to report cancellation for changes to income (LO = 0.19, OR = 1.21), and 82% more likely to report cancellation for changes to financial aid (LO = 0.60, OR = 1.82) than Whites. Asians are also 30% more likely to report plan cancellation for changes to financial aid than Whites (LO = 0.26, OR = 1.30) and less likely to report other reasons.
Table 7 also shows significant effects of receiving SNAP or experiencing work loss on all reasons for cancellation, indicating that household members in these vulnerable situations are more likely to have to cancel postsecondary education plans for all six reasons than those not in these situations. Similarly, members in households lacking health insurance are more likely to report cancellations due to changes to income and financial aid while less likely to report cancellations due to changes in campus life.
We also observe consistent effects of having plans in occupational or associate programs—respondents in households with members having such plans are more likely to report cancellation due to all six reasons than those in households without such plans. Conversely, households with members having plans in bachelor’s programs are less likely to report cancellation due to most reasons except for changes to financial aid.
To better interpret the adjusted racial differences in cancellation reasons, we present the predicted probabilities of plan cancellation due to each of the six reasons by race in Figure 5. First, the Black, Latinx, and the Other/Mixed groups have higher probabilities to report cancellation due to directly COVID-related reasons (around 14%) than Whites or Asians (around 11.5%). Second, we observe similar patterns for cancellation due to disrupted care arrangement, changes to income, and uncertainty in campus life and learning: the Other/Mixed group is most likely to report plan cancellation for these reasons, followed by Latinx respondents; Asians are least likely to report plan cancellation for these reasons. The pattern is slightly different when it comes to changes to financial aid, with Latinx respondents having a higher probability to report cancellation for this reason (around 9.5%) and Whites least likely to do so (around 5.5%). Last, Whites and the Other/Mixed group have similarly high probabilities of reporting cancellation due to changes from the institution (about 8%), followed by the Latinx, Black, and Asian groups.

Predicted probabilities of plan cancellation due to different reasons by race.
Discussion
This study utilizes the most updated and nationally representative data on U.S. households from August 2020 to March 2021 to examine sociodemographic disparities in disruptions to postsecondary education plans during the COVID-19 pandemic, revealing four important findings. First, while there is a wild prevalence of disruptions to postsecondary education plans—nearly three in four U.S. households with members having postsecondary education plans experienced some sort of disruption during the 8-month data collection periods—results show significant racial differences in both the forms of and reasons for these disruptions. Although White respondents report a similar level of disruptions compared to the overall population, an investigation of the actual forms of disruption reveals that they are more likely to report taking classes in different formats as the major form of disruption. Conversely, the Black, Latinx, and Other/Mixed groups are more likely than Whites to report that they have to cancel all postsecondary education plans or switch to a different certificate/degree program. Although online classes may not be as effective and beneficial as face-to-face classes, plan cancellation should be more detrimental considering the long-term negative consequences of delayed enrollment and graduation (e.g., Bozick & DeLuca, 2005; Roksa & Velez, 2012; Rowan-Kenyon, 2007; Witteveen & Attewell, 2021). For example, research shows that only 9% of U.S. students who delay immediate enrollment to college ultimately obtain a bachelor’s degree within 8 years of high school graduation in contrast to 55% of those who do not delay (Goldrick-Rab & Han, 2011). More specifically, each additional month between high school graduation and college entry decreases the odds of obtaining a bachelor’s degree by 6.5% (Bozick & DeLuca, 2005). Even if these students ultimately obtain their degrees, delayed graduation could be associated with an 8% to 15% decrease in postcollege earnings on average (Witteveen & Attewell, 2021). Although disruptions during the pandemic may have differential consequences from disruptions in normal times, these previous studies still warn us that disparities in short-term education disruptions could ripple out into widening educational and socioeconomic gaps in years to come. In this sense, taking classes in different formats could be a more resilient response to the unexpected changes brought by the pandemic than delayed enrollment and plan cancellation. Racial disparities in the actual forms of disruptions are thus crucial in determining inequalities in the long-term consequences of the pandemic. 3
Moreover, while offering classes in different formats is largely a decision from educational institutions, plan cancellation is more likely a decision made by students and/or their families that involves consideration of the costs and benefits of taking classes during the pandemic. Such decisions may also be affected by unexpected life changes due to the pandemic. The analyses of different reasons for plan cancellation further show racial differences in this decision-making process. Even after controlling for household vulnerability status and education programs, Black and Latinx respondents are still more likely to report cancellation for economic concerns than Whites: They are 51% and 82% more likely to report cancellation due to changes to financial aid, respectively; Latinx respondents are also 21% more likely to report cancellation due to changes to income. Moreover, both Black and Latinx respondents are over 20% more likely than Whites to report cancellation for contraction of or concerns about coronavirus or having to care for someone with coronavirus, consistent with recent studies showing racial disparities in risks of severe illness, hospitalization, and death caused by COVID-19 (e.g., Abedi et al., 2020; Coughlin et al., 2020; Selden & Berdahl, 2020). Furthermore, the Latinx group is 14% more likely to cancel education plans due to disruptions to care arrangements than Whites, including loss of daycare of adult care programs. These findings all point to the long-standing systemic racism in U.S. society that resulted in important racial disparities in vulnerability to the pandemic and its widespread socioeconomic impacts. The marginalized racial groups are not only systematically disadvantaged in their SES and educational opportunities, but also suffer from higher health risks and are less resilient when facing the pandemic. These disadvantages could all result in less-optimal education decisions with long-term negative consequences, leading to widening racial inequalities.
Second, findings reveal significantly different risks of disruption across different types of education plans: households with plans in occupational training or associate degree programs are more likely to experience disruption than those with plans in bachelor’s degree or graduate programs. This is consistent with recent data from the NSC Research Center (2021) showing that community colleges and associate degree programs see the largest decline in enrollments. Considering students enrolled in these programs are more likely to be socioeconomically disadvantaged in the first place, they could be taking an even greater hit from these disruptions. On the other hand, while students in bachelor’s or graduate degree programs enjoy a certain level of protection against education disruption, the interaction between race and educational programs shows that this protective effect is much smaller among Black and Latinx students, leading to larger racial disparities in education disruptions in these programs. This sends an alarming message that disadvantaged racial groups could be losing more advantaged education opportunities, which again contributes to long-term racial inequality.
Third, results show that pandemic vulnerabilities are interlinked: those receiving SNAP, lacking medical insurance, and having experienced household work loss during the pandemic are also much more likely to experience postsecondary education disruption, in particular plan cancellation. Moreover, results show an interaction between race and pandemic vulnerability. Even among the relatively less vulnerable groups—that is, those not on SNAP, having insurance, or having not experienced work loss during the pandemic—the Black, Latinx, and Other/Mixed groups still have a higher probability of plan cancellation than Whites. On the other hand, while Whites do relatively better when they are not in a vulnerable situation, we observe a larger effect of pandemic vulnerability on disruption to postsecondary education—Whites who are receiving SNAP, lacking insurance, or having experienced work loss have similar or even higher probabilities of plan cancellation compared with the Black, Latinx, and Other/Mixed group in similarly vulnerable situations. Extending previous research on the intersectionality of disaster vulnerability (Arcaya et al., 2020), these findings point out that pandemic vulnerability is multidimensional and is determined by the intersection of social, economic, and racial status. It is thus crucial to carefully investigate the composition of vulnerability for developing more targeted policies and initiatives to alleviate the negative impacts of the pandemic.
Last, it is worth noting that Asians are most likely to report no change to postsecondary education plans and least likely to report plan cancellation across all racial groups. Instead, they are more likely to report taking classes in different formats, the relatively more resilient response to the disruption. These patterns hold even after controlling for vulnerability measures. Moderation analyses further show that Asians in vulnerable status—those receiving SNAP, having no insurance, and having experienced work loss—report similar or even lower probability of plan cancellation than non-Asian groups in nonvulnerable status. The impressive resilience of Asian households to continue pursuing education in the most vulnerable situations during the pandemic could reflect certain cultural values within the community. Studies have long found that Asian Americans tend to have relatively higher levels of school performance and educational attainment compared with Whites and other racial/ethnic groups (e.g., Hsin & Xie, 2014; Kao, 1995; Lee & Zhou, 2014; Xie & Goyette, 2003). Research also points out that structural explanations focusing on socioeconomic resources alone could not explain away this difference (Fejgin, 1995; Goyette & Xie, 1999; Kao, 1995), and even Asian Americans from disadvantaged family backgrounds tend to have advantages in academic achievement (Lee & Zhou, 2014). Evidence also shows that Asian Americans’ behaviors and attitudes about education are less influenced by family SES than Whites (Liu & Xie, 2016). Some scholars argue that culture could play a role here as Confucianism exerts a strong influence on some Asian American families’ values of education (e.g., Barringer et al., 1993; Jiménez & Horowitz, 2013; Schneider & Lee, 1990; Wong, 1990). Moreover, recent Asian immigrants could be a self-selected group based on their strong belief in the value of education (Kao & Tienda, 1998; Xie & Goyette, 2003). These cultural differences have been used to explain the education premium of Asian Americans (Hsin & Xie, 2014; Liu & Xie, 2016), and they could likely contribute to the relatively lower levels of disruption to education plans of Asian American household members during the pandemic.
On the other hand, although Asians are least likely to have plan cancellation due to most of the examined reasons, they are still 30% more likely than Whites to have plan cancellation due to changes to financial aid. Such structural factors that could not be altered through individual attitudes and behaviors may lead to negative consequences even in the most resilient community. While legislators and institutions made adjustments to financial aid and student loan programs during the early breakout of the pandemic (Smalley, 2021), additional relief measures are still necessary to prevent further disruptions to education plans for socioeconomically disadvantaged students. Moreover, while over half a million students rely on Federal work–study programs to make ends meet, many institutions reduced or limited work–study job opportunities due to campus closures and gathering restrictions (Gomez, 2020). Further assistance is likely necessary for these students to successfully complete their programs.
Limitations and Conclusions
This study has several limitations. First, the HPS only records a respondent’s own race/ethnicity but does not have information on other household members; questions about postsecondary education plans, however, are asked about all household members. Therefore, while the analyses on postsecondary education plan disruption in this study are done at the household level, the race/ethnicity group can only be identified based on the information of the survey respondents. We are thus not able to identify and examine the situation of multiracial households when the respondents themselves are not multiracial. The U.S. Census Bureau estimates that in 2012–2016, about 10% of married-couple households are interracial/interethnic (Rico et al., 2018). It is thus important for future surveys to add questions on household racial composition to get a deeper understanding of the pandemic vulnerability of multiracial households.
For similar reasons, we are unable to examine differences by gender, age, or life stage in postsecondary education plan disruptions since the respondents could be reporting for other household members. It is also worth noting that the HPS does not ask about current academic standing, for example, whether a household member has already started a postsecondary educational program before the pandemic or not. Moreover, when a household has multiple members pursuing postsecondary education and experiencing different forms of disruptions for different reasons, we are unable to investigate the intrahousehold nuances. Nevertheless, the HPS is still an efficient way to provide a real-time snapshot of U.S. households’ experiences during the pandemic and is currently the best data source on postsecondary education plan disruptions. Future studies should consider utilizing more detailed survey instruments and interviews with a focus on individual characteristics and experiences to disentangle potential complexities that could not be uncovered through household-level surveys.
Second, this study investigates disruptions to education plans, but plans before the pandemic do not necessarily translate into eventual actions even if the pandemic did not happen. The “summer melt” literature has well documented the phenomenon that socioeconomically disadvantaged college-intending students are susceptible to high rates of summer attrition from the college pipeline during the summer right after high school graduation (Castleman & Page, 2014, 2020). This is due to the lack of access, resource, guidance, and support to complete challenging precollege tasks during the summer when these students are isolated from their high school community but have yet to become a member of their intended college (Castleman & Page, 2014, 2020). While the HPS specifically asked about disruptions resulted from the coronavirus pandemic, it is still likely that a part of the educational disruptions and the associated disparities observed in this study would exist in a year without the pandemic. Since the HPS only started after the onset of the pandemic, we are unable to estimate the extent of summer melt in nonpandemic times using the same data source. The best effort to date in quantifying the national summer melt rate is a previous study using the Educational Longitudinal Study of 2002 (ELS:2002) data; it estimates a summer melt rate of 15% for low-SES students and 10% for high-SES students of mean cognitive performance (Castleman & Page, 2014). The same study also utilizes data from uAspire, a nonprofit organization that advises public school students in Massachusetts, and estimates a summer melt rate of 22% for low-SES students and 18% for high-SES students (Castleman & Page, 2014). Our findings, on the other hand, show an overall plan cancellation rate of 34.7%, much higher than these summer melt estimates. Another recent study examined a sample of four graduating high school classes from 2016 to 2019 in a national public charter organization that serves primarily low-income Black or Latinx students, showing that 22.8% of these students experienced a change between intended enrollment and actual enrolment, including both plan cancellation and change of institutions (Sanchez, 2020). In comparison, our estimates show that over 40% of Black and Latinx respondents reported plan cancellation or changes of institutions, again a much higher rate than the summer melt estimates. These findings indicate that the observed disruptions in our study could not be solely attributed to the summer melt effect. Researchers should consider using future rounds of the HPS data and other new data sources for a representative estimate of the summer melt effect across racial groups and a more accurate comparison between non-pandemic and pandemic-related factors that impact education disruptions.
The COVID-19 pandemic has caused profound disruptions to every aspect of social life, and these disruptions are not equal. Despite the limitations, this study revealed significant racial and social disparities in postsecondary education disruption that could exacerbate the long-standing systemic inequality and lead to long-term impacts on U.S. society. For researchers, efforts of follow-up investigations are necessary to fully understand the pervasive impacts of the disruptions brought by the unprecedented pandemic. Future studies should also further examine the decision-making processes across sociodemographic groups to reveal the underlying structural and cultural factors contributing to the vulnerability and resilience when it comes to decisions on education plans during unexpected disruptions. For policymakers, additional relief measures, policies, and institutional supports are crucial to alleviate such unequal consequences and ensure disadvantaged students with disrupted education plans can return to campus and receive the resource they need to get back on track. Moreover, it is not enough to address education disruption with education initiatives; equally essential are strategies to address household vulnerability in other dimensions such as unemployment, social security, and health care. It is thus extremely important to develop more timely and comprehensive emergency responses to prevent future disruptions to household education plans during similar public health crises or other types of disasters.
Supplemental Material
sj-docx-1-ero-10.1177_23328584211045400 – Supplemental material for Disparities in Disruptions to Postsecondary Education Plans During the COVID-19 Pandemic
Supplemental material, sj-docx-1-ero-10.1177_23328584211045400 for Disparities in Disruptions to Postsecondary Education Plans During the COVID-19 Pandemic by Ran Liu in AERA Open
Footnotes
Acknowledgements
Notes
Author
RAN LIU is an assistant professor at University of Wisconsin–Madison, Department of Educational Policy Studies. Her research interest includes inequality and stratification, gender and STEM (science, technology, engineering, and mathematics), and education in East Asia.
References
Supplementary Material
Please find the following supplemental material available below.
For Open Access articles published under a Creative Commons License, all supplemental material carries the same license as the article it is associated with.
For non-Open Access articles published, all supplemental material carries a non-exclusive license, and permission requests for re-use of supplemental material or any part of supplemental material shall be sent directly to the copyright owner as specified in the copyright notice associated with the article.