
Abstract
Prior research demonstrates the important role that financial considerations play in prospective students’ decision making when applying to and enrolling in graduate school. Racially/ethnically minoritized students, in particular, face persistent challenges during the graduate application and enrollment process. Capitalizing on a natural experiment, we identify the effects of introducing a PhD fellowship on the composition of applicants and enrolling students in PhD programs at a large public university’s graduate school of education. Using administrative data from 9 years of applications, we use difference-in-differences and event study analyses to show that the fellowship increased the number of applicants overall, as well as the share of Black applicants and enrollees in impacted cohorts, with no significant effects on academic preparation. To better understand why and how a PhD fellowship might impact students’ application behaviors and experiences once in graduate school, we supplement our primary findings with survey responses from current PhD students at the graduate school of education.
Keywords
Recent research on graduate education access has focused on the role of financial considerations in shaping prospective students’ graduate school decision making (e.g., Belasco et al., 2014; Denecke et al., 2016). Responding to long-standing concerns that financial barriers may discourage students from entering graduate school (e.g., Baum & Steele, 2018; Bauman, 2020; Malcom & Dowd, 2012), a growing number of institutions have announced policies aimed at increasing the financial appeal of their PhD programs. Several institutions, for instance, have announced plans to raise their minimum PhD stipends, including Emory University and the University at Buffalo (Emory University, 2018; Moyen & Gorny, 2019). Other institutions have sought to reduce restrictions on already-existing funding programs; the University of Chicago, for example, guaranteed humanities and social sciences PhD students funding for the full length of their program beginning in the 2020–2021 academic year, lifting a 6-year limit previously in place (Flaherty, 2019). This trend has also been seen in graduate programs outside of PhD programs, with one notable example coming from New York University’s (NYU) medical school, which announced that it would begin offering tuition-free graduate education to all admitted students moving forward (Jaschik, 2019). As a result of this program, NYU saw a 47% overall increase in applicants and a 102% increase in applicants who self-identify as a member of an underrepresented group in medicine, with the largest increase among those who identified as African American, Black, or Afro-Caribbean (Jaschik, 2019).
Indeed, a long-standing body of research has noted differential levels of graduate school access and graduate degree attainment by ascriptive characteristics such as race/ethnicity (e.g., Posselt & Grodsky, 2017). For example, in science, technology, engineering, and mathematics fields in 2016, Black/African American, Latinx/Hispanic, and Native American students accounted for only 22% of bachelor degree recipients, 13% of master degree recipients, and 9% of doctoral degree recipients (National Science Foundation, 2019). Motivated by such gaps in representation, a growing body of research has focused on efforts to increase the racial/ethnic diversity of graduate students (e.g., Garces, 2014; Griffin et al., 2012; Hurtado et al., 2010).
The types of funding opportunities described above—increased stipend amounts, guaranteed duration of support, and tuition waivers—have clear implications for addressing issues of equity in access to graduate education, particularly for racially/ethnically minoritized 1 students who have been consistently underrepresented in graduate programs. Still, there has been relatively limited research on the impact of these types of financial incentives on graduate school applicants’ behaviors. Prior research has frequently included descriptive analyses focusing on the association between various student and institutional characteristics and the likelihood of graduate school enrollment (e.g., Ethington & Smart, 1986; Mullen et al., 2003; Perna, 2004; Tienda & Zhao, 2017; Zhang, 2005). However, such studies have only occasionally focused on PhD program enrollment (with master’s programs receiving a greater share of attention) and are typically unable to isolate the impact of specific forms of financial support.
A specific focus on PhD enrollment is especially policy-relevant because PhD credentials serve as prerequisites for faculty careers, shape the questions and methods used in the next generation of research, and provide training for leaders both within and outside academia.
In this study, we seek to contribute to the literature by identifying the effects of introducing a new, comprehensive fellowship to support PhD students in a school of education at a large public research university. We focus in particular on the fellowship program’s potential effects on the volume of applications and the characteristics of applying and enrolling cohorts of students at impacted programs. This study seeks to address two primary research questions:
To what extent did the introduction of a fellowship program (which provided a stipend, tuition waiver, and subsidized health care) change the volume of applicants to PhD programs in a school of education?
To what extent did the introduction of a fellowship program lead to changes in the characteristics of PhD applicant and enrolling student cohorts, including the racial/ethnic composition and average academic preparation of students in those programs?
Our findings offer insights relevant to policy and practice on several dimensions. First, this study is among the first to offer quasi-experimental evidence on the effects of introducing a graduate financial aid package that includes a multiyear guaranteed stipend, tuition waiver, and subsidized health care. Second, there are conceptual reasons to believe that prospective students may be particularly responsive to the introduction of a fellowship program in graduate schools of education. Specifically, education is the field of study with the highest proportion of PhD students who primarily fund their studies through their own resources (46%), as well as the highest average graduate debt among research doctorate recipients ($28,600; Survey of Earned Doctorates, 2018). Third, because we observe characteristics of all applicants and matriculants to PhD programs across an entire university, the results of this study speak to the consequences of such initiatives on the composition of the cohort as a whole, offering a perspective that may be especially salient for institutions and departments considering the implementation of such initiatives.
The article proceeds as follows. First, we present a conceptual framework rooted in prior research on the college enrollment decision-making process for racially/ethnically minoritized students to help motivate why and how a fellowship may impact prospective students’ decisions on where to apply and enroll. We discuss relevant research on graduate student enrollment and the role of financial aid in student enrollment processes. We then share details about the fellowship program under study, along with context about the institution where the fellowship was offered. After a discussion of institutional data and the difference-in-differences and event study approaches we employ, we present evidence that the fellowship program increased applications to the affected PhD programs, while also increasing the racial and ethnic diversity of both the applicant and enrollee cohorts, with particularly strong evidence of an increase in the proportion of Black applicants. At the same time, we find no clear evidence of changes in academic preparation as measured by standardized tests. We also present exploratory evidence from a student survey that aims to uncover potential mechanisms through which the scholarship program may have been impactful, especially for racially and ethnically minoritized students. We conclude with a discussion of why these findings are particularly relevant given the ongoing drive to bring greater diversity and representation into doctoral education, and discuss implications for policy and future research.
Conceptual Framework
To guide our analysis of the fellowship program, we use a conceptual framework rooted in prior research on racially/ethnically minoritized students’ financial decision making regarding college enrollment. This literature helps shape the choices that racially/ethnically minoritized prospective students make in their application and enrollment processes for higher education.
Two tenets in particular undergird our conceptual framework, together contributing to several hypotheses about the outcomes a fellowship program is likely to produce. First, there are long-standing differences in family wealth by racial/ethnic background (Urban Institute, 2017). For instance, in 2019, compared with the median White family, typical Black and Latinx 2 families had one eighth and one fifth as much wealth, respectively (Bhutta et al., 2020). These stark disparities in financial resources potentially increase the salience of graduate program expenses and availability of stipends in the decisions that Black and Latinx students make regarding applying to and enrolling in doctoral education.
Second, prior research has demonstrated differential levels of student loan borrowing by racial/ethnic group membership at the undergraduate level (Hillman, 2015). One factor contributing to these differential levels is loan aversion, a phenomenon in which students avoid borrowing for educational expenses, even when the loan is likely to yield positive long-term returns. Prior research has found loan aversion to be especially high among Latinx individuals (Boatman et al., 2017), suggesting yet another factor that might discourage Latinx students from enrolling in graduate programs for which it would be necessary to borrow to cover educational expenses.
Together, these two tenets—differences in family wealth and loan aversion—may result in a scenario in which financial factors are especially relevant in the application decisions of prospective Black and Latinx students. By providing a tuition waiver, competitive stipend, and health insurance, a graduate fellowship program may therefore prove especially attractive to Black and Latinx applicants. When such a fellowship program includes a multiyear guarantee of funding, thereby further reducing uncertainty, the effects seem likely to be even stronger. The effects are also likely to be more noticeable in the field of education, which includes an especially large number of self-funded doctoral students and a comparatively high representation of Black and Latinx students (Survey of Earned Doctorates, 2018). Fellowship programs with these characteristics would appear to be poised to attract students who would otherwise attend a different institution for their PhD in education, as well as some subset of students who might not have otherwise entered a PhD in education.
Literature Review
Prior research has examined a variety of factors associated with graduate school application and enrollment. A number of these studies have relied on nationally representative data sets, finding relationships between graduate school enrollment and dimensions such as race/ethnicity (English & Umbach, 2016; Perna, 2004; Tienda & Zhao, 2017), undergraduate field of study (English & Umbach, 2016), undergraduate academic performance (Ethington & Smart, 1986; Mullen et al., 2003), undergraduate borrowing (Malcom & Dowd, 2012; Millett, 2003), and receipt of financial support (Ethington & Smart, 1986). While these studies have made valuable contributions to the understanding of graduate enrollment broadly, there are two primary constraints to these strands of research. First, most rely on data from baccalaureate recipients from 2001 or earlier, which leaves open the possibility that the observed relationships may have changed in recent decades. Second, this earlier work on graduate school choice uses disparate definitions of graduate education, sometimes combining enrollment in multiple degree programs (e.g., master’s, PhD, and professional) and occasionally omitting PhD programs altogether.
Beyond the overall decision of whether to attend graduate school in general, a somewhat narrower pool of research has explored prospective PhD students’ specific application and enrollment decisions. However, some consistent patterns have emerged with respect to factors associated with PhD application and enrollment decisions. Perhaps intuitively, PhD applicants rely on a number of factors that align with the undergraduate application process, such as institutions’ reputations and costs (Kallio, 1995). Additionally, several distinct considerations do appear to be closely related to application and enrollment decision-making at the PhD level, including financial support (both type and amount), familial responsibilities, job opportunities for spouses and partners, program flexibility, and geographic location (Allen et al., 1996; Olson & King, 1985; Talbot et al., 1996). Evidence also suggests that the criteria used by prospective students when deciding where to apply may also differ in the criteria used in making enrollment decisions (Bar et al., 2007). Furthermore, there appear to be differences by racial/ethnic group at the enrollment stage (Bersola et al., 2014). For instance, Black and Latinx students place greater emphasis on their perceived sense of inclusion at the graduate institution than their White and Asian counterparts (Bar et al., 2007). Additionally, the relative prioritization of considerations may vary along such dimensions as race/ethnicity, gender, student age, and applicants’ intended full-time/part-time enrollment status (Poock & Love, 2001).
Among the factors related to graduate school application and matriculation, this study builds on the modest but growing literature regarding the role of financial support in graduate education application and enrollment decision-making. To date, studies of graduate student financial support have primarily focused on its relationship with student outcomes, such as persistence (Ampaw & Jaeger, 2012; Ehrenberg et al., 2007), completion (de Valero, 2001; Ehrenberg & Mavros, 1995; Girves & Wemmerus, 1988), time-to-degree (Abedi & Benkin, 1987), and research performance (Horta et al., 2018). Some work has also illuminated variation in the rates of receiving various types of graduate financial support (e.g., assistantships, fellowships, grants, loans) by race/ethnicity (Millett & MacKenzie, 1995). While certain studies have highlighted the use of financial support as a recruitment strategy among master’s and professional students (Agrawal et al., 2005; Porter et al., 2014), comparatively less work has centered on the role of financial support in shaping application and enrollment decisions at the PhD level.
A small body of research has focused on the relationship between financial support and PhD application and matriculation. Descriptively, Malaney (1984) found that PhD students at the Ohio State University identified financial aid as their second most important reason for applying to the institution, behind only the departmental reputation, underscoring its potential salience in graduate school application and enrollment decision-making. Similarly, Bersola et al. (2014) found that students offered financial support were more likely to enroll at an institution than those without an aid offer, though only two types of support—fellowships and teaching assistantships—appeared to be related to higher levels of matriculation. A study of psychology PhD programs found that PhD students and faculty alike identified financial aid packages as instrumental in successful recruitment of racially/ethnically minoritized students (Rogers & Molina, 2006). These results suggest that shifts toward a fellowship-based model may prove attractive to PhD applicants, especially racially/ethnically minoritized applicants, though the limited research base calls for additional investigation, which the present study pursues.
Context and Program Description
Champion University (pseudonym) is classified as a large doctoral university: very high research activity and is located in the Northeastern United States. The approximate costs of graduate in-state and out-of-state tuition in the academic year 2017–2018 were $15,000 and $35,000, respectively (National Science Foundation, 2019). The School of Education (SOE) at Champion University is well ranked among graduate schools of education according to U.S. News and World Report. The SOE has nearly 25 degree programs and offers bachelor, masters, sixth year, and doctoral degrees. In fall 2017, just over 70% of the graduate enrollment were women and approximately 20% were racially/ethnically minoritized students.
A few years prior to the launch of the PhD fellowship program (PFP; pseudonym), the SOE provided about 14 similarly compensated doctoral fellowships to provide tuition waivers and stipends for assistantships. These fellowships functioned differently from the PFP in that the funding was assigned by Department faculty and was used to support admitted students, but was not marketed in advance as a way to recruit applicants. Thus, prior to the PFP, fellowships with stipends were available to some PhD students, but students could not reliably anticipate whether they would receive a stipend at the time they applied. These initial fellowship funds ceased soon before the start of the PFP, which was largely funded through a large donation to the SOE.
The PFP was launched in Autumn 2014 “to recruit exceptional doctoral students to the [SOE] to help . . . with [its] strategic initiatives, the preparation of outstanding professionals, and promote the positive culture of the [SOE]—locally, nationally, and internationally” (PFP Committee Chair, personal communication, September 10, 2015). The SOE-wide PFP committee was composed of faculty from all academic departments and an ex officio member from the Dean’s Office (PFP Committee Member, personal communication, December 8, 2020). This committee led the PFP selection process and recommendations. At the time, SOE competitor schools did not offer funding opportunities similar to the PFP both in terms of the scope of compensation and size of program. The SOE made no considerable changes in the PhD admissions criteria with the incorporation of the PFP.
The PFP guaranteed selected students a 4-year award that included full-time tuition expenses and offered a competitive stipend that slightly varied by year but was between $22,000 and $24,000 annually (nominal U.S. dollars). In some years, a modest summer stipend was offered, as was financial support to attend academic conferences. Further, as part of the PFP, students were eligible to access a “highly subsidized health insurance” plan (institutional document). Recipients were expected to enroll full-time for the duration of the PFP and gain research experience working as a graduate/research assistant with full-time faculty for 20 hours per week during the academic year. At the start of the PFP, existing SOE PhD students’ funding sources closely aligned with the Survey of Earned Doctorates (2015) with about half of students receiving a research or teaching assistantship and the remaining half of students paying out-of-pocket (PFP committee member, personal communication, December 8, 2020).
SOE administrators and faculty marketed the program through various outlets including Education Week, alumni, campus partners, professional conferences, and individual efforts by faculty. Beginning with the 2015–2016 academic year, marketing (e.g., website, social media) included materials with images predominantly of racially/ethnically minoritized students. Since the marketing campaign’s emphasis on racial/ethnic diversity and messaging about making PhD study more affordable may have impacted applicants’ decision making, we consider the marketing program a potentially key component of the PFP.
The first cohort of PFP students began in the academic year 2015–2016 and the second in the academic year 2016–2017. In the first year of the PFP, 10 offers were made and eight were accepted, of which five were racially/ethnically minoritized students (none were international). In the second year, six offers were made and five were accepted of which two were racially/ethnically minoritized students (another student was international). The PFP was suspended for academic years 2017–2018 and 2018–2019, which resulted in a halt of recruitment efforts for the PFP. The suspension was primarily attributed to financial constraints, since the program was mainly resourced with SOE funds. The suspension of the program meant that no incoming PhD students were awarded a PFP, though continuing PFP recipients continued to receive their awards. Between the two initial cohorts, the SOE made a total of 13 PFP awards.
Data and Method
Administrative Data
To explore the causal effects of this intervention, we analyzed administrative records of doctoral and master’s program applicants and enrollees across Champion University from the nine application cycles spanning the years 2010–2018. This approach enabled us to estimate deviations from prior trends in the application and enrollment patterns of PhD student cohorts, both in programs affected (i.e., those in SOE) and those unaffected by the PFP. Specifically, we employed both generalized difference-in-differences and event study analyses to estimate whether the introduction and cessation of the PFP in SOE changed the volume or profile of program applicants and enrollees to SOE PhD programs, relative to the profile of PhD applicants and enrollees in College of Arts & Sciences (CAS) programs at Champion University, which include programs in the natural sciences, social sciences, and other liberal arts disciplines.
By accounting for trends in PhD program applications at the university outside the affected programs, we are able to control for secular trends that could have affected the entire university in specific application cycles (e.g., labor market conditions). In addition to leveraging PhD programs and cohorts in CAS as one plausible counterfactual, we also examine the robustness of our findings to two additional comparison groups. First, given that PhD applicants and enrollees in social science programs may be especially similar in terms of the types of skills developed and career goals of PhD students in the SOE, we construct a comparison group that only includes PhD applicant and enrollee cohorts in social science programs (e.g., anthropology, communication, economics, and sociology). This has the benefit of not forcing a comparison between education students and students in the natural sciences (for example), who may be different in many unobserved ways. As an additional comparison group, we compare PhD applicant and enrollee year cohorts in the SOE to master’s applicant and enrollee year cohorts within the same school (SOE). This comparison protects against concerns that any detected effects might be attributable to other (non-PFP) changes in the SOE more broadly, or to secular trends within the field of education.
Data come from administrative records maintained by Champion University’s office of graduate admissions, which compiles information on applicants and matriculants to all master’s and doctoral programs. These records include information on gender, race/ethnicity, undergraduate institution, GRE scores, and ZIP code associated with all applicants to Champion University in the 2010–2018 admissions cycles. The data also include information on the degree type and program to which someone applied, and indicators of whether prospective students were admitted and whether they enrolled at Champion University. In Table 1, we present descriptive statistics for the PhD applicants and enrollees at the SOE and for our primary comparison, the CAS, during the years in study.
Descriptive Statistics for School of Education (SOE) and College of Arts and Sciences (CAS) PhD Applicants and Enrollees
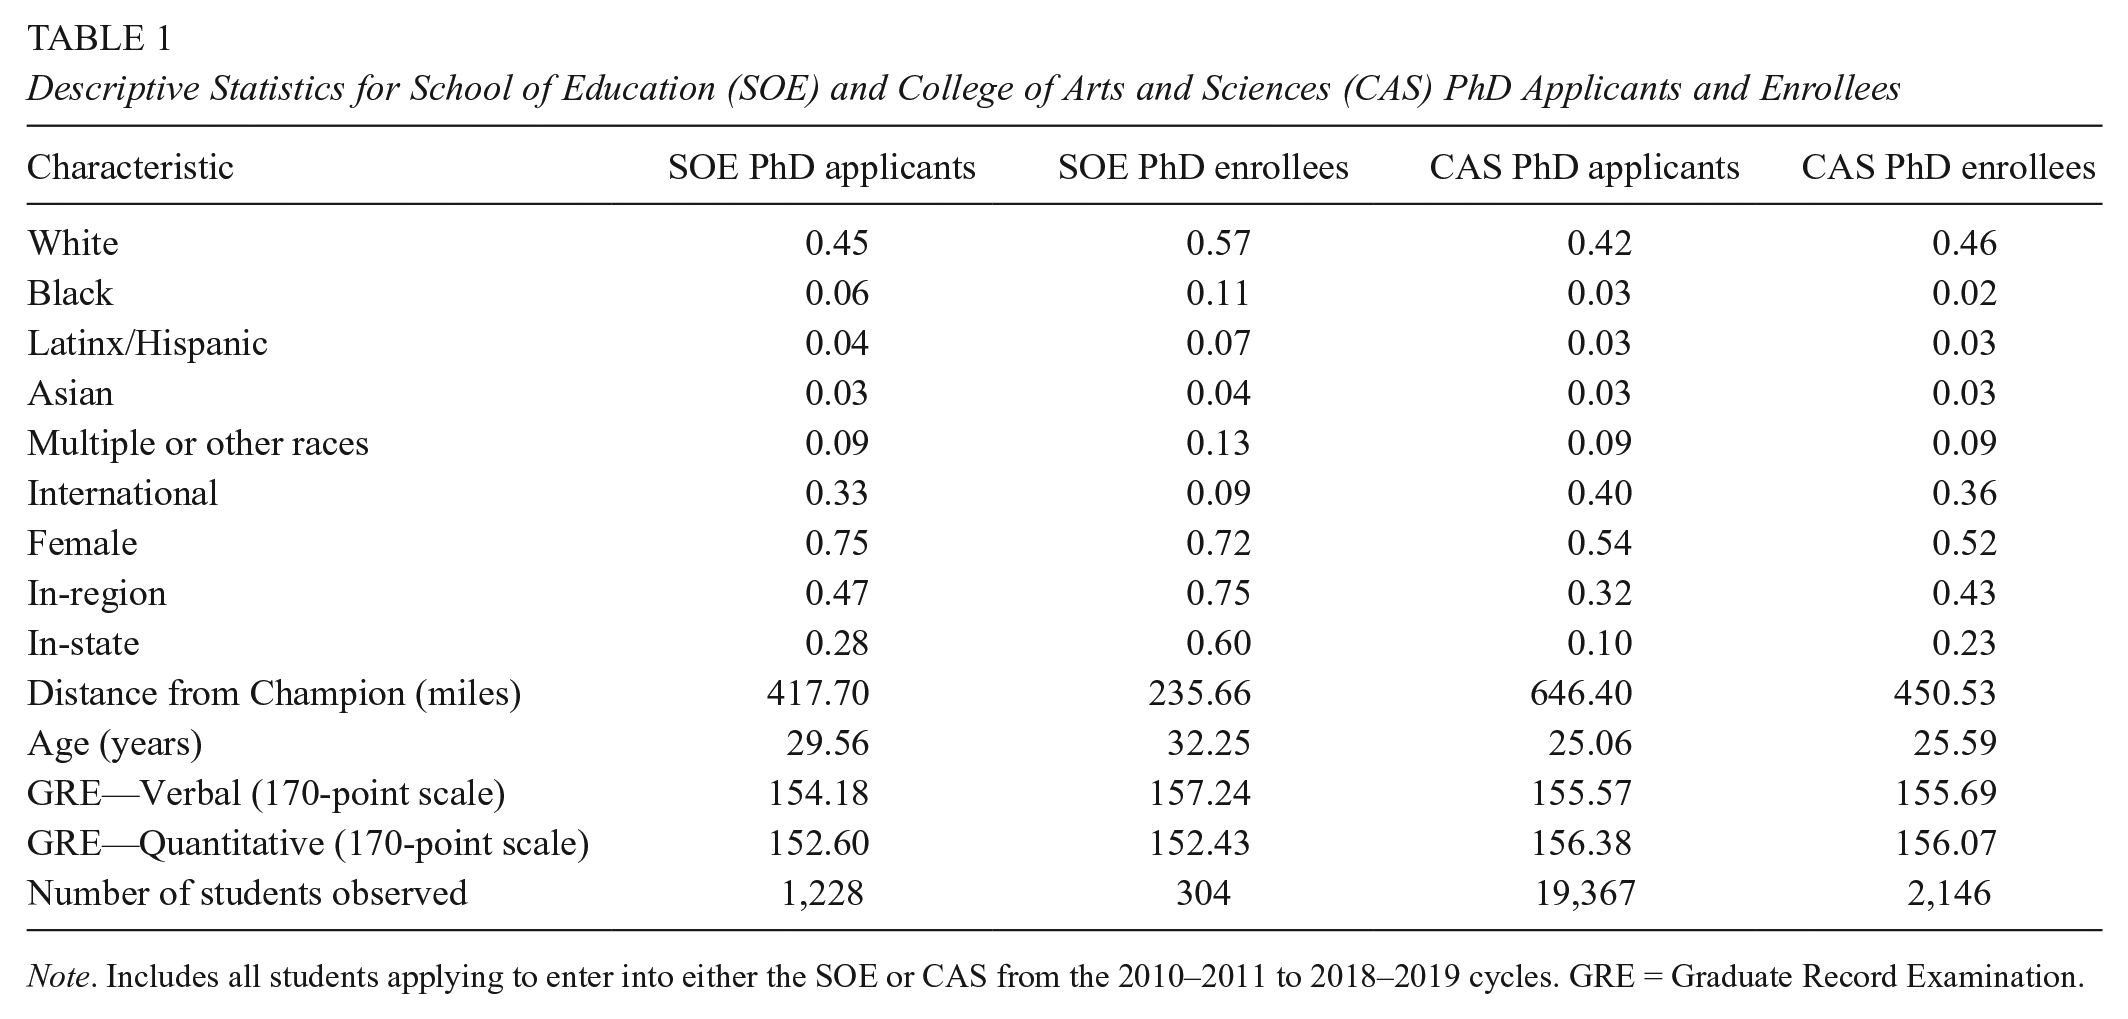
Note. Includes all students applying to enter into either the SOE or CAS from the 2010–2011 to 2018–2019 cycles. GRE = Graduate Record Examination.
In our analyses, we use data aggregated to the school-by-cohort/year level, which allows for analyses of changes in the composition of schools’ cohorts over time. Results should be interpreted as the impacts of changes in funding on the characteristics of applicant and enrollee cohorts.
In our first analytic approach, we use a generalized difference-in-differences (DD) approach that maximizes statistical power and assumes that treatment effects are constant over time:

Following this classical DD model,
Our analytic approach can be thought to identify causal impacts of this initiative as long as two key assumptions are met. First, we rely on the assumption that there were no differential trends between the treatment and control school prior to the introduction of treatment. Figure 2 provides evidence that the trendlines for key characteristics at SOE and CAS were largely parallel until the first treated cohort (in the 2015 entry cycle), at which point SOE deviates from these parallel trends. Second, we must be confident that there are no other concurrent policy changes or reforms that might otherwise explain the difference in outcomes. Our familiarity with the setting, as well as interviews with the university administration make us confident that there were no other relevant changes that might have differentially impacted the treated and comparison groups.
In Table A1 in the appendix, we include a robustness check with results from a specification with data at the program of study level that adds fixed effects for program of study. We adopt the model without program fixed effects as our preferred model because (1) treatment was offered at the school (rather than program) level, (2) the small sizes of many individual PhD program-year cohorts (including in CAS, where several specific programs do not have any applicants in each entry cycle) means that fixed effects introduce the potential for substantial statistical noise, and (3) the goal of the PFP was to impact the overall student body at SOE rather than in specific programs. Regardless, estimates in Table A1 demonstrate that our key conclusions remain generally similar even after including program fixed effects, bolstering these results.
Our second approach allows for variation in treatment effects over time and fits an event study model in which we estimate the difference between the treated and comparison group programs in each admissions cycle. This approach highlights whether these differences vary at different points in the cycle before and after the program was enacted. Formally, we specify this event study model as follows:

In the event study specification,
In these analyses, key outcomes of interest include the number of applicants, number of enrollees, and the proportion of applicants in a program cohort who identify as White, Black, Latinx/Hispanic, Asian, multiple or other races, international, from in-state, in-region (within the Northeastern United States), distance from Champion, along with age and average GRE scores (verbal and quantitative). These outcomes allow us to assess the extent to which the PFP changed the profile of applicants and enrollee characteristics among programs in the SOE.
Student Survey
In order to better understand the institutional effects of the PFP on applicant/enrollee numbers and overall program characteristics, it is also valuable to explore potential mechanisms through which the PFP may have influenced individual students. To better understand why and how the PFP may have impacted individual students, we surveyed enrolled PhD students at Champion University’s SOE to ask about the factors that influenced where they chose to apply for their PhD studies, how Champion University compared with other options when deciding where to enroll, and how they perceived their experience as a student once enrolled in Champion University.
All enrolled PhD students in the SOE received four emails over a 4-week period in fall 2019 soliciting their participation in a survey about their application and enrollment decision-making and graduate student experiences. Participation in the survey was strictly voluntary, anonymous, and without compensation. Out of the 156 potential respondents (identified by SOE), 41 participated in the survey, for a response rate of 26.3%. While the small sample size and modest response rate are clear limitations, the pool of respondents was largely representative of Champion University’s SOE PhD student population on observable characteristics we could match to administrative data, with 65% of respondents identifying as female (compared with 73% of the full population of PhD SOE students at Champion), 25% of respondents identifying with racially or ethnically minoritized student groups (compared with 20% of the full Champion PhD population), and 94% of respondents identifying as U.S. residents (compared with 91% of the full population).
Due to the limited number of survey responses, we are unable to separately consider students by individual racial/ethnic populations when analyzing the survey data, as we did with the analyses of administrative data. Instead, we jointly consider racially/ethnically minoritized students. Within the context of Champion University and the stated diversity goals of the PFP, this includes students identifying as Black, Latinx, and/or American Indian. We grappled with this decision, and acknowledge limitations in grouping multiple racial/ethnic groups into a single category. In particular, we are clear this categorization cannot fully capture the lived experience of any individual student. However, given that the PFP seemed to have a goal to racially/ethnically diversify SOE doctoral programs, we believe that it is a worthwhile effort to explore the possibility for differential impact among racially/ethnically minoritized students.
Results From Administrative Data
Descriptively, Figure 1 illustrates that during the fall 2015 and fall 2016 entry cycles (the years in which PFP funding was available to new SOE PhD students), the number of applicants and enrollees to SOE PhD programs increased and appeared to deviate from the trend both before and after the 2-year treatment period. Moreover, the increases in SOE PhD program sizes were more pronounced than for the CAS, especially in applications. In the first year of the program, for example, applications to SOE PhD programs increased from 133 in the previous year to 170 (a 28% increase), while applications to CAS PhD programs actually decreased from 2,175 to 1,920 (a 12% decrease). After the PFP was suspended, applications for the SOE declined, while CAS applications remained steady.

Descriptive trends in numbers of applications and enrollments for SOE and CAS PhD programs.
Figure 2 highlights descriptive trends for selected characteristics that may be of interest to policy makers or institutional actors seeking to evaluate the extent to which the PFP may have changed the characteristics of the applicant and enrollee pool. Especially notable is the increase in the proportion of SOE PhD program applicants who identify as Black, growing from 4.5% of all applicants to 11.2% of all applicants in the first year of the scholarship (a 149% increase). This contrasts with the relatively stable proportion of applicants to CAS programs who identify as Black. The proportion of SOE program applicants who identify as Black decreases after the treatment period ends, suggesting that the deviation from the trend may plausibly be attributable to the PFP. In the period before the introduction of the PFP, there are no clearly observable pretreatment trends in the percent of applicants identifying as Black, providing evidence to support the parallel trends assumption. We also observe a strong uptick during the first treatment year of the percent of SOE enrollees who identify as Black, and again see a relatively flat trend among the CAS comparison programs. Figure 2 also demonstrates a small uptick in the portion of SOE program applicants/enrollees identifying as Latinx, and modest increases in average quantitative GRE scores during the treatment years, compared with no clear changes for the CAS cohorts.

Descriptive trends in select characteristics of applicants and enrollees for SOE and CAS PhD programs.
Turning to the DD estimates, Table 2 displays the coefficients on the interaction term from the nonparametric DD model for each of several terms of interest. These represent the amount by which SOE PhD program applicant and enrollee cohorts changed relative to the average from the five preceding years, above and beyond any changes that occurred in the comparison group (CAS PhD programs). Columns I and IV display the estimates, standard errors, and significance levels of the DD treatment effect from the observed (nonbootstrapped) data for applicant and enrollee cohorts, while Columns II and V display p values associated with those same estimates from the bootstrapping procedure, and Columns III and VI display from randomization inference (RI). While the bootstrapping and RI procedures are more conservative and some estimates lose significance, the main results largely hold.
Difference-in-Differences Estimates on Characteristics of Interest
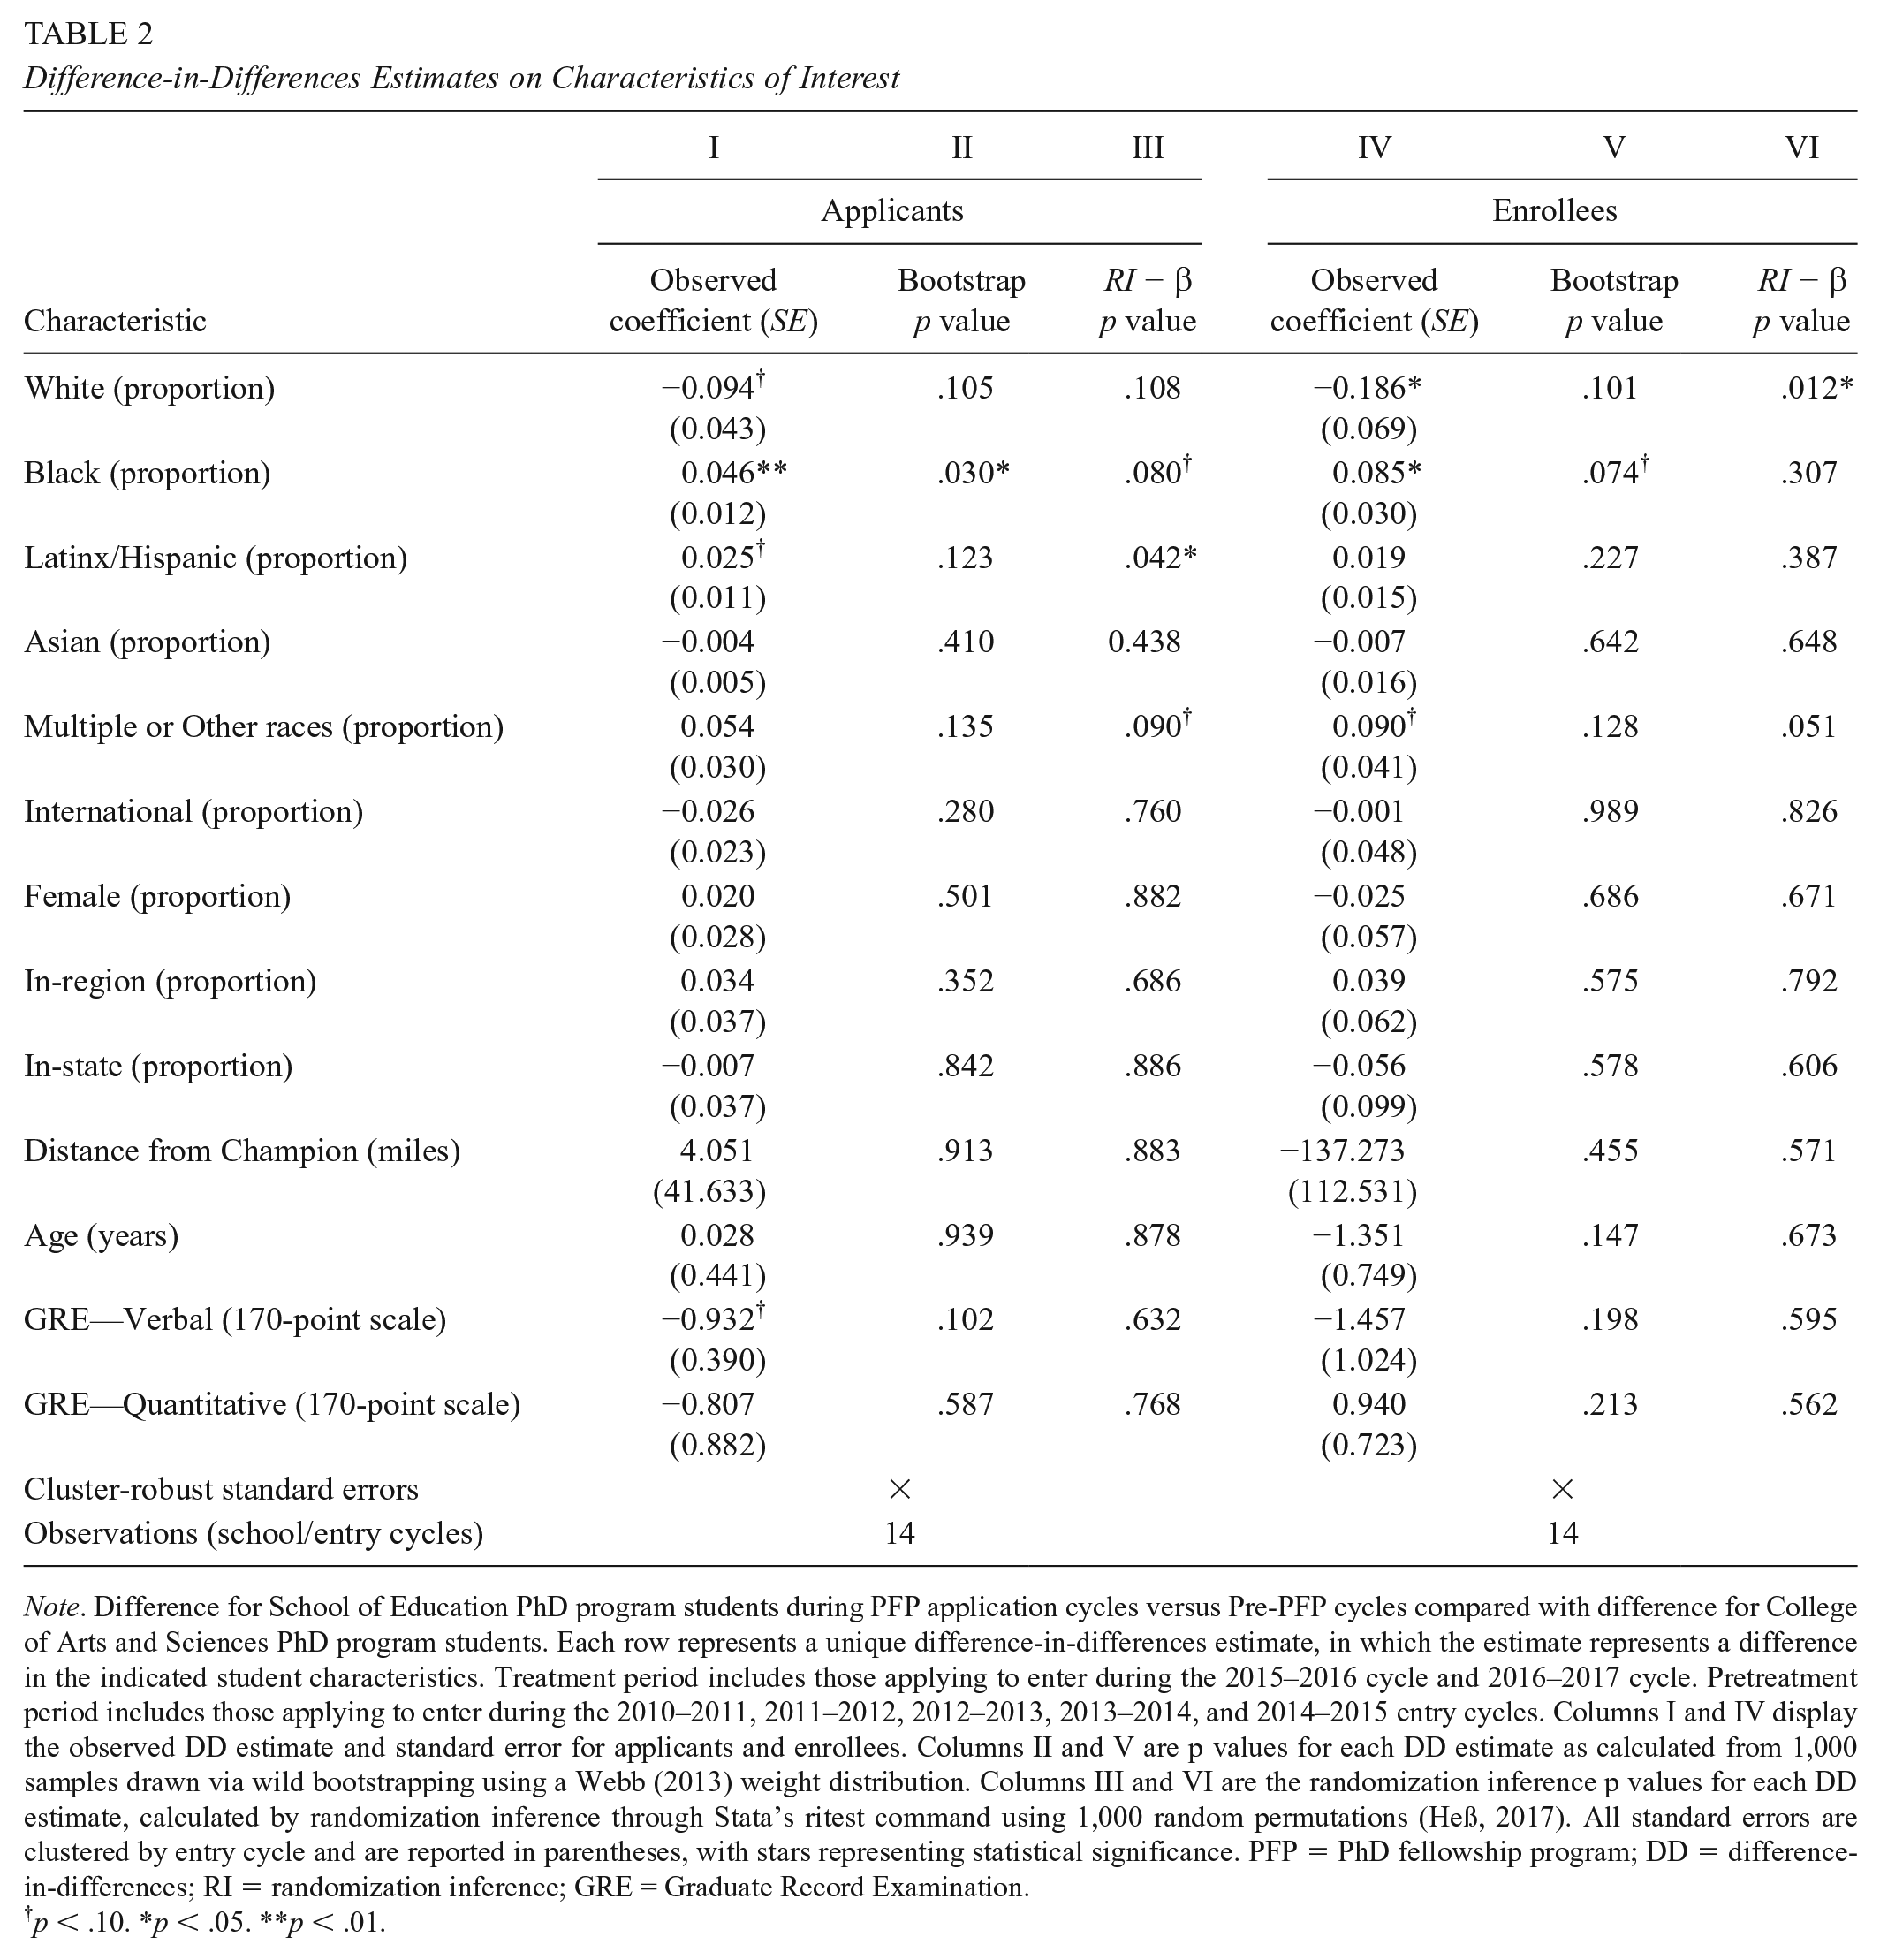
Note. Difference for School of Education PhD program students during PFP application cycles versus Pre-PFP cycles compared with difference for College of Arts and Sciences PhD program students. Each row represents a unique difference-in-differences estimate, in which the estimate represents a difference in the indicated student characteristics. Treatment period includes those applying to enter during the 2015–2016 cycle and 2016–2017 cycle. Pretreatment period includes those applying to enter during the 2010–2011, 2011–2012, 2012–2013, 2013–2014, and 2014–2015 entry cycles. Columns I and IV display the observed DD estimate and standard error for applicants and enrollees. Columns II and V are p values for each DD estimate as calculated from 1,000 samples drawn via wild bootstrapping using a Webb (2013) weight distribution. Columns III and VI are the randomization inference p values for each DD estimate, calculated by randomization inference through Stata’s ritest command using 1,000 random permutations (Heß, 2017). All standard errors are clustered by entry cycle and are reported in parentheses, with stars representing statistical significance. PFP = PhD fellowship program; DD = difference-in-differences; RI = randomization inference; GRE = Graduate Record Examination.
p < .10. *p < .05. **p < .01.
Estimates in Table 2 indicate that the most notable effects were on the proportion of applicants and enrollees who were Black (a 4.6 percentage point increase and 8.5 percentage point increase, respectively) above and beyond any changes in comparison programs. We also find a suggestively positive estimate on the percent of applicants who identify as Latinx (2.5 percentage points) and the proportion of enrollees identifying with multiple or other races (9.0 percentage points). Correspondingly, Table 2 shows that the increase in the proportion of applicants and enrollees who were Black (and the suggestive increase in Latinx and multiple/other race representation) is largely offset by a drop in the proportion of applicants and enrollees who were White (by 9.4 and 18.6 percentage points, respectively, though the statistical significance of these findings varies slightly across the bootstrapping and RI procedures). We also find no evidence of meaningfully reduced average quantitative or verbal GRE scores of applicants.
Estimates for select characteristics from our nonparametric event study model are presented in Figure 3 (estimates from additional characteristics can be found in Figures A1 and A2 in the appendix). As with the DD results, we find the clearest evidence of impact when considering the racial/ethnic diversity of the applicant and enrollee pools. Figure 3 shows that in the first year of the funding, the proportion of applicants who identified as Black grew by 6 percentage points more than the comparison group. Figure 3 also highlights a 9 and 11 percentage point increase (both significant at the .05 levels) in the proportion of applicants who identified with any racially or ethnically minoritized identity during the 2 years of the PFP. Again, we find little other evidence of effects for other student characteristics, such as GRE scores. Appendix Figures A3 and A4 show that these results are robust to all three of the potential comparison groups we tested. The consistency of results across all three potential comparisons lends particularly strong credibility to the conclusion that observed changes are attributable to the PFP and cannot be driven by any factors also affecting CAS PhD program students, social science program PhD students, or master’s program students within the CAS.

Event study estimates for select characteristics of applicants and enrollees: PhD program students in CAS as comparison group.
Finally, in Table 3 we use a DD approach, similar to that presented in Table 2, to explore changes among racially/ethnically minoritized applicants and enrollees. When looking at only the characteristics of racially/ethnically minoritized applicant and enrollee cohorts, we find no evidence to suggest changes in the gender, age, or location profiles of racially minoritized applicant and enrollee cohorts in the treatment years. Moreover, we find no evidence of substantial impact on the average verbal or quantitative GRE scores of racially/ethnically minoritized SOE PhD applicants and enrollees during the PFP treatment period relative to CAS. While small sample sizes limit the precision of these estimates, these results hold after undergoing bootstrapping and suggest that the PFP was unlikely to have induced substantial decreases in the average GRE scores of racially/ethnically minoritized applicants and enrollees. This, alongside the DD results in Table 2, suggests that, if the introduction of the PFP increased the racial/ethnic diversity of the applicant and enrollee pools, it did not lower student academic preparation as proxied by the GRE scores. In Appendix Table A2, we take a similar approach to explore changes among Black applicants and enrollees, as they are the racial/ethnic group that appears most responsive to the introduction of the PFP (as evidenced by both DD and event study results). Here, we similarly find no noticeable evidence that the introduction of the PFP resulted in meaningful declines in academic preparation among Black students.
Difference-in-Differences Estimates on Characteristics of Interest Among Racially/Ethnically Minoritized Applicants and Enrollees

Note. Difference for racially/ethnically minoritized School of Education PhD program students during PFP application cycles versus pre-PFP cycles compared with racially/ethnically minoritized College of Arts and Sciences PhD program students. Each row represents a unique difference-in-differences estimate, in which the estimate represents a change in the indicated student characteristics. Sample only includes racially/ethnically minoritized applicants(Columns I and II) and enrollees (Columns III and IV). This includes applicants and enrollees identifying as Black, Latinx/Hispanic, some other race, or multiple races. Treatment period includes those applying to enter during the 2015–2016 cycle and 2016–2017 cycle. Pretreatment period includes those applying to enter during the 2010–2011, 2011–2012, 2012–2013, 2013–2014, and 2014–2015 entry cycles. Columns I and IV display the observed DD estimate and standard error for applicants and enrollees. Columns II and V are p values for each DD estimate as calculated from 1,000 samples drawn via wild bootstrapping using a Webb (2013) weight distribution. Columns III and VI are the randomization inference p values for each DD estimate, calculated by randomization inference through Stata’s ritest command using 1,000 random permutations (Heß, 2017). All standard errors are clustered by entry cycle and are reported in parentheses, with stars representing statistical significance. PFP = PhD fellowship program; DD = difference-in-differences; GRE = Graduate Record Examination; RI = randomization inference.
p < .10. *p < .05. **p < .01.
Results From Student Survey
Considerations When Applying to Doctoral Studies
Respondents first answered a series of questions about the relative importance of various factors that influenced the institutions where they had decided to apply to PhD programs. Respondents rated each factor on a scale of 1 (not a factor) to 4 (major factor). Table 4 displays the factors, from the highest overall rating to the lowest. Financial considerations weighed heavily on students’ minds when deciding where to apply, accounting for 3 of the 5 most highly rated factors. Given that the goal of the fellowship was to attract new students to SOE, Table 4 provides reason to believe that providing more and stronger scholarships and stipends would be particularly meaningful in inducing students to apply, given the importance respondents placed on financial considerations.
Importance Placed on Various Factors When Considering Where to Apply

Note. Categories are sorted by overall importance, as rated by students, with the most important categories listed first. In Columns II to IV, standard deviations are reported in parentheses. Column V reports the difference between racially/ethnically minoritized students and nonracially/ethnically minoritized students, with p values from two-sided t tests reported in parentheses.
Moreover, Table 4 also provides some suggestive evidence that racially/ethnically minoritized students applying to doctoral programs may be even more responsive to the introduction of funding inducements such as the PFP. While the small sample size lacks power to find statistical significance, we do observe suggestive differences in the weight that racially/ethnically minoritized students place on financial considerations. Most notably, racially/ethnically minoritized students placed greater importance on the stipend amount (a rating 0.39 points higher) and the availability of scholarships (a rating 0.50 points higher) than their nonracially/ethnically minoritized peers, the two highest differences of any factors. If the PFP aimed to increase the racial/ethnic diversity of applicants, this may offer one explanation of why—racially/ethnically minoritized prospective students may have been disproportionately attracted by the offer of funding, offering a potential mechanism through which the PFP may have helped attract a more racially/ethnically diverse pool of applicants.
Considerations When Deciding on Program to Enroll
The survey next asked students to think back to when they were deciding where to enroll in graduate school and to compare Champion University with another institution they most seriously considered attending; respondents rated Champion University on a scale of 1 (Champion was much less appealing than other program) to 5 (Champion was much more appealing than other program). In Table 5, we order these from most to least favorable for Champion. Overall, Table 5 highlights that students viewed Champion to be most competitive in terms of financial considerations, compared with other institutions vying for their enrollment, with Champion’s four most highly ranked factors all financial in nature. As might be expected, those who were offered funding from Champion viewed the financial factors more favorably than students who did not receive funding. Conversely, students who received funding actually viewed the reputation of Champion and their academic department less favorably than those who did not receive funding. Since these students all decided to enroll, this suggests that the financial advantages for students who received funding may have helped Champion overcome less favorable ratings in some academic and personal criteria.
How Champion University Compared With Other Institutions When Deciding Where to Enroll

Note. Categories are sorted by overall rating, as rated by students, with the most important categories listed first. In Columns II to IV, standard deviations are reported in parentheses. Column V reports the difference between students offered funding and students not offered funding, with p values from two-sided t tests reported in parentheses.
Experience in Program
While an implicit goal of the PFP was to attract and enroll more racially/ethnically minoritized applicants, the survey also asked a series of questions about students’ experiences once in graduate school at Champion to see how the PFP may have impacted their experience in graduate school. Table 6 displays students’ level of satisfaction (from 1 to 5) on a variety of factors, from least satisfied to most satisfied. Table 6 highlights that students who received funding were, in fact, more satisfied with their financial experience in graduate school. Students who received funding reported that they were more satisfied with their availability of health care and mental health services (both offered and highly subsidized as part of the PFP) and their overall financial situation. For additional context, it is worth noting that students who entered in the PFP cohorts (2015–2016 and 2016–2017) make up the majority of survey respondents who received funding, whereas those cohorts comprise slightly less than half of survey respondents who did not receive funding.
Student Satisfaction Ratings of Aspects of Experience in Graduate School

Note. Categories are sorted by overall satisfaction, as rated by students, with the most important categories listed first. In Columns II to IV, standard deviations are reported in parentheses. Column V reports the difference between students offered funding and students not offered funding, with p values from two-sided t tests reported in parentheses.
Students also responded to questions about how many hours per week they worked while in graduate school to provide a tangible sense of how funding may have changed their experience. As Table 6 shows, respondents with funding averaged 2.62 more hours per week on work related to their degree. Their outside-of-school workload, though, was substantially less: Students with funding worked 7.21 hours per week less in jobs not related to their program, and 8.66 hours per week less during the summer. Interestingly, students who received funding were not necessarily more satisfied with all other aspects of their graduate experience, suggesting that a fellowship, while important in the decision to apply and enroll, may not necessarily be a panacea that improves all other aspects of the graduate student experience.
Limitations
As with many studies focusing on a policy implemented at a single institution, our study faces a number of limitations. First, the number of students who receive the PFP is relatively small and the number of eligible cohorts is only two, which means that we are limited in our sample size and thus statistical power. Analyses of institutional policies at a school level such as the PFP always face limitations regarding statistical power, yet such institutional policies can be important to study nonetheless. We attempt to alleviate concerns about small sample sizes through our use of wild bootstrapping and randomization inference, as has become increasingly common in studies with smaller sample sizes and fewer treated units. Moreover, we find the existence of statistical significance for key results even with these limitations to statistical power to be especially compelling.
Second, data from a single institution may raise questions about generalizability; however, given that Champion is a large, public, research intensive university in a racially and ethnically diverse state, we believe that Champion offers several advantages as a relatively representative setting for a study of this nature.
Finally, the PFP as a policy incorporated multiple components, including tuition waivers, health care, paid assistantships, and an accompanying marketing campaign to spread the message about the PFP. As it is impossible for us to disentangle the component parts, we caution against generalizing to programs that may not incorporate all the aspects of the PFP; it may be plausible, for example, that particular aspects such as the marketing or the health care benefits played a key role in the policy’s success, and that the PFP could not have had the same outcomes without the marketing.
Discussion
Taken together, these findings provide evidence supporting the hypothesis that PhD stipends and tuition waivers can increase the number and racial/ethnic diversity of both program applicants and enrollees. The growth in the number of program applicants during the treatment period is consistent with a broad body of literature on the role of financial aid and debt in shaping graduate school decision-making (e.g., English & Umbach, 2016; Kallio, 1995; Weiler, 1994).
By increasing the size of the applicant pool, the funding initiative had the potential to aid graduate admissions committee members in their efforts to find talented students whose research interests were well-suited for the program. For instance, this might occur if the funding initiative increased awareness of the program among students with research interests in education but who might have otherwise applied to programs in related social science and human services fields (e.g., sociology, public administration, social work). Alternatively, if the applicants induced to apply as a result of the funding initiative were not well aligned with institutional priorities, such a rise in applications may principally reflect an increased burden for graduate admission committees. These factors underscore the importance of understanding shifts in the composition of program applicant and enrollee cohorts during the years of the funding initiative.
In particular, this type of intervention appears to have its strongest impact on inducing Black students to both apply and enroll, with more modest increases in applications from Latinx/Hispanic students. Consequently, this study highlights a potential opportunity to reach racially and ethnically minoritized populations that have historically been and continue to be underrepresented within doctoral education. Notably, the elevated rates of application and enrollment subsided in the years when the fellowship program was discontinued. Such responsiveness to the availability of the fellowship suggests that maintaining the suite of financial resources (e.g., stipend, tuition waiver, subsidized health care) is necessary to attract students. While the literature and our student survey both support the implication that the availability of such financial resources was meaningful for potential students, particularly Black and Latinx/Hispanic students, it is possible that another program attribute—the marketing campaign associated with the PFP—also played a role. However, despite the continued use of SOE marketing that highlighted racially/ethnically minoritized students even after the PFP ended, the event study estimates shown in Figure 3 reveal that the significant, positive estimates do not persist past the termination of the PFP, suggesting that such marketing efforts alone were not effective at producing the same outcomes as those achieved under the PFP.
Given the strong reliance on GRE scores in graduate admissions for many PhD programs (Posselt, 2016), we also examined the effects of the financial initiative on GRE scores of applicants and enrollees. At the same time, we acknowledge the limitations of GRE scores as proxies for student academic preparation and the growing GRE-optional movement in graduate admissions (Owens et al., 2020). We find little evidence of changes in GRE scores during the treatment period among enrollees. Thus, these findings suggest that during the years of the PFP, Champion University’s SOE increased racial/ethnic diversity while maintaining fairly consistent average GRE scores for incoming PhD students. Moreover, when only looking at the GRE scores of racially/ethnically minoritized applicants and enrollees, we detect no significant decrease in GRE scores. This finding runs counter to misperceptions that efforts to increase diversity necessarily lead to decreasing admissions standards (e.g., Sander & Taylor, 2012). Instead, these results provide encouraging evidence that Champion University was able to increase student diversity among its PhD applicant pool and student population while maintaining GRE scores of admitted and entering students.
Evidence from a survey of current doctoral students at Champion University’s SOE offers some insight into the mechanisms by which these shifts occurred. For instance, relative to other institutions considered during their PhD application process, students rated Champion University more highly on financial dimensions, but not on other factors. This finding suggests that the financial initiative may have played a strong role in attracting students who otherwise would not necessarily have viewed Champion University as favorably as other options for doctoral study. The survey results also indicate that racially/ethnically minoritized students placed greater weight on scholarships and stipends when considering where to apply than their nonracially/nonethnically minoritized peers. The increased importance placed on scholarships and stipends may help account for the elevated responsiveness the PFP observed for racially/ethnically minoritized students, and Black students in particular, in DD and event study analyses.
Finally, while the focus of this study was on application and enrollment behavior, it is notable that students receiving funding shared different levels of satisfaction and different lived experiences once in graduate school from those who did not receive funding. This finding is especially relevant for prospective students, who base their application and enrollment decisions partially on their assumptions about the experiences that they anticipate in graduate school. These results help us to better understand students’ decision making regarding where to apply and attend graduate school, in spite of imperfect information and limited capacity to fully weigh all relevant factors in their decisions. Since financial factors are likelier more clearly measurable and allow for cleaner comparisons with other potential school options than other considerations (e.g., “fit” or “prestige”), prospective students may be particularly reliant on financial considerations when deciding where to apply and enroll. While outside the scope of this study, these survey results also raise important questions motivating additional studies on the impact of funding on PhD student experiences and success once in their program.
Implications
These findings offer several implications for policy makers, researchers, and practitioners alike. Importantly, the results suggest that comprehensive financial aid packages for PhD programs that include stipend support, tuition waivers, and subsidized health care have the potential to increase overall application volume of applications, as well as applications specifically from racially/ethnically minoritized students, especially Black students. These findings point to PFP-type awards for PhD students as one potential mechanism for meeting federal, state, and institutional goals of diversifying doctoral education, especially along racial/ethnic dimensions. The results of this study may be particularly relevant for public institutions in states with affirmative action bans, where prior research has shown declining enrollment of racially/ethnically minoritized graduate students following the adoption of such bans (Garces, 2012).
At the same time, it is clear that further research is necessary along several dimensions. First, given that this study only examines PhD study in the field of education, it would be valuable to examine outcomes for similar initiatives in other types of doctoral programs. Types of programs that could be of particular interest include those in STEM fields, where problems of racial/ethnic underrepresentation are particularly acute, and the humanities, where fully funded programs are often scarce. Second, while this study focuses on a suite of financial inducements (e.g., stipend, tuition waiver, subsidized health care), there is likely value in seeking to separately assess the relative contribution of each component of the aid package. Such an examination may identify ways in which financially constrained institutions can most efficiently target their resources. Alternatively, closer examinations may confirm that students are most responsive to the combination of multiple forms of financial support, echoing findings from studies of undergraduate programs like the City University of New York’s ASAP program (Scrivener et al., 2015). Third, building on previous research regarding differences in graduate school decision-making by race/ethnicity (e.g., Perna, 2004), it would be valuable for future work to examine additional nonfinancial factors that play a role in the application and enrollment choices of prospective graduate students. Research in this vein may help identify methods for increasing the application and enrollment of student populations for whom we detected less clear impacts in response to PFP.
Finally, this study offers several lessons and considerations with respect to institutional practices. First, while our findings largely focus on admissions and enrollment decisions, it is also important for universities to ensure that they provide supportive, inclusive climates for the students that PFP-type programs attract, particularly, those from racially/ethnically minoritized backgrounds. Thus, before initiating a PFP-type program, institutions would be wise to examine other aspects of department culture and practices, to ensure that the environment is one in which the success of racially/ethnically minoritized students is well supported. The survey findings that PFP recipients were no more satisfied with nonfinancial aspects of their graduate experience than non-PFP recipients highlight that financial support alone is not enough to build an environment that fosters student success, reinforcing the importance of institutional practices above and beyond financial support. Second, the results from Champion University highlight the importance of sustained funding for financial aid initiatives. As is evident in Figures 1 and 2, increases in applicants were highly responsive to the availability of PFP awards, with steep declines in the year the PFP was discontinued. These results suggest that a short-term provision of PFP benefits will only yield short-term changes in applicant behaviors. However, for institutions hoping to leverage financial support programs to increase the size of their applicant pool and diversity of their PhD student populations, these results provide reason for optimism.
Footnotes
Appendix
Difference-in-Differences Estimates (Posttreatment Period as Comparison)

| Characteristic | I |
II |
III |
IV |
IV |
VI |
|---|---|---|---|---|---|---|
| Applicants | Enrollees | |||||
| Observed coefficient (SE) | Bootstrap p value | RI − β p value | Observed coefficient (SE) | Bootstrap p value | RI − β p value | |
| White (proportion) | 0.032(0.077) | .626 | .796 | −0.126(0.183) | .530 | .153 |
| Black (proportion) | 0.030(0.014) | .093 † | .338 | 0.119(0.058) | .063 † | .131 |
| Latinx/Hispanic (proportion) | 0.012 † (0.004) | .055 † | .458 | −0.051*(0.016) | .043* | .331 |
| Asian (proportion) | −0.010(0.009) | .353 | .124 | 0.001(0.014) | .916 | .685 |
| Multiple or Other races (proportion) | 0.020(0.057) | .688 | .372 | −0.004(0.100) | .902 | .671 |
| International (proportion) | −0.084*(0.015) | .051 † | .434 | 0.062(0.053) | .273 | .599 |
| Female (proportion) | 0.023(0.035) | .591 | .880 | −0.108(0.064) | .061 † | .445 |
| In-region (proportion) | 0.092*(0.024) | .049* | .194 | −0.060(0.027) | .108 | .610 |
| In-state (proportion) | 0.035(0.047) | .432 | .658 | −0.166(0.105) | .185 | .467 |
| Distance from Champion (miles) | −17.614(60.872) | .750 | .962 | 24.741(129.884) | .719 | .678 |
| Age (years) | 0.992 † (0.386) | .063 † | .708 | 0.920(3.062) | .602 | .689 |
| GRE–Verbal (170-point scale) | 0.805(0.672) | .186 | .726 | −1.351(1.304) | .471 | .575 |
| GRE—Quantitative (170-point scale) | 0.212(1.218) | .811 | .926 | 2.942(1.299) | .065 † | .373 |
| Cluster-robust standard errors | × | × | ||||
| Observations (school/entry cycles) | 8 | 8 | ||||
Note. Difference for School of Education PhD program students during PFP application cycles versus post-PFP cycles compared with difference for College of Arts and Sciences (CAS) PhD program students. Each row represents a unique difference-in-differences estimate, in which the estimate represents a change in the indicated student characteristics. Treatment period includes those applying to enter during the 2015–2016 cycle and 2016–2017 cycle. Posttreatment period includes those applying to enter during the 2017–2018 and 2018–2019 entry cycles. Columns I and IV display the observed DD estimate and standard error for applicants and enrollees. Columns II and V are p values for each DD estimate as calculated from 1,000 samples drawn via wild bootstrapping using a Webb (2013) weight distribution. Columns III and VI are the randomization inference p values for each DD estimate, calculated by randomization inference through Stata’s ritest command using 1,000 random permutations (Heß, 2017). All standard errors are clustered by entry cycle and are reported in parentheses, with stars representing statistical significance. PFP = PhD fellowship program; DD = difference-in-differences; RI = randomization inference ; GRE = Graduate Record Examination.
p < .10. *p < .05. **p < .01.
Notes
Authors
WALTER G. ECTON is a PhD candidate in the Department of Leadership, Policy, and Organizations at Vanderbilt University. His research focuses on the intersections between high school, higher education, and the workforce, with a specific focus on Career and Technical Education (CTE) in both the K–12 and higher education spaces.
CHRISTOPHER T. BENNETT is a PhD candidate in the Department of Leadership, Policy, and Organizations at Vanderbilt University. His research examines the ways that higher education policies can influence the trajectories of individuals and institutions, with a particular emphasis on students who have been historically underrepresented in higher education.
H. KENNY NIENHUSSER is an associate professor in the Higher Education & Student Affairs Program in the Neag School of Education at the University of Connecticut. His research examines the origins of public policies and their implementation environments that affect the postsecondary education access of minoritized youth in the United States.
MILAGROS CASTILLO-MONTOYA is an associate professor of Higher Education and Student Affairs in the Educational Leadership Department at the Neag School of Education in the University of Connecticut. Her research focuses on educational equity for first-generation college students, as well as racially minoritized students.
SHAUN M. DOUGHERTY is an associate professor of Public Policy & Education at Vanderbilt’s Peabody College. His research emphasizes the use of quantitative research methods to evaluate the impact of educational policies and programs, including understanding how the requirements, incentives, and behaviors that those policies produce develop human capital.