
Abstract
The Classroom Assessment Scoring System (CLASS) is a widely administered measure of classroom quality that assesses teacher-child interactions in the domains of Emotional Support, Classroom Organization, and Instructional Support. We use data from an evaluation of state-funded prekindergarten provided to 684 children from families with low incomes (Mage = 57.56 months, 48% female) to examine the extent to which CLASS scores vary over the course of an observational period within a single day and investigate whether this variability is related to children’s school readiness at the end of the preschool year, holding constant two additional measures of quality. Teacher-child interactions in all three domains were moderately stable. Mean Classroom Organization was positively related to math, and variability in Classroom Organization was negatively related to literacy. Mean Instructional Support was negatively associated with language. Findings have implications for programs that utilize the CLASS to make high-stakes decision and inform professional development.
Keywords
Income disparities in children’s school readiness skills are key contributors to pervasive achievement gaps (Burchinal et al., 2011; Durham et al., 2007; von Hippel et al., 2018). Policy efforts concerning early childhood education (ECE), such as increasing access to state-funded prekindergarten programs implemented within Quality Rating and Improvement Systems (QRIS), have been initiated to support school readiness skills and close achievement gaps (Barnett et al., 2018). One specific feature of such programs that is intended to promote children’s learning is high-quality teacher-child interactions (Sabol & Pianta, 2015). However, effects of teacher-child interactions on children’s outcomes, as measured by the widely used Classroom Assessment Scoring System (CLASS), are consistently small (Keys et al., 2013; Perlman et al., 2016) or null (Guerrero-Rosada et al., 2021). Recent work has begun to reconsider the ways in which CLASS scores are utilized in analyses (e.g., Hatfield et al., 2016). For instance, researchers argue that scores in the mid-range of the CLASS may not be picking up on meaningful differences in the quality of children’s experiences (Burchinal, 2018), and capturing subtle inconsistencies in teacher-child interactions over the course of a day may be a more sensitive indicator than average levels of quality (Brock et al., 2018; Curby et al., 2013). Yet the consequences of variable teaching practices during the preschool year have not been fully explored across CLASS domains and school readiness outcomes, leaving unanswered questions as to how a predominant measure of quality can be used most effectively to inform professional development and policy. The present study begins to fill this gap by analyzing the links between variability in the CLASS domains of Emotional Support, Classroom Organization, and Instructional Support and growth in literacy, language, and math in preschool among a sample of children from families with low incomes. Importantly, analyses control for two additional measures of quality (mean CLASS scores and state QRIS scores) to determine whether variability emerges as a distinct indicator of quality and predictor of outcomes.
Preschool Classroom Quality and the CLASS
Classroom quality in ECE settings is often conceptualized in terms of structure-oriented indicators (e.g., class size, teacher education) and processes-oriented features (e.g., warmth, stimulation) that create optimal learning opportunities (Burchinal et al., 2014). Although both are important, classroom processes serve as the primary mechanisms of development and learning (Mashburn et al., 2008). Specifically, effective teacher-child interactions have been identified as a key ingredient of process quality that promotes school readiness (Hamre & Pianta, 2007; Hong et al., 2019). Moreover, because observational measures of process quality have been recognized as an essential component of ECE quality, they are increasingly becoming integrated into state-funded prekindergarten programs (Friedman-Krauss et al., 2020). Currently, the CLASS is the dominant observation system used in research, practice, and policy to assess process quality. It is based on theory suggesting that high-quality interactions support development through providing children with a sense of security and feelings of connectedness (Ainsworth, 1989; Hamre & Pianta, 2001), ensuring behaviors and instructional activities are well managed (Cameron et al., 2005), and scaffolding learning and understanding of complex concepts (Davis & Miyake, 2004; Vygotsky, 1991). The CLASS measures three different aspects of teacher-child interactions (Pianta et al., 2008). Emotional Support indicates the degree of warmth and positivity within the classroom as well as the teacher’s responsiveness and regard for student perspectives. Classroom Organization denotes the effectiveness of behavior management strategies, provision of activities, and overall productivity within the classroom. Instructional Support is represented by the quality of instruction and feedback provided by the teacher.
Theoretical work emphasizes connections between the CLASS domains and children’s school readiness (Downer et al., 2010). Although some empirical studies have documented relations between high-quality teacher-child interactions and the development of school readiness using the CLASS (e.g., Araujo et al., 2016; Burchinal et al., 2008; Hamre et al., 2014; Howes et al., 2008; Leyva et al., 2015), replication work and meta-analyses reveal null or weak associations between mean CLASS scores and child outcomes, with effect sizes falling between .04 and .09 (Guerrero-Rosada et al., 2021; Keys et al., 2013; Perlman et al., 2016; Weiland et al., 2013). Further, data suggest that only a small percentage of children actually experience high-quality instruction. For instance, one study revealed that between 76% and 87% of classrooms failed to reach the threshold of classroom quality necessary for supporting school readiness development (Hatfield et al., 2016), suggesting that teachers are unlikely to maintain consistent, high-quality interactions with children throughout the day. Indeed, most CLASS scores tend to fall within the low- to mid-range of the distribution for Classroom Organization and Instructional Support, indicating that teachers fluctuate in their provision of high- and low-quality behaviors (La Paro et al., 2009). Together, these factors may be limiting the predictive validity of the CLASS for child outcomes.
Reconsidering the ways in which CLASS scores are conceptually and methodologically used in research and practice may help overcome these limitations. The CLASS procedure involves several 20-minute observations of teacher-child interactions within the same school day, and each observation is followed by 10-minutes of coding. Scores for each interval are assigned along a 7-point scale, with 1 or 2 indicating low quality, 3 to 5 indicating mid-range quality, and 6 or 7 indicating high quality. Typically, CLASS scores are averaged across these intervals for each domain (Emotional Support, Classroom Organization, and Instructional Support), eliminating variability between the intervals. These averages have been used to determine certain thresholds that are necessary to promote development (Burchinal et al., 2010; Hatfield et al., 2016), which have subsequently been incorporated into state and federal initiatives, including Head Start (U.S. Department of Health and Human Services, 2020). However, the relatively weak effect sizes documented in the extant literature has led many to question whether the use of the CLASS for these purposes is appropriate (Gordon & Peng, 2020; Mantzicopoulos et al., 2018; Mashburn, 2017). In addition to using mean scores, researchers argue that there may be meaningful variability captured in observational measures of classroom quality that are obscured with averages (e.g., Curby et al., 2013; LoCasale-Crouch et al., 2018).
Rationale for Examining Variability in CLASS Scores
Children’s development is shaped by their dynamic social interactions with adults—typically referred to as proximal processes (Bronfenbrenner & Morris, 2016). Adult caregivers help children make sense of the world through engaging in warm, supportive, and stimulating interactions, which promote children’s sense of security and foster a healthy attachment (Ainsworth et al., 1978). An important but often implicit feature of this model is the notion that interactions follow a predictable pattern to allow children to anticipate how their needs may be met by their caregiver. Thus, by definition, proximal processes need to be consistent in order to be effective (Bronfenbrenner & Morris, 1998). Extended to adults within the classroom, inconsistencies in the moment-to-moment interactions that children have with their teachers may create issues of mistrust, confusion, and missed opportunities, which could ultimately affect children’s development (Curby et al., 2009). For instance, children may be hesitant to participate in learning activities and take risks if they fear their teacher may react unpredictably. They may become distracted from a particular goal if their teacher is disorganized and lacks the ability to effectively facilitate learning activities. Finally, children may be unable to learn complex concepts and vocabulary if their teacher does not consistently scaffold at their level. These examples demonstrate how variability in teacher-child interactions may undermine children’s development through their withdrawal in learning (Vitiello et al., 2012). This type of variability is thought to be especially detrimental to children who are from families with low incomes (Tran & Winsler, 2011), perhaps because they are less likely to experience high-quality teacher-child interactions over the first few years of schooling (Pianta et al., 2007).
In addition to the conceptual argument, there are also methodological advantages to considering variability as an indicator of quality. It has been hypothesized that low levels of variability in mean scores on quality rating scales, particularly when it comes to distinguishing classrooms with scores in the mid-range, may be responsible for the underestimation of effects (Burchinal, 2018). In usual practice, collapsing CLASS scores across intervals to arrive at an average may mask meaningful differences between classrooms. Researchers have argued that the variability between observational intervals within a day may actually contain important information about children’s learning environments (e.g., Curby et al., 2011). For instance, Snow and Matthews (2016) contend that “consistent feedback to and interaction with students” is an essential component of high-quality teaching that fosters language and literacy skills in preschool and the early grades (p. 69). Moreover, a fundamental assumption underlying the CLASS framework is that high-quality teacher-child interactions are not only nurturing and responsive but also consistent (Bailey et al., 2013). The intent to measure the degree of consistency in teacher behaviors is also evident in the coding scheme outlined by the developers of the CLASS in the training manual (Pianta et al., 2008). Thus, the CLASS in its design offers the opportunity to capture variability by taking into consideration scores at each interval of observation.
Sources of Variability in CLASS Scores and Children’s Outcomes
Variability is conceptualized as fluctuations in the quality of teacher-child interactions that are due to systematic variation (Curby et al., 2011). A variety of methods have been implemented to measure such variability (Wang et al., 2020). The most commonly used technique is to quantify variability through the standard deviation (Curby et al., 2010). Yet another popular approach is to utilize generalizability theory (e.g., Mashburn et al., 2014; Praetorius et al., 2014). The goal of generalizability studies (G-studies) is to understand reliability and stability in ratings over time (Shavelson & Dempsey-Atwood, 1976). In essence, G-studies decompose variability in observational ratings of classroom quality into different components, their interactions, and measurement error. This partitioning of variance can inform decisions regarding the improvement of measures by helping to identify the optimal data collection strategy and scoring criteria for a desired reliability (Hill et al., 2012). For instance, results from one G-study yielded evidence that only 10% to 45% of the variance in kindergarten CLASS scores is attributed to the behaviors of teachers, with a large amount of variability not explained by teachers, lessons, or raters (Mantzicopoulos et al., 2018). These findings suggest that it may require more observations and raters to achieve accurate and stable ratings than is likely feasible in practice (Praetorius et al., 2014).
A growing body of literature has analyzed sources of variability in ratings of classroom quality as it relates to classroom schedules, routines, and activity types, using various methods. For instance, CLASS scores have been shown to vary by season (Buell et al., 2017), from lesson to lesson (Patrick & Mantzicopoulos, 2016), between subject areas (Cohen et al., 2018; Kook & Greenfield, 2020), by ECE program type (Bassok et al., 2021), and CLASS observations of shorter durations tend to be scored more favorably (Cash & Pianta, 2014). Additionally, researchers have documented significant variability in CLASS scores within a single day (Curby et al., 2010). Notably, CLASS scores within the domains of Classroom Organization and Instructional Support appear to decrease over the course of an observation period (Thorpe et al., 2020; Wang et al., 2020). Together, this research supports the existence of variability in teacher-child interactions over the day, some of which may be a function of classroom characteristics, such as teacher-to-child ratio and length of the school day (Von Suchodoletz et al., 2014), and some of which may be due to measurement “noise” (Casabianca et al., 2015). Evaluating whether variability is a distinct dimension of classroom quality that provides meaningful information about children’s learning environment beyond the aggregate approach of averaging CLASS scores may help clarify if observed fluctuations in teacher-child interactions are in fact representative of lower overall classroom quality. Thus, in the present study, we utilize the full distribution of CLASS scores within an observation period to explore variability in classroom quality within a single day and links to school readiness.
Few studies have investigated the stability of teacher–child interactions with regard to children’s academic trajectories, and evidence suggests there may be negative consequences of variability for children’s learning (Cash et al., 2019). Prior work using the CLASS to analyze variability within a single day has focused almost entirely on the Emotional Support domain (e.g., Curby et al., 2013). Results indicate that consistency (i.e., lack of variability) in Emotional Support over the day is positively associated with children’s language and rhyming skills, above-and-beyond mean level Emotional Support (Curby et al., 2013). In addition, Emotional Support consistency appears to be significantly related to fewer problem behaviors in preschool and kindergarten (Brock & Curby, 2014; Zinsser et al., 2013). In a recent study with an older sample, variability in Instructional Support was negatively related to math performance in elementary school (Sandilos et al., 2019). However, previous work has not investigated the effects of variability in classroom quality for all CLASS domains on school readiness indicators during the preschool year. Given the limited work in this area, it is impossible to draw conclusions about whether variability in CLASS scores can be considered a distinct indicator of quality that provides meaningful information beyond the mean, primarily because these effects have not been replicated across domains or samples with a robust set of control variables (Duncan et al., 2014).
The Present Study
In the present study, we had two research aims. The first aim was to determine the extent to which classrooms varied in Emotional Support, Classroom Organization, and Instructional Support over four observation intervals within a single day using the standard deviation approach. Based on previous research, we expected that CLASS scores would be moderately stable across intervals within a 2-hour observation period (Curby et al., 2010), and that quality in Classroom Organization and Instructional Support would vary considerably more than quality in Emotional Support (Thorpe et al., 2020; Wang et al., 2020). The second aim was to investigate whether variability in all three CLASS domains emerged as a distinct and more robust indicator of school readiness than average CLASS scores while taking into account two additional measures of quality (mean CLASS scores and state QRIS scores). We hypothesized that experiencing volatile Emotional Support in the form of inconsistent warmth and responsiveness from teachers may inhibit children’s ability to feel safe and take risks while participating in the learning process. A similar hypothesis was drawn for Classroom Organization, based on our assumption that children may disengage in learning when they are subjected to a chaotic environment where expectations are unclear. With regard to Instructional Support, we suspected that variability could actually promote development. Given that scores in this domain are typically low (e.g., Hamre, 2014; Hatfield et al., 2016), providing at least some mid- or high-quality interactions in otherwise rote instructional environments may be necessary for learning (Brock et al., 2018). To illustrate, interventions that have been successful in improving mean classroom quality tend to reduce variability in Emotional Support and Classroom Organization but increase variability in Instructional Support (Early et al., 2017). However, we left this hypothesis as exploratory based on the findings of one empirical study indicating the contrary (Sandilos et al., 2019).
Method
Participants
The sample for this study included three cohorts of children (N = 684; 48% female) across 180 preschool classrooms (M = 3.5 children per classroom) in 127 schools (M = 1.42 classrooms per school, M = 4.8 children per school) who participated in a larger study focused on evaluating the impacts of a state-funded prekindergarten program on children’s school readiness. The sample was racially and ethnically diverse and represented the broader area, with most parents identifying their children as Black/African American (43%) or White/Caucasian (32%). Children were eligible to participate in the larger evaluation study if they were at least 4 years old at the start of the preschool year (Mage = 57.56 months; SD = 3.76 months) and if their family incomes fell at or below 127% of the federal poverty line. Teacher demographics are presented in Table A1 of the appendix.
The larger evaluation study utilized a quasi-experimental design to compare school readiness between children in the state-funded prekindergarten group (67% of sample) who attended high-quality preschools rated as Level 3 or 4 on the state’s QRIS, and children in the comparison group who attended low-quality preschools rated as Level 1 or 2 (or not enrolled in the QRIS). Child care programs across eight counties in the state were invited to participate in the study if (1) they accepted child care development funds (CCDF) and their program was rated as Level 0, (not enrolled), 1, or 2 on the QRIS or (2) they were an approved state-funded prekindergarten provider rated as Level 3 or 4 on the QRIS. All parents who used CCDF vouchers in the comparison condition and all parents of children in the state-funded prekindergarten program were invited to participate. The analytic sample includes all children from the larger evaluation study.
Procedures
Trained research assistants administered direct assessments of literacy, vocabulary, and mathematics to children in the fall and spring, and parents filled out a demographic questionnaire in the fall of the preschool year. Classroom quality was observed by CLASS-certified research assistants during the winter of the preschool year. Families and teachers received a $20 compensation in the fall and spring for their participation.
Measures
School Readiness
Children’s school readiness was assessed with three measures of early academic skills.
Literacy
Literacy was measured through the Letter-Word Identification subtest of the Woodcock Johnson–IV (WJLW-IV; Schrank et al., 2014). The WJLW-IV subtest requires children to use their receptive and expressive literacy skills as they identify letters and words. The subtest contains 76 items grouped into 15 sets. Children reach ceiling once they respond incorrectly to six consecutive items to finish out a set. Raw scores ranged from 0 to 47 in the spring of preschool. The WJLW-IV has a reliability of .84 to .94 for children ages 2 to 7 years (Villarreal, 2015).
Language
Children’s receptive vocabulary was assessed via the Peabody Picture Vocabulary Test–fourth edition (PPVT-IV; Dunn & Dunn, 2007). Children are presented with four simultaneous images and are asked to point to a picture that represents the verbal cue provided by the assessor. The PPVT-IV includes 228 items grouped into 13 sets. Children must respond correctly to all but one item in the first set before moving forward with the task. Children reach the ceiling once they respond incorrectly to eight items incorrectly in a set. Raw scores ranged from 14 to 144 in the spring of preschool. The PPVT-IV has strong internal consistency (α = .94; Dunn & Dunn, 2007).
Math
Children’s math was assessed with the Applied Problems subtest of the Woodcock Johnson–IV (WJAP-IV; Schrank et al., 2014). The WJAP-IV subtest assesses quantitative knowledge and reasoning by requiring children to solve orally presented math problems. The subtest contains 55 items grouped into 14 sets. Children reach the ceiling once they respond incorrectly to five consecutive items to finish out a set. Raw scores ranged from 0 to 21 in the spring of preschool. The WJAP-IV has also demonstrated high reliability (Villarreal, 2015).
Preschool Classroom Quality
Classroom observations using the Pre-K CLASS (Pianta et al., 2008) were conducted to measure the quality of teacher-child interactions. The CLASS is composed of three domains that contain multiple dimensions: Emotional Support (positive climate, negative climate, teacher sensitivity, and regard for students perspectives), Classroom Organization (behavior management, productivity, and instructional learning formats), and Instructional Support (concept development, quality of feedback, and language modeling). Research assistants completed a two-day Pre-K CLASS training provided by Teachstone. After the training they were required to pass the CLASS reliability test and score within 80% of the master codes across five videos in order to become a certified CLASS observer. Certified CLASS observers rated classrooms on each of the dimensions using a 7-point scale (1 or 2 = low quality, 3 to 5 = mid quality, 6 or 7 = high quality) over four 20-minute intervals with 10 minutes of coding after each. These cycles took place over the course of roughly 2 hours in a single preschool day, either in the morning or afternoon, during the winter months (e.g., January through March).
Mean CLASS
Mean classroom quality for Emotional Support, Classroom Organization, and Instructional Support was calculated by first averaging each set of dimensions for a particular domain within intervals to arrive at an interval-specific domain score, and then averaging the interval-specific domain scores across the four intervals. The internal consistency for all three CLASS domain scores within the current sample was high: Emotional Support (α = .93), Classroom Organization (α = .90), and Instructional Support (α = .83). Previous findings show that mean scores on the CLASS are moderately correlated with the Early Childhood Environmental Rating Scale–Revised (r = .52 for Emotional Support, r = .40 for Instructional Support; La Paro et al., 2004), which is another widely used global scale for classroom quality in the field (Harms et al., 1998).
Variability in CLASS
Variability in classroom quality in Emotional Support, Classroom Organization, and Instructional Support was represented by the standard deviation between the four observation intervals. We calculated the average variance across intervals by subtracting each of the four interval-specific domain scores from the mean within a single CLASS domain, squaring the resulting values to put convert them to a positive scale, adding them together, and dividing by the number of observations minus one for each classroom (i.e., n − 1). The resulting value represented the average amount of variability within a classroom around the mean. This approach has the advantage of capturing the entire spread of an individual classroom’s score (Curby et al., 2013) and has been shown to produce similar estimates to other statistical methods of calculating variability (Wang et al., 2020).
State QRIS Scores
The state QRIS contains four levels that each build on the foundation of the previous level, resulting in significant quality improvements at each stage. High-quality programs are those that receive Level 3 and 4 ratings. The general criteria for achieving each level of quality within the QRIS are as follows: (1) health and safety needs of children are met, (2) environment supports children’s learning, (3) planned curriculum guides child development and school readiness, and (4) national accreditation is achieved. It is important to note, however, that the state QRIS does not incorporate CLASS scores to determine a program’s quality level. In previous research, scores on the state QRIS have shown modest associations with global classroom quality (Elicker et al., 2011; Lahti et al., 2015). We created a categorical variable to represent the state’s definition of high-quality (QRIS = 3 or 4), low-quality (QRIS = 1 or 2), and programs that were unrated (QRIS = 0) for analyses.
Covariates
Child age and sex (1 = female, 0 = male) were included as covariates because of the extant research demonstrating that older children and girls are more likely to have higher school readiness in preschool (Bornstein et al., 1998; Song et al., 2015). We also controlled for cohort, teacher-to-child ratio, teacher education level, teacher experience, and whether or not the teacher had a Child Development Associate (CDA) credential because of their potential influence on CLASS scores and the outcomes of interest (Von Suchodoletz et al., 2014).
Analytic Plan
To explore the extent to which classroom quality varied within a single day, we first ran unconditional multilevel models with CLASS scores at each of the four intervals nested within classrooms using the MIXED command in Stata 14 (StataCorp, 2015). The intraclass correlations (ICCs) from the unconditional models provided an indication of how correlated each interval was with each other over time, with a lower ICC signifying less consistency (i.e., greater variability) in classroom quality over the observation period within a day. Next, to examine whether variability in CLASS scores was a unique and more robust indicator of quality, we utilized structural equation modeling (SEM) to estimate a series of nested regression models that tested whether variability in classroom quality, computed as the average variance, significantly predicted continuous scores on school readiness outcomes holding constant child- and classroom-level covariates. In all models, mean CLASS scores and state QRIS scores were also included as covariates in order to investigate whether modeling variability contributed substantial information about children’s development above and beyond typical aggregated measures of classroom quality.
The ICCs for the school readiness outcomes at the classroom-level were high for literacy (.29), math (.16), and vocabulary (.15). Therefore, we clustered the standard errors within classrooms to handle the nonindependence of data. When the CLUSTER option is specified with SEM, Stata produces almost identical point estimates and standard errors as multilevel models using the MIXED command (Stapleton et al., 2016). To contextualize results within the broader field, which typically utilizes CLASS averages, we ran regression models in a stepwise fashion adding in the following covariates at each iteration: (1) child- and classroom-level covariates, (2) mean CLASS scores, and (3) variability in CLASS scores. By examining the pseudo R2, we isolated the amount of variance explained by each of the target variables. Regression models were estimated separately for each CLASS domain (Emotional Support, Classroom Organization, and Instructional Support), but outcomes and the covariance between outcomes were modeled simultaneously within the SEMs. The battery of child- and classroom-level covariates included all the aforementioned variables as well as children’s baseline skills at the fall of preschool, which enabled us to investigate residualized change in children’s school readiness at the end of preschool.
Missing Data
There was a small amount of missingness on the primary variables of interest. Only six classrooms (5%) were missing CLASS scores and four classrooms (4%) were missing state QRIS scores. Between 27 and 48 children (4%–7%) were missing data on fall school readiness assessments and between 82 and 97 children (12%–14%) were missing data on spring school readiness assessments. There was very little missing data on child covariates (<1%), but a fair amount of missing data on teacher-to-child ratio (23%) as well as teacher education and experience, and whether teachers had their CDA (56%–58%). Full-information maximum likelihood was used to account for missing data. It produces estimates that are less biased than listwise deletion and allows for all observations to inform model estimates (Acock, 2012).
Results
Descriptive statistics and bivariate correlations for primary study variables are presented in Table 1.
Descriptive Statistics and Correlations

Note. ES = Emotional Support; CO = Classroom Organization; IS = Instructional Support; QRIS = Quality Rating and Improvement System (0 = not rated, 1 = low-quality, 2 =high quality).
p < .05. **p < .01. ***p < .001.
Variability in CLASS Scores Within a Day
The first research aim examined the extent to which preschool CLASS scores varied during the observation period within a day. Means and standard deviations for Emotional Support, Classroom Organization, and Instructional Support at each of the four intervals indicated that classroom quality in all three domains decreased over the observation period within a day (Table 2). ICCs for the unconditional multilevel models at the within-classroom level were highest for Emotional Support (.80), followed by Classroom Organization (.72) and Instructional Support (.66), suggesting that CLASS scores at each interval were moderately correlated with each other over time. The lower ICC for Instructional Support indicated that quality in this domain was less consistent (i.e., more variable) than quality in Emotional Support and Classroom Organization during the day. Although there was a fair degree of stability in CLASS scores within classrooms, the remaining variance implied that fluctuations in quality that could be subsequently examined.
Interval-Specific Means, Standard Deviations, and Correlations for Classroom Quality by Domain (n = 180 Classrooms)
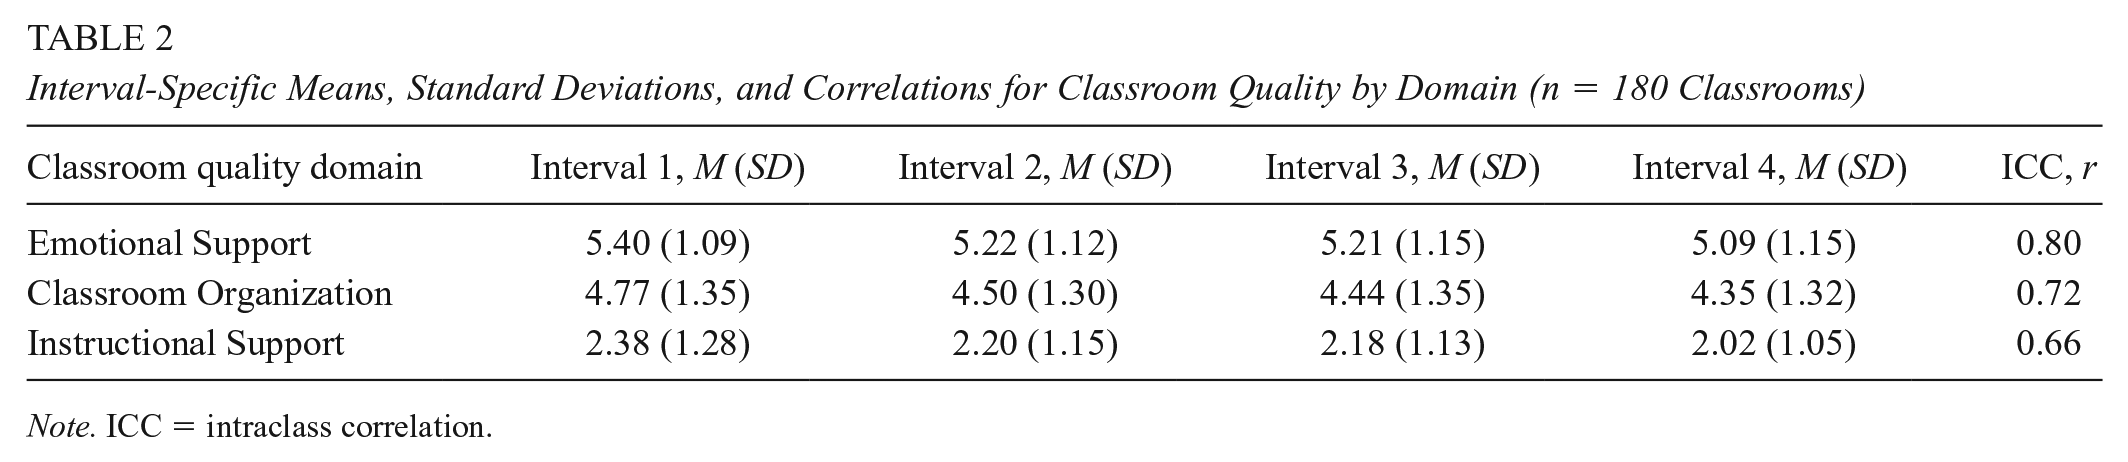
Note. ICC = intraclass correlation.
Variability in CLASS Scores and Children’s School Readiness
The second research aim investigated whether variability in CLASS scores during an observation period was related to children’s school readiness, after controlling for mean CLASS scores and state QRIS scores. Results from SEMs revealed that neither mean Emotional Support nor variability in Emotional Support were significantly related to any of the school readiness outcomes (Table 3). Mean Classroom Organization positively predicted spring math after accounting for child- and classroom-level covariates (b = 0.20, SE = 0.10, p = .04, Β = 0.07), such that children in classrooms that were generally productive and well managed had greater growth in math skills from fall to spring of the preschool year (Table 4). However, this association became only marginally significant after including variability in Classroom Organization in the model (b = 0.19, SE = 0.10, p = .06, Β = 0.06). Additionally, variability in Classroom Organization negatively predicted children’s literacy during the preschool year (b = −0.65, SE = 0.17, p < .001, Β = −0.09), holding mean Classroom Organization and the battery of child- and classroom-level covariates constant. Children demonstrated less growth in literacy skills from fall to spring of preschool when teachers were more variable, or less consistent, in setting expectations and engaging in behavior management strategies during the observation period (Table 4). However, mean Classroom Organization was not significantly related to children’s literacy skills. Furthermore, neither variability in Classroom Organization nor mean Classroom Organization were significantly related to children’s language skills (Table 4). Finally, mean Instructional Support negatively predicted children’s language skills both on its own (b = −1.75, SE = 0.59, p = .003, Β = −0.07) and when included in the model with variability in Instructional Support (b = −1.85, SE = 0.74, p = .01, Β = −0.08), holding child- and classroom-level covariates constant. Children demonstrated less growth in language from fall to spring of preschool when teachers engaged in more frequent conversations that required higher-level thinking. However, variability in Instructional Support was not significantly related to children’s language skills. Additionally, neither variability in Instructional Support nor mean Instructional Support were significantly related to children’s literacy or math outcomes (Table 5).
Results From Regression Models With Emotional Support Predicting School Readiness Outcomes

Note. Unstandardized betas reported; standard errors in parentheses. CLASS = Classroom Assessment Scoring System; QRIS = Quality Rating and Improvement System; CDA = Child Development Associate.
p < .10. *p < .05. **p < .01. ***p < .001.
Results From Regression Models With Classroom Organization Predicting School Readiness Outcomes
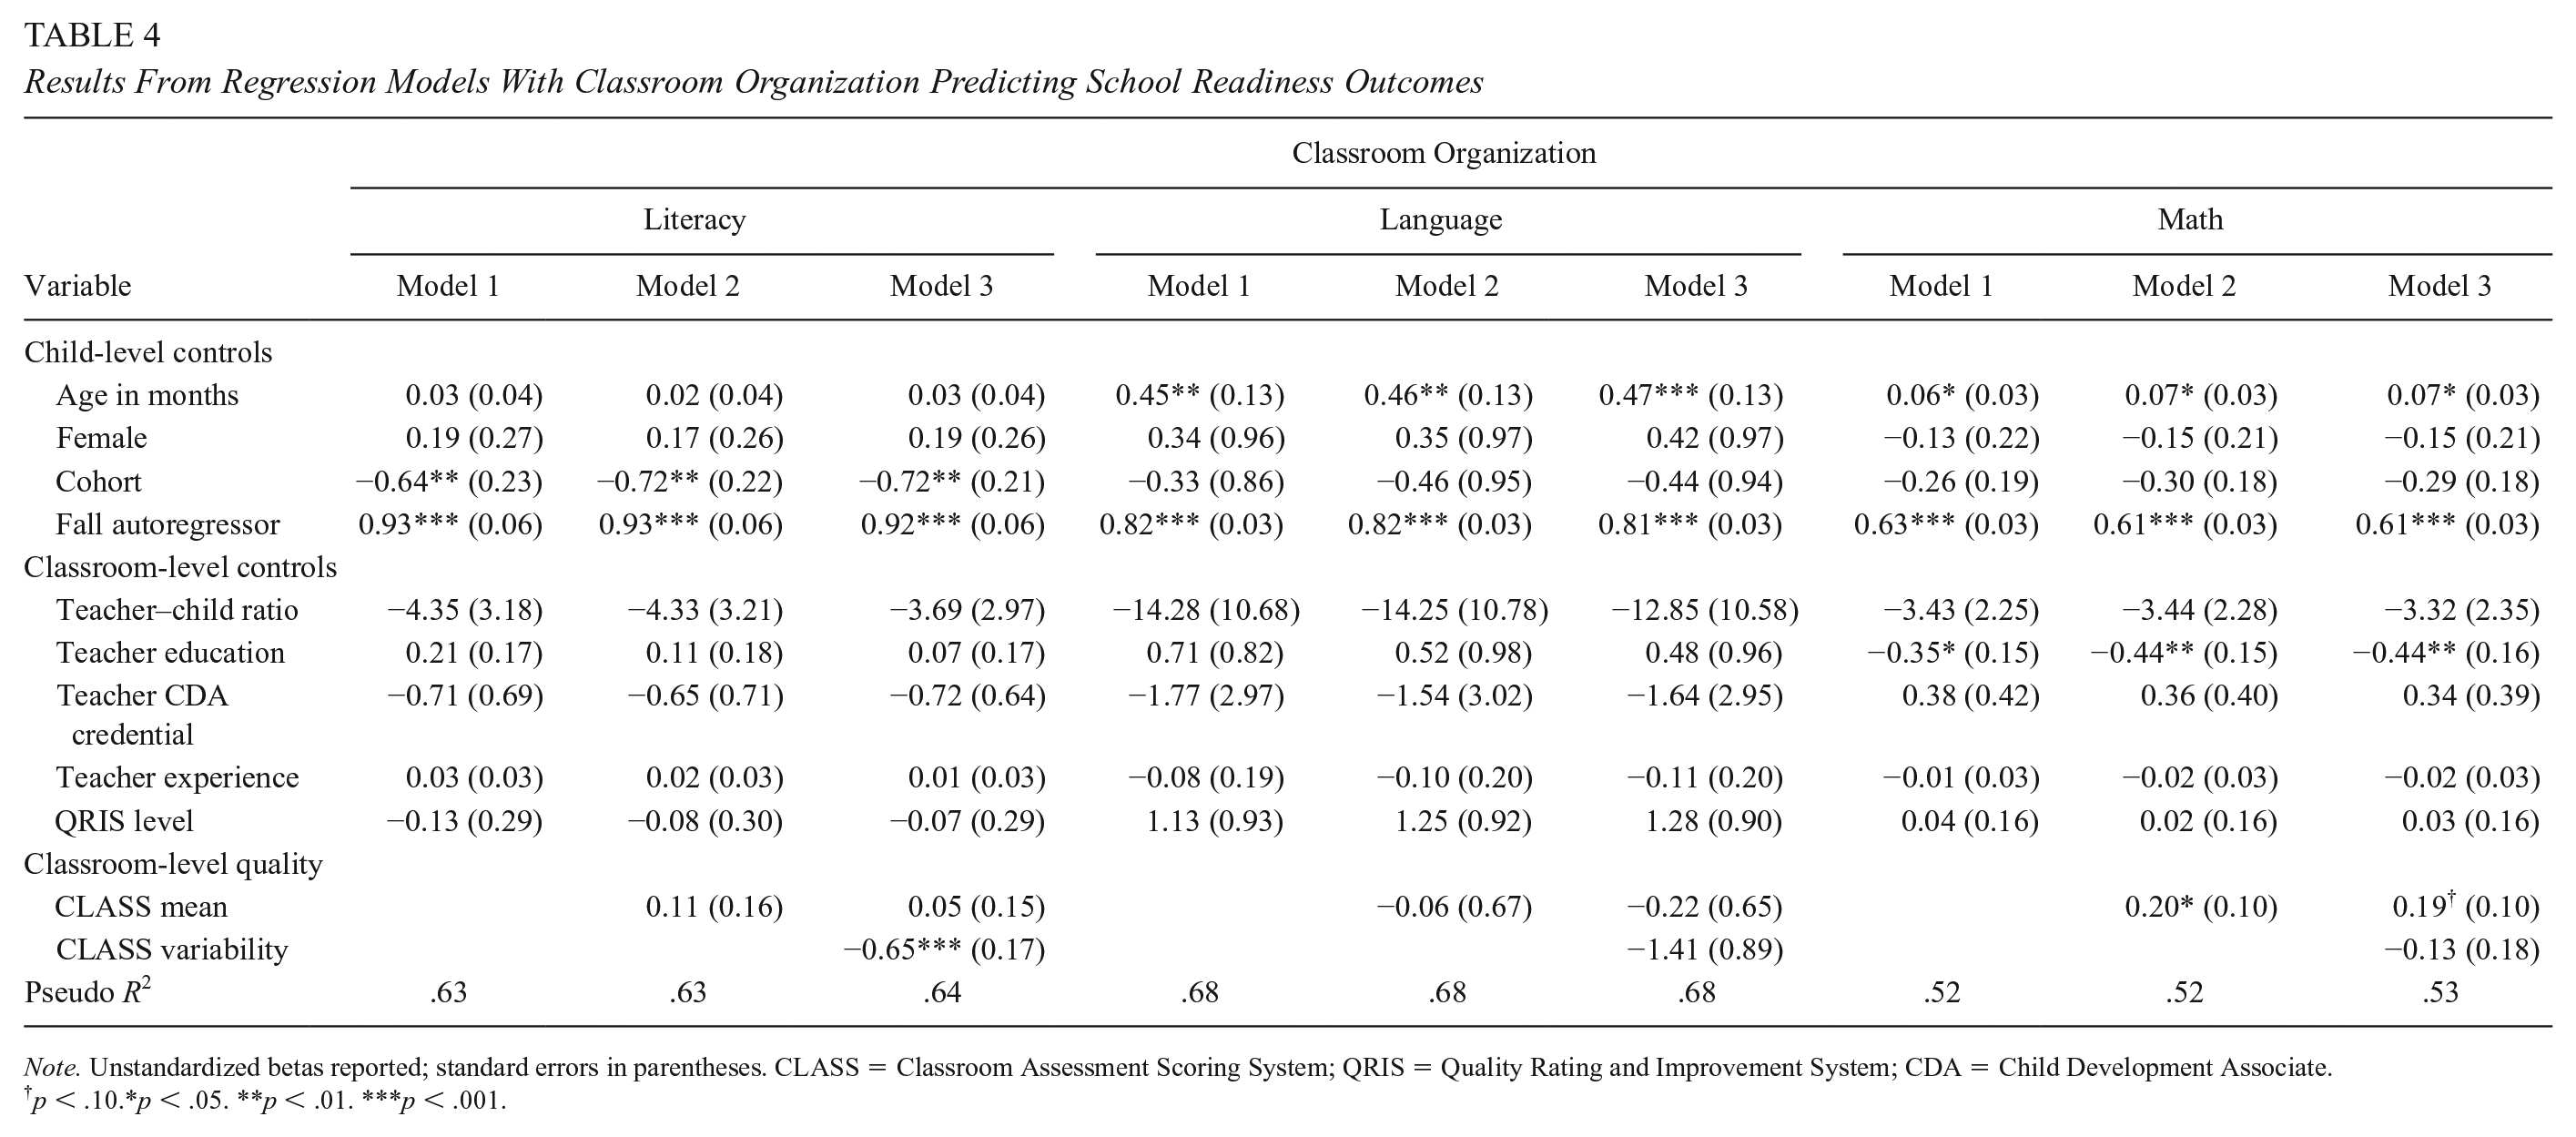
Note. Unstandardized betas reported; standard errors in parentheses. CLASS = Classroom Assessment Scoring System; QRIS = Quality Rating and Improvement System; CDA = Child Development Associate.
p < .10.*p < .05. **p < .01. ***p < .001.
Results From Regression Models With Instructional Support Predicting School Readiness Outcomes
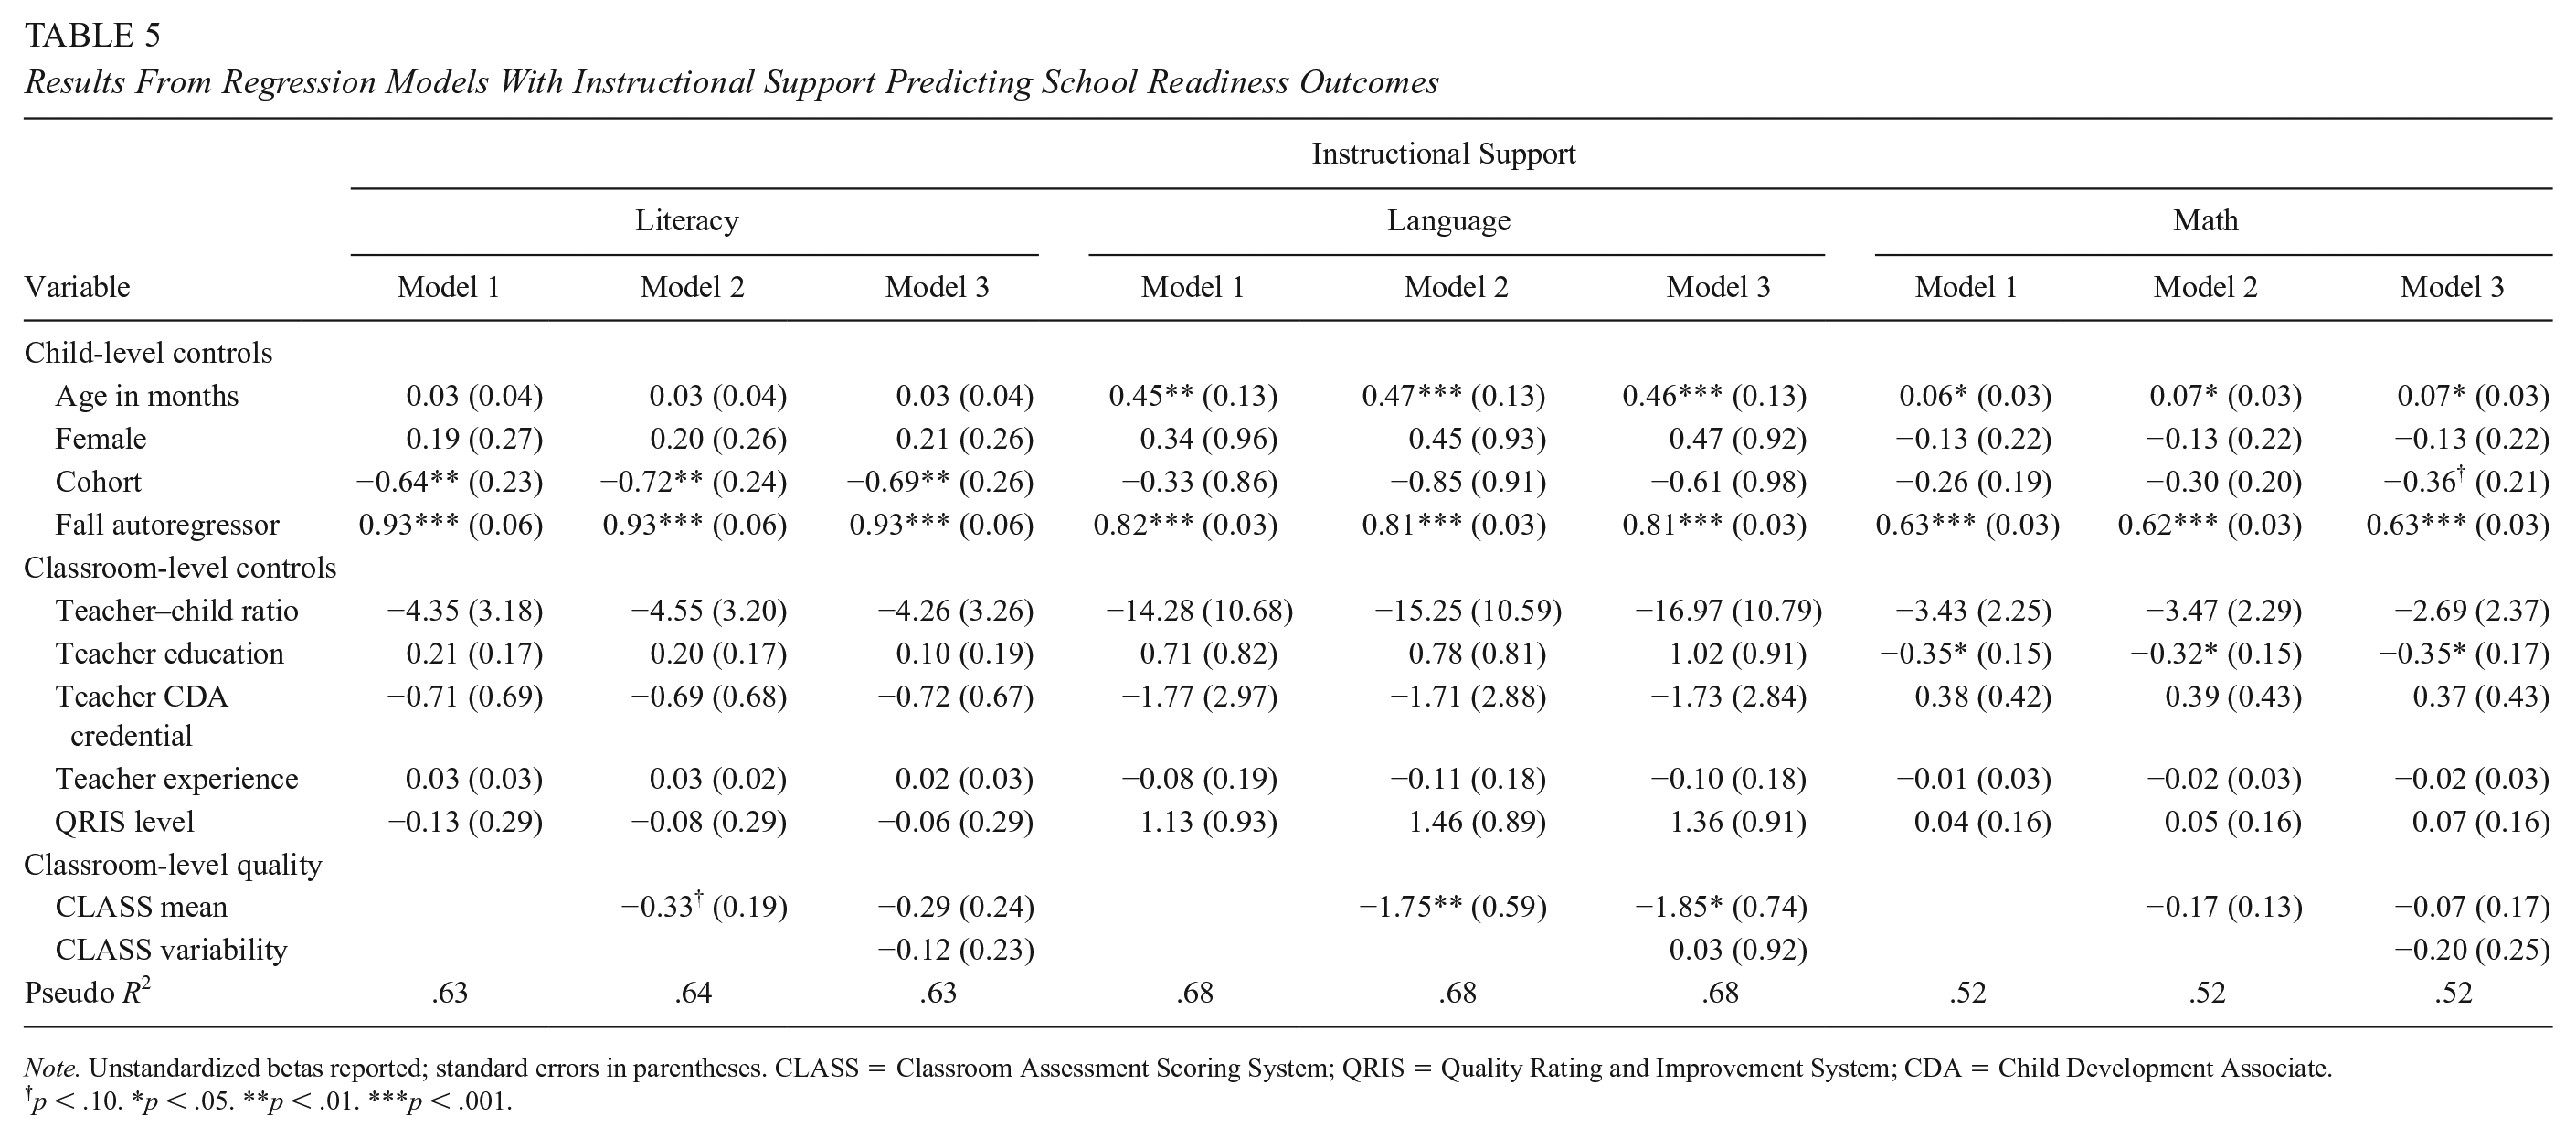
Note. Unstandardized betas reported; standard errors in parentheses. CLASS = Classroom Assessment Scoring System; QRIS = Quality Rating and Improvement System; CDA = Child Development Associate.
p < .10. *p < .05. **p < .01. ***p < .001.
Discussion
In the present study, we examined whether variability in preschool classroom quality during an observation period within a single day emerged as a unique and more robust indicator of children’s school readiness than typical aggregate measures. Using the CLASS, we were able to explore variability in teacher–child interactions across the domains of Emotional Support, Classroom Organization, and Instructional Support. Results from unconditional multilevel models with CLASS observations nested within classrooms revealed that there was moderate to high consistency (i.e., low variability) in quality over four intervals of classroom observation. These findings align with previous work documenting relative stability in Emotional Support (rs = .64–.77), Classroom Organization (rs = .55–.71), and Instructional Support (rs = .52–.64; Curby et al., 2010; Curby et al., 2011). Moreover, our results are congruent with recent work demonstrating lower consistency in Instructional Support and Classroom Organization relative to Emotional Support when investigating several methods of measuring variability (Wang et al., 2020). It should be noted that quality in all three domains decreased over the observation period. Research suggests that children’s positive engagement with teachers and peers may taper off over the preschool day (Vitiello et al., 2012). Moreover, decreasing quality over the course of a 2-hour observation may be explained by the changing contexts of the preschool classroom (Thorpe et al., 2020). During free-play and large group instruction, teachers may remain responsive and use linguistically rich language relative to mealtimes and routines, in part, because they are able to engage with the whole classroom (Cabell et al., 2013; Turnbull et al., 2009). Thus, it is possible that teachers face the challenge of eliciting high-quality interactions as their energy depletes and children simultaneously lose focus or interest in activities over the progression of the day.
With regard to variability in CLASS scores and children’s learning, results revealed that variability in Emotional Support was not significantly related to children’s growth in school readiness during the preschool year. Previous research has uncovered links between variability in Emotional Support and expressive language skills (Curby et al., 2013). These authors suggest that inconsistencies in the provision of Emotional Support may indicate volatile relationships, which in turn, discourage children’s expressiveness. Although inconsistent with Curby et al. (2013), our results do align with one recent study that also did not find significant associations between variability in Emotional Support and academic outcomes in later grades (Sandilos et al., 2019). The null findings in the present study may be explained by the fact that Emotional Support was the most consistent domain of quality with the highest mean, implying there was very little within- and between-classroom variability in Emotional Support. A relatively restricted range of Emotional Support has also been documented in previous research (e.g., Qi et al., 2019). Moreover, mean Emotional Support was not significantly related to any school readiness outcomes. These findings indicate that the way Emotional Support quality is measured may not always capture the interactions that are theorized to support children’s development, particularly in preschool classrooms where teachers are generally providing consistent, high-quality interactions throughout the day (Brock et al., 2018; Downer et al., 2010).
In line with our hypotheses, children had worse literacy performance at the end of the preschool year when they attended classrooms with more variable Classroom Organization, and better math performance when they attended classrooms with higher mean Classroom Organization. These findings are somewhat consistent with previous work that has documented a positive relation between mean Classroom Organization and math performance among elementary students (Sandilos et al., 2019), implying that children’s math skills may be supported within classrooms where teachers are well prepared to facilitate learning activities and provide clear behavior expectations. Yet the exact conditions that are necessary to set the foundation for effective preschool math instruction should be further explored, given that this finding diminished in significance after including variability in the model. Notably, Sandilos et al. (2019) did not uncover significant links between variability in Classroom Organization and English Language Arts. The effect size of .09 that was observed in this study for variability in Classroom Organization and children’s literacy is at the upper end of the published range in the existing literature (e.g., Perlman et al., 2016), suggesting that variability may be a more robust indicator of organizational quality for understanding development.
In general, results indicate that children’s literacy skills may be negatively affected by teachers who are inconsistent in their behavior management strategies and deliver lessons with unclear instructions and minimal follow through. One explanation for this finding is that teaching strategies that promote literacy, such as directing children’s attention to “code-based” aspects of oral and written language, may also require teachers to be intentional and consistent (e.g., deliver repeated dosage) to be effective (Hamre et al., 2010). Another possibility is that consistent and high-quality Classroom Organization may influence literacy through children’s behavioral skills, such as their ability to pay attention, remember instructions, and follow rules (Downer et al., 2010). Future research should examine whether the nuances illustrated in the present study with regard to Classroom Organization exist in other data sets and explore the mechanisms that drive such effects, such as child engagement or withdrawal (Vitiello et al., 2012).
Finally, we did not find evidence of an association between variability in Instructional Support and any school readiness outcomes. We hypothesized that variability in this domain could be positively or negatively related to children’s outcomes because of the competing theory and evidence (Brock et al., 2018; Sandilos et al., 2019). In this sample, the Instructional Support domain had the greatest amount of variability, and therefore, the strongest potential for explaining school readiness skills. Yet, only mean Instructional Support was negatively related to children’s language skills. Previous research has mostly documented small positive effects of mean Instructional Support on school readiness, including vocabulary (Guo et al., 2010; Hamre et al., 2014; Hu et al., 2017; Hu et al., 2019; Mashburn et al., 2008). Our contradictory findings may be due to the low mean for Instructional Support, which in this sample, fell well below the threshold for what is considered high quality (Burchinal et al., 2010; Hatfield et al., 2016; Weiland et al., 2013). This suggests that most children were experiencing predominantly low-quality Instructional Support, with few instances of interactions in the mid-range. Alternatively, the unexpected result may indicate that teacher practices theorized to support language development within the Instructional Support domain, such as asking frequent questions, repeating and extending conversations, and using a variety of advanced words, may actually come at a cost to language development if teachers are not scaffolding at an appropriate or individualized level (Pentimonti et al., 2017). Indeed, there is some evidence that inexperienced children may not respond to intensive Instructional Support (Delaney & Krepps, 2021). In future work, it will be important to clarify what constitutes as significant changes in this domain in terms of promoting children’s school readiness, particularly among diverse populations.
Overall, we uncovered little evidence that variability in CLASS scores and mean CLASS scores were consistently predictive of school readiness skills in the ways that we would expect and that would allow us to make many generalized conclusions. Our findings are largely at odds with the broader literature documenting the role of consistent (Brock & Curby, 2014; Curby et al., 2013) and high-quality (Araujo et al., 2016; Burchinal et al., 2008; Curby et al., 2009; Howes et al., 2008; Mashburn et al., 2008) teacher-child interactions for children’s learning. However, they align with a few recent studies indicating small or null associations between mean CLASS scores and child outcomes (Guerrero-Rosada et al., 2021; Perlman et al., 2016; Weiland et al., 2013) and a single study demonstrating mostly nonsignificant relations between variability in CLASS scores and academic outcomes in elementary school (Sandilos et al., 2019). The general lack of significant findings across CLASS domains and school readiness outcomes could be an indication that our measure of variability is picking up on changes in lessons during the observation period that require teachers to fluctuate more in their interactions with children (Thorpe et al., 2020). Alternatively, the measure of variability may be capturing coder drift, which would likely not be indicative of classroom processes that matter for child outcomes (Burchinal, 2018). For instance, a recent G-study revealed that across all CLASS domains, less than 50% of the variability was attributable to the behaviors of teachers (Mantzicopoulus et al., 2018). Another explanation is that the CLASS domains are not reliably capturing their underlying dimensions (Gordon & Peng, 2020), thus inflating the amount of variability in observer reports. Finally, it is possible that the CLASS, while practically informative, may not translate from the research context to complex classroom environments (Liu et al., 2019). In other words, the CLASS may be theoretically grounded but lack the ecological validity that is necessary to provide information about how children are learning from their interactions with their teachers—a hypothesis that is supported by emerging evidence that the CLASS does not always predict child outcomes (e.g., Guerrero-Rosada et al., 2021; Perlman et al., 2016; Weiland et al., 2013). Regardless, researchers and practitioners should consider whether the CLASS is an appropriate measure for their specific purpose and continue to explore how to capitalize on the information obtained from this popular tool.
Limitations, Strengths, and Future Directions
This study contributes to the early childhood literature by leveraging the strengths of a common measure of classroom quality (i.e., the CLASS) to investigate variability and its associations with children’s school readiness skills. Despite the novel findings of this study, a few limitations along with their complementary strengths must be noted. First, it is possible that the indicators of variability are picking up on measurement error instead of meaningful variations in quality (Casabianca et al., 2015; Mashburn et al., 2014). In turn, inconsistencies within—and between—raters may mask true variability that is due to fluctuations in teaching practices. The CLASS has been criticized for its low reliability criteria (Burchinal, 2018). To illustrate, differences in raters have been found to account for 22% to 32% of the variance in Classroom Organization scores (Mantzicopoulos et al., 2018; Praetorius et al., 2014). If the findings from the present study are reflective of poor interrater reliability in observer ratings and are not representative of true variability, this points to a potential measurement issue of the CLASS training and protocols that should be revisited. Unfortunately, this study lacks access to data that could provide answers to these questions. Therefore, an important direction for future research is to explore whether individual observers impart their own biases as they rate single classrooms over time and understand why classroom quality seems to vary. This may be particularly critical to consider with respect to the Instructional Support domain because it is most challenging for raters to reliably score (Styck et al., 2021). Specifically, G-studies are useful for informing the rigor that would be necessary to achieve reliability (i.e., stability) in classroom quality ratings, such as the number of observation intervals, days, and raters (Mantzicopoulos et al., 2018; Mashburn et al., 2014). Given that mean scores on the CLASS vary from day to day (Buell et al., 2017), so too may variability in CLASS scores.
Another weakness of the CLASS is that it only captures one brief snapshot of quality across the many days and interactions that children experience. Researchers argue that a single measure of complex classroom processes may not be adequate (Weiland et al., 2013). Future work should attempt to replicate findings using more precise measures of teacher-child interactions, such as those that examine the quality of teacher-child interactions for individual children (Bohlmann et al., 2019; Downer et al., 2011). Another promising future direction may be exploring different time metrics of variability to investigate whether micro- versus macroinconsistencies in quality have greater significance for children’s learning. At a microlevel, this may include rating the frequency of classroom strategies and interactions across multiple intervals and days (Kettler et al., 2019). At a macrolevel, it could involve charting change over the year or multiple years. For instance, gains in Instructional Support over the preschool year have been shown to be related to children’s literacy and inhibitory control (Goble et al., 2019), and researchers have demonstrated that consistently high Instructional Support from preschool to kindergarten promotes language and literacy development (Cash et al., 2019). Moreover, examining multiple ways of measuring variability within a single day (e.g., Wang et al., 2020) and their consequences for children’s learning is an important next step as different approaches may yield different conclusions and interpretations.
The CLASS is a global measure of quality, and while its versatility can be viewed as a strength, the lack of specificity also leaves room for subjectivity. For example, one dimension within the Instructional Support domain measures the quality of language modeling. However, the measure itself is not designed to assess the quality of instruction during literacy activities exclusively. Although preschool teachers spend a large amount of their day focusing on language and literacy (Early et al., 2010), it is possible that instructional quality may vary depending on the context and content of instruction (Rimm-Kaufman et al., 2005). Indeed, one study found that CLASS scores were influenced by the content of activities (Thorpe et al., 2020). Although our data restricted such analysis, researchers should carefully examine whether variability in quality is consistent across different types of activities in preschool and what the implications of variability in these various settings are for children’s school readiness.
Last, while we view the use of a sample from families from low incomes as an asset because these children are most in need of high-quality instruction, it is important to acknowledge that our results may be specific to this population. Prior work has demonstrated that quality is generally lower in classrooms serving children from families with low incomes (Pianta et al., 2007). Therefore, future research should aim to replicate these associations in diverse preschool classrooms to make broader conclusions about the generalizability of these findings. Moreover, the lack of access to classroom and teacher information inherent in the study design lends itself to the potential for omitted variable bias and Type I error. Although we took a conservative approach to interpreting the practical significance of findings, it will be necessary to examine these questions with a dataset that allows researchers to account for the many factors that may influence variability in teacher–child interactions, such as teacher stress, to better understand the mechanisms linking classroom quality to child outcomes (Li Grining et al., 2010).
Implications
Results from the present study have implications for research and practice. The CLASS is more frequently being incorporated within state QRIS (Sabol & Pianta, 2015). Such widespread use of the CLASS in research and practice has generated strong financial and political stakes (Tout et al., 2009), including informing policy decisions about satisfactory thresholds in Head Start and state-prekindergarten. Like others, we caution against using average scores or defaulting to guidelines set by thresholds on observational measures like the CLASS as a sole indicator of effective or ineffective teachers and for the purpose of providing merit (Good & Lavigne, 2015; Mashburn, 2017; Mantzicopoulos et al., 2018). Instead, we recommend that the nuances in teacher-child interactions also be considered when tracking progress across several measures that assess instructional effectiveness.
Our findings for Classroom Organization provide some preliminary evidence that efforts to reduce achievement gaps by improving quality, such as providing access to state-funded prekindergarten programs and administering QRIS, may also want to measure and monitor classrooms with high variability. Recent evidence suggests that it is possible to improve CLASS scores over time with targeted investments, and ECE programs who score in the mid-range on the CLASS may have the greatest potential for growth (Bassok et al., 2021). Thus, in addition to increasing the quality of teacher-child interactions to improve children’s school readiness (e.g., Wasik & Hindman, 2011; Markowitz et al., 2018; Mashburn et al., 2015), continuous improvement initiatives should also consider supporting programs in sustaining the high-quality interactions they already show the capacity for. Focusing on creating a stable classroom environment in terms of structure, expectations, and management could be an essential approach to professional development for teachers that is commonly overlooked. Of course, more work is needed to understand whether and how these results hold up across samples before making any firm conclusions regarding their implications.
Finally, although we are encouraged by the fact that state and federal initiatives have started to incorporate theoretically and empirically informed practices into their policies, we share the concern of others about using global assessments to meet policy goals (Burchinal, 2018; Gordon & Peng, 2020). Specifically, widespread use the CLASS for these purposes has proven feasible; however, some precision in detecting meaningful effects has been compromised along the way (Pianta et al., 2020). This suggests the need to continue developing and refining measures of classroom quality that align with the evidence on what we know works for individual children and can be implemented at scale without losing integrity.
Conclusions
The CLASS is predicated on the assumption that consistent, high-quality interactions are essential components of classroom quality that shape children’s development. Most of the models in the present study, however, yielded null findings or results that run contrary to conclusions drawn in the broader literature. The present study advances the field by illustrating that two conceptualizations of classroom quality previously shown to influence children’s outcomes do not produce the same anticipated effects across all large samples, CLASS domains, and school readiness outcomes. Furthermore, findings suggest that variability may be a more robust indicator of quality in the domain of Classroom Organization than the mean when considering children’s growth in literacy. Results have important implications for professional development and practice, particularly within the context of state-funded prekindergarten. Although the CLASS provides a theoretically grounded approach to defining classroom quality, there is still more work to be done to better understand and improve on the validity and practical significance of this widely administered measures of quality. An important first step is to build a more comprehensive body of knowledge around what information we can expect to obtain from global observations of classroom quality, derived from both mean scores and variability in scores. This will allow us to achieve a more realistic understanding of the circumstances under which children benefit within existing frameworks and enable the development of complementary measures of quality that fill the gaps.
Footnotes
Appendix
Teacher Demographics

| Variable | n | M | SD | Range |
|---|---|---|---|---|
| Days children attend per week | 78 | 4.98 | 0.13 | 4–5 |
| Hours children attend per day | 78 | 7.97 | 1.75 | 1–12 |
| Years teaching preschool | 76 | 6.80 | 7.47 | 0–38 |
| Teacher Education | ||||
| <Eighth grade | 1 | 0.01 | 0.11 | 0–1 |
| Some high school | 10 | 0.13 | 0.33 | 0–1 |
| High school diploma or GED | 42 | 0.53 | 0.50 | 0–1 |
| Trade school | 23 | 0.29 | 0.46 | 0–1 |
| Some college | 4 | 0.05 | 0.22 | 0–1 |
| Teacher has Child Development Associate | 79 | 0.37 | 0.49 | 0–1 |
| Teacher has teaching license from state | 80 | 0.08 | 0.27 | 0–1 |
Note. GED = General Education Development.
Funding
This study was funded by Indiana’s Family and Social Services Administration [contract # F1-79-15-PK-0374 and contract #0000000000000000000026332]. The opinions expressed here are those of the authors and do not represent view of the institution.
Authors
JENNIFER K. FINDERS is an assistant professor at Purdue University in Human Development and Family Studies. Her research focuses on the role of early care and education programs in promoting cognitive, behavioral, and social and emotional learning among children from diverse backgrounds.
ADASSA BUDREVICH is a senior evaluator for Washington State Department of Children, Youth, and Families. Her research focuses on evaluating how early care and education programs, workforce development, and classroom quality optimize outcomes for children furthest from opportunity.
ROBERT J. DUNCAN is an assistant professor at Purdue University in Human Development and Family Studies and Public Health. His research focuses on understanding children’s development of academic skills, executive function, social-emotional skills, and fine/gross motor skills.
DAVID J. PURPURA is an associate professor at Purdue University in Human Development and Family Studies. His research focuses on understanding how young children in preschool through third grade learn math and how to identify children at-risk for later math difficulties.
JAMES ELICKER is professor emeritus at Purdue University in Human Development and Family Studies. His research has focused on evaluating quality improvement efforts in early care and education.
SARA A. SCHMITT is an associate professor at Purdue University in Human Development and Family Studies. Her research focuses on examining the individual and contextual factors that contribute to growth in self-regulation (e.g., executive function) and school readiness (e.g., social-emotional competence, early academic skills).