
Abstract
Despite substantial federal, state, and local investments in improving early care and education (ECE), we know little about whether ECE program quality has improved over time. The lack of data tracking the quality of publicly funded ECE programs at scale creates a substantial evidence gap for policymakers attempting to weigh the returns on, and future of, quality improvement policies. Data from Quality Rating and Improvement Systems (QRIS) provide a promising opportunity to address this problem. Using 4 years of data from a mandatory, statewide QRIS covering subsidized child care, Head Start, and state prekindergarten, we document systemwide quality and improvement trends over a period of targeted investment in quality improvement statewide. We find improvements in quality overall, across sectors and communities over this period. Results also reveal differential growth across sectors such that quality gaps diminished. This study highlights the potential of statewide ECE data for informing quality improvement efforts.
Children’s early learning experiences are critical for their development (Shonkoff & Phillips, 2000), and decades of evidence suggests that high-quality early care and education (ECE) can positively affect both short- and long-term outcomes (Phillips et al., 2017; U.S. Department of Health and Human Services & Administration for Children and Families, 2010; Yoshikawa et al., 2013). Unfortunately, access to high-quality ECE remains scarce (Markowitz et al., 2018). Although a large body of research demonstrates the importance of warm and engaging teacher-child interactions in supporting young children’s development (Bronfenbrenner & Morris, 2006; Hamre, 2014; Johnson et al., 2016; Weiland et al., 2013; Zaslow et al., 2016), the quality of these interactions varies substantially across ECE programs and is often quite low, particularly in programs serving the most disadvantaged children (Bassok & Galdo, 2015; Votruba-Drzal et al., 2010).
Policymakers have sought to improve ECE program quality in a number of ways. Traditionally the two primary approaches have been increasing minimum operating requirements (e.g., requiring higher teacher education levels in Head Start, tightening regulations in the Child Care and Development Block Grant [CCDBG]) and elevating funding levels (e.g., earmarking public funding for state pre-kindergarten [pre-K] programs, the 2018 increase in CCDBG funding). More recently, early childhood accountability systems have emerged as a third way. Nearly all states now have Quality Rating and Improvement Systems (QRIS), which are accountability systems that unify standards, evaluate and publicize quality, and typically provide monetary incentives for improvement (Bipartisan Policy Center, 2018; First Five Years Fund, 2019; Head Start Act, 2007; Kaplan & Mead, 2017; Office of Child Care, 2019b; Regenstein & Lipper, 2013; U.S. Department of Education, 2016; Warner-Richter, 2016). All three approaches to improving ECE quality have expanded significantly over the past two decades as policymakers work to increase ECE quality at scale. Despite these sizable public investments, however, we know surprisingly little about ECE quality at the state or system level, and even less about whether quality has improved in response to these investments.
This article highlights the utility of systemwide quality data for answering pressing research and policy questions. Using data from Louisiana’s mandatory QRIS, it provides the first longitudinal and systemwide look at ECE quality using a unique panel of all publicly funded, classroom-based settings in a state over a 4-year period characterized by substantial investments in ECE quality. It then examines whether and how quality improvement trends vary across sectors and communities. Quality gaps between private, center-based child care programs and Head Start and pre-K programs are well-documented (Bassok et al., 2016), as are disparities in quality by community advantage (Bassok & Galdo, 2015; Valentino, 2018), but to date, no studies have explored whether the rates of quality improvement also vary across sectors and communities. The study argues that systemwide data are essential for understanding the returns on large-scale quality improvement efforts and demonstrates how systemwide quality data could be used to undergird better research for data-driven policymaking.
Quality in ECE
ECE quality is often thought of as having two components: structural quality and process quality (Burchinal, 2018). Structural measures of quality are distal, regulable factors such as group sizes and teachers’ educational credentials, and are hypothesized to support, but not guarantee, high-quality experiences for children (Dowsett et al., 2008; Phillipsen et al., 1997). Process quality refers to children’s actual experiences and interactions in their ECE programs. Although policymakers traditionally regulated structural quality features in the hopes of driving improvement, there is mounting evidence that many structural quality measures are not consistently linked to children’s learning and development (Early et al., 2007; Friedman-Krauss et al., 2019). In contrast, a large body of literature shows that the quality of interactions children experience in ECE settings shapes their development (e.g., Araujo et al., 2016; Burchinal, 2018; Burchinal et al., 2008; Friedman-Krauss et al., 2019; Hamre, 2014; Hindman & Wasik, 2015; Howes et al., 2008; Vitiello et al., 2018; Weiland et al., 2013; Zaslow et al., 2016).
Unfortunately, studies show that process quality varies considerably across sites and is often too low for children to derive developmental benefits (Burchinal et al., 2010). For instance, national Head Start data show that 75% of classrooms rate as low on a measure of instructional quality and 13% rate as high on a measure of emotional warmth and sensitivity (Aikens et al., 2016).
Variation in ECE Quality Across Sectors
Center-based care in the United States is provided through several sectors, including subsidized child care, federal Head Start, and state-funded pre-K (Whitebook et al., 2014). Although each of these sectors provides publicly funded early education, they have different historic missions and are administered by different agencies, with divergent approaches to defining, measuring, and regulating quality. Existing research indicates that quality indeed varies significantly such that, on average, publicly funded child care centers provide lower-quality ECE experiences than Head Start or pre-K. For example, using national data from the Early Childhood Longitudinal Study–Birth Cohort, Bassok et al. (2016) found that school-based pre-K and Head Start programs demonstrated lower child-teacher ratios, more frequent reading and mathematics activities, and a higher probability of following written curricula than center-based child care programs. Using the same national data set, another study shows that Early Childhood Environmental Rating Scale (ECERS) scores, which assess both the resources and organization of the learning environment and teacher-child interactions, were higher in Head Start programs than in other center-based programs (Hillemeier et al., 2013). These differences in quality are explained, at least in part, by the sectors’ differing goals, funding levels, and approaches to quality improvement, as described below.
Child Care
Federal subsidies for child care were originally funded to support parents’ participation in the workforce. Private child care programs can receive public funds by accepting subsidies from the Child Care Development Fund (a combination of the CCDBG and Temporary Aid for Needy Families [TANF] dollars). Families earning less than 85% of the federal poverty line are eligible for a subsidy, but funding is not guaranteed and many families are placed on waitlists.
Public funding for child care programs is lower than for Head Start and pre-K programs (Barnett & Friedman-Krauss, 2016; Friedman-Krauss et al., 2020; Office of Child Care, 2019a). Child care teachers often earn below $10 per hour and are significantly more likely than teachers in other sectors to report high levels of workplace stress, depend on government assistance programs, and leave their teaching positions (Bassok et al., 2021; Whitebook et al., 1998, 2014). Child care programs are subject to their state’s licensing requirements, which set the floor for program quality. Licensing requirements typically place less emphasis on the quality of teacher-child interactions or school readiness than Head Start or pre-K programs and instead focus on safety regulations and features of structural quality (e.g., group size).
There is little systematic evidence about how quality in child care programs—structural or process—has changed over time, although recent initiatives have begun prioritizing and funding quality improvement efforts. For example, the 2014 CCDBG reauthorization required states to set development and training requirements for teachers, implement developmental guidelines from birth to school entry, and spend quality “set-asides” on at least one quality improvement activity (e.g., QRIS, supporting resource and referral agencies; National Conference of State Legislatures, 2015).
Head Start
Introduced in 1965, the goal of the federal Head Start program is to improve early learning and health outcomes for children in families at or below the federal poverty line. Head Start now enrolls over 750,000 three- and four-year-old children per year, as well as over 250,000 infants and toddlers in Early Head Start (Early Childhood Learning and Knowledge Center, 2019a). All Head Start programs are required to meet and report on specific features of program operations annually (e.g., program curricula, student assessment, etc.; Early Childhood Learning and Knowledge Center, 2019b). Since 2007, each grantee, or organization receiving Head Start funds, must also participate in a grant renewal process every 5 years (Administration for Children and Families, 2016; Friedman-Krauss et al., 2019; U.S. Department of Health and Human Services, 2016), which includes an observational assessment of the quality of teacher-child interactions in some program classrooms.
The existing evidence, though limited, suggests that quality has improved in Head Start over time. Data from Head Start’s Program Information Reports show a steady increase in structural quality: 72% of lead teachers held at least a bachelor’s degree as of financial year 2018 relative to under 25% in 2000 (Bassok, 2013; Early Childhood Learning and Knowledge Center, 2019a). Using multiple waves of nationally representative Head Start data, Aikens et al. (2016) showed large increases between 2006 and 2014 on the ECERS. The same report found that while, on average, classroom warmth and organization did not change between 2009 and 2014, programs were significantly less likely to score in the “low” range (between 1 and 2) on instructional quality, in 2014 than in 2009 (from 85% to 76%).
State-Funded Pre-K
Publicly funded pre-K programs first emerged in Tulsa, Oklahoma, as a way to expand access to high-quality ECE. Programs in 44 states and Washington, D.C., now serve 1.58 million children annually, at a cost of $5.18 billion (Bartik et al., 2011; Friedman-Krauss et al., 2019; Gormley & Phillips, 2005). Pre-K classrooms often operate within public schools or community organizations and often resemble elementary school classrooms. Teachers are often required to administer school readiness assessments, and many states require lead teachers hold educational credentials similar to those of elementary school teachers in their state (Friedman-Krauss et al., 2019; Pianta & Howes, 2009).
Due to data limitations, efforts to track quality improvement in state pre-K programs have focused on structural quality. Since 2003, the National Institute for Early Education Research (NIEER) has evaluated state pre-K programs on a set of 10 quality benchmarks (e.g., curriculum standards, educational requirements for lead and assistant teachers, the presence of a continuous quality improvement system). No state met all 10 benchmarks in 2003. By 2019, many states made notable progress and four met all 10; still, insufficient funding remains a barrier to improving access and quality in state pre-K (Barnett et al., 2004; Friedman-Krauss et al., 2020).
Although there have been meaningful investments in quality improvement across all three sectors, the limited and varied data currently available are not ideal for tracking changes in quality within a sector and make comparisons of quality improvement across sectors infeasible. This study shows how QRIS data could help overcome these limitations.
Variation in ECE Quality Across Communities
Program quality also differs across communities, with lower-quality ECE programs in communities with more low-income, Black, and Hispanic families. For example, one recent article combining data from 11 states showed that children concentrated in high-poverty areas were more likely to experience low-quality care than their peers in lower-poverty areas (Valentino, 2018). Using data from Georgia, Bassok and Galdo (2015) linked data from each of the state’s public pre-K programs to local poverty measures and found that ratings of teacher-child interactions were the lowest for programs in the most impoverished communities. Similar work in New York City concluded that public pre-K programs available in predominately Black and Hispanic neighborhoods were rated lower than those available in White neighborhoods (Latham et al., 2019). While quality seems to systematically differ across communities, no available studies have examined whether quality improvement trends differ across communities based on demographic characteristics. This study addresses this limitation.
Quality Data and QRIS
Despite the growing understanding of the importance of quality in early childhood settings, increased awareness that ECE quality varies across sectors and communities, and considerable policy investments in improving quality, there is very little data available to track ECE quality and assess improvement. This data deficit exists in part because of the lack of coordination across publicly funded center-based child care, Head Start, and state pre-K, and their divergent approaches to defining, measuring, and regulating quality. Differences in whether and how each sector measures quality have made it impossible to conduct cross-sector quality comparisons or systemwide analyses, and, as shown above, even within individual sectors, longitudinal data systems tracking quality are rare. Investing in quality improvement without having a way to track the impact of those investments is problematic.
QRIS could provide consistent, longitudinal measures of program quality across sectors. These systems, now operational in over 40 states, typically use the same quality measures across all center-based programs irrespective of sector. Most states’ QRIS do not require universal participation across all programs and sectors, however, and the programs that opt to participate likely differ in important ways from those that do not. For this reason, many existing QRIS cannot provide either a complete snapshot of quality across a state’s ECE programs or a way to track quality improvement over time. In contrast, Louisiana’s QRIS, which provides the data for the present study, allows for a systemwide, multiyear understanding of program quality across all publicly funded ECE programs, including subsidized child care, Head Start, and state pre-K under the Louisiana Department of Education (LDOE).
Louisiana and Act 3
In 2012, Louisiana passed Act 3, or the Louisiana Early Childhood Education Act (2012), to unify quality standards across all publicly funded ECE programs, increase ECE quality statewide, and ensure all children enter kindergarten prepared. In response, LDOE introduced a universal QRIS and required all publicly funded programs to participate. Based on the large body of research on the importance of teacher-child interactions, Louisiana based programs’ QRIS ratings solely on the quality of those interactions, as measured by the Classroom Assessment Scoring System (CLASS; Pianta et al., 2008), one of the most widely used measures of teacher-child interactions. CLASS assesses the warmth, organization, and instructional scaffolding in a classroom, and many studies—using both experimental and correlational designs—show that children’s growth is larger in classrooms with higher CLASS scores (Araujo et al., 2016; Burchinal et al., 2008; Hindman & Wasik, 2015; Howes et al., 2008; National Institute of Child Health & Human Development Early Child Care Research Network, 2002; Vitiello et al., 2018; Wasik & Hindman, 2011, 2020; Weiland et al., 2013; Williford et al., 2013; Zaslow et al., 2016). While some studies have found only modest or zero correlations between CLASS and child outcomes (e.g., Guerrero-Rosada et al., 2020), there remains widespread agreement that the interactions children experience in early childhood settings are critical, and that improving these interactions is important for creating large-scale quality improvements, motivating LDOE’s use of this tool.
Starting in the 2015–2016 school year, the state required two CLASS observations per year in every classroom serving either toddlers (1–2 years) or preschool-age children (3–4 years) within every publicly funded ECE program, including child care, Head Start, and pre-K. These classroom scores were then aggregated up to the program level, and programs received quality ratings based exclusively on these averaged CLASS scores.
In addition to implementing a mandatory QRIS, Louisiana introduced a series of additional efforts that aimed to improve teacher-child interactions (Cannon et al., 2018; Lieberman, 2018). They created a set of tax credits for teachers and programs to incentivize high CLASS scores. They provided targeted supports, including coaching for programs with very low CLASS scores (LDOE, 2020). They also introduced a free, mandatory teaching credential for child care teachers that emphasizes teacher-child interactions. The focused investment in quality improvement and the tight alignment between these improvement efforts and the way quality is measured in Louisiana make it a particularly promising context to examine systemwide improvement.
Although a key goal of Louisiana’s reform was to increase quality across all programs, fostering improvements may have been more challenging in some contexts. For instance, child care programs may have found adapting to the demands of a novel evaluation system particularly difficult. Unlike Head Start and pre-K programs, which had prior exposure to classroom observations of instructional quality, child care programs were not previously evaluated on the quality of teacher-child interactions. At the same time, the introduction of additional resources and supports—as well as increased exposure to the CLASS—may have led to more rapid improvements in child care programs than in Head Start or pre-K. Similarly, patterns of improvement may have varied across Louisiana parishes, based on their demographic characteristics. For instance, those communities with the greatest poverty may have weaker infrastructure for supporting local programs in their efforts to improve the quality of teacher-child interactions. On the other hand, it may be that in the most disadvantaged parishes, the new supports provided following Act 3 resulted in more rapid improvement. The current study explores this potential for variation.
Current Study
Despite substantial federal, state, and local investments in ECE quality improvement, we know little about whether or not programs have improved over time, particularly at scale. This article uses detailed data from Louisiana’s mandatory QRIS to describe systemwide changes in program quality over a 4-year period with an intense focus on quality improvement. Specifically, we ask the following questions:
What was the initial level of ECE system quality in Louisiana in 2016? How did this vary across sectors and parishes?
To what extent did ECE system quality increase in Louisiana between 2016 and 2019? How did improvement trends vary across sectors and parishes?
This study provides the first statewide exploration of ECE quality, quality improvement, and variability by key program and community characteristics and highlights how detailed data collected in the context of a mandatory QRIS could substantially enhance our understanding of quality improvement efforts.
Method
Data
This study uses 4 years of LDOE administrative CLASS data from the 2015–2016 through 2018–2019 school years (we refer to these as 2016, 2017, 2018, and 2019), the 4 years following statewide implementation of Act 3. The underlying data include scores from two CLASS observations per year in every classroom serving toddlers (1- to 2-year-olds) and preschoolers (3- to 4-year-olds) within every publicly funded program in the state. For the current study, we use annual program-level data—that is, scores aggregated across classrooms to create a total program score. All publicly funded programs with observation data for any year (2016–2019) are included (N = 1,871). The number of publicly funded programs in Louisiana varied across years, as new programs entered the QRIS and others exited. Table 1 provides the number of publicly funded programs operating each year; Appendix Table A1 provides the overall distribution of programs by sector for each parish across the 4 years of this study.
CLASS Scores and Proficiency by Year and Sector

Note. N = 1,871 total programs represented. Standard deviations in parentheses. The abbreviation pp stands for percentage points. CLASS = Classroom Assessment Scoring System.
Measures
Quality
CLASS observations were conducted by local observers who were often elementary school principals, child care or Head Start directors, or other early education professionals who are certified reliable on the CLASS observation protocol. To conduct observations, individuals must become certified, which requires observers’ ratings of classroom quality to align with those of master CLASS observers across multiple observations.
The CLASS measures the warmth and sensitivity of the adults in the classroom, the supports they provide for language development, and the scaffolding of instructional content for concept development. During the study period, Louisiana used two versions of the CLASS as part of its QRIS. The Toddler CLASS, used in classrooms serving children 15 to 36 months old, scores classrooms in the Emotional and Behavioral Support and Engaged Support for Learning domains. The Pre-K CLASS, used in classrooms where children are 3 to 4 years old, scores classrooms on Instructional Support, Emotional Support, and Classroom Organization domains (Pianta et al., 2008). CLASS scores range from 1 to 7. Within each classroom, all domain-level scores are averaged to generate a classroom-level score. All observation scores are then averaged across classrooms to generate a program score.
LDOE places programs in one of the four categories based on these scores: Programs with scores ranging from 1 to 2.99 are classified as “Unsatisfactory.” Beginning in 2018, programs scoring at this level in two consecutive years were subject to loss of public funding. Programs scoring between 3.0 and 4.49 are classified as “Approaching Proficient”; programs scoring between 4.50 and 5.99 are classified as “Proficient”; and programs scoring 6.00 and above are classified as “Excellent.” In 2019, Louisiana added a new category for programs scoring above 5.50 but below 6.00 named “High Proficient,” but we use the four categories that were consistent across time.
In this study, we focus on two primary measures of quality considered by Louisiana policymakers: the average program-level CLASS scores and the percentage of programs rated Proficient or above. The two are mechanically related, but many of Louisiana’s policy supports during this period focused on bringing low-performing programs up to proficiency, making it worthwhile to explore shifts on this metric. Because Louisiana’s QRIS focused on program-level ratings, we use those scores in our main analyses, but we replicate our analyses using classroom-level CLASS scores as well. Those results, which are substantively quite similar, are presented in Appendix Tables A2 and A3.
Sector
Louisiana’s publicly funded ECE system includes subsidized child care, Head Start, and school-based pre-K (which includes programs in both public and private schools). Sectors are identified using LDOE administrative data, and of the 1,871 study programs, 866 (46%) are classified as child care programs, 253 (14%) as Head Start programs, and 752 (40%) as pre-K programs. The proportion of programs in each sector varies across parishes (Appendix Table A1).
Child care
In Louisiana, the Child Care Assistance Program (CCAP), which is administered by LDOE, provides CCDBG or TANF subsidies to providers serving low-income children (Louisiana Policy Institute for Children, 2014). As of 2018, over 14,000 children were enrolled in child care using CCAP funds (LDOE, 2019). The average annual subsidy for children was $3,400 (LDOE, 2018).
Head Start
Nearly 23,000 children in Louisiana are enrolled in Head Start and Early Head Start programs. In 2017, per-child funding in Louisiana was $7,973 for the 19,000 three- and four-year-olds in Head Start and $14,685 for more than 3,000 infant to 2-year-olds in Early Head Start (LDOE, 2018).
Pre-K
Louisiana provides pre-K access for 4-year-old children through a variety of programs. First, the Cecil J. Picard LA4 Early Childhood Program (LA4) provides funding for over 16,000 children to attend full-year, school-based pre-K programs across the state. The 8(G) Student Enhancement Block Grant Program or 8(G) is funded by the Louisiana Board of Elementary and Secondary Education and provides funding for about 3,000 low-income, 4-year-old children to attend pre-K programs. Finally, the Nonpublic Schools Early Childhood Development Program (NSECD) funds enrollment for about 1,400 low-income, 4-year-old children in state-approved private schools or child care programs providing 6 hours of daily programming (Louisiana Policy Institute for Children, 2014). Per-child funding for pre-K in Louisiana was $4,580 in 2017 (LDOE, 2018).
Parish characteristics
We characterize parish risk level using a comprehensive index of local childhood risk that was designed by the Tulane Institute of Early Childhood Mental Health and the Louisiana Department of Health, Office of Public Health, Bureau of Family Health. For each of Louisiana’s 64 parishes, the index combines five economic factors (percentage of unemployed, percentage of births to single mothers, percentage of mothers with less than a high school education, percentage of children under age 5 living below the poverty line, and the median household income as a percentage of the federal poverty level), five health factors (percentage of low birth weight babies, teen birth rate, infant mortality rate, percentage of uninsured children, and maltreatment of children ages 0–5), and two educational factors (preliteracy skills measured at kindergarten entry in 2015 and the percentage of children in publicly funded early childhood programs in 2015; Tulane Institute of Early Childhood Mental Health & Louisiana Department of Health, 2016). We sort parishes into quartiles based on their index scores, with higher index scores demonstrating greater local risk.
Analytic Strategy
This descriptive study highlights the initial level of ECE quality in Louisiana the first year systemwide data were collected and identifies variability in quality across sectors and parishes. We then document changes in quality between 2016 and 2019 and explore whether growth varies across sectors and communities as well. To do so, we calculate average CLASS scores in 2016 statewide, within each sector, and within each quartile of parish risk. We also estimate the proportion of programs that were rated as Proficient or above overall, by sector, and by quartile of parish risk. We then look at changes in quality over the subsequent 3 years, again documenting overall statewide patterns and disaggregating by sector and parish risk. Because our data include the entire population of publicly funded ECE programs in Louisiana, we make simple comparisons of these means, without tests for statistical significance.
Changes in quality over time could be driven by improvements within individual programs and by changes in the composition of programs operating within Louisiana’s QRIS. For instance, even if quality remained stable at all existing programs, the overall quality in the state could improve if low-performing programs are shutting down and/or if higher-quality programs opened after 2016. To isolate the within-program improvement trends between 2016 and 2019 among the 1,458 programs in the sample for more than a single year, we run an econometric program fixed effects model, which estimates an individual intercept and slope for each program and is equivalent to a random effects model in hierarchical linear modeling. This model shows us the average within-program growth over time and assesses whether observed changes in CLASS reflect changes to the composition of programs or improvement within programs.
Results
ECE Quality Levels by Sectors and Parish Risk
The first column of Table 1 shows that the statewide average CLASS score in 2016 was 4.70, 0.20 points above the 4.50 threshold for proficiency. In that first year of statewide quality measurement, 62% of programs were rated as Proficient or above. Appendix Table A4 disaggregates the overall scores into individual domains and highlights that initial scores were lowest in the instructional support (pre-K) and engaged support for learning (toddler) domains.
Table 1 also highlights substantial differences in average CLASS scores across sectors. In 2016, the average CLASS score in child care programs was 4.30, 0.20 points below the threshold for proficiency. Forty percent of child care programs were rated Proficient or above. CLASS scores and rates of proficiency were far higher among Head Start (4.64 points or 0.47 of a standard deviation higher, 61% Proficient or above) and pre-K programs (5.16 points or 1.20 standard deviations higher, 88% Proficient or above) than child care, respectively. Figure 1 shows the distribution of program quality by sector for 2016 and indicates that the sector averages mask both considerable variability in scores within each sector and overlap across sectors; many child care and Head Start programs were rated as high or higher than pre-K programs.

Distributions of 2016 CLASS scores across sectors.
Table 2 presents average CLASS scores and rates of proficiency in programs across each of the four quartiles of parish-level risk. Programs in the lowest-risk parishes (Quartile 1) earned the highest CLASS scores (4.80) and rates of proficiency (65%). Notably, the relationship between parish risk and CLASS was not linear. Average scores and proficiency rates were the lowest in Quartile 3 (4.58 and 58%), rather than in Quartile 4, the highest-risk group. Relative to Quartile 3, average CLASS scores were 0.31 of a standard deviation higher in Quartile 1 (lowest-risk parishes), 0.18 of a standard deviation higher in Quartile 2, and 0.17 higher in Quartile 4 (highest-risk parishes).
CLASS Scores and Proficiency by Year and Parish Risk Quartiles

Note. N = 1,871 total programs. Standard deviations in parentheses. The abbreviation pp stands for percentage points. CLASS = Classroom Assessment Scoring System.
Quality Improvement From 2016 to 2019
Table 1 shows that average program-level CLASS scores in Louisiana increased from 4.70 in 2016 to 5.13 in 2019, an increase of 0.61 of a standard deviation. Similarly, the statewide rate of proficiency increased 23 percentage points, from 62% to 85%.
Statewide quality can improve either if individual programs are improving or if there are compositional changes related to quality, for example, if lower-quality programs close. Appendix Table A5 presents results from panel regressions of program-level CLASS scores on indicator variables for year, with and without program fixed effects. We found that the observed increase in CLASS scores over time was due, in large part, to individual program’s CLASS scores improving: the average program improved by 0.37 points over the time series (Column 2), and was 20 percentage points more likely to be rated Proficient or above in 2019 than in 2016 (Column 4). On average, the 1,280 programs present across all 4 years of the study improved from 4.79 to 5.17.
We probed this finding further in two ways. First, we explored whether program entry and exit contributed to overall improvement. Appendix Figure A1 shows that programs exiting the sample after the 2016 school year demonstrated lower CLASS scores (4.23) than programs that entered in 2017 (4.47), 2018 (4.73), or 2019 (4.88), suggesting that program composition also played a role in improvement.
Second, we explored variability in growth by initial program quality by estimating average CLASS scores for 2017, 2018, and 2019 for those who did not score Proficient (i.e., Unsatisfactory or Approaching Proficient) in 2016 and those who scored Proficient or above (i.e., Proficient or Excellent). Appendix Figure A2 shows that programs that initially had lower CLASS scores improved more sharply between 2016 and 2019 than those with higher ratings. Specifically, programs that were initially not Proficient increased by 0.87 points on CLASS from 3.96 to 4.83, whereas programs that initially scored at Proficient or above increased by 0.19 points, from 5.14 to 5.33.
Improvement Trends by Sector
As shown in Table 1, growth in CLASS scores was the largest in child care programs, where the average score rose by 0.57 points to 4.87 over the period considered. This is consistent with the evidence above that initially lower-scoring programs showed larger gains in CLASS over the 4-year period. The average score in Head Start programs rose 0.37 points to 5.01. Growth in pre-K program quality was smaller (+0.27 points to 5.43) than in both child care and Head Start. However, this sector still received the highest scores on average in every year. Figure 2 highlights the steep upward trend in CLASS scores within child care programs and the decreasing size of the gap between average scores for child care and other sectors. The gap between child care and pre-K decreased by more than 33%, and the gap between Head Start and child care was reduced by nearly 60%.
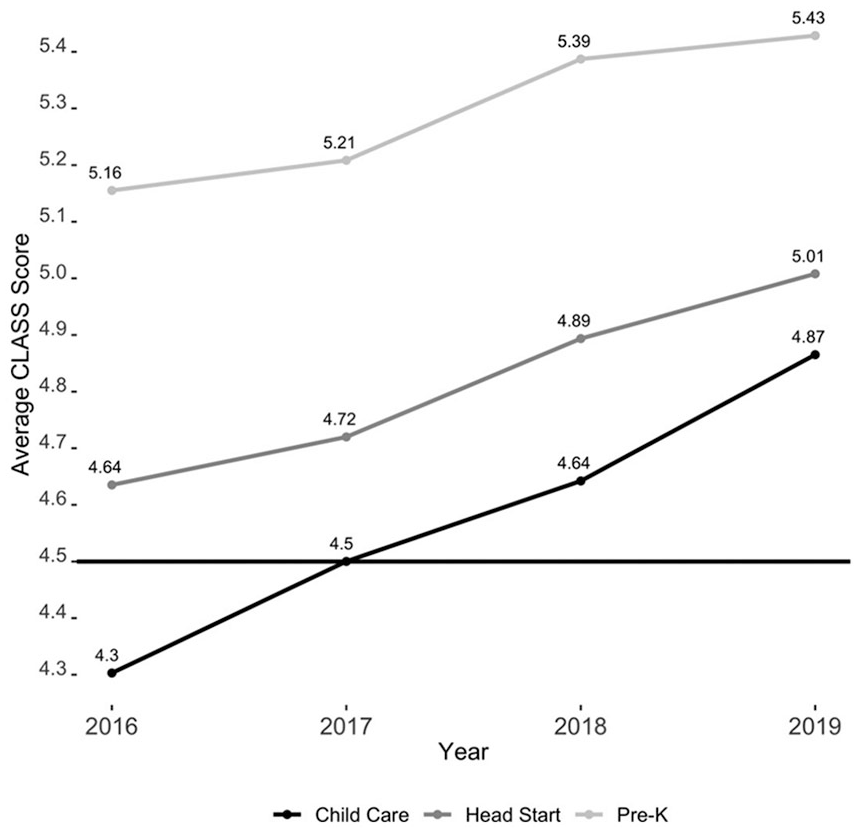
CLASS trends by sector, 2016 to 2019.
These trends were also reflected in percent proficiency. While the vast majority of programs across sectors earned scores above the 4.50-point threshold for proficiency by 2019, the biggest change in proficiency rates was in the child care sector (Table 1). By the end of the study, 73% of child care programs (up from 40% in 2016), 93% of Head Start programs (from 61%), and 95% of pre-K programs (from 88%) were rated Proficient or above.
Improvement Trends by Parish
Figure 3 presents maps that show average CLASS scores in each parish, from 2016 to 2019. The shading corresponds to quintiles of 2016 CLASS scores. The darkening of the maps from year to year shows that CLASS scores improved in most parishes. By 2019, average CLASS scores in most parishes exceeded 4.82 (the 60th percentile in 2016 scores) and often reached above 5.04 (the 80th percentile in 2016).

CLASS scores across parishes.
Table 2 examines whether rates of improvement in CLASS scores were associated with parish risk scores. Figure 4 shows the growth trajectories by quartiles of parish risk from 2016 to 2019. Overall, initial program growth was slower in higher-risk parishes but trends stabilized over time. Programs in risk Quartiles 1 and 2, the lowest-risk parishes, improved steadily each year, and reached an average score of 5.26 and 5.12 (+0.46 points and +0.41), respectively by 2019. More than 85% of programs in these lower-risk communities were rated Proficient or above in 2019. Quartile 3, which demonstrated the lowest initial CLASS scores, grew more than their counterparts in Quartiles 1, 2, and 4 over the time series (+0.52), consistent with patterns observed across sectors. Like Quartiles 1 and 2, programs in this quartile showed consistent growth each year. In contrast, programs in Quartile 4 demonstrated very little improvement between 2016 and 2017, but afterward showed a more rapid upward trajectory than their more advantaged counterparts. By 2019, programs in the highest risk quartiles looked similar to programs in Quartile 2, although all three still earned lower ratings and were less likely to be rated Proficient or above than programs in the lowest-risk quartile.
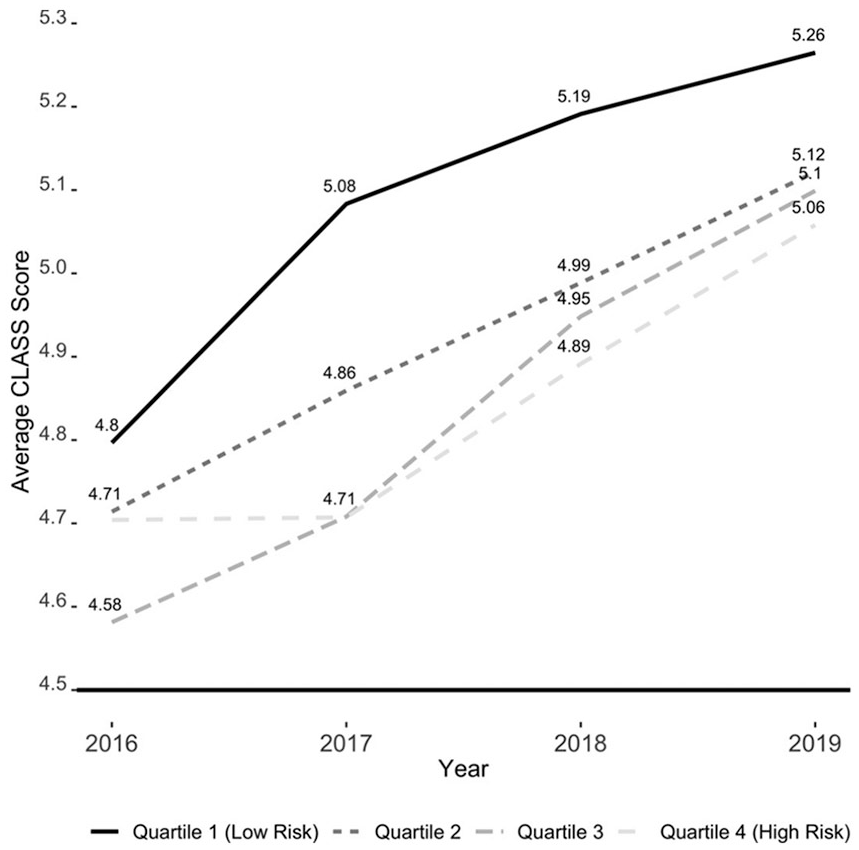
CLASS trends by parish risk quartile, 2016 to 2019.
Discussion
Over the past two decades, policymakers have made considerable investments in improving the quality of ECE programs at scale, across cities, states, or nationwide. Unfortunately, there has rarely been systemwide data to measure the quality of ECE programs at a single point in time, let alone whether quality is improving over time. Given the emphasis on and resource commitment to quality improvement, this is a substantial limitation. Investing in quality improvements without a way to assess whether those investments led to change is inefficient. Louisiana’s investment in systemwide data collection highlights an alternative. Data collected as part of their QRIS provide rich information on ECE quality both across sectors and over time. They allow for the first study to leverage detailed quality information from all publicly funded ECE programs (including subsidized child care, Head Start, and pre-K) statewide to examine quality in both a single year and over time. In doing so, this study both provides a careful look at how quality changed in Louisiana during a period of intensive, targeted investments in ECE quality and highlights how QRIS and other systemwide data collection systems could play an important role in building our understanding of ECE quality improvement efforts at scale.
Contextualizing Program Quality and Improvement in Louisiana
In 2016, average CLASS scores in Louisiana were 4.70, with a standard deviation of 0.71. This level of CLASS was higher, on average, than studies of other ECE contexts, including Georgia’s pre-K program (Bassok & Galdo, 2015) and Head Start (Aikens et al., 2016), but lower than ECE settings known to be of particularly high quality (e.g., Boston public pre-K; Weiland et al., 2013; see Appendix Table A6). The state average masked considerable variability by sector, however, with the average CLASS score in child care more than half a standard deviation lower than the mean, consistent with earlier studies comparing quality across ECE contexts.
Quality also differed by parish risk level, such that parishes categorized as having the lowest risk factors offered higher quality ECE than parishes with higher risk. This finding is similar to Bassok and Galdo’s (2015) study, which showed that average CLASS domain scores in Georgia’s pre-K programs were between 0.13 and 0.25 points lower in high-poverty ZIP codes than in low-poverty ZIP codes. However, gaps in initial quality were greater across sectors than across parishes. Furthermore, CLASS scores were not the lowest in the most high-risk quartile, but rather in the next quartile up. One possible explanation is that families living in the highest-risk parishes were more likely to attend Head Start and pre-K programs—which target the lowest-income families—than families living in Quartile 3 parishes. In 2016, 47% of programs in Quartile 3 were child care centers compared with 43% in Quartile 4. To the extent that quality is, on average, lower in child care centers, this may account for the observed pattern. In other words, access to quality care in some communities may be driven by sector composition (see Appendix Table A1). Improving access to quality ECE in some parishes may require investments in child care specifically, which may be the main option for many low-income children who just miss the eligibility cutoff for targeted programs, and serves nearly all children aged 0 to 3 years. Though per pupil spending in child care and schools is currently similar (see Measures section above) the cost of educating younger children is higher than for 4- to 5-year-olds largely because of the smaller ratios safe care requires. Moreover, school-based ECE benefits from existing school infrastructure, including administrative support and maintenance staff; shares costs for staffing across a far larger number of students; and is typically not encumbered by specific large costs that child care centers face, including mortgage and rent payments. Focusing additional spending on this sector could free up centers to more boldly pursue a quality improvement agenda.
Quality Improvement
We find that in the 4 years following the introduction of Louisiana’s QRIS, there was substantial quality improvement on CLASS across the state (0.61 SD), and that this improvement was driven by within-program changes. Improvement was the largest in child care settings (compared with pre-K and Head Start). Indeed, the proportion of child care programs meeting the proficiency standard increased from 40% to 73% over the time series, narrowing the proficiency gap between child care and pre-K by more than half (from 48 percentage points in 2016 to 22 in 2019). Similarly, we find some evidence of narrowed quality gaps between the high- and low-risk communities. Notably, this growth was nonlinear, such that programs in the most at-risk communities did not show growth until the final 2 years of the study, suggesting that parishes facing the highest levels of community risk may face more substantial barriers to quality improvement and may need targeted supports.
The overall improvements in quality documented in this study are both larger than those observed in other settings (e.g., Aikens et al., 2016) and likely large enough to be meaningful for children. Due to data limitations, there have not yet been studies that explore whether systemwide improvements in ECE quality lead to developmental gains for children, although many studies do show that children learn more in programs with higher CLASS scores (e.g., Araujo et al., 2016; Burchinal, 2018; Hamre, 2014; Vitiello et al., 2018; Weiland et al., 2013). These findings suggest that the changes in Louisiana led to improved school readiness, and testing this question empirically is a key area for future research, which would be supported by improved data systems like Louisiana’s.
Implications for ECE Reform in Other States
Louisiana’s efforts to improve ECE quality systemwide may provide useful lessons for other states pursuing quality improvement. Since the passing of Act 3, Louisiana has invested substantially in ECE quality with the goal of ensuring that all programs, irrespective of sector or community, offered high-quality learning opportunities for young children. At the heart of their strategy was their unique QRIS, which was mandated for all publicly funded programs and which focused all sectors on a common definition of quality focused on teacher-child interactions.
LDOE invested heavily in building both buy-in from ECE leadership statewide and an extensive infrastructure to support improvement. For instance, prior to launching the QRIS, LDOE leadership traveled throughout the state to explain the importance of teacher-child interactions, introduce the CLASS, and build excitement about the reform. They conducted two QRIS “pilot years” to ensure a smoother statewide roll out. LDOE subsidized CLASS trainings and professional development opportunities for early educators to build local understanding of and capacity around the CLASS. They have required struggling programs to build improvement plans that center teacher-child interactions. They have incentivized CLASS growth through financial incentives (tax credits), and by publicly celebrating both high-scoring programs and programs that have demonstrated substantial growth.
Notably, these strategies have focused on improvement both at the bottom and at the top of the quality spectrum. Louisiana integrated their QRIS with licensing such that programs that score “Unsatisfactory” in two consecutive years lose their license, creating a floor for quality. They also incentivize continuous improvement through tax credits that increase in size as programs improve their quality rating. Louisiana’s recent addition of the “High Proficient” category, for example, demonstrates how the state is creating manageable quality goals and incentivizing centers to reach them. This approach mirrors approaches toward quality improvement used by other states—but because of how Louisiana’s QRIS is structured, there is consistency in how quality is defined at all levels (e.g., at both the bottom and the top), which may make it easier for centers to view quality improvement along a continuum.
Recent survey data from Louisiana suggests that this investment in building buy-in around a single, simple definition of quality has paid off: nearly all ECE program directors and teachers feel that they understand and value the CLASS and that Louisiana’s focus on the CLASS—and thereby the QRIS itself—is improving ECE quality (Bassok et al., 2019). This high level of buy-in is encouraging, but ultimately the state wanted to ensure that their various efforts led to actual increases in quality. Their investment in comprehensive data collection—including observation data from every publicly funded ECE classroom in the state—allowed them to track whether quality did in fact increase, and how patterns differed across sectors and communities. In the absence of these data, the state would have no way of knowing, for example, if quality gaps between child care and pre-K had narrowed.
Although our study did not seek to, and cannot, evaluate the causal impact of Louisiana’s reform, or of any specific policy they introduced, it does provide compelling evidence that over a period in which the state focused heavily on improving teacher-child interaction quality, and created strong incentives for improvement, CLASS scores went up considerably statewide, across nearly all parishes, and in all sectors. Knowing if and where quality is improving allows policymakers to iteratively refine policies and target resources effectively.
The data the state collected could also facilitate future analyses that rigorously identify the impact of specific policies and initiatives or that explicitly test the returns on particular investment. They provided the data necessary to conduct studies that test the effectiveness of efforts to foster quality improvement at scale.
In this way, Louisiana provides a case study for other cities and states investing in quality improvement. Replication of Louisiana’s approach would likely require not just attention to policy rollout, local buy-in, and funding for strategies for quality improvement but also a real investment in statewide data infrastructure. Louisiana highlights the potential power of QRIS or other systemwide data for tracking quality improvement and potentially for evaluating the efficacy of ECE policies. The mandatory nature of their QRIS is particularly important. So long as participation in QRIS is voluntary, or programs can opt to participate only very superficially, it will not be possible to learn from QRIS data in the same way, or to use the data to examine the effects of specific investments on quality systemwide. QRIS could be an essential stepping stone toward building comprehensive ECE data systems that allow us not only to capture key areas of need but also to better understand whether quality is improving and to observe changes that occur in response to policy changes.
Limitations
While our study demonstrates that CLASS scores went up systemwide in Louisiana, it does not explain why they did. We cannot identify whether and which policy investments led to changes. We cannot be sure that other factors that may have been changing in Louisiana over time (e.g., changes in the composition or skills of the children in the classroom, changes in the way observers rate classrooms) did not play a role. And we cannot be sure that the changes documented in the current study were meaningful for young children’s development.
In Louisiana, and in all states collecting QRIS data, questions remain about whether the data collected capture quality accurately, and whether improvements over time matter for children. Many recent validation studies suggest that QRIS scores fail to accurately capture quality and do not reliably predict child outcomes (e.g. Cannon et al., 2017). The CLASS, which is the sole measure in Louisiana’s accountability system, has been widely validated in research contexts and to date remains the ECE quality measure that has most consistently been associated with children’s development. However, it is not yet clear whether the changes in CLASS scores documented in this study led to improvements in children’s development.
Most studies that have shown a positive relationship between CLASS scores and child outcomes have been based on data collected by research teams in “no-stakes” contexts and have focused on the classroom rather than the program level. In Louisiana, there are three important differences: CLASS is collected locally by practitioners, it is done in a context where increasingly there are meaningful stakes, and it is focused on program-level aggregations of classroom scores.
Louisiana’s decision to use local raters to measure quality was purposeful and aimed to create buy-in from local communities. It made implementation of such a large-scale observational system possible; however, there may be tradeoffs with the quality of scores—and thereby our understanding of the quality experienced by children. The reliance on local observers and the incentives attached to program scores, combined with the fact that CLASS scores in Louisiana are higher than those observed in other contexts (see Appendix Table A6) may raise concerns about the validity of the CLASS scores. Specifically, are the scores accurate, and does the growth reported in this study reflect true improvements in quality, or might it capture inflation.
Unfortunately, we do not have data that can directly address this concern: that is, we lack the data to compare the local raters’ scores with those of other raters, or to test whether the increases documented on scores correspond to children’s developmental gains over a 4-year period. Instead, we raise three related pieces of evidence to bolster confidence about Louisiana’s ratings. First, all local CLASS observers are required to be certified on the CLASS using the standard qualifications for CLASS nationally. Raters are consistently double coded—a process in which a second observer rates simultaneously and scores are compared—to keep scores aligned with national standards. Second, LDOE contracts with certified CLASS observers from outside the local parish to conduct observations in half of Louisiana’s ECE classrooms each year and compares those observation scores with those conducted in the same classrooms by local CLASS observers. When there are significant discrepancies, these “third-party” scores replace the local ratings. In the current study, we used the third-party ratings when such a replacement occurred. Finally, previous research in Louisiana has found both a correlation between local raters and independent, research-trained raters (r = .36; Vitiello et al., 2018) and a correlation between local observers’ CLASS scores and children’s learning gains, although this study was conducted prior to the full implementation of consequential accountability.
Future research should continue to address questions of validity in large-scale rollouts of tools initially designed for research (e.g., Head Start; Derrick-Mills et al., 2016). There is a need for developing other tools for measuring process quality in ECE classrooms. Similarly, more work is needed to test whether aggregation to the program level diminishes the validity of CLASS and other classroom-level measures as predictors of children’s growth and development (although analyses by classroom suggest that individual classroom quality is also improving, see Appendix Tables A2 and A3).
Conclusion
This article is the first to describe the levels and changes in ECE quality across the universe of publicly funded center-based ECE options in a state. Our results indicate not only that quality increased on average but also that improvement trends reduced disparities in quality across sectors and parishes.
These encouraging results are consistent with the notion that Louisiana’s singular focus on measuring and improving teacher-child interactions in ECE settings led to meaningful improvements in young children’s experiences in publicly funded ECE settings. Of course, the current analyses do not document the effect of Louisiana’s reform efforts, nor do they allow for the identification of any causal relationship between specific LDOE improvement initiatives and quality gains. Rather, the goal of the article was to highlight the importance of collecting systemwide data needed to ultimately do those types of analysis, and more broadly to accurately measure the quality of early learning opportunities systemwide. Investing in quality improvement without simultaneously tracking quality will lead to inefficient, potentially wasteful policies, and an inability to adjust course. Conversely, rich data that allow researchers and policymakers to better understand whether and for whom quality is improving is critical.
Footnotes
Appendix
Comparisons of CLASS Scores Across Studies, by Domain

| Domain | Louisiana | ||||||
|---|---|---|---|---|---|---|---|
| (1) | (2) | (3) | (4) | (5) | (6) | (7) | |
| Instructional Support | 2.06 | 2.04 | 4.30 | 3.26 | 2.40 | 3.39 | 3.83 |
| Emotional Support | 5.53 | 5.49 | 5.63 | — | 5.40 | 5.57 | 5.93 |
| Classroom Organization | 5.17 | — | 5.10 | — | 4.80 | 5.28 | 5.68 |
| Overall | 4.25 | — | 5.01 | — | 4.20 | 4.70 | 5.13 |
Note. Scores reflect domain-level averages from several large studies using data from the CLASS. Column (1) presents pre-K data from Georgia (Bassok & Galdo, 2015); Column (2) presents pre-K data from the National Center for Early Development and Learning’s (NCEDL) Multi-State Study of Pre-Kindergarten (Multi-State Study) and the NCEDL-NIEER State-Wide Early Education Programs Study (Burchinal et al., 2010); Column (3) presents pre-K data from Boston (Weiland et al., 2013); Column (4) presents pre-K data from Oklahoma (Johnson et al., 2016). Column (5) presents Head Start data from the 2014 Head Start Family and Child Experiences Survey (FACES) (Aikens et al., 2016); Columns (6) and (7) reflect 2016 and 2019 scores from this study. CLASS = Classroom Assessment Scoring System.
Authors
DAPHNA BASSOK is an associate professor of education and public policy at the University of Virginia. She studies early childhood education policy.
PRESTON MAGOUIRK is a data scientist at Common App. He studies education policy.
ANNA J. MARKOWITZ is an assistant professor of human development and psychology at the School of Education and Information Sciences at the University of California, Los Angeles. Her work focuses on the ways in which policy affects the adults young children spend time with, and how this shapes children’s cognitive, social, and emotional development, particularly for children in families who are low-income or otherwise marginalized.