
Abstract
While research has documented outcomes for students served by promise programs, few studies have considered the behavior of institutions themselves in the promise era. A new source of revenue combined with larger and more diverse cohorts is likely to motivate changes in spending and staffing—decisions instrumental to student access and success. We employ complementary difference-in-differences and synthetic control strategies to estimate impacts of the first statewide promise program on these two outcomes. Findings suggest institutions diverted expenditures away from instruction, academic support, and institutional support toward greater institutional grant awards. We find no meaningful impact on staffing levels. While some institutional actions may further support the access and success goals of promise programs, the diversity of programs across the nation suggests not all may follow suit. This study should inform policy makers considering the full extent of outcomes of free-college programs and invigorate further research on institutional responses.
Keywords
Introduction
Following the 2005 start of Kalamazoo Promise, “free-college” programs gained political traction at federal, state, and institutional levels (Billings, 2018). The College Promise Campaign (2019) reported that over 300 promise programs exist across the nation, with 23 states already offering a statewide program and at least 13 more beginning implementation (Kanter & Armstrong, 2019). While promise programs vary widely in their design, they generally consist of a place-based scholarship aimed at increasing students’ access to college (Miller-Adams, 2015; Perna & Leigh, 2018). Across multiple states and regional contexts, existing literature has suggested that promise programs not only increase college enrollments, but emerging evidence suggests they may also alter the composition of institutions’ student bodies, either by increasing enrollments of low-income or racial-minority students or by diverting university-bound students toward promise-eligible community colleges (Bartik et al., 2019; Gándara & Li, 2020; Gurantz, 2020). Promise programs are also fundamental changes to institutions’ resource environments, representing the availability of a new source of revenue, a change to an existing revenue stream, or, for new institutionally funded programs, a constraint on other expenditure areas. In any of these realities, institutions facing increased enrollments, particularly among more academically, racially, or socioeconomically diverse students, may be called to alter expenditures to meet the needs of larger, more diverse cohorts of students or to consider how their operations can best serve a growing student body. This is particularly likely if institutions, like community colleges, face existing capacity constraints (Goldrick-Rab, 2010; Palmer, 2013). In all, whether colleges strive to serve new students or to maintain or acquire new resources (or both), promise programs likely influence institutional behavior (Perna et al., 2020; Perna et al., 2021).
Given their political popularity, the growth of promise programs has rapidly outpaced evaluations of their effects, but work to date has been diverse given substantial variation in the programs themselves (Page et al., 2019). Most investigations have focused on students’ enrollment and persistence in higher education (Perna & Smith, 2020). However, an almost exclusive focus among existing research documenting impacts on student outcomes has yielded too few studies that consider institutional responses (Perna et al., 2020; Perna et al., 2021; Swanson et al., 2020). It has been well established that how institutions spend their money matters, and a large body of evidence has linked institutional expenditures and staffing to a variety of outcomes, including enrollment, persistence, and completion (Bound & Turner, 2007; Bowen, 1980; Gansemer-Topf & Schuh, 2006; Ryan, 2005). If promise programs lead institutions to alter expenditures or change staff (e.g., by reducing academic supports or hiring additional advisors), these actions may not only impact subsequent student outcomes but may also influence the financial and programmatic stability of institutions and their free-college programs (Perna & Smith, 2020). Indeed, case studies by Perna and colleagues (Perna et al., 2020; Perna et al., 2021) showed how institutional resource decisions to support promise programs can directly contribute to program efficacy, efficiency, and equity, suggesting that institutional responses to free college programs may ultimately moderate programs’ impacts.
Too few studies to date have considered these institutional responses. Bell (2021) found that private institutions in Tennessee that were not eligible to participate in Tennessee Promise shifted enrollment behaviors to improve class sizes and increased tuition rates alongside public institutions, and Delaney and Hemenway (2020) found that single institution promise programs similarly increased tuition and fee rates and may have altered their grant aid awards. While these studies made important contributions to this gap in literature, they still fail to consider the full extent of possible institutional responses. To help fill this gap, Perna and colleagues completed case studies at four community colleges served by a local tuition-free program (Perna et al., 2020; Perna et al., 2021). The authors found descriptive evidence that institutions altered resource investments on financial aid awards, personnel, facilities, and materials to support these programs, ultimately finding that program eligibility criterion may influence these decisions, and, in turn, impact programmatic efficiency and equity (Perna et al., 2020; Perna et al., 2021). The authors therein called for future work to examine these impacts at a larger set of institutions, including those that serve multiple colleges. Since this call, no study to our knowledge has yet to causally link such promise program adoptions with changes in institutional spending or staffing, decisions with important implications for the students they serve and the states that house and support them.
Using a natural experiment, we address this gap by exploring changes in institutional expenditures by classification area and staffing levels by occupational category following the implementation of the nation’s first statewide promise program, Tennessee Promise. The program, which has boasted enrollments of nearly 108,000 since 2015, is a last-dollar scholarship serving the state’s 13-member community college system (Tennessee Higher Education Commission [THEC], 2021). Though promise programs differ in design, Tennessee Promise has been the “guiding model” for other states, and, as such, a better understanding of its effects on institutions’ behaviors will provide important insights not only for policy makers in Tennessee but also leaders in other states as they consider the design and operation of their own programs (Kanter et al., 2016; Kanter & Armstrong, 2019, p. 72). Changes in institutional spending or staffing may represent intended or unintended consequences, and, while research to date has yet to fully consider these possibilities, they must be understood if policy makers are to achieve a complete view of the impacts these programs have across state, institution, and student levels. Indeed, institutional actions in response to promise programs could either further contribute to or detract from the policies’ intended goals, altering policy makers’ cost–benefit considerations (Perna et al., 2020; Perna et al., 2021; Perna & Smith, 2020). In addition to filling this existing gap in the literature and generating actionable evidence for policy makers, this study also stands to invigorate future research in this area considering the institutional impacts of promise programs and how these impacts, if at all, may influence subsequent organizational or student outcomes.
Tennessee Promise
As a last dollar scholarship, Tennessee Promise covers up to the full cost of tuition and mandatory fees for 2 years (or 5 semesters) after all other aid has been applied, including Pell and the state’s merit- and need-based awards. The award is universally available to all recent high school graduates who pursue an associate degree or technical certificate. As noted, Tennessee Promise has served nearly 108,000 students since 2015, and, in 2018–2019, provided an average last-dollar award of approximately $1,183 ($2,146 excluding $0 recipients), with total program expenditures exceeding $28.7 million annually (THEC, 2021). 1 The program undoubtedly changed the context of higher education in the state. In its first year of operation, first-time freshman enrollment at community colleges rose 27.7%, but recent quasi-experimental evidence suggests the true impact could be closer to 40% (Carruthers, 2019; Nguyen, 2020; THEC, 2017a). Nguyen (2020) found these increases to be predominantly driven by higher enrollments of Black and Hispanic students, and THEC (2021) has reported increases in the average ACT scores and high school GPAs of entering community college students since Tennessee Promise began yet no meaningful change in Pell-eligible enrollments. Tennessee Promise students’ outcomes also appear to be positive, with students achieving higher retention and completion rates than their peers (Carruthers et al., 2018). These findings suggest that Tennessee Promise not only increased community colleges’ overall enrollments but also altered the academic and racial composition of their student bodies. On the financial front, while colleges likely benefitted from additional tuition and fee revenue given higher enrollments alone, these enrollments also contributed to a 33.5% increase in performance-based state appropriations for the sector from 2015–2016 to 2019–2020 (THEC, 2020). 2 These tuition and state appropriation increases resulted a total revenue-per-FTE-student increase of $531 over the same period (THEC, 2020). While not causally linked to the introduction of Tennessee Promise, these descriptive increases suggest that, in addition to enrollment changes, community colleges also experienced substantial changes to their resource environments—both of which could motivate alterations to institutional spending and staffing behaviors.
Literature Review
Though varying in design, promise programs often have a primary goal to increase college access by reducing or eliminating students’ information constraints and financial barriers (Page & Scott-Clayton, 2016; Perna & Smith, 2020). As a result, the policy has spread across the nation, with many political figures citing “free college” as a critical platform component (Perna & Leigh, 2018). The growing popularity of promise programs is attributable, in part, to the perception that they serve as an investment in human capital, producing benefits for both students and their local economies (LeGower & Walsh, 2017; Miller-Adams & Smith, 2018). On the student front, a diverse body of research has documented the impact of promise programs on students’ enrollment, persistence, and completion in higher education (Swanson et al., 2020). Among these works include studies showing how promise programs impact institutional enrollment levels and student-body compositions, as well as an emerging subgroup of work focused on campus responses to this new free-college era.
Promise Programs, Enrollment, and Student Composition
Across multiple states and program types, evidence consistently suggests that promise programs increase postsecondary enrollment levels (e.g., Bartik et al., 2019; Bifulco et al., 2019; Gándara & Li, 2020; Gurantz, 2020). In Tennessee specifically, Carruthers and Fox (2016) found the pre-Tennessee Promise Knox Achieves program led to a 3.5 to 4.0 percentage-point increase in the likelihood a student enrolled in college, particularly at a 2-year institution. Furthermore, Nguyen (2020) estimated the statewide Tennessee Promise increased overall first-time full-time enrollment at community colleges by approximately 40%, and House and Dell (2020) estimated an over 320 student increase to first-time, full-time (FTFT) enrollments at Tennessee Promise-eligible institutions. Even though programs’ features and designs vary, including in the presence of additional supports for students, Perna and colleagues’ multisite case studies observed that promise programs’ core financial aid component means they traditionally present with positive impacts on overall enrollment outcomes (Pernal et al., 2020; Perna et al., 2021). Furthermore, the authors found that, in addition to increasing enrollments of promise-eligible students, free-college programs may even increase enrollments of promise-ineligible students by broadly improving local college-going cultures and raising awareness of college opportunities.
Related evidence has also suggested that promise programs may alter the composition of institutions’ student bodies by increasing enrollments of low-income students and students of color, as well as by raising the academic profile of entering cohorts. Bifulco et al. (2019) found enrollment effects of the Buffalo Say Yes to Education program were most pronounced for low-income students, and Andrews et al. (2010) found similar impacts for low-income students in their evaluation of the Kalamazoo Promise. With regard to race, Bartik et al. (2019) found that impacts of the Kalamazoo Promise varied by students’ ethnic backgrounds, and recent evidence by Gándara and Li (2020) robustly suggests that promise programs at 2-year institutions led to large increases in Black and Hispanic enrollments. In fact, in our state of interest, Nguyen (2020) found that the largest enrollment increases from Tennessee Promise were among Black and Hispanic students. House and Dell (2020), however, found slightly different results when disaggregating by race, suggesting the largest enrollment increases from Tennessee Promise were among White students, followed by Black and Hispanic students. Finally, Tennessee Promise also increased the academic diversity of colleges by diverting university-bound students toward 2-year colleges (Carruthers et al., 2018; Carruthers & Fox, 2016). This diversion simultaneously increased cohorts’ average levels of academic preparation and the incidence of undermatch (House, 2017; Littlepage et al., 2018). As noted, THEC (2021) reported higher average ACT scores and GPAs among entering community college students after Tennessee Promise began, and, across other free-college programs, previous works have identified similar diversion effects (e.g., Gurantz, 2020; Perna et al., 2020).
Institutional Responses to Promise Programs
While evidence suggests promise programs not only impact overall enrollment levels but also influence the academic, racial, and socioeconomic composition of campuses, little is known about how institutions respond to these new realities. Institutions faced with these larger and more diverse student bodies may be called to alter expenditures or staffing patterns to meet the needs of these new cohorts. This may be particularly likely given the fact that providing comprehensive advising and targeted student success supports for these student groups can be expensive and may constrain already limited resources (Bailey et al., 2015; Jaggers & Karp, 2016; Kolenovic et al., 2013). Furthermore, given growing cohorts, institutions may be faced with the need to increase staffing capacity across areas with existing constraints, like instruction or student services, which are already strained at the community-college level (Schulock & Moore, 2005). Finally, even absent any increase in enrollment or a change in the composition of student bodies, in the case of promise programs funded by external sources (e.g., by states or regions), the availability of a new financial aid program may alone incent changes in institutional behaviors (e.g., Long, 2004; Singell & Stone, 2007). Yet despite each of these possibilities, existing research has largely failed to connect promise programs with these institutional practices.
As noted, only a few studies to our knowledge have considered institutional responses to promise programs. Bell (2021) found that public institutions increased average tuition and fee prices by almost 10% after Tennessee Promise, increasing their capture of federal, state, and other financial aid. Bell (2021) also found that ineligible private institutions shifted admissions behaviors to offset potential enrollment losses. Second, Delaney and Hemenway (2020) estimated impacts of local and single-institution free-college programs on tuition and fee levels and grant aid awards. The authors found heterogeneous changes to in-state tuition and fee rates among 2-year institutions, which fell along their proximity to locales served by the promise programs. Likely due to their last-dollar design, Delaney and Hemenway (2020) did not find changes to institutional Pell disbursements but did find that 4-year institutions increased the proportion of students awarded institutional aid by 18%. For last-dollar programs, like Tennessee Promise, eligible students’ award amounts depend on receipt of other grant aid, suggesting that first-dollar federal and other state awards would not be affected by last-dollar promise programs. Despite this, colleges themselves may alter institutional grant aid awards to preserve funds (i.e., rather than awarding first-dollar scholarships) or focus spending on students who are ineligible for the free-college program. Though the body of literature quantitatively assessing institutional responses to free-college programs is limited at this time, interest in better understanding these responses continues to grow in both academic and policy circles as such place-based programs proliferate across the country (Lowry et al., 2019).
In the closest investigation to ours, Perna et al. (2020) completed case studies at four colleges served by local tuition-free programs. While examining how these programs influenced student outcomes, the authors also asked what resources institutions invested to support them, ultimately concluding that these resource decisions moderated the programs’ effects. Perna et al. (2020) found that colleges responded to the introduction of local programs by not only altering financial aid spending to support the promise scholarship awards themselves but also by making strategic adjustments to personnel, facilities, and program materials. These decisions, which included moves to hire admissions counselors and student support specialists, develop a summer bridge program, reserve program-specific office spaces, and expand campus communications, were also in response to changes in the characteristics of enrolled students (Perna et al., 2020). While many of these activities did reinforce programs’ goals of access and success—and may ultimately also benefit promise-ineligible students via positive spillovers (e.g., increasing advisors could benefit all students)—Perna et al. (2020) also discussed how these shifting resources can have negative impacts. They offered that students not eligible to participate in the free-college program can be harmed if the program “reduces resources and supports available to these [non-promise] students” (p. 6) or, if “no new staff are hired, program personnel may reduce time spent on other institutional functions,” (p. 12), which may subsequently affect other areas of the college (Perna et al., 2020). The authors ultimately concluded that “Whether investing resources to assist recipients can come without harming nonrecipients may depend on whether new personnel are added and whether personnel can deliver a program without reducing time allocated to other activities” (Perna et al., 2020, p. 6). Finally, in a companion study, Perna et al. (2021) qualitatively reinforced the importance of individual program staffing—but also of financial resources more broadly—to support and sustain the four community college promise programs, offering that program administration, staffing, and organizational resources ultimately moderated program equity and efficacy. The authors observed that “To implement promise programs that improve equity, stakeholders should recognize how programmatic and organizational contextual conditions influence program coverage and content. These conditions may work for or against efforts to promote equity” (p. 22), suggesting that better understanding how institutions administratively respond to free-college programs has important implications for subsequent student and organizational outcomes.
Conceptual Framework
Promise programs, particularly those with statewide reaches like Tennessee Promise, alter the environment within which institutions operate, and much of an institution’s actions can be understood as rational responses to this ever-changing environment. In our context, Tennessee Promise not only represented a shock to community colleges’ economic environments but also to their stakeholder groups, or “customer” base. That is, the program simultaneously increased demand for enrollment, including by altering the composition of incoming students across academic, racial, and socioeconomic dimensions, while also serving as the introduction of a new state financial aid program (i.e., the availability of a new or altered source of possible revenue). Resource dependence theory provides an optimal lens through which to consider this phenomenon and subsequent institutional behavior. Resource dependence suggests institutional actions are shaped by the availability of resources and posits that institutions will respond to shocks in these environments to preserve and acquire scarce resources required for survival (Pfeffer & Salancik, 1978; Tolbert, 1985). Indeed, prior work has shown that community colleges are particularly sensitive to shifts in state policy and shocks in funding (e.g., Li & Ortagus, 2019; Ortagus & Hu, 2019). Here, Tennessee Promise’s infusion of new revenues to community colleges through higher tuition-funded enrollments and subsequent state appropriations was complemented by an increasing demand to serve larger and more diverse cohorts. Resource dependence posits colleges will leverage these resources and, if necessary, alter behaviors to serve these new students effectively and efficiently.
Public institutions are increasingly reliant on tuition and fee revenues to fund ongoing operations (State Higher Education Executive Officers Association, 2020). In 2016–2017, Tennessee’s community colleges earned over half (55.8%) of total revenues from tuition and fees, up from 43.6% just 10 years prior (THEC, 2016a). When political or resource environments shift, institutions may alter behaviors to pursue the maintenance or acquisition of these scarce resources (Fowles, 2014). A robust body of work has documented this phenomenon, wherein, institutions increase tuition and fee rates, for example, in response to new aid programs (Long, 2004; Singell & Stone, 2007). Indeed, both Bell (2021) and Delaney and Hemenway (2020) observed this behavior among institutions affected by promise programs, including those in Tennessee. While these actions may be pronounced at community colleges or institutions who may have already-constrained resources, these activities need not focus exclusively on the acquisition of new funding; rather, altered environments may similarly incent behavioral changes to maintain resources. This could include shifting behaviors to better serve existing and new student populations to increase retention and success rates. Such an accomplishment would yield more tuition and fee revenue through continued or additional enrollments, and, in Tennessee, increase state appropriations through the state’s performance-funding formula. In this reality, institutions may, for example, find a need to employ more academic advisors given additional students; develop more robust student support services given more academically, racially, or socioeconomically diverse cohorts; or spend less on institutional financial aid awards given the presence of a new, external financial aid program. Indeed, in addition to Perna et al.’s (2020; Perna et al., 2021) case studies documenting how colleges may provide additional personnel or resources to promote the success of free-college programs, several quasi-experimental analyses of scholarship programs in other states found increased expenditures in ways that complemented the goals of the aid policy (e.g., by providing advising services or cohort-building supports to students served by a free-college program; Calcagno & Alfonso, 2007; Doyle et al., 2008; Iriti et al., 2018; Weiss et al., 2019). This was the case for Delaney and Hemenway (2020), who observed that institutions increased the coverage of institutional grant aid following a promise program.
In all, the Tennessee Promise shock to community colleges would lead to institutional responses that facilitate the acquisition of new resources and provide for the maintenance of existing ones. These include ways to serve larger numbers of state-tuition–funded students and support the retention and success of newer cohorts in pursuit of additional tuition revenues and state appropriations. Such behaviors could include changes in spending or staffing practices, decisions which subsequently affect a variety of student and organizational outcomes. While some institutional responses may further support the goals of Tennessee Promise, others could also carry unintended consequences (e.g., given that newer cohorts are more academically accomplished, they may demand fewer academic supports, leading institutions to reduce costly support services that could negatively affect other student groups). If such responses to promise programs stand to limit access and success goals, policy makers must fully understand these possibilities in order to mitigate any such unintended effects (Perna et al., 2020; Perna et al., 2021; Perna & Smith, 2020). Conversely, if institutional responses augment the goals of free-college programs (e.g., through the diversion of existing institutional aid toward promise-ineligible students, thereby reducing affordability constraints for larger groups), policy makers must also gain a more complete view of these programmatic impacts across state, institution, and student levels. Our study seeks to contribute to this growing literature and provide this actionable evidence by rigorously examining institutional responses to the nation’s “guiding model,” Tennessee Promise (Kanter & Armstrong, 2019, p. 72).
Data
Data for our study come from a variety of sources. First, we leverage the U.S. Department of Education’s Integrated Postsecondary Education Data System (IPEDS) to observe our primary outcomes of interest from academic year 2010–2011 through 2018–2019. We collect annual campus expenditures encompassing the academic, administrative, and student success missions of institutions, including spending on instruction, academic support, student services, institutional support, and scholarships. Similarly, we focus on four primary staffing areas, including total positions and those classified separately as instructional, student affairs, and administrative. In addition to these outcomes, we collect institutions’ full-time equivalent (FTE) enrollment levels to transform each expenditure and position count to a per-FTE basis, allowing us to observe changes in expenditure and staffing levels on a common student-unit.
Beginning with the universe of public community colleges in IPEDS, we limited our sample to those who are degree granting and do not solely provide instruction via distance education. 3 We also included only institutions with FTFT undergraduate students and whose highest award is the associate degree (n = 876). 4 Second, we remove institutions in the five other states with statewide promise programs, as identified by Perna and Leigh (2018), as well as any institutions identified as being served by local or regional promise programs (Delaney & Hemenway, 2020; Delaney & Leigh, 2020; Gándara & Li, 2020; n = 46). 5 Third, across the 9-year panel, 283 community colleges did not report to IPEDS in each year. These represent newly opened or recently closed community colleges, which could have systematically different expenditures or staffing patterns. For this reason, we limit our sample to the 547 who did report across the entire panel. Among this final sample, we employ within-campus linear interpolation for any missing outcome or covariate values and adjust all financial variables to the consumer price index (CPI) for the past fiscal year (2019). Our final sample covers 547 community colleges across nine academic years, rendering 4,923 campus-by-year observations. 6
To supplement our outcome data, we collect several time-variant county and state-level controls predictive of community college expenditures, including those related to institutional exposure to a promise program. A host of prior works have documented the close relationship between community colleges and their local economies (Crookston & Hooks, 2012; D’Amico et al., 2013), including how college enrollments, revenues, and expenditures are influenced by local area unemployment rates and revenue sources (e.g., income, sales, and property taxes) (Dowd & Grant, 2006; Hillman & Orians, 2013; Pennington et al., 2002). To control these influences, we leverage the U.S. Census Bureau’s American Community Survey to observe county-by-year unemployment rates, median family income, and median home values. Furthermore, prior works have observed how state-level factors relate to institutions’ exposure to promise programs, which, as we hypothesize, would alter subsequent expenditure or staffing patterns. Delaney and Leigh (2020) found that state unemployment rates, income inequality (measured by the Gini index), and state gubernatorial party were significantly predictive of the establishment of a promise program. In addition to this work, a collection of prior studies have linked state-level resources, economic contexts, and state leadership with community college behaviors and outcomes (Kane & Rouse, 1999; Perna & Finney, 2014; Tollefson, 2009; Townsend & Twombly, 2001). To control these influences, we collect state-by-year unemployment rates and Gini values from the American Community Survey and capture state-by-year gubernatorial party control indicators from the Council of State Governments (2019). For all calendar year variables (e.g., 2010), we match with the fall academic year (e.g., 2010–2011) when merging with IPEDS.
Empirical Strategy
We seek to estimate the effect of Tennessee Promise on two primary outcomes at community colleges: expenditures by category and staffing levels by classification. Given the program’s 2015–2016 introduction, we first employ a difference-in-differences (DID) strategy to compare these outcome changes in Tennessee to all other colleges in the nation. Second, we leverage a complementary synthetic control approach that generates a weighted counterfactual unit to closely resemble Tennessee community colleges prior to the introduction of Tennessee Promise so that we can compare Tennessee to an optimal peer group. Finally, in the appendix, we detail the design and execution of a dosage-based DID estimator that leverages variation in the proportion of students who are Tennessee Promise eligible across the state’s colleges.
Difference-in-Differences
DID is a common identification strategy when estimating causal impacts of program or policy introductions given that it exploits variation across both units (treatment and control) and time (before and after). In our case, DID allows us to compare expenditure and staffing outcomes for community colleges in Tennessee (treatment) to those in all other states (control) before and after the program’s 2015–2016 introduction. For this reason, DID has been a common tool for other evaluations of Tennessee Promise (Bell, 2021; Odle et al., 2021). Formally, to estimate impacts of on community college expenditures and staffing behaviors, we fit

where yicst is the outcome of interest for college i in county c, state s, and year t, conditioned on college (
The primary condition for any DID analysis is for treatment and control groups to exhibit parallel outcome trends prior to a policy change (Angrist & Pischke, 2009). The method then relies on an assumption that these “parallel trends” would continue in the absence of treatment (Imbens & Wooldridge, 2009). To assess the plausibility of parallel trends, many DID studies implement a complementary event-study design. Event studies can formally test for significant outcome deviations between treatment and control groups prior to a policy change and assess the magnitude and direction of impacts following the policy (Cunningham, 2021; St. Clair & Cook, 2015). To do this, we estimate

where the specification is the same as Equation (1) but we now interact the dummy treatment indicator for each college in Tennessee (Treat
i
) with each year factor (

Event-study plots for expenditures per FTE (log), by spending category.

Event-study plots for staffing per FTE (log), by occupational classification
Among expenditure outcomes, Figure 1 shows that the total, instruction, academic support, institutional support, and scholarship outcomes generally meet the parallel-trends assumption. Each plot shows consistently estimated, near-zero differences between Tennessee and the control institutions in the pretreatment period, and, even when significant differences are detected in the pretreatment period (e.g., for instruction in 2012 and 2013), they appear in the opposite direction than the estimated impacts in the posttreatment period. That is, Tennessee’s community colleges spent more on instruction in those years in the pretreatment period but significantly less in the posttreatment period. This shift in the outcome trend suggests a systematic change in these differences and means any estimated reduction in community college spending is not driven by colleges already spending less than their peers prior to Tennessee Promise. Among the student services outcome, however, the event study plot casts doubt on the parallel-trends assumption (i.e., given consistently and significantly higher expenditure levels), which extends to the staffing outcomes (Figure 2). Here, the instructional and student affairs categories appear to be the only ones to meet the parallel-trends assumption. These results encourage caution when interpreting estimates from these specific models and motivate our use of a complementary strategy that empirically relaxes this strict parallel-trends assumption. 9
Synthetic Control
While DID estimators rely on researchers’ selection of counterfactual groups, synthetic control methods generate a weighted comparison unit that is as statistically similar as possible to the treatment group outcomes in the pretreatment period (Abadie et al., 2010; Abadie et al., 2015; Abadie & Gardeazabal, 2003). By eliminating any pretreatment differences between treatment and control groups on the outcome of interest, DID’s parallel-trends assumption can be relaxed (Rubin & González Canché, 2019). Similar to DID estimators, however, synthetic control methods compare outcomes in the posttreatment period between treatment and weighted control groups to estimate impacts of a policy change. This has coined synthetic control a “generalization” of DID (Cunningham, 2021, p. 512), though its application to education remains underutilized (Jaquette et al., 2018; Odle, 2021; Ward & Ost, 2021). Similar to our case, Nguyen (2020) recently complemented their DID analysis estimating impacts of Tennessee Promise on institutional enrollments with a generalized synthetic control approach.
To exhibit synthetic control’s superior control over parallel-trend concerns, we implement the generalized synthetic control method, which allows for multiple treated units, for each expenditure and staffing outcome. This approach was pioneered by Xu (2017) and leverages an interactive fixed effects model given by

where unit-specific intercepts (factor loadings, λi) are interacted with time-varying coefficients (factors, ft) to perform the optimal weighting process as a function of observable covariates (

Synthetic control plots for expenditures per FTE (log), by spending category
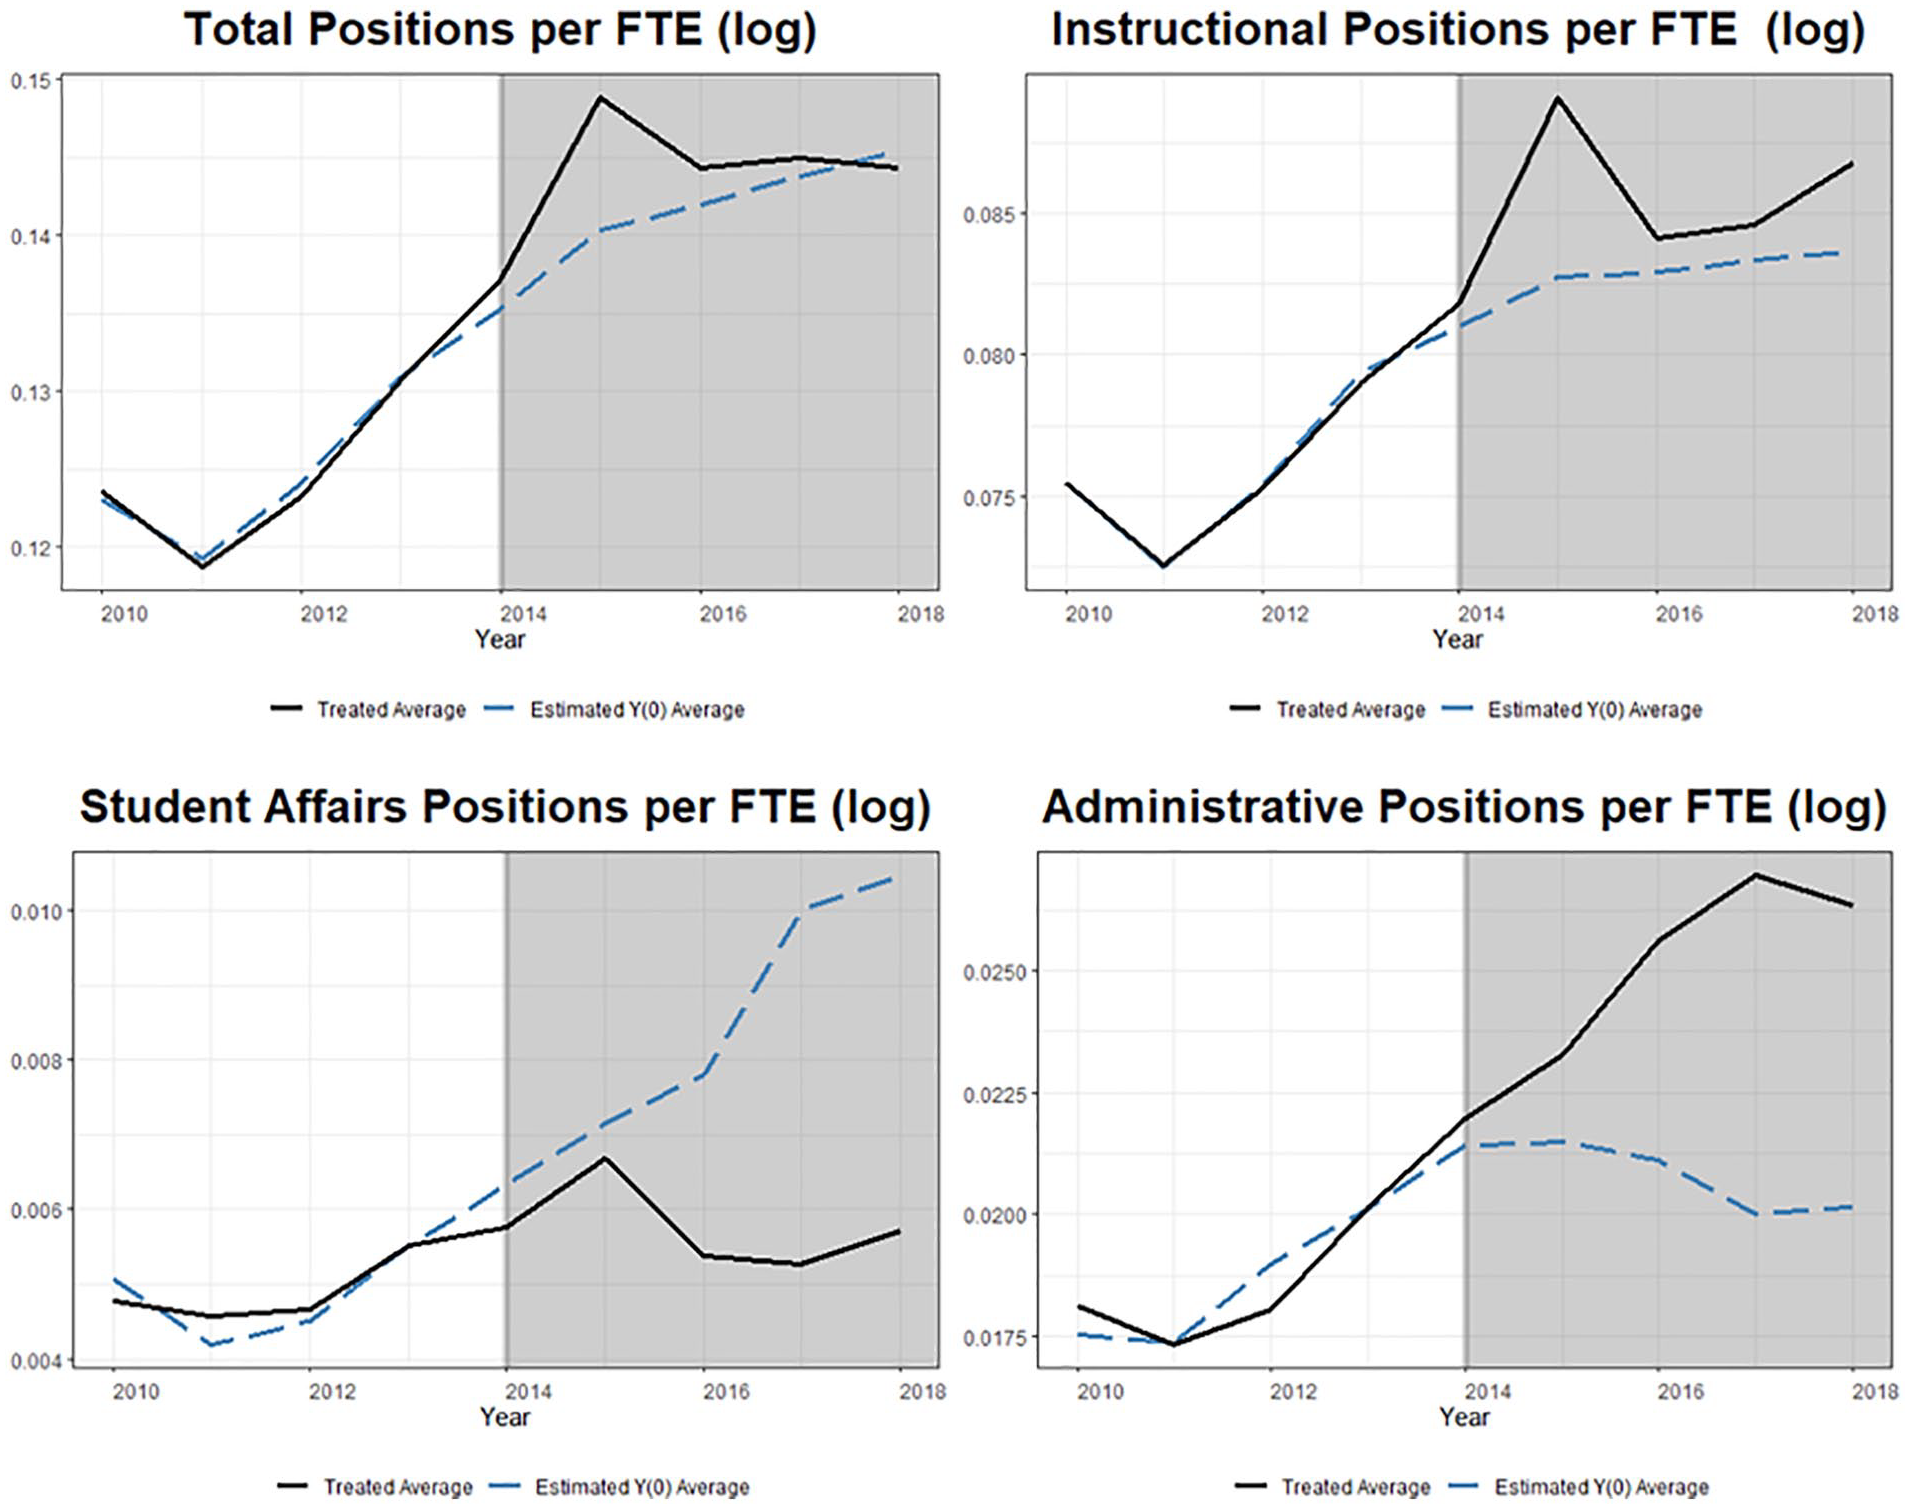
Synthetic control for staffing per FTE (log), by occupational classification
Results
Findings from the DID and synthetic control models are presented in Tables 1 (expenditures) and 2 (staffing). Each table presents the estimated impact of Tennessee Promise on the associated per-FTE expenditure or staffing outcome (column) by method (row), as well as a 95% confidence interval for that estimate. Recall that both estimators leverage bootstrap procedures for inference, so associated significance levels are based on the Wild cluster bootstrap-t for the DID models and cluster-robust bootstrapped standard errors for synthetic control (Roodman et al., 2019; Xu, 2017). Given that we conducted multiple hypothesis tests, all associated p values have been adjusted using the Holm (1979) procedure, which provides superior control over the family-wise (Type I) error rate and ensures our inferences remain conservative (Wright, 1992).
Difference-in-Differences and Synthetic Control Impacts of Tennessee Promise on Expenditures per FTE (log), by Spending Category

Source. American Community Survey, Council of State Governments, and IPEDS: 2010–2011 through 2018–2019.
Note. N (campus-by-year): 4,923. Table reports coefficients estimating treatment impacts with associated 95% confidence intervals. Figures rounded. All outcomes are logged. DID models weighted by institutional FTE enrollment. Significance within DID models conducted with Wild cluster bootstrap-t given state clusters; synthetic control with state-level cluster-robust bootstrapping. Models include college and year fixed effects plus full county and state covariate controls. All p values adjusted for multiple hypothesis testing with the Holm correction. Baseline means are average expenditures per FTE from 2010–2011 through 2014–2015 (the pretreatment period), percent change is the exponentiated coefficient expressed in percentage-point units, change per FTE is the associated percent change applied to the baseline mean, and spending change is the implied overall expenditure change given baseline FTE enrollment levels (4,857.62). DID comparison group is all other community colleges (excluding those in states with other statewide promise programs or those treated by local or regional programs); synthetic control weighted counterfactual constructed from the same pool. All financial figures adjusted to 2019 CPI. FTE = full-time equivalent; IPEDS = Integrated Postsecondary Education Data System; CPI = consumer price index.
p < .10. *p < .05. **p < .01. ***p < .001.
Difference-in-Differences and Synthetic Control Impacts of Tennessee Promise on Staffing Per FTE (log), by Occupational Classification.

Source. American Community Survey, Council of State Governments, and IPEDS: 2010–2011 through 2018–2019.
Note. N (campus-by-year): 4,779. Table reports coefficients estimating treatment impacts with associated 95% confidence intervals. Figures rounded. All outcomes are logged. DID models weighted by institutional FTE enrollment. Significance within DID models conducted with Wild cluster bootstrap-t given state clusters; synthetic control with state-level cluster-robust bootstrapping. Models include college and year fixed effects plus full county and state covariate controls. All p values adjusted for multiple hypothesis testing with the Holm correction. Baseline means (M) are average position counts per FTE from 2010–2011 through 2014–2015 (the pretreatment period), percent change is the exponentiated coefficient expressed in percentage-point units, change per FTE is the associated percent change applied to the baseline mean, and position change is the implied overall change in position counts given baseline FTE enrollment levels (4,857.62). DID comparison group is all other community colleges (excluding those in states with other statewide promise programs or those treated by local or regional programs); synthetic control weighted counterfactual constructed from the same pool. All financial figures adjusted to 2019 CPI. FTE = full-time equivalent; IPEDS = Integrated Postsecondary Education Data System; CPI = consumer price index.
p < .10. *p < .05. **p < .01. ***p < .001.
Under both estimation strategies, results from the expenditure analysis are qualitatively similar and suggest Tennessee Promise was associated with significant changes across institutional expenditure categories, including reduced expenditures per FTE on instruction, academic support, and institutional support, as well as increased expenditures on scholarships. The table also includes baseline means for each expenditure (i.e., a 2010–2011 through 2014–2015 pretreatment average), translates the estimated impact into a percent change (
Across the DID and synthetic control models, neither suggest Tennessee Promise was associated with changes in institutions’ total expenditures per FTE or in student services expenditures per FTE. Given this, any other observed changes would be due to a redistribution of expenditures across other categories. Regarding instruction expenditures, which include traditional credit and noncredit academic activities and operating funds for colleges, departments, and academic units, as well as academic-related expenditures on information technology, estimates range from a 3.5% to 4.3% reduction in spending per FTE. This change translates to a $172–$209 reduction per FTE, or a $837 thousand to $1.02 million dollar decline overall. 11 Results for academic support expenditures, which include those meant to bolster the primary instructional mission (e.g., academic administration, advising and retention, curriculum development, educational materials, and related information technology), suggest Tennessee Promise reduced expenditures in these areas by 4.7% to 7.9% ($42–$71 per FTE or $205–$344 thousand). Expenditures for institutional support include the day-to-day operations of the campus and general administration, including legal, finance, and planning, as well as support for human resources, advertising/public relations, and development. Both models robustly suggest community colleges in Tennessee reduced institutional support expenditures following Tennessee Promise, ranging from 18.2% to 20.1% declines ($251–$277 per FTE or $1.22–$1.34 million overall). Finally, estimates from the analysis of scholarship expenditures per FTE suggest increased spending on scholarships, which include all institutional grant aid awards (i.e., stipends, tuition and fee waivers, and other monetary awards) but do not capture grants or scholarships from state or other grant programs (e.g., Tennessee Promise). Estimates from the DID analysis suggest colleges increased scholarship expenditures per FTE of approximately 10.2% ($201 per FTE or by $978 thousand overall). The synthetic control model suggests qualitatively similar increases but did not yield statistically significant results, though the synthetic control estimates remain more conservative for each outcome of interest. In all, these results suggest Tennessee Promise altered institutional expenditures by diverting spending away from instruction, academic support, and institutional supports potentially toward scholarships or other areas not captured here (e.g., savings or reserves, public service, auxiliaries, or research).
For total positions per FTE, the DID model suggests Tennessee Promise led community colleges to increase overall staffing by approximately 1% (a change of 0.0014 positions per FTE or 6.57 new positions in total), but this estimate is only significant at the
Robustness
In the appendix, we detail the execution and results of a dosage-based DID estimator that leverages variation in the proportion of students who are eligible for a free-college program across the state’s community colleges. This strategy follows prior evaluations of Tennessee Promise and the state’s earlier Knox Achieves program (Carruthers & Fox, 2016; Odle et al., 2021) and accounts for the fact that several regional free-college programs existed in the state prior to the statewide Tennessee Promise. Despite the presence of these programs, only 2.42% of all community college FTE in the state were eligible for one of these programs prior to 2015–2016, and, as a result of this minimal level of confounding, our estimates remain robust to this altered specification and point to equivalent changes in expenditures and staffing.
Discussion
Given the rapid proliferation of college promise programs across the nation, it is necessary that policy makers understand the full extent of possible outcomes these programs have across student, institution, and state levels (Miller-Adams, 2015; Perna & Leigh, 2018). While a broad body of research has causally linked promise programs to a host of student and community outcomes, research to date has largely failed to consider the implications of these scholarships for institutional behavior (Perna & Smith, 2020; Swanson et al., 2020). Our study sought to fill this gap by examining the impact of the nation’s “guiding model” promise program on community college expenditures and staffing (Kanter & Armstrong, 2019, p. 72), to invigorate further research on this topic, and to provide policy makers in Tennessee and beyond with a more complete view on the possible effects of promise program adoption. In our context, Tennessee Promise represented a shock to community colleges’ environments through the infusion of new revenues complemented by increasing demand to serve larger and more academically, racially, and socioeconomically diverse cohorts. As has been observed in other contexts, this free-college shock altered institutional behaviors, and, given the body of evidence linking institutional expenditures and staffing to student outcomes, how institutions ultimately respond can either complement or detract from the access and success aims of these programs (Bell, 2021; Delaney & Hemenway, 2020; Perna et al., 2020; Perna et al., 2021).
While we detect no statistically significant changes in total expenditures per FTE, across individual expenditure subcategories, we find that institutions reduced expenditures per FTE on instruction ($837 thousand), academic support ($205 thousand), and institutional support ($1.2 million) while simultaneously increasing scholarship spending by $717 thousand. Drawing insights from Perna et al.’s (2020; Perna et al., 2021) multisite case studies, many of these expenditure changes can be understood in part as (1) responses to altered student enrollments, (2) complementary investments in related supports for promise-eligible and ineligible students, and (3) the result of a reduced need for colleges to coordinate free-college programs themselves.
First, recall that Tennessee Promise increased institutional enrollments while also diverting higher achieving students toward 2-year institutions, thus raising the average academic profile of the student body (Carruthers et al., 2018; Nguyen, 2020; THEC, 2021). In this reality, it is likely community colleges were able to reduce academic support spending on advising, retention, tutoring, and other services in part given Tennessee Promise students’ higher levels of academic preparation. Second, community colleges could leverage these diverted expenditures and higher overall revenues to increase institutional grants for their entire student body (Delaney & Hemenway, 2020). While Tennessee Promise covers tuition and mandatory fees, the last-dollar award does not cover other costs of attendance (e.g., books and supplies or transportation), leaving financial need gaps that colleges may choose to supplement with grants in ways that complement the program’s goals to promote access, retention, and success for its nearly 108,000 students (Perna et al., 2020; Perna et al., 2021). These increased grant awards may also extend to nonpromise students. Only a small minority of campuses’ total FTE are eligible to receive a Tennessee Promise scholarship (see the appendix), meaning that most students may still have financial need. With higher overall revenues and reduced needs in other campus areas, colleges could contribute a larger share of expenditures toward institutional aid to serve a larger portion of their student body. Third, Tennessee Promise likely also alleviated campus budgets by absorbing many administrative activities previously performed by the colleges. Perna et al. (2020) found that many institutions committed significant resources to promise program administration, materials, and communication-related activities. In our context, Tennessee Promise is part of a suite of state-funded programs that allows institutions to reduce institutional support spending by absorbing costly advertising, development, and recruitment practices, including student outreach. Furthermore, THEC’s administration of the program, including the consolidation of the previous local promise programs, may have further alleviated existing programmatic and staffing needs at colleges that previously supported their local program. Finally, while this analysis does not focus on institutional revenues, Perna et al. (2021) found that institutions served by some local promise programs were able to capture more philanthropic support for their institutional grant aid programs. It is likely that the community colleges in Tennessee were able to do the same and subsequently increase their scholarship spending.
Beyond academic support, institutional support, and scholarship spending, our findings also point to reduced instruction expenditures per FTE. Given the breadth of this category, which includes funds for academic activities, operating funds for departments and academic units, as well as most instruction-related expenditures, it is difficult to isolate the area(s) that Tennessee Promise may have affected. One likely result, given that the program increased full-time enrollments by 24.7%, adding nearly 16,300 students in the first year alone, it is possible institutions responded by increasing average class sizes and relying heavily on existing adjunct instructors, thereby reducing salary and facility expenses per student (THEC, 2017a). Our inability to disaggregate these expenditure categories is a limitation of this study, though we are restricted by IPEDS reporting categories. Furthermore, while our estimates suggest a clear redistribution of institutional spending (i.e., where reductions across our conservative synthetic control models sum to a decline of $1.7 million, close to the $1.3 million estimated nominal change in total expenditures), there are other expenditure areas unobservable to us (e.g., savings and reserves or facility reorganizations, which Perna et al., 2020, identified as additional areas of investment). Finally, an additional concern could be that, with increasing enrollment, an expenditure-per-FTE measure could mechanically decline if revenues did not keep pace. However, Tennessee’s community colleges experienced large increases in total revenues per FTE after Tennessee Promise, so we can be confident that our estimates capture changes in institutional investment decisions rather than enrollment shifts alone (THEC, 2020). Yet, even considering these changes, total expenditures for community colleges in Tennessee prior to Tennessee Promise averaged $51.4 million in our data, so such shifts in behavior observed here are relatively small when distributed across campus operations.
In tandem with changing expenditure levels, our staffing analysis does not detect consistent changes in overall campus staff or in instructional staff per FTE, but evidence does suggest minimal reductions in student affairs positions of approximately 0.05 to 0.07 positions and increases in administrative positions of 0.47 to 0.75. While salaries and benefits represent the single largest expenditure categories for public institutions, position counts are also relatively inelastic for many colleges, and 2-year institutions are experiencing overall reductions in their labor force (National Center for Education Statistics, 2019). In fact, total “faculty” positions at 2-years declined by nearly 82,740 positions from 2011 to 2018, and total “employees” declined by almost 76,000 (National Center for Education Statistics, 2019). While Perna et al. (2020; Perna et al., 2021) observed changes in staffing patterns in their case studies of four community colleges, these staff included program administrators, recruiters, and student support specialists, which, as discussed, would not be expected in Tennessee given the program’s centralized coordination, helping to partially explain these minimal impacts. However, Perna et al. (2021) suggest program staff serve a vital role in the program’s ability to serve more students and provide services beyond a financial award; additional staff represent the ability to interact with more students, increase access, and foster relationships within the community. Despite these possible positive impacts, the authors found some of the four institutions in their case study opted not to invest in increasing full-time staff, while others only made minimal changes (e.g., hiring one or two additional advisors, hiring part-time rather than full-time staff, or shifting responsibilities among existing personnel). The colleges cited concerns over existing financial constraints and institutional capacity when considering adding new, full-time positions, and, while Tennessee’s community colleges experienced overall revenue increases following Tennessee Promise, it is possible that such sentiments traverse all community colleges given existing resource inequities in the sector (Dowd & Grant, 2006).
In all, we find that community colleges responded to the introduction of Tennessee Promise by adjusting expenditures to reflect increased revenues and the needs of larger and more academically, racially, and socioeconomically diverse cohorts. While these observed changes appear to reflect a diversion of campus resources away from less-needed areas toward resources that may support promise-eligible and ineligible students alike, policymakers should interpret these findings with caution. The diversity of promise scholarships across the nation likely motivates heterogeneous responses across institutional and programmatic types (Perna et al., 2020; Perna & Leigh, 2018), and many unique features of Tennessee’s policy environment (e.g., the program’s centralized administration and the presence of a performance funding policy) may have also helped amplify positive responses and attenuate negative institutional behaviors (Perna et al., 2021). This likelihood suggests policy makers should carefully consider all possible institutional responses and work to guard against any behaviors that could inhibit or detract from these programs’ access and success missions, particularly if these behaviors are not met with complementary supports for students or institutions (Perna et al., 2020; Perna et al., 2021). For example, if institutions do not simultaneously receive additional revenues to offset such large enrollment increases brought about by promise programs, their need to serve more students, in potentially different ways, could further constrain campus budgets and motivate many unintended responses (e.g., eliminating support services or raising tuition and fee rates; Bell, 2021; Perna & Smith, 2020). In Tennessee, there have been unique efforts to increase institutional capacity using three rounds of Tennessee Promise Forward grants (Burkander et al., 2019). These nonrecurring funds were envisioned as capacity-building funds to support campuses’ retention and completion efforts with Tennessee Promise students. 13 Promise Forward grants were awarded in 2015, 2016, and 2017, ranging from just under $73,000 to $200,000 per campus (THEC, 2015, 2016b, 2017b). While this type of state support represents a promising mechanism to provide increased capacity for recipient institutions to more effectively and equitable recruit and serve free-college students, the effects of these grants and similar small-scale investments have largely gone unstudied (Perna et al., 2021). Future work should seek to further understand how such policy changes (i.e., free-college programs) and access to additional capacity-building funds (e.g., Promise Forward grants) interact to support and sustain program implementation.
Building on Perna and colleagues’ (Perna et al., 2020, Perna et al., 2021) multisite case studies, and prior works by Bell (2021) and Delaney and Hemenway (2020), our study addresses a gap in existing knowledge on institutional responses to promise programs and has important implications for policy and future research. Equipped with the knowledge that promise programs induce changes in institutional expenditures, and may also affect staffing patterns, policy makers can more fully consider the implications of promise program adoption as they position these programs to meet state goals. While our work is the first to examine how community colleges in Tennessee administratively responded to the nation’s “model” promise program in expenditures and staffing, we join Perna and others in calling on future research to identify the full extent of these institutional responses and to estimate ultimate impacts on student outcomes (Perna et al., 2020; Perna et al., 2021). For example, what impacts do possible expenditure diversions from academic support activities or additions to institutional grants have on students broadly? Do these impacts vary along students’ academic or demographic dimensions? What other institutional responses likely followed promise program adoptions, and how do these responses vary along state, institutional, or programmatic contexts? There is a rich set of future work considering the institutional impacts of promise programs and how these impacts may influence subsequent student and organizational outcomes.
Footnotes
Appendix
Though Tennessee Promise began in 2015–2016, it was not the first free-college program in the state. Knox Achieves, a local, last-dollar scholarship began 6 years prior in fall 2009 that ultimately led to the creation of Tennessee Promise (Carruthers & Fox, 2016). Under this program, eligible FTFT students could enroll in the local community college free of tuition and mandatory fees immediately following high school. From 2009 until 2011, other local programs developed across the state, expanding to two community colleges, and, by 2014, eight community colleges had some students eligible for one of the regional programs prior to the state’s 2015–2016 rollout of Tennessee Promise. Using enrollment records from Tennessee Achieves, the coordinator of Knox Achieves, and the THEC, Odle et al. (2021) describe this staggered rollout and provide campus-by-year records of state and local promise-eligible enrollment proportions at each community college. While eight community colleges had some local promise students prior to Tennessee Promise, Odle et al. (2021) show that, because of the FTFT and immediate high school to college enrollment requirements of these programs, which concurrently limit eligibility and the size of entering promise-program cohorts, only 13.9% of all FTFT students at community colleges were eligible for one of these programs prior to 2015–2016. Despite this minimal level of treatment prior to the 2015–2016 academic year, it is possible community colleges altered their expenditure or staffing behaviors in response to these programs prior to the statewide Tennessee Promise. If this occurred, our primary estimates could be downwardly biased by washing out treatment impacts in the “pretreatment” period (i.e., prior to 2015–2016).
To account for this possibility, we reestimate our DID models following Carruthers and Fox’s (2016), House and Dell’s (2020), and Odle et al.’s (2021) implementation of a time-variant (or dosage) treatment indicator to exploit campus-level exposure to promise students. 14 Building from Odle et al.’s (2021) public records, which covered 2007–2008 through 2017–2018, we supplement the final year of our panel (2018–2019) with records of Tennessee Promise student enrollments from the THEC’s Tennessee Promise Annual Report (THEC, 2021). We then scale promise enrollment counts by FTE enrollment levels from IPEDS to observe what proportion of an institution’s FTE was eligible for a local promise program or the statewide Tennessee Promise in each year from 2010–2011 through 2018–2019. This allows us to capture annual dosage or treatment levels for each community college, before and after the statewide program, so that we can net-out impacts of the pre-2015 programs.
Formally, we respecify Equation (1) as a staggered model with this campus-by-year dosage indicator expressed by
where
Results for this alternative specification are presented in Appendix Tables A1 (expenditures) and A2 (staffing). These tables are set up in the same way as Tables 1 and 2, but now include the full estimated impact of Tennessee Promise by multiplying each β by 22.98 (in italics). 15 We again leveraged the Wild cluster bootstrap-t procedure to conduct inference with state clusters and inflated all p values with the Holm correction. As expected, results are qualitatively equivalent to our primary DID models and leave our inferences unchanged. This model again suggests no significant changes to overall expenditures per FTE following the introduction of Tennessee Promise but does identify significant decreases in instruction (4.5% compared with 4.3% in our primary DID model), academic support (6.67% compared with 7.87%), and institutional support (20.55% compared with 20.07%), as well as statistically significant increases in scholarships (12.19% compared with 10.19%). This model additionally identified significant reductions in student services expenditures that were not present in our primary DID model. Here, estimates suggest community colleges reduced student services expenditures by 4.5%, or a reduction of $49 per FTE ($236,000 overall). For the staffing analysis, estimates again generally reject any change in total positions per FTE and suggest significant yet practically meaningless changes in instruction, student affairs, and administrative positions per FTE. Here, results suggest Tennessee Promise led community colleges to increase instruction positions per FTE by 0.54% (or 2.10 positions, compared to 1.94 in the main DID model) and reduce student affairs positions per FTE by 0.21% (or 0.05 positions, also equivalent to the main analysis), though both estimates are only significant at the p < .10-level. Finally, and also congruent with the primary findings, estimates suggest a significant increase in administrative positions per FTE of 0.61% or 0.57 positions (compared to 0.75 in the main analysis, p < .001).
In all, this alternative specification builds on prior works to account for the staggered implementation of Tennessee Promise across the state’s community college sector and provides robust and consistent evidence to our primary models. Results again suggest changes in campuses’ expenditure and staffing behaviors following the introduction of the 2015–2016 Tennessee Promise.
Acknowledgements
The authors thank the editors of AERA Open, four anonymous reviewers, and attendees at the 2020 Association for Public Policy Analysis and Management conference for their helpful feedback and recommendations on this manuscript.
Funding
The author(s) disclosed receipt of the following financial support for the research, authorship, and/or publication of this article: The authors gratefully acknowledge funding from the Institute of Education Sciences, U.S. Department of Education, under Grant R305B200035 to the University of Pennsylvania, which supported this work and provided support for its open-access publication. Any views or opinions expressed are those of the authors alone and do not represent the views or opinions of the Institute or the U.S. Department of Education.
Notes
Authors
TAYLOR K. ODLE is an Institute of Education Sciences Predoctoral Fellow and PhD candidate in higher education at the University of Pennsylvania. His research works to evaluate public policies aimed at increasing students’ access to and success in college.
ALEX B. MONDAY is a PhD student in higher education at the University of Georgia’s Institute of Higher Education. His research interests include college access and success, student decision making, and how policy impacts equity in higher education.