
Abstract
When translating large-scale policy changes into educational practice, classroom-level implementation is crucial and dependent on teachers’ capabilities. Most research underscores the importance of professional development (PD) as a proximal factor to achieve educational change. Connected to the recent Advanced Placement (AP) science examination reform, this large-scale quantitative study (NTeachers = 9,096; NStudents = 197,589) investigates teacher participation in different PD formats (i.e., face-to-face, online, materials) and their associations with teacher- and student-level outcomes. We found that teacher characteristics (e.g., gender and administrative support) were associated with the choice of the PD format. We also found AP subscore differences between students of teachers who participated in different PD formats. Furthermore, teachers who participated in formal PD activities tended to report higher challenges with the AP reform. Thus, this study encourages PD providers to implement changes alongside a variety of PD programs to account for the potential differential benefits for teachers.
Improving the preparation of high school students to enter higher education is an important task for educational systems all over the world. In the United States, the Advanced Placement (AP) program is part of college preparation for millions of students each year, and often serves as an indicator of college readiness. High school students are taught college-level content that may be recognized by colleges, allowing students to skip introductory college courses and, in some cases, receive college credits toward graduation. Beginning in 2013, the “AP Redesign,” a large-scale reform, was introduced in three science disciplines (biology, chemistry, physics), which changed the curriculum frameworks in these subjects and increased emphasis on “Science Practices” and “Big Ideas.” Science Practices are intended to improve students’ knowledge and understanding of natural phenomena by using evidence to test explanations and make predictions. Big Ideas represent central scientific processes, theories, and principles (e.g., College Board, 2012). These changes align with other large high school science reforms such as the Next Generation Science Standards (NGSS Lead States, 2013).
Previous research underscored that the effective implementation of large curricular changes mostly depends on teachers (Desimone, 2009; Hübner et al., 2021; Porter et al., 2015). More specifically, effective implementation of educational reforms is inherently related to the extent to which teachers are supported and prepared for the new requirements of such revised programs (Fishman et al., 2003). In addition to providing curriculum frameworks and prepared teaching materials that reflect the new curriculum, offering high-quality professional development (PD) was articulated as a central policy tool to equip teachers with the required knowledge and skills to meet new standards (e.g., Borko et al., 2003; Dede et al., 2009; Desimone, 2009).
However, besides the general notion that teacher characteristics are associated with PD participation (e.g., Desimone et al., 2006; Garet et al., 2001), the research base on who opts in to participate in specific PD formats (e.g., online PD [oPD] programs, face-to-face [F2F] PD programs) and whether these formats are related to perceived challenges and instructional practices is underdeveloped. In response to this call for research, this study attempts to close this gap by investigating teachers’ preferences for specific PD and professional learning formats (i.e., online, F2F, materials-based) or combinations of those formats when implementing curricular change. This is an important dimension for understanding teachers’ PD participation and resulting outcomes. From a policy perspective, findings may help improve how we think about options when providing PD and to link options more coherently to teachers’ needs: For instance, if a specific group of teachers should participate in PD (e.g., less experienced teachers), this group of teachers might be more likely to opt in to specific PD offers. Second, this study examines the relation between participation in different PD formats and students’ AP science subscores (i.e., “Science Practices”/“Big Ideas”). AP subscores provide fine-grained information about students’ ability to develop knowledge about central scientific practices (“Science Practices”) and to understand core scientific theories and principles (“Big Ideas”). This allows detection of more subtle relationships between PD formats and students’ performance on specific Big Ideas and Science Practices that may be obscured by relying solely on an overall AP score (scored on a 1–5 metric). This also extends our understanding of whether PD formats might be differentially related to different elements of this science reform.
Background
The Advanced Placement Science Reform
In the past decades, millions of students participated in the AP program, which offers advanced academic content to high school students in the United States. Students who participate in the AP program tend to have higher college GPAs (Hargrove et al., 2008; Patterson et al., 2011; Scott et al., 2010) and lower college dropout rates (Dougherty et al., 2006; Mattern et al., 2013). Notably, students who score well on the AP examinations may also earn college credit or access to more advanced coursework.
Beginning with biology in 2013, a major reform of the AP science courses was enacted (College Board, 2012), followed by revised curriculum frameworks for chemistry and physics (College Board, 2014a, 2014b). The reformed AP science courses implemented a variety of changes, similar to the changes adopted in the NGSS (NGSS Lead States, 2013). Most notably, the redesigned AP science curriculum heavily promotes the provision of opportunities for students in scientific inquiry, reasoning, and depth of understanding, in contrast to rote learning, memorization, and algorithmic procedures (Magrogan, 2014). The revised AP program conceptualizes numerous key discipline-based concepts and content as “Big Ideas.” In addition, the AP program established a number of cross-cutting “Science Practices” that are of importance across all science disciplines (Table 1). Given the high-stakes nature of the AP program, it is important for teachers to be prepared to adapt their teaching in response to the AP reform to best support their students, although the College Board does not mandate participation in teacher PD activities.
Overview of Big Ideas and Science Practices

Note. Science Practices are identical across all science disciplines.
Earlier studies analyzing teacher responses to the AP science reform suggested that teachers’ challenges with the AP reform tended to decrease over time, while their instructional strategies and enactments remained mostly similar over time (Fischer, Eisenkraft, et al., 2018). With respect to student performance, studies found that about 60% of the variance in students’ overall AP scores can be found on the teacher and school levels (Fischer, Foster, et al., 2020), and some studies have identified direct and indirect associations of selected aspects of teachers’ PD participation with students’ overall AP performance (Fischer, Fishman, et al., 2018; Fischer, Fishman, et al., 2020). Interestingly, price and proximity of PD offerings often constituted key drivers in the teachers’ selection of PD, resulting in a wide variety of different teacher PD participation patterns (McCoy et al., 2020).
Generally, monitoring student achievement and its precursors is relevant as it has been found to predict postsecondary choices and career aspirations (Green & Sanderson, 2018; Kokkelenberg & Sinha, 2010; Parker et al., 2012). However, the research base on the choice and outcomes of different PD formats that correlate with student achievement on a high-stakes exam with a large population is sparse. This study investigates the link between teachers’ choice of specific PD formats during the AP science reform in biology, chemistry, and physics and the relation between PD formats and student performance on “Big Ideas” and “Science Practices,” as measured through AP science subscores. The results offer new insights into the relationship of PD choices and student outcomes in a high-stakes context.
Features and Formats of Effective Professional Development
During the past two decades, a “new paradigm” for teacher PD has emerged from research that distinguishes new opportunities for teacher learning from more traditional approaches (Borko et al., 2010). Traditionally, short didactic workshops and courses were employed for PD, providing teachers with some theoretical background and materials without embedding the workshop itself into a more complex theoretical model of knowledge acquisition and transfer (Borko et al., 2010). Over time, research on teacher learning and PD has begun to create consensus about key principles in the design of learning experiences that can influence teachers’ knowledge and practices. This consensus, outlined by Desimone (2009), Darling-Hammond et al. (2017), Borko et al. (2010), and others, holds that effective PD possesses a robust content focus, features active learning, is collaborative and aligned with relevant curricula and policies, and provides sufficient learning time for participants. These features are largely in line with recommendations for PD aligned with reforms and seem to be important for teachers of most subjects (Kalinowski et al., 2019; Marrongelle et al., 2013; Southerland et al., 2016).
Whereas most of these features were developed and partly evaluated in the context of traditional PD formats (i.e., single or multiple-day workshops or courses), more recent concepts of PD emphasized the utility of alternative formats (e.g., Borko et al., 2010; Dede et al., 2009; Fishman et al., 2013). As argued in the literature on oPD, these new formats come with new opportunities for flexible participation. This includes both participation at any time during the school year and more direct interaction with colleagues if challenges (e.g., Darling-Hammond et al., 2017; Desimone, 2009) arise whether during regular school weeks or times of change (e.g., via online networks). From this perspective, some oPD programs are much more in line with perceptions of PD as a process of lifelong professional learning (e.g., duration; Borko et al., 2010; Darling-Hammond et al., 2017; Desimone, 2009), compared with PD programs that last for only a couple of days per school year.
However, as articulated earlier (e.g., Borko et al., 2009; Fishman et al., 2013), there is also reasonable concern regarding shortcomings of oPD. As outlined, the ability of teachers to engage with and learn from each other may differ in online and F2F PD. Further research has suggested that some pedagogical strategies might work better or worse in one or the other format and therefore we might understand oPD not as an alternative to F2F PDs but rather as an extension (Dede et al., 2009). Research also has investigated potential differences between online and traditional F2F PDs. Fishman et al. (2013) conducted a randomized controlled trial of teachers learning with F2F or oPD. The authors found that both modalities led to statistically significant gains for teachers (knowledge, beliefs, and classroom practices) and students (learning) and did not find any statistically significant differences between the two PD formats. These results are in line with other previous research comparing traditional PD and oPD (Powell et al., 2010).
Such findings led researchers to conclude that too little is yet known to allow a full understanding of potential benefits of specific PD formats versus others (Didion et al., 2020). In addition, the content of the program might matter as much as its features. For instance, teaching quality (e.g., supportive feedback, classroom management, cognitive activation; Kunter et al., 2013) might be improved equally well in F2F PDs and highly interactive oPDs (e.g., using practice videos or online teacher networks to share experiences). Implementing new curriculum materials, however, might profit more from one or the other PD format (Schlager et al., 2009). Finally, differential associations might also result from differences between teachers, who typically enroll in one or the other format. For instance, some teachers might feel challenged by oPD formats and prefer to enroll in F2F PDs.
Research Questions
This study investigates teachers’ participation in different PD formats during the AP reform and their associations with teacher- and student-level outcomes. In this study, we base our considerations regarding a theory of change on the model of Desimone (2009). This model suggests that in order for PD to affect students’ learning it must first affect teachers’ learning. Meta-analyses have demonstrated the impact of PD on teacher learning and subsequently on student learning (Lynch et al., 2019). We extend these prior findings by focusing on (a) subscores rather than global scores, which allow for a more fine-grained assessment of associations and (b) how these associations might differ between different PD formats. Prior literature outlined a variety of potential affordances and challenges related to teacher learning when comparing different PD formats (e.g., Borko et al., 2010; Darling-Hammond et al., 2017). On the one hand, oPD might be particularly fruitful because of its asynchronous nature, which allows teachers to flexibly participate in the program. In addition, oPD formats are easily scalable and teachers from all over the country can participate in them (e.g., Dede et al., 2009; Fishman et al., 2013). On the other hand, oPD might also come with challenges regarding interaction and communication processes of the participants (compared with F2F PD; e.g., Yang & Liu, 2004). From this perspective, F2F formats consist of a variety of potential strengths, particularly regarding discussions and interactions, which might develop more naturally. Similarly, professional learning materials such as AP curriculum descriptions or sample AP questions often represent the lowest cost option while being easily scalable. Furthermore, materials are ready to use at any time, allowing a lot of flexibility. Contrarily, professional learning processes from materials may enable less quality control compared with other formats, as frequency and rigor of teachers’ use of materials are typically not monitored. Thus, the question arises, whether these differences may ultimately lead to systematic differences between the different formats, which we more closely investigate in this study.
We addressed four specific research questions (RQs). RQs 1 to 3 focus on relationships between PD and teacher-level outcomes. RQ 4 focuses on relationships between PD and student-level outcomes. In detail, the RQs are as follows:
RQ 1: What are the patterns of teachers’ PD participation by PD format?
RQ 2: What are the associations between teachers’ PD participation patterns and teacher characteristics?
RQ 3: How do teachers’ perceived challenges with the AP redesign and teachers’ self-reported instructional practices differ across PD participation patterns?
RQ 4: What are the relationships between teachers’ PD participation and student performance on domain-specific AP subscale scores?
Method
Study Sample
The data in this study were collected from two sources: First, College Board provided student- and school-level data for all students who took an AP examination. Second, we administered web-based surveys to all AP science teachers who were not placed on College Board’s “do not contact” list. The surveys had a response rate of about 30%. Internal validity of survey items was ensured through cognitive interviews with experienced AP teachers using a talk-aloud method, as well as extensive piloting with a national panel of experts in PD, science education, science content, measurement, and AP expertise (Desimone & Le Floch, 2004).
This study uses data from N = 9,096 AP teachers in the United States from three different science disciplines across 2 years (biology 2014–2015, chemistry 2014–2015, and physics 2015). In addition to information on AP teachers, we also used data from their students (N = 197,589). Results of a nonresponse analysis using AP scores and PSAT scores between students of our sample and the entire AP student population revealed minor differences ranging from d = 0.01–0.03 for PSAT scores and d = 0.05–0.09 for AP scores.
Measures
An overview of all variables employed in this study can be found in the appendix in Tables A1 to A3 in supplemental material.
Teacher-Level Outcomes
PD program participation
Participation in PD was measured for each individual teacher using multiple dichotomous yes/no questions. The different items are part of three larger categories of PD activities, namely materials (10 items), online courses (6 items), and F2F programs (16 items). Items of the materials category indicate that teachers used materials, including, among other things, AP curriculum descriptions, sample AP questions, and lab manuals, for PD regarding the AP reform. Engagement with materials can be understood as a context for professional learning, in that the active engagement with such materials can help teachers understand and implement the revised AP curriculum, and such self-guided support is available to nearly all teachers. Items of the online category indicate that teachers participated in online courses or online communities. Finally, F2F items indicate that teachers participated in F2F programs. The items were coded as 0 (not participated) or 1 (participated in the respective activity). A teacher was counted as having participated in the larger category or a combination of the categories, if any of the subactivities was answered with yes by the teacher. We classified teacher PD participation into four groups: Materials only (MAT), Materials and Face-to-Face PDs (MAT/F2F), Materials and Online PDs (MAT/Online), as well as a combination of all three PD formats (ALL). We chose this categorization of PD groups as it represented 98% of all AP teachers in our sample.
Challenges with AP redesign
Challenges with AP redesign were measured on a 5-point rating scale ranging from 1 (no challenge at all) to 5 (a large challenge). Teachers were provided with the following instruction: In the current school year, the AP redesign may have posed challenges to your instruction. Please indicate below how much of a challenge each of the following elements of the AP redesign was for you. They were asked to answer this question regarding a variety of areas such as the organization of content, development of a new syllabus, or use of the textbooks. Overall, we considered answers from 12 areas respectively for each science discipline (see supplemental Table A2 in the appendix). The (WLE) reliability for the scale was .87 (Adams, 2005).
Enactment of science practices
We also investigated differences of PD groups on the self-reported enactment of instructional practices required by the new AP science curriculum. This was measured on a 5-point rating scale ranging from 1 (never or only once a year) to 5 (nearly every day). We used nine items to assess enactment of science practices such as “Refer to Big Ideas,” “Have students work on laboratory investigations,” or “Refer to the learning objectives from the AP curriculum.” The (WLE) reliability for this scale was .82 (Adams, 2005).
Student-Level Outcomes
Big Ideas and Science Practices
An overview of all AP science subscores for Big Ideas and Science Practices can be found in Table 1. The number and content of the Big Ideas varied across the different science disciplines. Whereas the biology curriculum listed four Big Ideas, chemistry and physics listed six Big Ideas each. Science Practices were identical across all three disciplines. We used item-level information of the different Big Ideas and Science Practices to calculate the percentage of correctly solved items per student. The AP exams lasted 3 hours and consisted of about 50% multiple choice questions and 50% open responses. Notably, this study was granted access to only the multiple choice questions (see Limitations section). In order to compare different subscores, we transformed them to a M = 50 and SD = 10 metric. Percentages correct for each score can be found in supplemental Table A3 in the appendix.
Covariates
In all analyses, we considered a variety of covariates, which are displayed in supplemental Tables A1 and A2 in the appendix. We considered teacher-level information including teachers’ age, gender, ethnicity, years of teaching experience, and perceived PD effectiveness. We controlled for school-level information such as the number of students at the school, the percentage of students with free lunch, and the funding of the school. Finally, when estimating students’ achievement, we also controlled student-level information such as previous academic performance (i.e., PSAT score), ethnicity, and parental education.
Statistical Analyses
The data analysis was carried out in R (R Development Core Team, 2019) and Mplus 8.2 (Muthén & Muthén, 1998–2017), which reflects the sequence of the different RQs. To answer RQ 1 on the patterns of teachers’ PD participation by format, we compiled and categorized data regarding the different PDs teachers participated in (i.e., MAT, MAT/F2F, MAT/Online, and ALL).
Next, to address RQ 2 on the associations between PD participation and teacher characteristics, we specified multinomial logistic regression models with the Materials category as the reference group, which was compared with the other three PD groups (MAT/Online, MAT/F2F, and ALL). These models also controlled for a variety of teacher background characteristics including age, gender, teaching experience, and ethnicity (the full list of variables is described in supplemental Table A2 in the appendix).
In order to answer our RQ 3, we more closely investigated self-reported challenges with the AP redesign and enacted classroom practices using adjusted multiple group item response theory models (e.g., Embretson & Reise, 2000; Hübner et al., 2020). These models provide a flexible approach which allows for estimation of the predicted latent standardized challenges and practices for each of the four PD groups separately, while controlling for (grand-mean-centered) teacher characteristics (see supplemental material for exemplary code for this model). Subsequently, the mean and variance of the latent variables were transformed to a M = 50 and SD = 10 metric to ease the interpretation of our findings.
In order to answer our RQ 4 on differences in students’ achievement across different AP science subscores (Big Ideas and Science Practices), we chose a similar strategy as for RQ 3 and estimated adjusted multiple group multiple regression models. Doing this, we predicted each AP science subscore (e.g., Big Idea 1, Big Idea 2, etc.) separately for each PD group, after controlling for (a) all possible covariates on the school, the teacher, and the student levels and, to check the robustness of our results, (b) a restricted set of covariates (no teacher covariates; see Tables A4–A6 in the appendix for an overview of variables and results of robustness checks). To provide another in-depth perspective on RQ 3 and RQ 4, we also made use of a longitudinal subsample in our data set and applied entropy balancing, which was found to be able to better adjust for selectivity than traditional methods in many plausible cases (Hainmueller, 2012; see Longitudinal Data Analysis section for details).
Beforehand each AP science subscore was transformed to a M = 50 and SD = 10 metric. The predictors in the different regression models were z-standardized beforehand so that the respective intercepts of the regression models for each AP subscore can be interpreted as adjusted PD group means. The models were estimated separately for each discipline and year (e.g., biology 2014, physics 2015). In order to estimate differences between the different PD groups within each discipline-specific AP subscore (RQ 4), we used the model constraint option in Mplus, which utilizes the delta method to estimate differences of parameters and respective standard errors (e.g., MacKinnon, 2008). Following recommendations from McNeish et al. (2017), we estimated robust standard errors in all our models.
Meta-Analytical Aggregation of Findings
We did not have any specific assumptions about systematic differences across years and were interested in average results considering all available data. We therefore decided to meta-analytically aggregate the findings for biology 2014 and biology 2015, as well as chemistry 2014 and chemistry 2015. To do this, we first transferred the estimated parameters from Mplus to R with the MplusAutomation package (Hallquist & Wiley, 2018). To estimate the aggregated results, we used these parameters in fixed-effect regression models with inverse-variance weights, typically used in meta-analysis, as implemented in the metafor package in R (Viechtbauer, 2010).
Missing Values
Missing values are a challenging issue in most social science studies (e.g., Enders, 2010). Generally, we distinguished between (a) unit nonresponse (i.e., nonresponse of units to the survey, which amounted to 70% in our study) and (b) item nonresponse (i.e., missing values of participating units on some survey questions, which amounted to M = 4%, ranging from 0% to 9% in our study).
Regarding unit nonresponse, we investigated differences between schools and students of teachers who responded to the survey (and teachers who did not respond) by comparing sample means and 99% confidence intervals (CIs) with the population mean. This was possible using population data of the students in the data set provided by the College Board. Unfortunately, we did not have access to data from the entire population of AP teachers as College Board does not collect such teacher data at the population level. The results of this analysis suggest that students of teachers in the sample performed slightly better on the AP tests (e.g., biology 2014: µ = 2.91,
Regarding item nonresponse, we provide a detailed overview with sample sizes, means, SDs, and percentages of missing data for all considered teacher covariates in our models, separately for the four different PD format groups in the Results section. Overall, item nonresponse was rather small in our study (on average M = 4%, ranging from 0% to 9%). In addition, item nonresponse seemed to occur mostly uniformly across the different PD formats with an average difference of M = 0.01% between the PD format with the lowest and highest item nonresponse rate. We applied FIML in all our cross-sectional analyses and multiple imputation for treating missing longitudinal data before entropy weighting to alleviate some of the potential bias resulting from nonresponse.
Longitudinal Data Analysis
In order to overcome limitations related to the cross-sectional nature of the primary analyses, we conducted additional analyses that utilized the longitudinal nature of the data (teachers who participated in 2014 and 2015). These longitudinal analyses therefore consider PD participation more from a quasi-experimental perspective. As PD participation in 2014 and 2015 varied within teachers, we decided to estimate outcome differences between the different PD formats, after achieving covariate balance through entropy weighting (Hainmueller, 2012). Extensive information on these analysis can be found in the supplemental appendix.
Results
RQs 1–2: Patterns of Teacher PD Participation
Regarding the first RQ, we examined the patterns of teachers’ PD participation in the three most commonly used PD formats: F2F, Online, Materials (RQ 1). Based on frequency tables of all possible PD combinations of these three formats, we were able to identify the four most frequently chosen PD formats. These were “Materials only” (MAT), “Materials and Face-to-Face PDs” (MAT/F2F), “Materials and Online PDs” (MAT/Online) as well as a combination of all three PD formats “Materials + Face-to-Face + Online PDs” (ALL). The frequencies of the different PD formats for each discipline and year are displayed in Table 2.
Absolute Frequencies of Teachers’ Participation in the Four Different Professional Development (PD) Groups by Discipline and Year

Note. PD = professional development; MAT = professional development using only materials; MAT/F2F = professional development using face-to-face PDs and materials; MAT/Online = professional development using online PDs and materials; ALL = professional development using face-to-face PDs, online PDs, and materials. We did not consider less prominent PD groups: face-to-face only (n = 129), online only (n = 25), online and face-to-face (n = 28). Percentages per year displayed in parentheses.
Most teachers reported participating in all PD format options, followed by MAT/F2F and MAT/Online. A minority of teachers decided to use only materials for PD. Interestingly, whereas the patterns of PD choice were largely comparable across biology and chemistry, physics teachers were most often enrolled in MAT/F2F, followed by ALL and MAT. For physics teachers MAT/Online was the least chosen PD format. Note that these numbers reveal any level of self-reported exposure to any of these modalities at any time during the year. We controlled for the amount of PD participation in subsequent analyses. Examining teacher self-selection into the different PD/professional learning formats revealed the following insights (see Table 3): Female teachers tend to self-select more often into other PD/professional learning formats than MAT (all d’s ≥ 0.1; Cohen, 1988). Teachers with less years of teaching AP courses more often self-select into MAT/F2F formats (all d’s ≥ −0.17). Teachers with fewer hours of AP instruction in the previous year tend to self-select more often into MAT/Online, compared with the other formats (all d’s ≥ 0.12). Thus, we conducted multinomial logistic regression to examine associations between teacher characteristics and PD format participation in more depth.
Descriptive Statistics by Professional Development (PD) Format

Note. AP = advanced placement; MAT = professional development using only materials; MAT/F2F = professional development using face-to-face PDs and materials; MAT/Online = professional development using online PDs and materials; ALL = professional development using face-to-face PDs, online PDs, and materials; N = sample size; M = mean; SD = standard deviation; %miss = percentage of missing data.
Next, we examined the associations of teacher characteristics with the teacher patterns of PD (RQ 2). Multinomial logistic regressions, with MAT as the reference group, revealed that there were differences on a variety of covariates across the different PD programs (Table 4). This suggests that teachers’ background characteristics are related to enrollment in specific PD programs and need to be controlled for in subsequent analyses. For instance, teachers with more advanced degrees (doctoral versus bachelors) more often chose MAT over MAT/F2F and ALL. In addition, female teachers more often participated in MAT/F2F, MAT/Online, or ALL, compared with the MAT group. We also found the number of African American teachers, compared with White teachers, to be higher in MAT/F2F than MAT. Interestingly, teachers with more years of experience in teaching AP courses less often participated in MAT/F2F courses, compared with MAT, but more often participated in MAT/Online, compared with MAT. Furthermore, there was a positive relation associated with support of the principal: Teachers who reported to feel more supported more often participated in MAT/F2F or ALL, compared with MAT.
Choice of PD Participation Based on Teachers’ Characteristics

Note. OR = odds ratio; MAT = professional development using only materials; MAT/F2F = professional development using face-to-face PDs and materials; MAT/Online = professional development using online PDs and materials; ALL = professional development using face-to-face PDs, online PDs, and materials. Reference group is Materials (MAT). Continuous variables were z-standardized. Reference category for degree was bachelor’s degree. Reference group for ethnicity was White. Reference group for subject/year indicators was Bio_14. Coefficients with p values < .05 are marked bold.
RQ 3: Perceived Challenges and Instructional Practices
Following this, we examined whether perceived challenges with the AP redesign and teachers’ self-reported instructional practices differed across the different teacher patterns of PD participation (RQ 3; Table 5). We found that teachers in MAT/F2F (M = 50.50), MAT/Online (M = 50.28), and ALL (M = 50.39), on average, reported more challenges, compared with teachers in MAT (M = 48.83; all p < .05). However, the enactment of practices statistically significantly differed only between the ALL group (M = 49.47) and the MAT group (M = 50.75, p < .05): Teachers in the MAT group reported enacting practices in class more often (i.e., they reported more often making use of instructional practices required by the new AP science curriculum) than teachers who participated in all PDs. We found around d = 0.16 higher challenges reported in the ALL group compared with the MAT group, and d = 0.13 lower frequency of enacted practices in the ALL group compared with the MAT group (see below for results of the longitudinal analysis).
Means for Challenges and Practices for the Different Professional Development (PD) Groups.
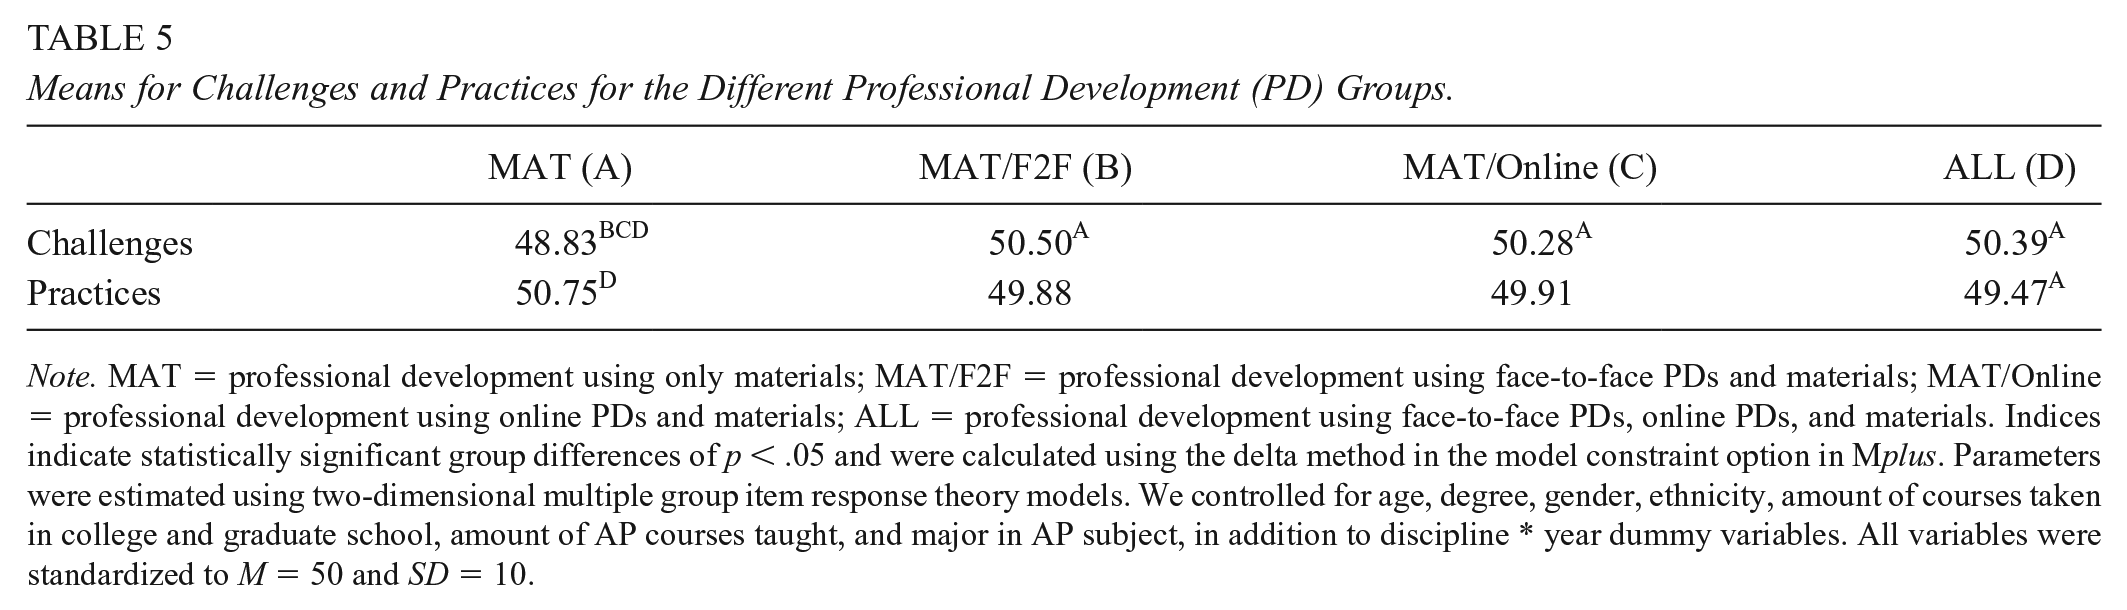
Note. MAT = professional development using only materials; MAT/F2F = professional development using face-to-face PDs and materials; MAT/Online = professional development using online PDs and materials; ALL = professional development using face-to-face PDs, online PDs, and materials. Indices indicate statistically significant group differences of p < .05 and were calculated using the delta method in the model constraint option in Mplus. Parameters were estimated using two-dimensional multiple group item response theory models. We controlled for age, degree, gender, ethnicity, amount of courses taken in college and graduate school, amount of AP courses taught, and major in AP subject, in addition to discipline * year dummy variables. All variables were standardized to M = 50 and SD = 10.
RQ 4: Achievement on Discipline-Specific AP Subscale Scores
Regarding our RQ 4, we examined how students performed on discipline-specific AP subscale scores, separated by “Big Ideas” and “Science Practices” (Table 6). Also, we examined whether students’ performance differs with regard to different teacher patterns of PD participation on Big Ideas (Table 7, Figure 1) and Science Practices (Table 8, Figure 2).
Pooled Results for Big Idea and Science Practice AP Subscores

Note. M = mean of percentage correct; SD = standard deviation; MAT = Professional development using only materials; MAT/F2F = Professional development using face-to-face PDs and materials; MAT/Online = Professional development using online PDs and materials; ALL = Professional development using face-to-face PDs, online PDs, and materials. Big Ideas and Science Practices were standardized beforehand on a metric with M = 50 and SD = 10. Physics was assessed in 2015 only. Means were pooled based on results of adjusted models (i.e., controlling for covariates). SDs were pooled across unadjusted models. Item 3 for chemistry and physics of Science Practices was not available in the official data set.
Pooled Standardized Group Mean Differences for Big Idea Advanced Placement Items for Students of Teachers From Different Professional Development (PD) Groups by Discipline

Note. MAT = professional development using only materials; MAT/F2F = professional development using face-to-face PDs and materials; MAT/Online = professional development using online PDs and materials; ALL = professional development using face-to-face PDs, online PDs, and materials; d = standardized mean difference (Cohen, 1988). Physics was assessed in 2015 only. Mean differences are based on Table 6 and were standardized using the square root of the pooled variance across all groups, separately for each discipline and Big Idea. Positive values indicate a larger average achievement of students with teachers in the first named group, negative values indicate a larger average achievement of students with teachers in the second group. Coefficients with p-values < .05 are marked bold.

Pooled achievement for Big Ideas (based on Table 6).
Pooled Standardized Group Mean Differences for Science Practice Advanced Placement Items for Students of Teachers From Different Professional Development (PD) Groups by Discipline

Note. MAT = professional development using only materials; MAT/F2F = professional development using face-to-face PDs and materials; MAT/Online = professional development using online PDs and materials; ALL = professional development using face-to-face PDs, online PDs, and materials; d = standardized mean difference (Cohen, 1988). Physics was assessed in 2015 only. Mean differences are based on Table 6 and were standardized using the square root of the pooled variance across all groups, separately for each discipline and Big Idea. Positive values indicate a larger average achievement of students with teachers in the first named group, negative values indicate a larger average achievement of students with teachers in the second group. Coefficients with p values < .05 are marked bold.

Pooled achievement for Science Practices (based on Table 6).
In general, after controlling for student-, teacher-, and school-level covariates, we found variation in students’ AP subscale scores related to teachers’ PD participation. Table 7 indicates that across all estimated PD differences for Big Ideas, the average difference in students’ achievement between different PD groups was |d| = 0.06 for Big Idea subscores, ranging from |d| = 0.00 to |d| = 0.20. The average difference in student achievement across all estimated PD group differences was |d| = 0.05 for Science Practices, ranging from |d| = 0.00 to |d|= 0.15 (see Table 8). Generally, the pattern of results suggests that in biology, differences between MAT, MAT/Online, and ALL are typically zero to small, whereas in chemistry, students with teachers who used MAT/oPDs oftentimes performed statistically significantly higher, compared with students of teachers who participated in other PD formats. In physics, these patterns are less systematic.
This is in line with previous research in this area (Fischer, Fishman, et al., 2018). More specifically, students of teachers who participated in oPD often outperform students of teachers who participated in MAT/F2F formats especially in chemistry for both AP subscale scores of Big Ideas and Science Practices. Interestingly, we did not find a general pattern, whereby “more diverse PD” (e.g., ALL) systematically results in better AP subscale scores. In some cases (e.g., in biology), students of teachers who reported to use only materials for PD performed, on average, statistically significantly higher or equally high, compared with students of teachers who participated in the other PD formats.
Longitudinal Data Analysis of RQ 3 and RQ 4
Finally, we also leveraged a longitudinal data set of teachers who participated in the surveys in 2014 and 2015 to estimate the effect of choosing a specific PD format on teachers’ challenges and instructional practices (RQ 3) as well as aggregated student outcomes (RQ 4) with an entropy weighting approach. When considering the longitudinal subset of teachers who participated in 2014 and 2015, there were no statistically significant changes on teachers’ challenges, teachers’ practices, or aggregated student achievement (see supplemental Table A7 in the appendix). Notably, the sample size of this longitudinal subsample per PD format is fairly small (e.g., NMAT = 214, NMAT/F2F = 265), which results in limited statistical power. Extensive information on results of these analysis can be found in the supplemental appendix.
Discussion
The study attempts to identify patterns of teacher enrollment in PD activities across a variety of PD formats, as well as associations of PD participation patterns with content-specific measures of student performance. The main results are as follows: The majority of teachers engaged in a combination of online, F2F, and material-based PD activities. This finding is stable across disciplines and years, which speaks to the desire of many teachers to utilize PD activities to prepare for curriculum reforms.
Interestingly, several teacher characteristics were related to participation in certain PD programs. For instance, female teachers were less likely to use only materials to prepare for the AP reform compared with ALL, MAT/F2F, or MAT/Online PD formats. Unfortunately, scarce evidence exists that explicitly investigates why gender might be related to PD participation. In one study, Duncan (2013) found that female principals typically perceived a greater need to participate in PD. Duncan (2013) argues that different factors might explain this trend, such as a lower confidence in their abilities compared with men and the option to increase their skills via PD. Whether such causes might also apply in the context of PD during the AP reform will need to be investigated in future studies. Moreover, the flexibility of MAT/Online might be particularly suitable for female teachers, who might have more responsibilities for children and family (e.g., Duncan, 2013).
In addition, the results suggest that administrative support increased the probability of participating in the MAT/F2F or ALL formats, compared with MAT. This might be related to higher organizational and structural demands for teachers, who want to participate in MAT/F2F. In addition, as outlined by Desimone et al. (2006), “District and school administrators play a critical role in the provision of professional development to teachers, in terms of priorities for reform, resource allocation, and fostering an environment conducive to continuous teacher learning” (p. 184). This clearly outlines the importance of administrative support, which is required to participate in PD and which might be particularly important for more organizationally challenging MAT/F2F formats.
When considering the results, we found that more diverse PD formats were not generally chosen by more experienced teachers but particularly by teachers with lower degrees (e.g., more often by teachers with a BA than with a doctoral degree). Specifically, results from our multinomial logistic regression suggest that teachers with a higher degree (i.e., a PhD) less often participate in ALL or MAT/F2F, compared with MAT. These findings are generally in line with prior research, which suggests that participation in PD is associated with teacher characteristics (e.g., Downer et al., 2009; Garet et al., 2001). In our case, less educated teachers might feel more challenged and less prepared to successfully implement new curricula, which is why they generally chose to participate in a broader variety of formats to increase their input and cope with the diverse set of challenges. As outlined in prior research, teachers with higher content knowledge generally participate more often in sustained content-focused PD (e.g., Desimone et al., 2006), which is why they might require diverse PD formats less often in times of change (e.g., when reforms are implemented). However, more research is needed to better explain why specific teachers choose specific PD formats over others, possibly with representative longitudinal data. In sum, our study expands prior work suggesting that teacher characteristics not only seem to matter for the decision to participate in PD in general but also matter for choosing specific PD formats over others in order to prepare for teaching revised curricula.
When comparing teachers’ reported challenges with the AP redesign, cross-sectional analyses indicate that teachers who used only materials reported the fewest amount of challenges with the AP redesign compared with all other PD participation patterns. Similarly, teachers who used only materials for their PD reported enacting AP practices in class more often compared with teachers who enrolled in a combination of online, F2F, and materials-based PD activities. This finding changed its direction when considering results from entropy weighted longitudinal analyses: Here, teachers in MAT/F2F, MAT/Online, and ALL enacted science practices more often compared with teachers who used only materials. Although these analyses did not reveal any statistically significant results, the differences between groups regarding practices are more in line with prior literature, which would suggest more diverse PD could be more fruitful for teachers (e.g., Borko et al., 2010). However, it is important to keep in mind that the longitudinal and the cross-sectional analyses used different samples (as not all chemistry and biology teachers participated in both 2014 and 2015, and physics teachers were assessed only in 2015), so future studies are encouraged.
Specifically, the findings point to differential advantage of using different PD formats across different disciplines. That said, there might be reasonable arguments for why our results differed regarding perceived challenges: We argue that this might reflect that participation in PD was selective and could be interpreted as a response to specific challenges experienced from implementing the reform. Teachers in the materials group may have already been better equipped to respond to the challenges posed by the reform. Indeed, we found that teachers who used only materials tended to have more years of experience teaching AP courses and the revised AP curriculum. In addition, it is important to note that teachers in the materials group also engaged in professional learning, which is the key driver of adapting instructional practices (Webster-Wright, 2009). These findings would be in line with research suggesting that the quality of professional learning is more important than its PD format (e.g., Darling-Hammond et al., 2017; Desimone, 2009; Fishman et al., 2013).
The results also suggested a pattern where students of teachers who used materials and oPDs tended to perform comparably well on most AP subscale scores (particularly in chemistry; see Figures 1–2). This is in line with previous research that indicated benefits of oPD (e.g., Fishman et al., 2014; Frumin et al., 2018). Interestingly, we did not find a general pattern whereby “more diverse PD” participation (i.e., participation in combinations of F2F and oPD alongside materials use) was systematically associated with higher AP subscale scores of students (Borko et al., 2010). In some cases, students of teachers who reported using only materials for PD performed, on average, better or similarly well, compared with students of teachers who participated in the other PD formats (e.g., see biology, Figure 1). Depending on the discipline and AP subscale score, we found variation in student performance for teachers participating in different PD programs. It is somewhat challenging to ultimately identify causes for the variation in student achievement between the different PD formats; this article can provide only some initial ideas on potential channels, which should be investigated in more detail in future studies. First, it is important to note that variation might result from differences in the quality of specific PDs. As outlined by Desimone (2009), five factors are theoretically relevant for PD quality: content focus, active learning, coherence, duration, and collective participation. Based on this, different formats might be differently aligned to these quality criteria (e.g., duration might be higher in oPDs, compared with traditional F2F PDs). In our study, we tried to control for these PD quality features (e.g., by controlling for perceived effectiveness, and duration), but similar to most studies in this area, these variables were based on self-report and do not constitute objective markers. Future research should therefore more strongly discuss how to assess quality criteria of PD programs. In this regard, various instruments were developed (e.g., McChesney & Aldridge, 2018; Soine & Lumpe, 2014); however, no common instrument has evolved yet, and most validation studies did not test concurring models using fit statistics and invariance tests, both of which are important to fully judge instrument quality. In addition, associations to more objective quality markers (e.g., by external raters) are lacking.
Second, it seems reasonable to believe that specific PDs are more useful for teachers with specific characteristics (e.g., learning styles, beliefs, and needs). Due to the fact that teachers typically (freely) opt in to specific PDs and PD formats, it seems challenging to investigate this question. A better alignment between teachers’ requirements and the PD/PD format might play a significant role for PD programs to achieve their full power. In order to investigate such alignment effects, randomized studies might be a useful tool, although somewhat challenging when implementing a new curriculum. Besides these exemplary potential causes, others likely exist (e.g., learning and training to teach specific, new curricular content might be differentially related to specific PD formats), which should be investigated more thoroughly in future research.
Limitations
There are several limitations to consider when interpreting the results of this study. First, the results of our cross-sectional analyses should not strictly be interpreted from a causal inference framework because we cannot ultimately link differences in achievement between students of teachers who participated in different PD groups to these different PDs. Although previous research suggests that a good set of covariates can lead to similar results in common regression approaches compared with causal inference approaches (e.g., propensity score matching; Cook et al., 2009), we cannot formally test if we have included all relevant covariates in our models (i.e., omitted variable bias). Therefore, it is somewhat difficult to judge how much selection might be driving the results presented in this study. For instance, it might be possible that teachers who were more worried more often opted in to MAT/F2F PD programs, and this might have ultimately affected our findings. In order to address this potential threat, we decided to conduct a robustness check on all our analyses using a restricted set of covariates (i.e., no teacher covariates) and compared the results of these additional models with the results presented in the main analyses. The results of the partially adjusted models can be found in the supplemental material. Overall, differences from these two specifications (fully adjusted vs. partially adjusted) are very small: Regarding Big Ideas, we found an average difference of d = 0.03, when comparing all estimates presented in Table 7. Regarding Science Practices (see Table 8), the average difference amounted to d = 0.02. Furthermore, we found the direction of differences to be consistent across the two specifications. Although we cannot fully eliminate the possibility of selection bias, we feel that our findings and robustness checks provide some evidence that this bias seems to be rather small in size and does not lead to substantially practically different results.
Related to this, access to materials and most oPD activities is free of cost to all teachers. However, F2F PD activities may pose some geographical and financial constraints to teachers. That said, only a minority of teachers (about 7%) reported that their school provides no financial support for their PD participation. Overall, we do not have full information about which PD opportunities were accessible to individual teachers (as this is also highly dependent on each individual teacher—for instance, with regard to their willingness to travel to a F2F PD workshop) and this has to be kept in mind when interpreting the results.
In addition, most of our teacher data are based on self-report, and the validity of such measures needs to be interpreted with caution. That said, think-aloud protocols with teachers in a pilot phase of the surveys indicated sufficient validity and reliability (Desimone & Le Floch, 2004). Also, we included a longitudinal analysis with a stronger methodological framework that utilizes entropy balancing on a subset of the data to validate our findings from the cross-sectional analyses.
Finally, we were not able to consider all available data regarding Big Ideas and Science Practices. College Board provided us with data from only multiple choice questions (we did not receive data on student performance on open-ended response items). Therefore, results for some Big Ideas and Science Practices might have been different if open-ended questions were considered. However, access to AP subscale data is a unique feature of this study, providing more nuances of student learning compared with the more commonly used—and blunter—overall 1 to 5 AP aggregate score.
Implications
The results of this study may have several implications for researchers, educational policy makers, PD providers, and practitioners. For researchers, this study suggests that the use of summative AP performance indicators may not represent the full picture. Thus, researchers examining PD programs may want to consider a broader depth of potential student outcome measures than a single performance indicator. Similarly, it is important to conduct replication studies across different disciplinary contexts, with different teachers as corresponding results may differ in effect size (and potentially directionality) despite similarities across disciplines. This might also help address challenges of generalizability of our findings to different settings (e.g., Tipton & Olsen, 2018). For instance, our results indicate that benefits of utilizing oPD and materials compared with using solely materials seemed larger for chemistry teachers compared with biology teachers. However, causal explanations for these potential benefits remain unclear. Therefore, future studies may provide a more in-depth link between what was actually done in different PD programs and how this is related to specific teaching content.
For educational policy makers, this study suggests that some teachers have preferences to choose certain PD formats (e.g., MAT/Online). As teachers may opt out of formal PD participation if PD is not offered in their preferred modality and as we identified that some combinations of PD formats seem to be associated with higher student outcomes, it is important that policy makers and educational administrations support the availability of a broad variety of PD programs during changing curriculum reforms. This aligns with Borko et al.’s (2010) perspective that a “modernized conception of PD” can support educational policy reforms. Furthermore, if our findings about the differential associations of PD programs for specific content are replicable, this could have implications for more sustainable investments into specific PD programs that were found to be most useful for the specific groups of teachers in their corresponding disciplinary areas. In turn, an improved PD supply structure may also lead to a greater teacher buy-in for different reforms (a precursor of successful policy implementation; Donnell & Gettinger, 2015).
For practitioners and PD providers, the most important implication is that specific teacher characteristics might be related to PD participation. For instance, we found that administrative support is related to teachers’ PD participation. Therefore, it might be fruitful to encourage administrators, the gatekeepers of teacher PD, to expand their support structures and particularly consider needs and requirements of teachers with different characteristics (e.g., Desimone et al., 2006). We encourage teachers to supplement their use of materials with other forms of PD to prepare for potentially emerging challenges in curricular enactment.
Supplemental Material
sj-docx-1-ero-10.1177_23328584211028601 – Supplemental material for One Program Fits All? Patterns and Outcomes of Professional Development During a Large-Scale Reform in a High-Stakes Science Curriculum
Supplemental material, sj-docx-1-ero-10.1177_23328584211028601 for One Program Fits All? Patterns and Outcomes of Professional Development During a Large-Scale Reform in a High-Stakes Science Curriculum by Nicolas Hübner, Christian Fischer, Barry Fishman, Frances Lawrenz and Arthur Eisenkraft in AERA Open
Footnotes
Acknowledgements
The authors thank the following people for their contributions to this work: Amy Wheelock and Ted Gardella of the College Board; members of the research team Chris Dede, Kim Frumin, Abigail Jurist Levy, Brandon Foster, Yueming Jia, Janna Fuccillo Kook, Ayana McCoy; and the thousands of AP teachers who helped shape and participated in this project. We also thank Richard Göllner for his feedback on an early iteration of this article. This work is supported by the National Science Foundation through the Discovery Research PreK-12 program (DRK-12), Award 1221861. The views contained in this article are those of the authors, and not their institutions, the College Board, or the National Science Foundation.
Authors
NICOLAS HÜBNER is an assistant professor of education at the University of Tübingen. His current research focuses on the implementation and effects of educational reforms, related teacher professional development, gender disparities in STEM, and student achievement and motivation.
CHRISTIAN FISCHER is an assistant professor of educational effectiveness at the Hector Research Institute of Education Sciences and psychology at the University of Tübingen, Germany. His research examines pathways to improve STEM teaching and learning, in particular through the use of digital technologies.
BARRY FISHMAN is Arthur F. Thurnau Professor of Learning Technologies in the University of Michigan School of Information and School of Education. His research focuses on teacher learning, sustainable and scalable educational innovation, and the creation of engaging learning environments inspired by the design of successful games.
FRANCES LAWRENZ is Wallace Professor of Teaching and Learning at the University of Minnesota where she is also the Associate Vice President for Research. Her research interests focus on evaluation and assessment of STEM programs.
ARTHUR EISENKRAFT is the Distinguished Professor of Science Education, professor of physics and director of the Center of Science and Math in Context (COSMIC) at the University of Massachusetts Boston. His research interests focus on effective curriculum innovation, teacher leadership, and teacher professional development.
References
Supplementary Material
Please find the following supplemental material available below.
For Open Access articles published under a Creative Commons License, all supplemental material carries the same license as the article it is associated with.
For non-Open Access articles published, all supplemental material carries a non-exclusive license, and permission requests for re-use of supplemental material or any part of supplemental material shall be sent directly to the copyright owner as specified in the copyright notice associated with the article.