
Abstract
System-wide educational reforms are difficult to implement in the United States, but despite the difficulties, reforms can be successful, particularly when they are associated with broad public support. This study reports on the nature of the public sentiment expressed about a nationwide science education reform effort, the Next Generation Science Standards (NGSS). Through the use of data science techniques to measure the sentiment of posts on Twitter about the NGSS (N = 565,283), we found that public sentiment about the NGSS is positive, with only 11 negative posts for every 100 positive posts. In contrast to findings from past research and public opinion polling on the Common Core State Standards, sentiment about the NGSS has become more positive over time—and was especially positive for teachers. We discuss what this positive sentiment may indicate about the success of the NGSS in light of opposition to the Common Core State Standards.
Sustainable, system-wide educational reforms are challenging and uncommon in the United States (Cohen & Mehta, 2017), especially given how educational systems have added—but rarely subtracted—initiatives and responsibilities (Cohen & Hill, 2008). This systemic structure highlights the importance of considering educational reform as a complex process involving multiple stakeholders and levels, including the public (Jacobson et al., 2019). Despite the challenges associated with system-wide and national reforms, they have been and can be successful (Berkeley et al., 2009; Cohen & Mehta, 2017), especially when key conditions are met. Namely, reforms are more likely to succeed if they are more iterative than transformational in nature and recognize or align with the problems teachers face during the development of the necessary infrastructure for the reform (Cohen & Mehta, 2017). In addition, a key factor undergirding successful educational reforms is broad public support (Cohen & Mehta, 2017). Underscoring this point, Cohen and Mehta claim that even if the other key conditions were not present if reform efforts “had broad and deep popular external support, it could succeed” (p. 676). Thus, public support—already having it or deliberately working to bolster it—is a core component of system-wide educational reforms.
In addition to the question of how to develop public support for reforms, another foundational question concerns how to measure it. Public support—as a form of public opinion—can be considered in terms of the valence, or sentiment, of the beliefs people express toward the policy or topic. Hereafter, we use the terms public sentiment and sentiment synonymously to refer to the valence of beliefs about a particular topic—educational reforms. People’s beliefs about educational reforms have been studied using self-report (e.g., EducationNext, 2020; Polikoff et al., 2016), as well as observational methods (e.g., Wang & Fikis, 2019) that leverage large collections of digital trace data, “detailed records of social interaction” (Welser et al., 2008, p. 116) that result from our behaviors within digital platforms. Such data are often not only large in size but are also not only historically available (e.g., it is possible to explore what users posted about in particular historical months and years) but are also generated on an ongoing basis in a way that permits granular comparisons over time (Wang, 2017). Social media is relevant both because it presents a platform for people to share their beliefs and a new context for research, including research about public sentiment (van Dijck, 2013). Indeed, researchers have used social media data to evaluate what people think about topics such as U.S. immigration (Chung & Zeng, 2016) and space (Cobb, 2015), and educational policy (Wang & Fikis, 2019).
In this study, we built on the work of a study of the public sentiment expressed about the Common Core State Standards (CCSS) reform on the social media platform Twitter by Wang and Fikis (2019) to understand the public sentiment expressed toward the current system-wide curricular standards-based reform effort in science education (Rudolph, 2019), the Next Generation Science Standards (NGSS). Different from (albeit, limited) polling and research on the CCSS, which has documented the degree, change over time, and sources of support for that reform (EducationNext, 2020; Polikoff et al., 2016), there is no public opinion polling on the NGSS. As a result, science education stakeholders (and other stakeholders in education) are underinformed about what people, including teachers, think about the NGSS.
This absence of information about what the public thinks about a national educational reform effort is notable because past reforms have been hampered by negative public support (Cohen & Mehta, 2017), particularly for a salient reform, the CCSS, which was concomitant with declining support over time, especially among teachers (EducationNext, 2020). In addition, this is notable because the NGSS has a number of elements, both by design and timing relative to the CCSS, that suggest that both teachers and the public may view it as having a different—and positive—light. In fact, the NGSS may (quietly) represent a successful large-scale educational reform, but public opinion polling and comprehensive policy-level research alike are largely absent, as science education scholars have recently pointed out (Hardy & Campbell, 2020).
This study, then, addresses a substantive need to be informed by research—the absence of any data about the degree of public support for a science education reform effort that has, to varying degrees, affected the science education standards in all but six states. In addition, this study builds on and extends Wang and Fikis’s (2019) work with particular statistical and data science (e.g., mixed effects models and a supervised machine learning method that differentiates a key science education stakeholder group) methods, which could be used as a model for others, including policy makers, interested in measuring public sentiment about educational reforms.
How Public Sentiment Can Affect the Success of Reforms?
Not only in education but also in other sectors, public opinion and sentiment affect public policy (Burstein, 2003). Public opinion and positive sentiment toward policies may be particularly important in education because of how much of a say the public has in how its educational system functions (Cohen & Mehta, 2017; Cohen & Mehta, 2017). Voters, through their elected officials (and elected school boards), may oppose—or champion—particular policies (Coburn et al., 2016; Edgerton, 2020). Underscoring this point, Cohen and Mehta (2017) wrote that “the reforms that built our systems of public elementary, secondary, and tertiary education succeeded because they had such popular political support” (p. 676). In this way, positive public opinion about educational reforms is a core feature of how educational reforms are taken up and sustained, as is political action by key individuals intended to marshal public support (Edgerton, 2020; Hardy & Campbell, 2020).
We conceptualize a bidirectional relationship between sentiment and the successful implementation of educational reforms. Positive public sentiment on a macro level can indicate broad support for the goals associated with educational reform, making it easier to implement changes without resistance or opposition to the intended goals. On a micro level, teachers are more likely to act in ways that support reform efforts if they align with their individual beliefs and practices (Coburn, 2001), which includes personal positive sentiment. Also, social network analysis-based research illustrates that teachers’ interactions with colleagues influence their behaviors (Coburn, 2001; Frank et al., 2015, 2020; Penuel et al., 2013). Micro-level interactions with colleagues could also affect sentiment at a larger scale, in that momentary, positive interactions between colleagues about an ongoing reform could lead to more robust implementation. Moreover, there could also be positive feedback loops among sentiment and implementation: Successful implementation could lead to a positive reception by students and their parents, begetting further support.
Successful implementation of most educational reform requires coordination across educational systems (Stiles et al., 2017). In fact, scholars have suggested that insufficient attention to educational systems and building the necessary infrastructure has doomed educational reform efforts in the past (Cohen & Mehta, 2017; LaVenia et al., 2015; Penuel et al., 2013; Peurach et al., 2019), including science education reform efforts like the National Research Council’s (1996) National Science Education Standards (Rudolph, 2019; Windschitl, 2006). The necessity of coordination points to the potential variance in awareness and knowledge of reforms—and the sentiment people may express toward them across different stakeholder groups and communities.
A likely source of variation in sentiment toward reforms concerns the individuals operating at different levels of the system. What parents think about, for instance, mathematics reform had a substantial impact on the success of mathematics reform efforts (Schoenfeld, 2004), and, while some of parents concerns were driven, in part, by partisan political views (Polikoff et al., 2016), others were driven by substantive concerns that scholars have interpreted as valid (Tampio, 2017). Moreover, teachers face asymmetric responsibilities of reform efforts as they often bear the brunt of test-based accountability (Edgerton & Desimone, 2019), and, over time, teachers came to view the CCSS unfavorably (EducationNext, 2020). Thus, what different stakeholders think about a particular educational reform is important and may have a bearing on the (ongoing) implementation of said reform and improvement efforts. These examples also highlight that we expect variability in sentiment over time as reforms are adopted and their positive (or negative) features become better known in the eyes of teachers and the public. Additionally, we may expect sentiment to vary widely across geographic locales, especially when states or locales adopted the standards and different times. As such, it is important to understand the broad public sentiment of reforms, change over time, and across geographical locales, and the variation in sentiment among different stakeholders.
Using Social Media to Explore Public Sentiment About Educational Reform
Despite the established importance of public sentiment for educational reform, limited past research has empirically investigated public support for or opposition to specific reforms. Instead, scholars often consider the role of such support through historical accounts (e.g., Cohen & Mehta, 2017; Cuban, 1986; Rudolph, 2019). However, prior research outside of education has documented several affordances of using digital trace data from social media to analyze public sentiment (Bollen et al., 2011; Dodds et al., 2011; Golder & Macy, 2011; Salganik, 2019), including their variation in predictable ways in response to exigencies in a way that adds validity evidence for the use of such “unsolicited” opinion polls (Cody et al., 2015). Moreover, research has shown there to be a strong correlation between the two data sources (e.g., O’Connor et al., 2010), and using social media for understanding public sentiment is already common practice in political science (Tumasjan et al., 2010), sociology (Flores, 2017), and business and marketing contexts (Gallaugher & Ransbotham, 2010).
A notable exception to past research on the utility of social media data for understanding public sentiment being undertaken outside of education is Wang and Fikis’s (2019) examination of the sentiment of posts on Twitter about the CCSS. Wang and Fikis used educational data mining and sentiment analysis techniques (particularly, those available through the SentiStrength software; Thelwall et al., 2010) to examine the sentiment of around 600,000 tweets. They found that the sentiment of posts was overwhelmingly negative and that there was variation between states in sentiment. For the one year of the posts they analyzed, there were around four negative posts for every one positive post—finding what they referred to as a sentiment ratio (of negative to positive posts) of 3.66 across all states; at the state level, this ratio ranged from 1.00 to 33.27.
Wang and Fikis’s (2019) study can be framed within research on educational data science. Educational data science is an emergent research discipline (and area of practice for educational analysts, including those working in state-level agencies, districts, and schools) that is closely related to learning analytics and educational data mining (Fischer et al., 2020; Piety, 2019; Piety et al., 2014). Whereas learning analytics research has traditionally focused on data from learning management systems, the analysis of social media posts may be considered to be an example of a type of educational data mining, one distinguished by the use of publicly available data (Kimmons & Veletsianos, 2018). These micro-level interactions elide with Fischer et al.’s (2020) description of how sentiment analysis as a method provides a meso-level account of the valence of an expression through an analysis of its linguistic features. Educational data science studies draw on techniques related to statistics, knowledge about education, and the power of computation and computer programming (Rosenberg, Lawson, et al., 2020). In this way, the use of advanced statistical or machine learning methods are not necessarily, alone, constitute educational data science. Instead, what aligns work with this discipline is using statistical and computational techniques in light of questions and problems related to teaching, learning, and educational systems (Rosenberg, Lawson, et al., 2020).
The Policy Context of the Next Generation Science Standards
Beginning in 2011, twenty-six lead state partners provided guidance regarding the development of the NGSS (NGSS Lead States, 2013)—and committed to considering adopting the standards (NGSS Lead States, 2020b). The development of the standards involved a constant dialogue between the writers of the standards and these lead state partners, culminating in the release of the standards in 2013. Like the CCSS, the NGSS are a large-scale, standards-based curriculum reform effort; they are now adopted in 20 states, with another 24 states having developed standards based on the NGSS (and/or the Framework for K-12 Science Education) under their own (state-specific) name. At the same time, the NGSS have some features that distinguish them from past reforms, including the CCSS, four of which we describe below.
First, we consider the timeliness of the NGSS. The NGSS are similar to the CCSS in that their development, which took place during the same “complex, contested federal–state policy context” (Hardy & Campbell, 2020, p. 481) as the CCSS. Indeed, one reason for the timing of when the development of the NGSS was initiated was to capitalize on the momentum from the development and adoption of the CCSS (Hardy & Campbell, 2020). Moreover, NGSS advocates benefited from the timing of the as advocates for the NGSS were aware of both their own opportunity and risk regarding being associated with the politically contentious elements of the CCSS (Hardy & Campbell, 2020).
Another characteristic of the NGSS’s development that is closely related to but different from the timing was the protracted timeline over which states adopted the NGSS. After the release of the standards in 2013, a steadily increasing number of states have adopted the NGSS. Notably, another 24 states adopted standards based on the NGSS: These states used the NGSS and the Framework for K-12 Science Education (National Research Council, 2012) as the foundation for drafting their standards. In this way, the NGSS were adopted over a much longer period than the CCSS, which were adopted rapidly in the context of the Race to the Top (U.S. Department of Education, 2009) initiative (LaVenia et al., 2015). This timing may be salient to how the NGSS were adopted because there is some evidence this pace of implementation allowed NGSS advocates within states to slow their pace of adoption and to navigate the tension between federal and state education policy making (Hardy & Campbell, 2020). This timeline also allowed states to adopt standards based on the NGSS at their pace and allowing states to develop their standards that drew on the work of developing the NGSS may have allowed for widespread adoption of standards like the NGSS, without the political resistance that may have met the efforts of some states to strictly adopt the NGSS. We note that this heterogeneity could mean that teachers adopted standards based on the NGSS see themselves as teaching their state’s standards—and not, in any way, the NGSS—though there is good evidence 1 that suggests these teachers do see themselves as teaching the NGSS.
In addition, the NGSS were built on a research base with codified consensus (National Research Council, 2012); indeed, creating this consensus report was a core aim for the early years of the development of the NGSS (NGSS Lead States, 2020a). This consensus aligns with progress in science education research that emphasized not only learning about science content but also engaging in science and engineering practices, as well as carefully aligning the standards horizontally—across courses within a grade band—and vertically—between courses and grade bands and including advances in scientific research (National Research Council, 2012). The (merited) inclusion of science and engineering practices in the standards, particularly, surprised even some long-standing scholars whose work focused on engaging students in disciplinary practices (Lehrer & Schauble, 2015).
Finally, professional networks supported the rollout of the NGSS. Hardy and Campbell (2020) showed how key individuals acted in sophisticated ways to make the NGSS palatable to diverse stakeholders. In a series of studies, scholars have shown how state-level science education policy makers used their involvement with the Council of State Science Supervisors (and associated meetings, webinars, and a list-serve) to share research between states (Hopkins et al., 2018) and between researchers and practitioners (Hopkins et al., 2019). Thus, networked supported NGSS advocates across states to share resources related to the NGSS (Hopkins et al., 2018, 2019). Notably, the #NGSSchat community on Twitter was initiated in 2012 as a professional learning network focused on the NGSS (Shelton & Ende, 2015), and this informal professional learning community has been a consistent feature of the broader landscape in which the NGSS was adopted and implemented through the present. Prior research has shown that #NGSSchat is a robust network (Carpenter et al., 2020) that functions like other, traditional networks, by facilitating substantive interactions among individuals in different professional roles (i.e., researchers, administrators, and teachers; Rosenberg, Reid, et al., 2020), and that networks on social media may play a role for teachers’ professional development, and thus relations to their teaching practice (Fischer et al., 2019; Rosenberg, Reid, et al., 2020). Thus, professional networks organized around professional organizations may have supported the implementation of the NGSS and the #NGSSchat community may have shaped the conversation around the standards.
Research Questions
The purpose of this study is to understand the nature of the public sentiment expressed toward the NGSS on Twitter through the use of all posts that include the NGSS and NGSS-related terms as well as all posts to a widely used NGSS-related hashtag, #NGSSchat. Given how public sentiment can vary across multiple factors, we also explored sources of variation (including the year of the post and the professional role of users, among others) for sentiment. Correspondingly, the following two research questions guided this study:
Data Sources
We used publicly accessible data from Twitter collected using the Full-Archive Twitter API endpoint through Twitter’s academic research program (Twitter, 2021) and self-programmed Bash scripts and Curl. First, we accessed tweets and user information from the hashtag-based #NGSSchat online community from its inception on September 6, 2011, through December 31, 2020); these tweets took place during chats, approximately biweekly, 1-hour moderated conversations that took place via the #NGSSchat hashtag (Shelton & Ende, 2015), and during the rest of the time—what we refer to as the nonchat use of #NGSSchat. Then, we also accessed all tweets that included any of the following phrases (and: “ngss,” “next generation science standard(s),” “next gen science standard(s)”). We considered these to be the non-#NGSSchat tweets, as these tweets did not include the #NGSSchat hashtag.
For all of the tweets (both those including #NGSSchat and those including other terms related to the NGSS), we only included tweets detected by the Twitter API as being in the English language. This led to an omission of 6.28% of posts. 2 Our study sample included a total of N = 565,283 English-language tweets. Figure 1 depicts the frequency of all tweets in the three contexts. This illustrates a gradual increase of non-#NGSSchat posts (perhaps as the standards became more widely adopted) through around 2020, punctuated by peaks in activity within and across years—especially during the March 2015 conference for the National Science Teachers Association.
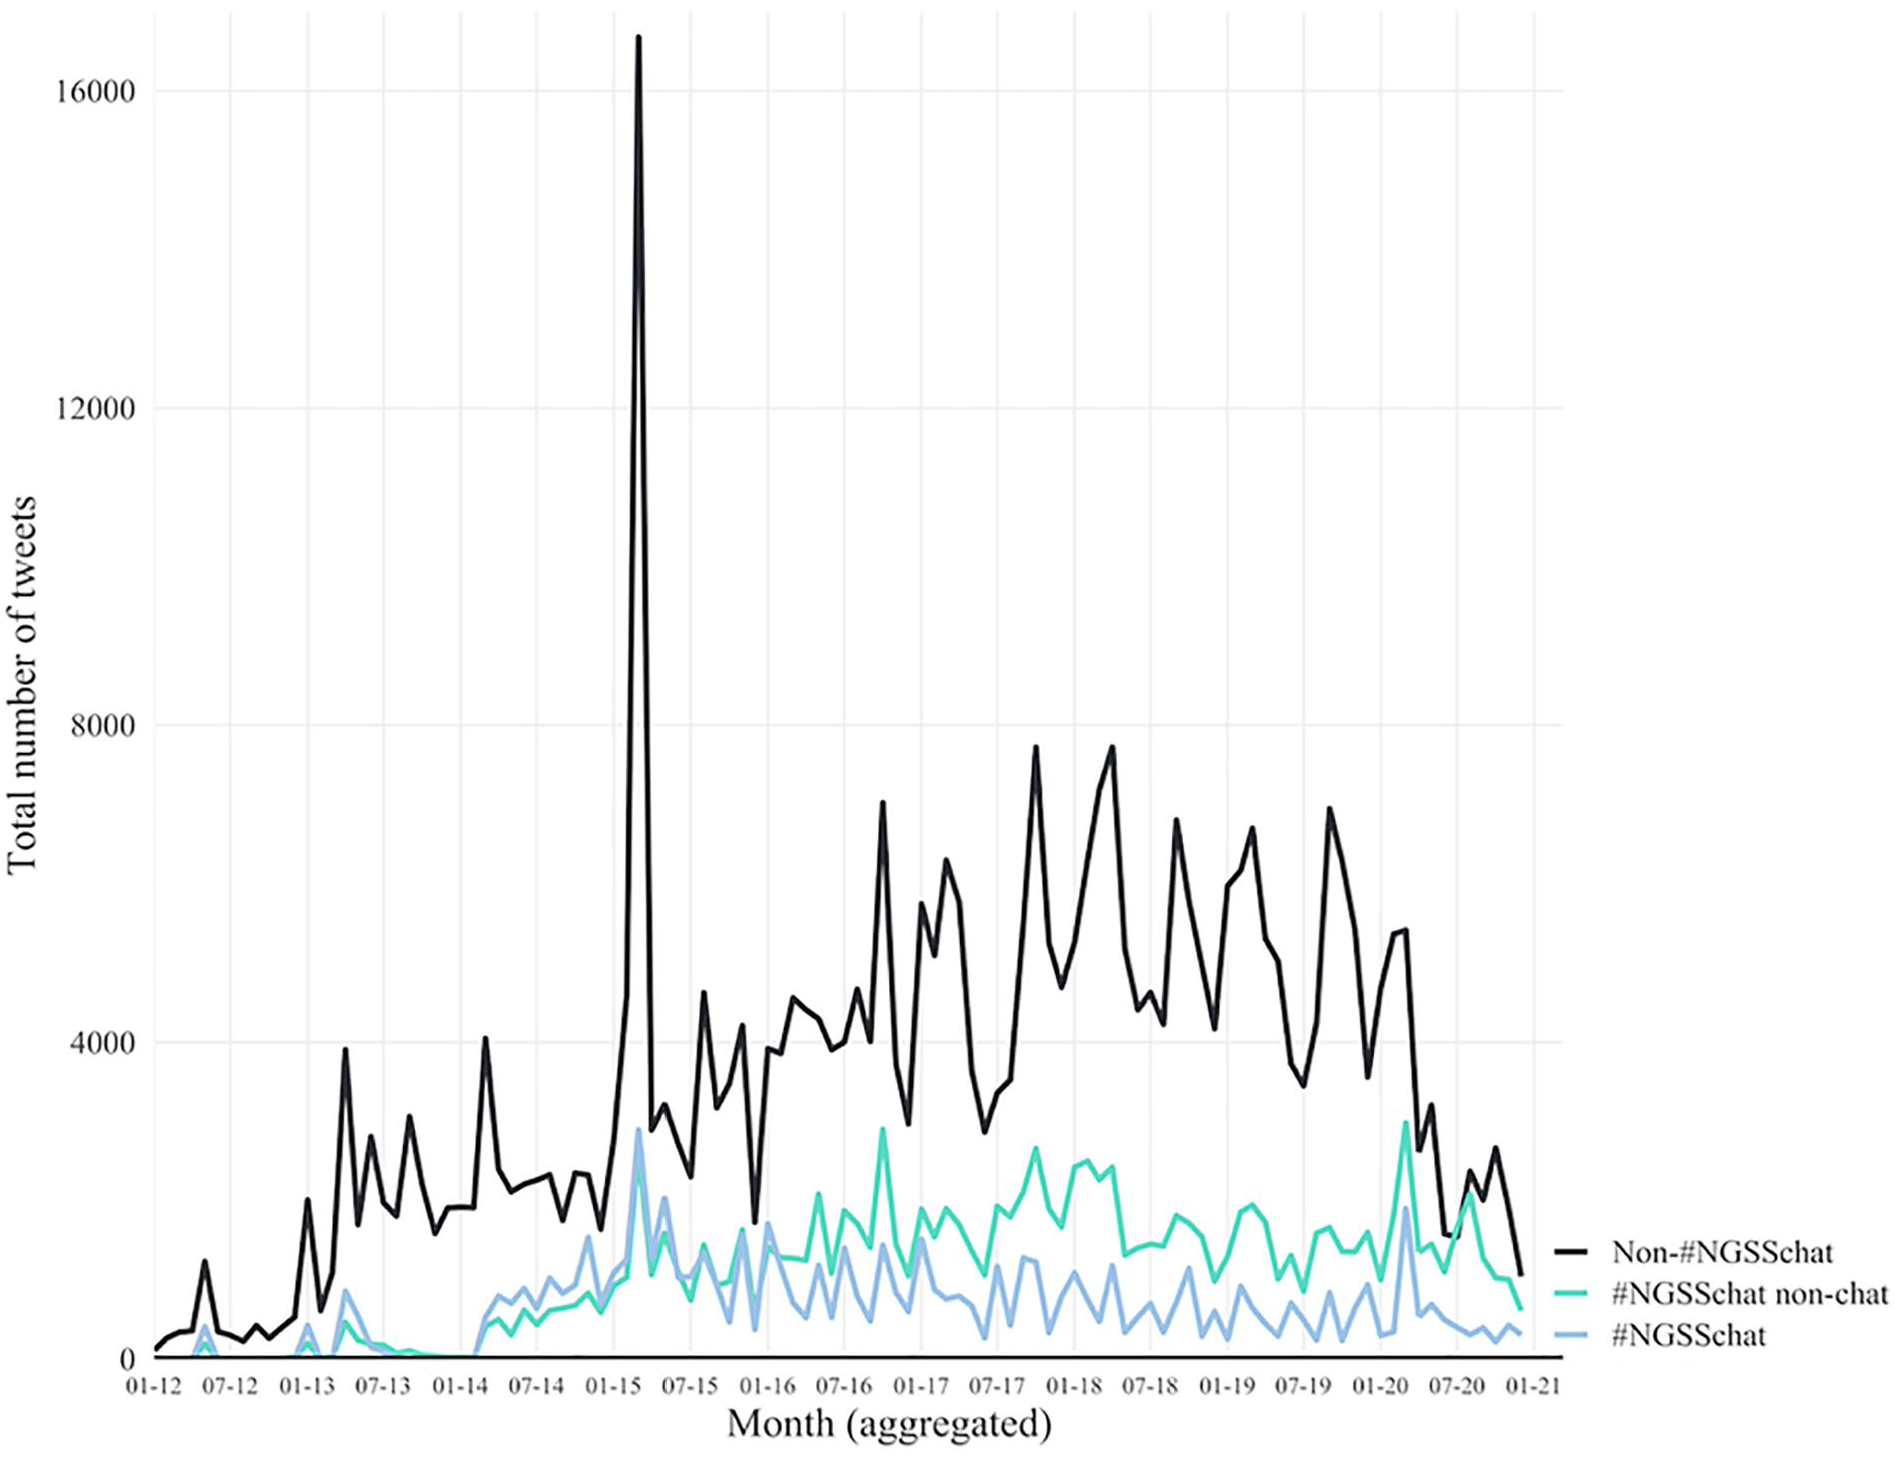
Number of tweets each week.
Our data included tweets from 78,710 users, whose user accounts were classified as “teachers” (n = 20,085, 25.52%) and “not clearly classifiable as teachers” (or “nonteachers 3 ”; n = 58,625, 74.48%) using a C-support vector classification algorithm from the python machine learning module sklearn (Pedregosa et al., 2011) with a training data set of 517 hand-coded Twitter profiles (from Rosenberg, Reid, et al., 2020) including both teachers and nonteachers, such as institutional accounts or university professors. The algorithm featured categorical variables indicating the presence or absence of keywords in the Twitter biographies of users as predictor variables, such as “teacher” or “instructor.” With a 10% cross-validation test-split (n = 52), the classification model achieved an area under the curve (the probability of correctly classifying a set of one teacher and one nonteacher user profile) of 0.805 and an accuracy of 84.62%. On the whole training data set, the classification of teachers had a satisfactory Cohen’s K of 0.612 (McHugh, 2012) and an F-Score of 0.806 (precision = 0.716, recall = 0.922, support = 230). Documentation for the training and application of the classifiers is provided in the online Supplementary Material A. Descriptive statistics for teachers and nonteachers activity are provided with descriptive statistics and bivariate correlations between the study variables in the online Supplementary Material B.
Measures
The dependent variable was the sentiment of each tweet. Tweet sentiment is derived using natural language processing algorithms; particularly, those employed by the SentiStrength software. We used SentiStrength because it provides validated measures for sentiment in short, informal texts (Thelwall et al., 2010). In particular, we first used SentiStrength to assign binary classifications to tweets—to assign to tweets a label as negative or positive. We did this to directly replicate the method used by Wang and Fikis (2019) so that we could directly compare the sentiment of CCSS posts to those in our sample in our descriptive analysis (for Research Question 1). After assigning to each tweet a binary classification, we then calculated the sentiment ratio in a given group of tweets as the ratio of negative to positive tweets. In addition to the binary classifications, we used SentiStrength to assign scale classifications to tweets. To prepare the data for our inferential analysis (for Research Question 2) which used this scale score, we first employed SentiStrength to obtain two 4-point ratings of sentiment, one each for the positivity and the negativity of the tweet. The positivity estimates’ possible values ranged from one to four, while the negativity estimates ranged from −1 to −4. Thus, tweets received estimates for both how positive and negative they were. Subsequently, we created an overall sentiment scale by adding the ratings from the positive and negative scales, resulting in a scale ranging from −4 to 4. Finally, we standardized this scale by dividing its values by its standard deviation. Both the binary and scale ratings are presented in Table 1.
Exemplary Tweets Showing the Range of Sentiment Captured With SentiStrength.

Note. The example tweets are synthetically created based on real tweets to protect participants’ privacy.
Tweet-specific measures include a continuous variable indicating the year in which the tweet was posted, and dichotomous variables whether the tweet was posted after a user first contributed to a #NGSSchat chat session, whether a tweet was posted inside a #NGSSchat session, outside a #NGSSchat chat session or outside #NGSSchat altogether. User-level variables indicated whether a user was classified as a teacher and the number of tweets each user posted inside the aforementioned three categories of tweets and the NGSS adoption status of each user’s state—adopting the NGSS or adapting the NGSS or the Framework for K-12 Science Education. 4 To identify a user’s state, we used geocoding methods with the location descriptions users provided in their Twitter profile: Specifically, we used Google’s Map API to assign states to users based on the locations they provided in their profiles. To identify a user’s state, we utilized location descriptions in the user’s Twitter biography. In addition, we systematically searched tweets in which users introduced themselves (and where they are from) at the beginning of designated #NGSSchat sessions. Finally, we also used unambiguous, single mentions of state names or acronyms from user’s tweets across the whole study sample to identify the state of the remaining users. We utilized Google’s Map API to match location data with states. Overall, states were assigned to 74.72% of users, representing 78.75% of all tweets. Finally, we included the longevity of a user’s account as a time-varying covariate as this may inform teachers’ overall number of tweets. Table 2 provides more information on these variables.
Description of the Independent (IV) and Dependent Variables (DV).

Note. The only measure not described above is for the SentiStrength ratio measure, which is simply the number of tweets assigned the dichotomous code for negative tweets by the number of tweets assigned the dichotomous code for positive tweets.
Data Analysis
To analyze the data, first used the binomial sentiment score descriptively to characterize the sentiment preliminarily and to answer Research Question 1 in a way that would allow us to make direct comparisons to the descriptive approach taken by Wang and Fikis (2019). Next, we used a mixed effects model (also known as multilevel or hierarchical linear models; Gelman & Hill, 2006; West et al., 2014) with maximum likelihood estimation via the lme4 (Bates et al., 2007) package in the R statistical software (R Core Team, 2021). Before fitting the models, we first explored the distributional properties of the dependent and independent variables, as well as the bivariate correlations (online Supplementary Materials B).
We specified a null model including the random effects structure only, with an overall grand mean (of sentiment) specified as varying randomly across individuals and states (i.e., each individual and state was associated with the estimated individual- and state-level differences in mean sentiment). This model was specified primarily to evaluate the proportion of the total variability in tweet sentiment associated with individuals versus states using the intraclass correlation coefficient (ICC). Then, given the explanatory nature of this analysis, we proceeded to a full model including independent variables for the tweet-level variables of the context of the tweet, whether the post was after first joining an #NGSSchat, the longevity of the user’s account as a covariate, and year of the post, and the user-level variable of professional role as a teacher, and the number of posts sent during an #NGSSchat chat, an #NGSSchat nonchat period, or posts not including #NGSSchat. We discuss our choice of a linear growth term. 5 The equation is represented below using Gelman and Hill’s (2006) notation:

To interpret the fixed effects, we used the estimates as well as their confidence intervals and p values with α = .05 to assess the statistical significance of effects. We discuss additional details related to the modeling, including the measures we used to determine the explanatory power of the model (i.e., R2) and our process for checking the mixed effects model’s assumptions. 6
Results
Research Question 1: Public Sentiment About the NGSS
Descriptive Results
Using the binary classification descriptively to make a direct comparison to Wang and Fikis’s (2019) estimates of the sentiment of posts about the CCSS, we found public sentiment about the NGSS to be very positive. Specifically, using the SentiStrength binary rating, 509,833 tweets were classified as positive and 54,450 were classified as negative, for a ratio of negative to positive tweets (Wang and Fikis’s sentiment ratio) of 0.11. In other words, there were 11 negative tweets for every 100 positive tweets about the NGSS.
Results From Mixed Effects Models
Following the descriptive analysis, we undertook to directly compare the sentiment of posts about the NGSS to those about the CCSS, we next used cross-classified, mixed effects models to account for differences in sentiment between states and users—and to make inferences about effects at the state, user, and individual tweet level.
Our null (variance components) model—one without any fixed effects that we used to understand the sources for variation in sentiment—revealed that 20.0% of the total variability in sentiment was between users, while 0.8% was between states; the remaining 79.2% was within users, representing the model residual variance: There was some variation in sentiment between users, but very little between states. Given this, we proceeded with a more parsimonious model that included only individual-level random variability and decided to include only one key state-level variable in subsequent models—the variable for the state’s NGSS adoption status.
Research Question 2: Factors That Explain Variation in Public Sentiment About the NGSS
The estimates for the model are presented in Table 3. Aligning with the descriptive results for Research Question 1, the intercept of the mixed effects model using the SentiStrength scale was 0.45, indicating that—because we transformed the SentiStrength scale to have an SD of 1—that the mean sentiment was 0.45 SD above the midpoint of the –4 through four SentiStrength scale. To interpret this estimate, consider a 1-SD difference in the SentiStrength scale. This represents a 1.18 difference in sentiment on the original (not transformed to have an SD of one) scale. A 1-SD difference would represent a difference of 1.18 units on the SentiStrength scale for all of the tweets in the sample: Every tweet was slightly positive as 1.18 is positive on the −4 through 4 scale. As individual tweets were assigned integer values, an interpretation that reflects this better is to interpret a 1-SD difference in the SentiStrength scale in terms of the difference in sentiment for 100 tweets. Thus, a 0.45 SD difference indicates that, overall, tweets were between neutral and slightly positive. We note that in raw units, the SD of the SentiStrength scale was 1.18. Therefore, a 0.45 SD difference is roughly equal to that same increase in sentiment on the −4 through four scale: The 0.45 SD difference is equivalent to a 0.53 difference in the units of the original scale.
Results From the Mixed Effects Model for the Sentiment of Tweets.

Note. The dependent variable is scaled, and so the effects can be interpreted in terms of an SD change in the SentiStrength continuous scale. The reference group for the Context of the Tweet variable is non-#NGSSchat. The reference group for the Teacher variable is Nonteacher. The reference group for the State’s Adoption Status variables is not adopted. Because we used maximum likelihood estimation, the number of valid observations is also the number of observations not missing values for any of the variables.
In the remainder of this section, we interpret the results, focusing on the estimates for effects that are not only statistically significant but also substantial in terms of their magnitude.
The Year of the Post
The year of the post was important for explaining differences in sentiment. Each year, the estimated sentiment for tweets was 0.09 SD more positive, indicating that posts about the NGSS became substantially more positive over time. The estimated sentiment difference between a tweet posted in 2010 and one posted in 2020 was around 0.90 SD (a 1.06 unit increase in the original SentiStrength scale over time). In the context of all of the other estimates, posts about the NGSS, therefore, became more positive over the period over which the NGSS were developed, adopted, and implemented.
The Effect of Participants’ Role as a Teacher
An important explanatory variable at the user level was their professional role, which we assigned as teachers or nonteachers. We estimated that the sentiment of teachers’ posts was 0.10 SD more positive than that for nonteachers. Thus, comparing 100 posts from teachers and nonteachers, we estimated that 10 of those 100 from teachers were 1 SD more positive than those posted by nonteachers.
The Effects of the Context of the Tweet
The context of the tweet—a measure to distinguish between (a) posts that took place during a biweekly #NGSSchat chat, (b) posts that included the #NGSSchat hashtag but were not posted during a chat, and (c) posts that included key terms but not the #NGSSchat hashtag—was a weak predictor of differences in sentiment. Tweets including #NGSSchat that were posted outside of chats were slightly more negative (β = −0.06) than posts about the NGSS that did not include the #NGSSchat hashtag. There were no differences between posts that took place during a #NGSSchat chat and those that did not include the #NGSSchat hashtag. Notably, given the longstanding community organized through the #NGSSchat hashtag and the possibility that members of this community drove differences in sentiment (Shelton & Ende, 2015), these differences were small relative to the effects of the year of the post and user’s role as a teacher. We discuss the interactive effects of both the effects of the context of the tweet and users’ role as a teacher with the effect of time in online Supplementary Material C.
The Effects of Individuals’ Participation in #NGSSchat
While the differences in the context of the tweet were small, we also investigated differences in sentiment based on users’ participation in #NGSSchat. Thus, while the results on the effects of the context of the tweet were for a tweet-level variable, the results are for a user-level variable. Participants who posted tweets including #NGSSchat outside of the biweekly chats more were more positive in their tweets: 0.15 SD more positive for each 1-SD increase in the number of such posts (relative to all of the other users in our sample) to #NGSSchat outside of chats. Users who posted tweets that did not include the #NGSSchat hashtag were more negative in their tweets: There was a −0.21 SD difference for each 1-SD difference in the number of users’ non-#NGSSchat posts. The effect of posting more to #NGSSchat during chats was also positive (β = 0.07) but was not statistically significant. The statistically significant effects were moderately large: Comparing 100 posts by a user about the NGSS that did not include the #NGSSchat hashtag to a user who posted 1 SD fewer such posts, we estimated that 21 of these posts were 1 SD more negative (than other users).
The Effects of the NGSS Adoption Status of Individual’s State
The NGSS adoption status of individuals’ states (adopted, not adopted, or, when individuals’ location could be not identified, missing) was weakly related to differences in sentiment. We estimated that individuals from states that had—at the time the tweet was posted—adopted the NGSS posted tweets that were associated with a −0.02 difference in sentiment compared with those users from states who did not adopt the standards. We also modeled the effect of a state’s NGSS adoption status as a variable with values for (a) adopted the NGSS, (b) did not adopt the NGSS, (c) missing location, and—different from the above-described analysis—(d) a value for whether the state adopted standards based on the NGSS. Thus, in this analysis, the effect on sentiment of user’s state having adopted the NGSS or standards based on the NGSS was examined. The result of this analysis (see online Supplementary Material D) showed negligible substantive differences; this, we reported the simpler analysis for only whether or not a user’s state adopted the NGSS.
Discussion
This study intends to understand the nature of public sentiment expressed toward the NGSS through an analysis of all of the posts on the social media platform Twitter. Motivated by the absence of information about the degree of public support for the NGSS, we also sought to extend prior research on the use of social media data for understanding public sentiment about educational reforms. We found that public sentiment about the NGSS expressed through the social media platform Twitter has been largely positive, which is quite different from the sentiment found for the CCSS (Wang & Fikis, 2019). We also found positive sentiment to increase over time, to be posted from teachers, and those participating in the #NGSSchat network. Finally, we did not find evidence that sentiment differed based on whether a user was from a state that adopted or adapted the standards. These findings, together, indicate that the NGSS may have some success in adoption and implementation.
Why Was Sentiment Toward the NGSS so Positive?
The sentiment ratio (the ratio of negative to positive posts) of 0.11 for posts about the NGSS contrasts starkly with the sentiment ratio of 3.66 found for the CCSS-related tweets analyzed by Wang and Fikis (2019). That sentiment ratio indicates that for every 100 positive posts about the CCSS, 366 negative tweets were posted (while for every 100 positive posts about the NGSS, 11 negative tweets were posted). Comparing sentiment ratios, posts about the NGSS were—overall—33 times more positive than those about the CCSS. The difference in sentiment about the NGSS and CCSS could indicate that the NGSS is being adopted with a high degree of public support—a rarity for recent, system-wide educational reforms in the United States (Cohen & Mehta, 2017), and could provide a positive signal to NGSS advocates about the reform. Past system-wide reforms that were successful—such as the establishment of elementary and, later, secondary schools in the United States in the 1800s and 1900s, respectively—were associated with broad public support (Cohen & Mehta, 2017). Recently, successful reforms have tended to be narrower in scope (rather than system-wide); Cohen and Mehta (2017) described the Advanced Placement and International Baccalaureate programs within and in many ways set apart from public schools are one such reform that has achieved degrees of success, while the NGSS is system-wide reform that took place in a very similar context as the CCSS reform.
To explain why the NGSS received a rather positive reception, we discuss some of the distinctive features: their timing, timeliness, and strong research base, particularly. First, being aware of the benefit of advancing a nationwide, standards-based reform around the time the CCSS were adopted, NGSS advocates leveraged the immediate trend toward federal (relative to state-level) leadership; thus, the timing of the NGSS was viewed as auspicious, particularly in light of the drawbacks of past reform efforts (Hardy & Campbell, 2020). Thus, the timing of the NGSS was important in that it leveraged the momentum started by efforts around the CCSS, and also because NGSS developers had the benefit of seeing which elements of the CCSS were associated with political resistance.
In addition, NGSS advocates took steps to “uncouple” the elements of the reform that elicited resistance from teachers and the broader public—particularly, elements related to accountability policies (Hardy & Campbell, 2020), those that use student assessment and other sources of data to mandate that teachers (and/or their schools) support students to meet specific standards (Coburn et al., 2016). To do so, NGSS leaders allowed states to adopt—or adapt, using the NGSS and the Framework for K-12 Science Education (National Research Council, 2012)—the standards based on their timeline and plans for how to develop curricula and assessments (Hardy & Campbell, 2020). This extended timeline afforded states concerning adopting and implementing the NGSS contrasts with the timeline surrounding the adoption of the CCSS. Prior research suggests that states that applied for federal grant funding through the Race to the Top program were more likely to adopt these standards, suggesting that states were motivated to adopt the standards to increase their chance of receiving funds during a period of financial hardship for states, perhaps sooner than they might otherwise have done (LaVenia et al., 2015).
Last, leaders of the NGSS developed the standards with the plan to first synthesize and incorporate the latest scientific and science education research findings (NGSS Lead States, 2021a). The result, a consensus report (National Research Council, 2012), provided a foundation for a set of curricular standards—but which was not a set of standards, but, rather, a foundation that also allowed the developers of the NGSS and states to develop their standards to be responsive to stakeholders, especially stakeholders at the state level (Hardy & Campbell, 2020). Also, Hodge et al. (2020) have reported that the research base for the CCSS in English Language Arts and Literacy is not strong. Specifically, around 24% of the publications cited in a key appendix to the CCSS, Research Supporting Key Elements of the Standards “had no discoverable relation to the claim” (p. 85) made in the standards, but were topically related, and 12.4% of the publications cited in the appendix were not related to the claim made in the standards. While not directly related to differences in public support for the standards, these differences may suggest that commissioning a consensus report to synthesize the state of scientific and science education research was a strength of the approach through which the NGSS were developed.
What Explained Differences in Sentiment?
As the NGSS were adopted and implemented, sentiment about them became more positive: nearly 0.10 SD per year from 2010 to 2020. This contrasts with declines (measured through public opinion polls) in support for the CCSS, which was, in 2013, supported by the majority of the general public—and Democrats and Republicans (EducationNext, 2020). For example, from 2013 to 2016, the percentage of the general public that supported the standards decreased from above 60% to around 40%, with stark declines in support from teachers (EducationNext, 2020). This increase in positive sentiment also supports the idea that NGSS may be an example of relatively successful adoption and implementation of educational reform.
We also found that teachers were more positive than nonteachers. One reason for this may be that the NGSS instantiates positive aspects of the CCSS, such as a progressive and ambitious vision for (science) education and the possibility of more easily sharing curricula across states, while not incorporating the negative aspects—particularly those that tied teacher evaluation to student achievement (Coburn et al., 2016). Another possibility is that the NGSS, to this point, have not introduced tensions in the form of asking or requiring changes on the part of practitioners, and some data from a national survey suggests that this may, indeed, be the case (Smith, 2020). Teachers’ positivity is notable given how teachers’ opposition to the CCSS became as those standards were adopted and implemented: A lower percentage of teachers than Democrats and the general public supported the CCSS in all but two years of EducationNext’s (2021) yearly poll.
Users who posted more tweets that included the #NGSSchat hashtag were more positive, even though there were no differences based on whether or not an individual tweet included the #NGSSchat hashtag. It may be unsurprising that users who post more tweets in this community are more positive, as these users may be engaging in conversations around their professional learning and the professional learning of others. In addition, this finding may be anticipated based on the substantial user-level variation in sentiment, but the minimal state-level variation. This relationship was found only for individuals who posted more tweets including #NGSSchat outside of biweekly chats. This may be due to the constructively critical nature of many #NGSSchat chats (Shelton & Ende, 2015), which may be highly engaging—but not, necessarily, positive. In this way, #NGSSchat may have benefits to participants and the wider community implementing the NGSS, but those may not necessarily elide with more positivity, which aligns with research showing that many of the conversations that took place during chats were substantive (Rosenberg, Reid, et al., 2020). The positivity of #NGSSchat participants contrasts with how social media was leveraged to oppose the CCSS: Individuals and interest groups who opposed the CCSS used social media to frame issues in a way that may have had a bearing on support for the CCSS (Daly et al., 2019; Supovitz & Reinkordt, 2017). For instance, Supovitz (2017) suggested that even if social media posts are not necessarily a proxy for the broader conversation about the reform, they may serve as a proxy for other concerns and political beliefs that members of the public have. Indeed, how messages about the NGSS are framed may relate to the sentiment of posts.
Finally, the adoption status of users’ states was not strongly related to the sentiment of posts. This may be due to the limited variation in sentiment between states (estimated to be 0.8%) relative to individual users (20.0%): There is little variation that the adoption status variable could explain.
Methodological Implications for Educational Data Science
Social media is both a new context for the expression of public opinion and sentiment and also a new context that leverages the affordances of big data to generate actionable inferences within an educational data science framework (Fischer et al., 2020; Piety, 2019; Piety et al., 2014; Rosenberg, Lawson, et al., 2020), and this study made some advances in how social media data can be used to understand educational reform efforts. In particular, we elaborated on the use of a tool designed to study social media data, SentiStrength (Thelwall et al., 2010). While Wang and Fikis (2019) modeled sentiment using a binary classification (classifying a post as positive or negative), it is also possible to measure gradations in sentiment, which could for instance, not only negative and positive posts but also those that are slightly negative or positive, or even neutral. In this study, we used a continuous rating generated by SentiStrength. This helped us interpret the findings from the mixed effects models we used: NGSS-related posts were positive, but not overwhelmingly so, which might indicate more than sentiment about the NGSS is not negative, rather than that it is extremely positive, which some may expect in educational contexts.
Another contribution relates to our modeling strategy (i.e., mixed effects models), which is common in the wider educational research discipline but rarely used in social media research. This study shows how advanced statistical methods can be used besides advanced computational and educational data methods. Using mixed effects models not only allowed us to make inferences about why the sentiment of posts differed they also helped us focus our attention on particular sources of variability. Particularly, we first specified a null, or variance components model, which showed that most of the variability in sentiment (20% in the null model) was attributable to individual users—whereas less than 1% was attributable to states: There was little variability between state to be explained by any factor at the state level. This suggests that examining differences in sentiment between states descriptively may misattribute the activity of charismatic individuals to states. In short, were we to only describe sentiment between states, we may have suggested that states drove differences in sentiment, whereas the estimates from the mixed effects model suggested otherwise.
Finally, the use of two data science techniques (i.e., geocoding and supervised machine learning classification methods) helped us achieve a goal that may be possible at a smaller scale but is intractable for a data set with tens of thousands of users: determining the state and professional role of users. Indeed, in our past research, we laboriously manually coded the roles of more than 500 users (Rosenberg, Reid, et al., 2020); even big data often requires extensive human involvement and coding (Wang, 2017). In this study, we showed that it is possible to use limited biographic information with a coding frame for teachers and nonteachers to accurately classify users’ professional roles using supervised machine learning methods. Critically, this coding frame was simpler than the one we used when manually coding individuals’ professional roles: In our initial analyses, we found it challenging to implement supervised algorithms that could reliably distinguish between these different roles, but we were able to reliably distinguish teachers from those in other roles, perhaps because of how teachers consistently identify as teachers in their biographies on Twitter. In short, when accurate classification is a high priority, we showed that more limited coding frames may have satisfactory utility (for a particular question) when the output of such a frame is used in advanced statistical models, and such satisficing may be useful for other educational data science studies.
Limitations
We consider two potential threats to the validity of our findings—both concerning the topic of what sentiment about the NGSS may mean in the context of CCSS-related sentiment. First, a possible response to the claim that the extended timeline for the adoption of the NGSS may have led to stronger public support could be that the same is true, in a sense, for the CCSS: Many states have now adopted standards based on the CCSS but without the name (and the association with accountability standards; McGuinn & Supovitz, 2016). Might it be that the CCSS been adopted and implemented better than public opinion alone would suggest (and in a politically aware way? In sum, the scholarship that details the critical importance of public support for reforms and the importance of attending to and anticipating the political dimensions of reforms suggest that differences in public opinion matter to the success of reforms themselves; Coburn et al., 2016; Cohen & Mehta, 2017; Hardy & Campbell, 2020), whereas recent research on the specific effects of negative posts about the CCSS suggest that the effects were more superficial and limited to the political domain (Daly et al., 2019; Supovitz, 2017). We cannot resolve this debate here but recommend for future research to work to consider the specific mechanisms through which social media–based conversations (and support or opposition to reforms) affect the underlying reform effort.
Another potential threat to the validity of our findings that is endemic to the NGSS concerns how widely known the NGSS are, perhaps due to their status as science education standards. While we collected a large number of tweets, there were around the same number of posts over the nearly 10-year period for which we collected data as there was for one year of CCSS data. Thus, the NGSS may be less well known publicly, or the users tweeting about the NGSS may make up a selective subgroup that may not reflect general public sentiment. This does not necessarily mean that they did not have the risk of becoming politicized (compared with the CCSS), but, simply, that the wider public discourse around the NGSS may have been less influential in their implementation than it was for the CCSS.
This study has a few methodology-related limitations. First, we studied only posts that mentioned the NGSS, though we know that 24 states adopted standards based on the NGSS (or the Framework) under a different, state-specific name; such states may have state-specific hashtags with which stakeholders within states are more familiar; future research may consider examining state-specific variability in how the standards are identified and described within the 24 states that adapted, rather than fully adopted, the standards.
We only studied posts to a single social media platform, Twitter; data from Twitter, historically, has been easier to access than data from other platforms. Examining sentiment through other media—notably Facebook, which now has a program through which researchers can request to access data (CrowdTangle, 2021), may lend insight, especially as different social media platforms can be characterized by different populations of users (Aguilar et al., 2021; Pew Research, 2019). Moreover, it may be worthwhile to calibrate and validate sentiment on social media with public opinion polls (O’Connor et al., 2010), and understanding how aligned these are could inform our and other research.
Finally, both our geocoding and supervised machine learning methods are associated with error; while both were what we considered to be acceptably accurate (for geocoding, accuracy to the state level has been established as being comparable to that from trained human coders; Greenhalgh et al., 2018; for supervised machine learning, an F-score of 0.806), the estimates are associated with a degree of uncertainty, which could bias inferences about their effects. Given the accuracy of these techniques for the purposes for which we employed them, we think this bias is likely small in magnitude.
Recommendations for Future Research
Given the importance of public sentiment for reforms (Cohen & Mehta, 2017; Supovitz et al., 2019), we recommend future educational data science research to carry out public sentiment analysis in real time. This is especially warranted for reforms or initiatives without public opinion polling; while EducationNext’s (2020) yearly polls carry out highly valuable public opinion polling for many educational issues, including public support for the CCSS, they do not for many other topics. Notably, no public opinion polling to our knowledge has asked about support for the NGSS—and the NGSS is not the only large-scale reform about which the advocates and leaders of reforms could be better informed (see, for instance, reforms around Social Studies curriculum standards; National Council for the Social Studies, 2021).
Another recommendation relates to differences in perspectives about the NGSS—and what standards teachers and schools are using—across states. While our study showed minimal variability across states, the findings from the data collected in the AIRS (Doan et al., 2020) demonstrates that many teachers may see themselves as teaching the NGSS, even if they are in a state that neither adopted nor adapted their standards based on the NGSS. While not explicitly related to public support for the NGSS, what standards teachers see themselves and their school as teaching may have a strong bearing on their support for the reform. What standards teachers see their school (and themselves) teaching could have a bearing on issues such as what curricular resources and professional development opportunities teachers seek out. This relates to a more general recommendation: as Hardy and Campbell (2020) point out, “relatively little literature relates to the broader politics and policy conditions surrounding the development of and support for the NGSS” (p. 484). Indeed, to our knowledge, there is no research describing how states that adopted standards based on the NGSS did so (or were supported to do so).
Like differences in public sentiment, the differences in educational researchers’ attention about the NGSS is different from that about the CCSS, which has been the subject of extensive policy-related research (see Polikoff, 2017, for an overview of one special issue). In short, we recommend that policy and science education researchers consider the policy context of what may be a successful system-wide reform associated with broad public support. Doing so could help science education scholars avoid “learning and relearning the same lessons over and over again” (Coburn et al., p. 246) for implementing educational reforms and to make the success of reforms like the NGSS more likely to be successful and to improve student learning.
Supplemental Material
sj-docx-1-ero-10.1177_23328584211024261 – Supplemental material for Understanding Public Sentiment About Educational Reforms: The Next Generation Science Standards on Twitter
Supplemental material, sj-docx-1-ero-10.1177_23328584211024261 for Understanding Public Sentiment About Educational Reforms: The Next Generation Science Standards on Twitter by Joshua M. Rosenberg, Conrad Borchers, Elizabeth B. Dyer, Daniel Anderson and Christian Fischer in AERA Open
Supplemental Material
sj-docx-2-ero-10.1177_23328584211024261 – Supplemental material for Understanding Public Sentiment About Educational Reforms: The Next Generation Science Standards on Twitter
Supplemental material, sj-docx-2-ero-10.1177_23328584211024261 for Understanding Public Sentiment About Educational Reforms: The Next Generation Science Standards on Twitter by Joshua M. Rosenberg, Conrad Borchers, Elizabeth B. Dyer, Daniel Anderson and Christian Fischer in AERA Open
Supplemental Material
sj-docx-3-ero-10.1177_23328584211024261 – Supplemental material for Understanding Public Sentiment About Educational Reforms: The Next Generation Science Standards on Twitter
Supplemental material, sj-docx-3-ero-10.1177_23328584211024261 for Understanding Public Sentiment About Educational Reforms: The Next Generation Science Standards on Twitter by Joshua M. Rosenberg, Conrad Borchers, Elizabeth B. Dyer, Daniel Anderson and Christian Fischer in AERA Open
Supplemental Material
sj-docx-4-ero-10.1177_23328584211024261 – Supplemental material for Understanding Public Sentiment About Educational Reforms: The Next Generation Science Standards on Twitter
Supplemental material, sj-docx-4-ero-10.1177_23328584211024261 for Understanding Public Sentiment About Educational Reforms: The Next Generation Science Standards on Twitter by Joshua M. Rosenberg, Conrad Borchers, Elizabeth B. Dyer, Daniel Anderson and Christian Fischer in AERA Open
Footnotes
Authors’ Note
Analytic code to reproduce this analysis can be accessed on GitHub at https://github.com/jrosen48/ngsschat-sentiment. Because of the difficulty of adequately anonymizing the data and ethical concerns around publicly sharing the social media data used in this study (Fiesler & Proferes, 2018; Greenhalgh et al., 2020), data can be requested at ![]() . Thank you to the editors and anonymous reviewers for their incisive and helpful feedback on this article. This article was made open access with support from the University of Tennessee, Knoxville libraries Open Publishing Support Fund.
. Thank you to the editors and anonymous reviewers for their incisive and helpful feedback on this article. This article was made open access with support from the University of Tennessee, Knoxville libraries Open Publishing Support Fund.
Notes
Authors
JOSHUA M. ROSENBERG is an assistant professor of STEM Education at the University of Tennessee, Knoxville. Dr. Rosenberg’s interests are at the intersection of data science and education, including the application of data science methods in educational research contexts, and supporting K–12 students to work with data as a part of their learning.
CONRAD BORCHERS is an undergraduate student at the University of Tübingen. Mr. Borchers’s interests are in how natural language processing, social network analysis, and data science can inform learning.
ELIZABETH B. DYER is an assistant director of the Tennessee STEM Education Center. Dr. Dyer’s research interests include understanding how mathematics and science teacher learning and development lead to changes in teachers’ classroom practices, as well as how to design systems that support professional learning in schools.
DANIEL ANDERSON is a research assistant professor in the College of Education at the University of Oregon. Dr. Anderson’s research lies at the intersection of measurement and large-scale policy, with a specific focus on educational inequities.
CHRISTIAN FISCHER is an assistant professor of educational effectiveness at the Hector Research Institute of Education Sciences and Psychology at the University of Tübingen in Germany and a research affiliate with the UC Irvine School of Education. Dr. Fischer’s research is guided by the mission to improve teaching and learning processes in STEM education, with a particular focus on digital technologies.
References
Supplementary Material
Please find the following supplemental material available below.
For Open Access articles published under a Creative Commons License, all supplemental material carries the same license as the article it is associated with.
For non-Open Access articles published, all supplemental material carries a non-exclusive license, and permission requests for re-use of supplemental material or any part of supplemental material shall be sent directly to the copyright owner as specified in the copyright notice associated with the article.