
Abstract
Polling data routinely indicate broad support for the concept of diverse schools, but integration initiatives—both racial and socioeconomic—regularly encounter significant opposition. We leverage a nationally representative survey experiment to provide novel evidence on public support for integration initiatives. Specifically, we present respondents with a hypothetical referendum where we provide information on two policy options for assigning students to schools: (1) a residence-based assignment option and (2) an option designed to achieve stated racial/ethnic or socioeconomic diversity targets, with respondents randomly assigned to the racial/ethnic or socioeconomic diversity option. After calculating public support and average willingness-to-pay, our results demonstrate a clear plurality of the public preferring residence-based assignment to the racial diversity initiative, but a near-even split in support for residence-based assignment and the socioeconomic integration initiative. Moreover, we find that the decline in support for race-based integration, relative to the socioeconomic diversity initiative, is entirely attributable to White and Republican respondents.
Introduction
The Supreme Court’s 1954 ruling in Brown v. Board of Education sparked a series of initiatives to integrate schools on the basis of race. In spite of polling data routinely indicating strong public support for the concept of diverse schools (Frankenberg & Jacobsen, 2011; Hochschild & Scott, 1998; Page & Shapiro, 1992; Smith, 1982), race-based integration initiatives consistently encounter significant opposition, suggesting that the public is more supportive of racially diverse schools in theory than in practice. As a result of the political controversy facing race-based integration, the policy conversation has shifted toward initiatives that achieve integration on the basis of socioeconomic status (SES). Supporters of SES-based integration often tout these initiatives as providing many of the same benefits as race-based integration, but with the added draw of being politically feasible (Kahlenberg, 2012). However, only about 80 school districts—out of more than 13,000 nationwide—consider socioeconomic status when assigning students to schools (Potter et al., 2016). And some districts that have pursued SES-based integration initiatives experienced public blowback resembling that typically targeted toward race-based initiatives (Parcel & Taylor, 2015). This suggests a dynamic similar to the one that played out with race-based integration, one where the public supports socioeconomic diversity in theory, but dislikes the policies required to achieve meaningful integration. Such a dynamic suggests that SES-based integration initiatives could be consigned to similar political fate as the race-based initiatives that preceded them.
In this article, we draw on a nationally representative survey experiment to provide evidence on public support for integration initiatives, both race-based and SES-based. We build on prior survey-based work assessing public support for integration in four main ways. First, instead of inquiring about respondents’ support for diversity in general, we walk respondents through an in-depth exercise that describes two concrete policy options districts have for assigning students to schools. The first option only considers the location of a student’s residence in determining school assignment while the second option not only considers residential location but also ensures that each school achieves a targeted level of diversity. In line with how officials might pitch the different school assignment options, we present respondents with information on the likely impact of residence-based assignment and the diversity-enhancing initiative on several factors important to families, including student learning, proximity to school, certainty of schooling assignments, and others. Then, we ask respondents to indicate how important each factor should be in determining school assignment and ask respondents to vote in an advisory referendum on the issue. Specifically, we ask whether they would vote for the pure residence-based assignment policy or the policy that works to achieve stated diversity targets—we also provide respondents with the option of abstaining.
Second, whereas most prior work considers public support for either race-based integration or SES-based integration, we designed our survey exercise in a manner that allows us to simultaneously assess public support for each of these two types of integration. We do so by randomly assigning respondents to one of two tracks that walk respondents through slightly different versions of the exercise described above. The first track, which we refer to as the race track, defines districts’ two policy options for assigning students to schools as (1) a pure residence-based assignment policy and (2) a policy designed to achieve roughly equal levels of racial and ethnic diversity at schools across the district. The second track, which we refer to as the SES track, differs from the race track only in that the district’s second option is defined as a policy designed to achieve roughly equal levels of socioeconomic diversity—as opposed to racial/ethnic diversity—at schools across the district.
Third, we conduct analyses providing insight into potential heterogeneity in support for race-based and SES-based integration initiatives. In particular, we examine whether the degree of support for each type of integration varies across racial and ethnic groups, as well as across respondents who identify with different political parties. In addition to providing important information on their own, these analyses are directly relevant for gauging the political prospects of different forms of integration in different demographic and political contexts.
Fourth, along with asking respondents to indicate their preferred assignment option, we also inquire whether respondents would be willing to pay increased property taxes in order to implement their preferred assignment policy. For each respondent, we randomly draw the proposed payment amount from a uniform distribution that ranges from $1 to $1,200. Drawing on the technique proposed by Carlson et al. (2016), we use these data to estimate average willingness-to-pay (WTP) for each policy alternative, as well as the “net” WTP for one policy alternative relative to the other. Such an analysis provides something of a proof of concept for generating an economic measure of individuals’ school assignment policy preferences, a measure that complements the politically oriented preference measure recovered from individuals’ advisory referendum vote.
Results from the advisory referendum vote indicate that respondents preferred a pure residence-based assignment system to one designed to achieve racial/ethnic diversity targets across schools in a district. Among respondents randomly assigned to the race track, 46.1% voted for the pure residence-based assignment policy while 35.8% voted for the race-based integration policy. Respondents assigned to the SES track, however, were somewhat more supportive of integration, with 42.6% voting for a pure residence-based assignment policy and 41.3% of respondents voting for the assignment policy designed to achieve socioeconomic balance across schools. Considered together, these results indicate that efforts designed to integrate on the basis of SES, as opposed to race, increase public support for integration initiatives by approximately 5 percentage points.
Importantly, we also provide evidence of significant heterogeneity in support for integration by both race and political party. With respect to race, the reduced levels of support for the race-based integration initiative is driven entirely by White respondents, who support the SES-based integration initiative at a 40.9% clip but only back the race-based initiative at a 34.4% rate. Non-White respondents exhibit no significant differences in their support of the race- and SES-based integration initiatives. Regarding political party, 36.8% of Republican respondents in the SES track prefer the integration initiative to the pure residence-based assignment policy, but only 24.3% of Republican respondents assigned to the race track prefer the integration option. Democratic and third-party respondents are equally supportive of the race- and SES-based integration initiatives. Together, these results provide unique insights into public support for integration initiatives and speak directly to the political feasibility of efforts to diversify schools across the nation.
Our WTP estimates generally reflect the advisory referendum results, particularly, for respondents assigned to the race track. Individuals in this track exhibited a median WTP of approximately $19 for the pure residence-based assignment system, compared with about $6 for the school assignment policy designed to achieve a degree of racial/ethnic balance across schools. Together, these results imply a “net” annual WTP of about $13 for a school assignment policy based completely on residential location. Interestingly, for individuals assigned to the SES track, there is a bit of daylight between the advisory referendum results and the WTP estimates, with median WTP for the school assignment policy designed to achieve socioeconomic balance ($11) being greater than median WTP for pure residence-based school assignments ($8). These findings provide further evidence that the public is more supportive of school diversity on the basis of SES than race.
Race, Socioeconomic Status, and Public Support for School Integration
Although meaningful change was slow to come to many states after the Supreme Court’s 1954 Brown decision, the eventual enforcement of the court order generated substantial declines in racial segregation throughout the late-1960s, 1970s, and into the 1980s, with the most significant declines concentrated in the South (Reardon & Owens, 2014; Welch & Light, 1987). Since that time, the release of many districts from desegregation orders contributed to a degree of resegregation across the South (Reardon et al., 2012), although there is evidence that some of those increases were reversed in the most recent decade (Stroub & Richards, 2013).
Rigorous studies routinely find racial desegregation to positively affect student outcomes. For example, desegregation has been linked to improved Black educational achievement (Billings et al., 2014; Card & Rothstein, 2007; Cook, 2018; Mickelson et al., 2013), health outcomes (Johnson, 2011), labor market earnings (Ashenfelter et al., 2006), and a decrease in the probability of criminalization and poverty (Bergman, 2016; Johnson, 2011; Lafree & Arum, 2006; Weiner et al., 2009). Moreover, most of this work finds desegregation to have either no effects (Johnson, 2011) or small positive effects (Weiner et al., 2009) on White students’ outcomes.
Given the wide range of material benefits brought about by racial desegregation, we might expect that integration policies would elicit broad public support. And they do in cases where pollsters ask the public about their broad views on integration and diversity. For example, in a 2007 NORC poll, 95% of respondents supported Black and White students attending the same school (Frankenberg & Jacobsen, 2011). Similarly, results from the 2017 Phi Delta Kappan poll indicate that 70% of respondents would prefer their child to attend a racially diverse school and approximately 50% of respondents thought that racial diversity would improve the learning environment. These results come with a few caveats: (1) support for racial integration policies is higher in districts with experiences with desegregation (Orfield, 1995; Orfield & Frankenberg, 2013) and (2) parents prefer diversity as long as their children are in the racial/ethnic majority (Denice & Gross, 2016; Glazerman & Dotter, 2017; Hastings et al., 2006). Where we see support for racial integration typically dwindle, often substantially, is in the results of polls that inquire about specific policies and trade-offs required to achieve a meaningful level of diversity. For example, a large majority of the public—and Whites in particular—regularly opposes the use of busing to integrate schools (Hochschild & Scott, 1998; Page & Shapiro, 1992). And in the same 2017 PDK poll where 70% of respondents preferred their child attend a diverse school, only 25% indicated that they would vote to accept a longer commute to achieve this diversity.
Considered together, these polling results suggest that the public is more supportive of racial integration in theory than in practice. Such a conclusion is further supported by the routine political opposition that race-based integration efforts have faced over the years. The aforementioned initiatives to integrate schools via mandatory busing experienced fierce public blowback—almost exclusively from White residents—in nearly every district where the approach was implemented. Even efforts to achieve racial diversity with arguably less intrusive practices, such as voluntary school choice programs or redrawn attendance boundaries, routinely spark significant controversy (e.g., Parcel & Taylor 2015). Public opposition to race-based integration initiatives is perhaps best distilled by the fact that almost no district released from a mandatory desegregation order has elected to subsequently pursue voluntary desegregation.
This political opposition to racial integration efforts has been accompanied by a series of legal challenges, with the 2007 Supreme Court decisions in Parents Involved in Community Schools v. Seattle School District No. 1 and Meredith v. Jefferson County Board of Education holding unconstitutional the consideration of individual students’ race/ethnicity in the process of assigning students to schools. These political and legal factors pose significant hurdles for racial integration efforts and put supporters of these policies in something of a bind. Rather than abandon integration efforts completely, however, supporters have worked to redirect the focus toward initiatives that promote socioeconomic integration (e.g., Kahlenberg, 2012; Potter et al., 2016). Proponents of these initiatives often portray them as politically feasible alternatives to race-based integration that offer many of the same benefits. However, the evidence base around these initiatives is insufficiently developed to support strong claims about either their political feasibility or the alignment of their outcomes with those of race-based integration efforts. Indeed, in the literature that does exist, there are examples of SES integration initiatives both encountering significant political opposition (Parcel & Taylor, 2015) and having difficulty achieving the integration outcomes that supporters tout (Carlson et al., 2020; Ellison & Pathak, 2016; Reardon & Rhodes, 2011). Together, this work raises doubts as to whether the prospects for socioeconomic integration initiatives are as rosy as supporters portray.
Measuring Public Support for School Integration Initiatives
Prior work assessing public support for integration often does so using broad questions that fail to address relevant context or trade-offs. Such an approach typically results in a large majority of the public professing their support for integration and diversity. However, the strong support for integration initiatives indicated by polling results conflicts with the significant opposition encountered by such policies when districts work to implement them (e.g., Parcel & Taylor, 2015). To eliminate this disconnect, our approach to measuring public support for school integration employs several techniques from the literature on best practices for minimizing hypotheticality in a stated preference setting (Li et al., 2004). We walk respondents through an in-depth exercise where we describe two concrete policy options districts have for assigning students to schools, one of which achieves a targeted level of diversity at each school and the other of which does not. We provide respondents with information about how each option would likely impact several factors important to families, including student learning, proximity to school, certainty of schooling assignments, and others. Finally, we structure the elicitation of respondents’ support for integration in a referendum format—we ask them which of the two options for assigning students to schools they would vote for in an advisory referendum.
The first step in our exercise involved randomly assigning respondents to one of two tracks, which we refer to as the “race track” and the “SES track.” The race track defines districts’ two policy options for assigning students to schools as (1) a pure residence-based assignment policy and (2) a policy designed to achieve roughly equal levels of racial and ethnic diversity at schools across the district. The SES track differs from the race track in that it defines the second policy option as one designed to achieve roughly equal levels of socioeconomic diversity—as opposed to racial/ethnic diversity—at schools across the district. Importantly, respondents are unaware that they were randomly assigned to a track, or even that the survey contained two tracks—they only experienced their assigned track.
For each track, we began the exercise by situating it within a study of policies that school districts use to assign students to schools. Specifically, we presented respondents with the following text: This portion of the survey is part of a national study of policies that school districts use to assign students to schools within the district. School boards around the country are currently considering different approaches to making school assignments. School board members will consider many factors when determining which assignment policy they will use in their district. One factor they will consider is whether a particular assignment policy is personally worthwhile to people like you.
We then proceeded to randomly assign respondents to the race or SES track. We followed up the background information by introducing and describing the two school assignment policy options noted above. Specifically, we presented respondents with the following text
1
: Many school boards across the country are currently considering two options—referred to as “Option A and Option B”—for assigning students to schools within their district. The two options for assigning students to schools would each affect several aspects of students’ lives. For each option, some of the effects will be positive, while others will be negative. Such tradeoffs are unfortunate, but must realistically be considered when choosing student assignment policies.
In the next stage of the exercise we provided respondents with information about the likely impact of each of the two options on five factors important to families, including classmate characteristics, proximity to school, student learning, school test scores, and certainty of schooling assignments. Our choice of these factors was informed by the literature on parental schooling preferences, particularly the set of studies that work to identify the factors most salient to parents as they set out to select a school for their child (e.g., Denice & Gross 2016; Glazerman & Dotter 2017; Lincove et al., 2018; Schneider & Buckley, 2002, 2007). Table 1 summarizes the information we present to respondents on each of the five factors that would be affected by the two policies for assigning students to schools.
Likely Impacts of Residential Assignment (Option A) and Integration Policy (Option B) on Schooling Factors Important to Families

Note. The text in boldface reflects the differences in wording between the race and SES tracks. SES = Socioeconomic status.
The information regarding certainty of schooling assignments warrants a brief explanation, as this factor has received less attention in the literature than the other four considerations. Our decision to include this factor in the exercise is motivated by the set of contemporary integration initiatives that use annual schooling reassignments as one strategy for achieving their diversity goals. Perhaps the most well-known of these initiatives is the one operated by the Wake County Public School System in Raleigh, NC throughout the 1990s and 2000s (Carlson et al., 2020; Parcel & Taylor, 2015). To achieve its integration aims—and maintain desired diversity levels over time—each year the district changed the schooling assignments of 5% to 10% of its students. This created an environment characterized by recurring uncertainty, where families would learn their schooling assignments for a given year but then wonder whether their assignments would remain unchanged for the following year (Parcel & Taylor, 2015). In our survey, we did not specify how long the uncertainty would last, which may have influenced respondent ratings of the importance of uncertainty in school assignment.
After presenting the information on how the assignment policies affect a given factor, we asked the respondent how important they think that factor should be in determining how students are assigned to schools. For example, in the context of classmate characteristics, we ask: On a scale from zero to ten, where zero means not at all important and ten means extremely important, how important should classmate characteristics be in reaching a decision about how to assign students to schools?
Figure 1 illustrates—separately for the race and SES tracks—the mean level of importance for each of the five factors. The figure makes clear that there is no difference between the two tracks in respondents’ views about the importance of each factor in determining school assignment policy. Student learning and proximity to school are the two most important considerations, with average school test scores and classmate characteristics less important. Although we cannot rule out the results reflecting some ordering effects—we did not randomize the order in which we presented respondents with information about each factor—they are broadly in line with the parental schooling preferences literature noted above. We do note, however, that the relatively low stated importance of classmate characteristics likely reflects a degree of social desirability bias. Prior work provides clear evidence that parents place significant weight on classmate characteristics, but are hesitant to admit that on surveys (e.g., Schneider & Buckley, 2007).

Mean importance level of factors considered in determining policy for assigning students to school
We close the exercise by asking respondents whether they would prefer Option A or Option B if they had an opportunity to vote in an advisory referendum on the issue: Think about a situation in which you had an opportunity to vote for
Along with response categories for Options A and B, we also allowed respondents to indicate that they would choose to abstain from voting in the advisory referendum. Then, for those respondents who expressed a preference in the advisory referendum (i.e., those who did not abstain), we present them with the following item—we use responses to this item as the basis for estimating WTP: You selected [“ Would you vote for [preferred option at no cost: “ 0—No 1—Yes 2—Not sure
In this item, each respondent sees a proposed payment amount that we randomly draw from a uniform distribution ranging from $1 to $1,200. Drawing the proposed payment amounts from a continuous distribution has potential efficiency benefits for estimating WTP, relative to drawing the proposed payment amounts from a set of discrete values (Cameron, 1991; Lewbel et al., 2011). For respondents who select Yes or No to the above item, we subsequently ask them how certain they are that they would vote in the manner they indicated. We elicit this information using a 11-point scale that ranges from 0, not at all certain, to 10, completely certain. Next we describe in detail how we use the data collected through these items to construct our WTP estimates.
Considered together, the features of the exercise—specifying two concrete policy alternatives, describing how each alternative would affect families, eliciting preferences in a referendum format, inquiring whether respondents would be willing to pay increased taxes to implement their preferred option, and gauging their certainty in that preference—provides a degree of context and specificity lacking in most prior work. As such, this exercise has the potential to produce a set of stated preference results that better reflect the reality of school integration initiatives, one where these policies routinely encounter significant public opposition. It also allows us to estimate WTP for these initiatives, an approach to measuring public preferences rarely applied in the education policy realm, but one with the potential to provide another dimension of insight into public support for school integration efforts.
We administered this exercise to a sample of 2,850 adults as part of an online survey conducted through Qualtrics LLC, a leading survey administration company, in November 2017. 2 We apply standard poststratification weights to achieve representativeness of our sample with respect to the demographic characteristics of the population of U.S. adults, as measured by the U.S. Census (see online Supplemental Appendix B for details on the weighting methodology).
Table 2 presents mean characteristics for the full sample, as well as separately for those assigned to the race and SES tracks. The final column presents the difference in means for individuals assigned to the two tracks and indicates whether the difference is statistically significant. The lack of significant differences is consistent with successful randomization. 3
Sample Means, by Track
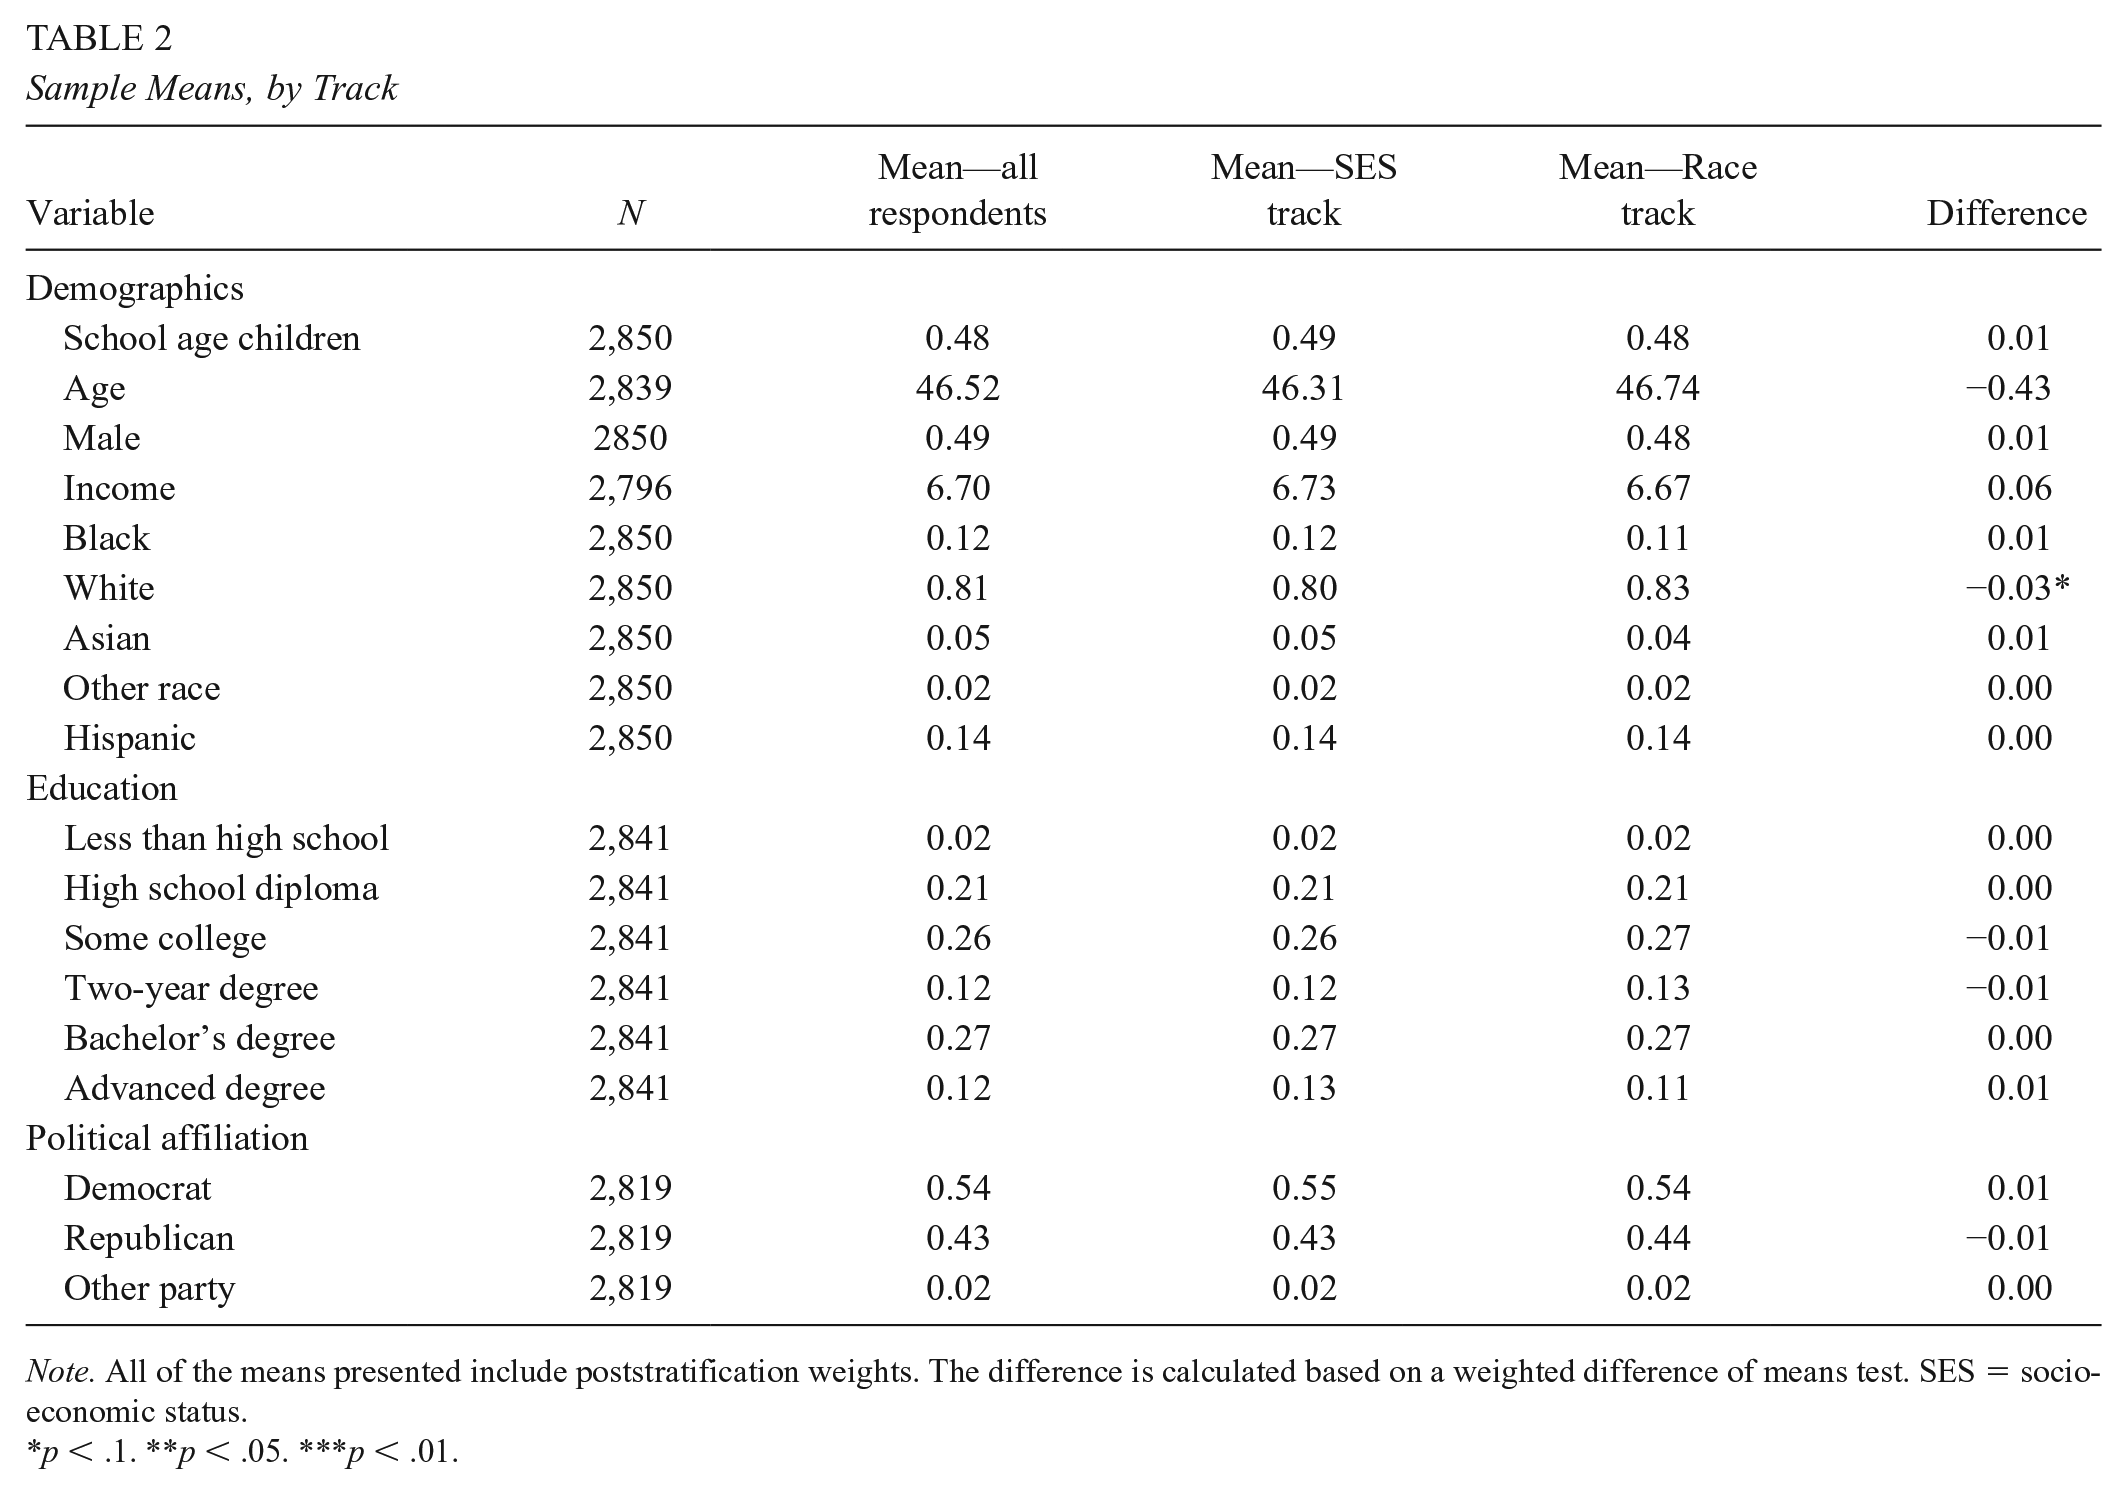
Note. All of the means presented include poststratification weights. The difference is calculated based on a weighted difference of means test. SES = socioeconomic status.
p < .1. **p < .05. ***p < .01.
Analysis of Public Support for School Integration Initiatives
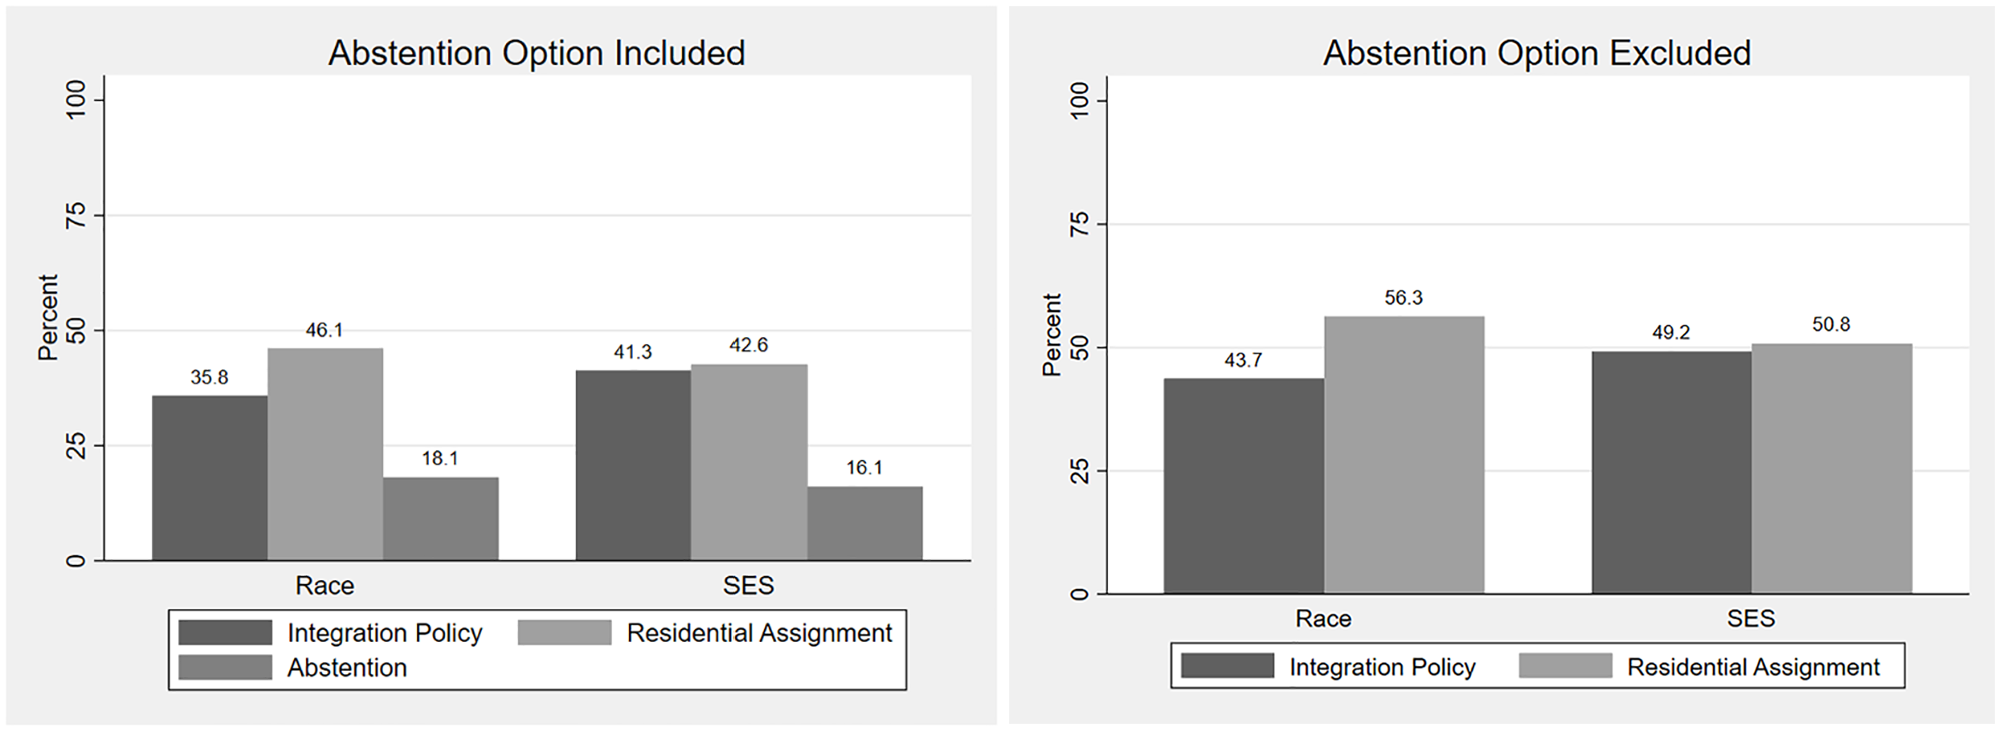
We begin our analysis by plotting, by track, the percentage of respondents who selected each option in the advisory referendum. The left-hand panel of Figure 2 plots the percentage of respondents indicating they would vote for the residence-based school assignment policy, the percentage indicating they would vote for the diversity-enhancing assignment option, and the percentage indicating they would abstain from voting in the referendum. The right-hand panel presents the percentage of respondents preferring each policy option among those who voted in the advisory referendum—it excludes those who would abstain from the vote.
Percentage of respondents voting for school assignment options, by inclusion of abstention option and track.
The left-hand panel of Figure 2 shows that, across both the race and SES tracks, a plurality of respondents preferred a pure residence-based school assignment policy, relative to one designed to achieve stated diversity targets. In the race track, 46.1% of respondents would vote for the residence-based assignment policy while 35.8% indicated a preference for the integration initiative—18.1% of respondents indicated they would abstain from the referendum. The disparity in the percentage of respondents preferring each option for assigning students to schools is not as large in the SES track, where 42.6% would vote for the neighborhood-based assignment policy, 41.3% would vote for the integration initiative, and 16.1% of respondents would abstain. The right-hand panel of Figure 2 simply scales the percentage of respondents preferring each policy option by the proportion of respondents who would vote for either option (i.e., who would not abstain from the referendum), thereby providing insight into the results of a hypothetical referendum. The results for the race track show that the residence-based assignment policy would defeat the integration initiative by a margin of 56.3% to 43.7%—this difference is statistically significant. The results for the SES track would be much closer, with the data indicating that the residence-based assignment policy would narrowly defeat the integration initiative by a 50.8 to 49.2% margin, although a significance test cannot reject the null that the two proportions are equal.
Figure 2 makes clear that, in both the race track and the SES track, a greater percentage of respondents prefer a pure neighborhood-based school assignment policy to one designed to achieve stated diversity targets. However, Figure 2 also demonstrates that the SES-based integration initiative draws more support than its race-based counterpart. In particular, the figure illustrates that 41.3% of respondents assigned to the SES track support the diversity-enhancing school assignment policy, compared with just 35.8% of respondents assigned to the race track—this 5.5 percentage point difference is statistically significant. 4 This finding provides evidence in support of proponents’ claims that SES-based integration efforts are more politically palatable than race-based alternatives, but we again highlight that neither form of integration commands majority support among the public.
To gain insight into the source of the enhanced support for SES-based integration, we analyzed how support for each policy varied across individuals identifying with different political parties, races, and ethnicities. Figure 3 presents the levels of support for the race and SES integration initiatives for each group we analyze. The first panel of Figure 3 demonstrates that Democrats and those who identify with a third-party support the race and SES integration initiatives at indistinguishable rates—44.5% of these respondents support the race-based initiative and 44.6% support the SES-based integration option. 5 Republicans, on the other hand, exhibit a substantial difference in support between the race and SES integration initiatives. While 36.8% of Republicans assigned to the SES track support the integration initiative, only 24.3% of Republicans support the integration initiative in the race track—a difference of more than 12 percentage points. Together, these results demonstrate that, among political partisans, the greater degree of support for SES-based integration is driven entirely by Republicans.

Average percentage of respondents voting for integration option in referendum exercise, by party, race, and ethnicity.
The second panel of Figure 3 presents predicted levels of support for the race- and SES-based integration initiatives among White and non-White respondents. The figure illustrates that non-White respondents exhibit near-identical levels of support for race-based and SES-based integration—the respective support levels are 42.6% and 42.8%. White respondents, on the other hand, exhibit significantly greater levels of support for the SES-based integration assignment option than for the race-based option. Only 34.4% of White respondents assigned to the race track support the diversity-enhancing assignment policy, compared with 40.9% of White respondents in the SES track supporting the integration initiative. These results make clear that the uptick in support for SES-based integration, relative to the race-based initiative, is attributable to changing preferences among White respondents.
Finally, the third panel of Figure 3 demonstrates no meaningful difference in support for the race- and SES-based integration initiatives among Hispanic respondents, but a difference among non-Hispanic respondents that broadly mirrors the results for White respondents described above. Together, Figure 3 illustrates that the increased support for SES-based integration, relative to an assignment policy designed to achieve a degree of racial balance, is entirely driven by specific respondent subgroups, namely Republicans and White respondents.
Estimating Willingness to Pay for School Assignment Policies
Our analyses above provide insight into respondents’ political preferences over school assignment policy. In particular, the results we present in Figures 2 and 3 provide information on the potential results of a referendum over whether to assign students to schools purely on the basis of residential location, or whether those assignments should also strive to achieve a degree of balance—either racial or socioeconomic—across schools. As described above, though, our elicitation exercise also includes a valuation component, asking respondents whether they would be willing to pay a randomly selected amount in additional taxes each year—between $1 and $1,200—in order to implement their preferred assignment option. This valuation question elicits data that serve as the basis for estimating WTP for each of the school assignment policies. In doing so, we provide a “proof of concept” for generating a measure of economic preferences rarely seen in the education policy literature, but that can provide a nice complement to our politically oriented preference measures described above. We describe the challenges and limitations we faced when designing and executing this analysis in online Supplemental Appendix C.
We begin by presenting, by track, the number of respondents who stated that they would pay the randomly selected amount of additional annual taxes to implement their preferred assignment policy (see Table 3). The left-hand column of Table 3 illustrates that, among respondents assigned to the race track, about 36% would vote for the diversity-enhancing assignment policy in the advisory referendum. Of this 36%, about 45% stated that they would pay the randomly selected tax amount whereas 30% indicated that they would not pay the additional amount—about a quarter of respondents were unsure if they would pay. Of the 46% of respondents who preferred the residence-based assignment policy in the advisory referendum, about 38% and 34% would and would not pay the randomly selected amount of additional taxes, respectively, with 28% unsure about their vote. The results for respondents assigned to the SES track are broadly similar to those for the race track, with approximately equal percentages of respondents preferring the residence-based assignment policy willing to pay (36%) and not pay (37%) additional taxes to implement that option. Among the 41% of respondents who prefer the diversity-enhancing policy, however, 41% would pay the randomly selected tax amount whereas 32% would not. Together, the results in Table 3 provide an overview of the data that underlie our estimates of WTP. We provide additional detail on our data, specifically the observable predictors of both respondents’ decisions to vote or abstain from the referendum and their preferred assignment option, in online Supplemental Appendix C.
Voting Results for School Assignment Policy Preferences, by Treatment

Note. This table presents tabulated voting results and survey-weighted sample percentages from the Education Policy survey. “Vote for diversity-enhancing assignment policy,” “Vote for residence-based assignment policy,” and “Would not vote” present the number and percentage of respondents who, at $0 cost, selected this as their preferred option for school assignment policy. These values may not sum to 100% due to rounding. “Would pay >$0 payment amount” is the number and percentage of respondents who indicated that they would be willing to pay a nonzero randomly assigned bid amount for their preferred option. “Would not pay >$0 payment amount” is the number and percentage of respondents who would not be willing to pay a randomly assigned nonzero bid amount for their preferred option. “Not sure if would pay >$0 payment amount” is the number and percentage of respondents who are not sure if they are willing to pay a randomly assigned nonzero bid amount for their preferred option.
We commence our WTP estimation by estimating a series of regressions where we specify the outcome as an indicator for respondents stating they would be willing to pay the randomly selected amount of additional taxes to implement their preferred school assignment policy. More formally, we estimate:

where the probability of observing vote choice C—indicating that respondent i would pay additional taxes for their preferred policy option—is a function of the natural log of the randomly assigned tax payment amount P, a vector of demographic characteristics, X, and respondents’ views of the importance of the different factors affected by school assignment policy, which we denote with S. To reduce hypothetical bias, we follow the recommendations of Li et al. (2009) and Loomis and Ekstrand (1998) and only assign a “Yes” (C = 1) response to respondents who selected a certainty level of 8, 9, or 10 when asked how certain they were that they would be willing to pay the additional taxes required to implement their preferred option. We code respondents selecting certainty values 0 to 7 as “No” responses. Although this “Asymmetric Uncertainty Model” is commonly used in the valuation literature, it is not the only possible approach, and it does generate relatively conservative WTP estimates. Thus, we also estimate Equation (1) without any certainty recodes, assigning a “Yes” (C = 1) response to all respondents who indicated that they would pay additional taxes for their preferred policy option, regardless of the certainty level they select.
In addition to the specification detailed above, we also estimate a variant that omits X and S, only retaining ln(P)—the natural log of the randomly selected amount of additional taxes—on the right-hand side. We estimate these models over four distinct samples of respondents: (1) individuals assigned to the race track who support the diversity-enhancing school assignment policy, (2) individuals assigned to the race track who support the neighborhood-based assignment policy, (3) individuals assigned to the SES track who support the diversity-enhancing school assignment policy, (4) Individuals assigned to the SES track who support the neighborhood-based assignment policy.
We present the results from estimating these models in Table 4. From the standpoint of estimating WTP, the most important takeaway from these results is the significant negative relationship between respondents being willing to pay additional taxes to implement their preferred school assignment option and the randomly selected amount they are asked to pay. Substantively, the results show that the more an individual is asked to pay in additional taxes, the less likely they are to respond that they would pay it. As we describe in more detail below, our estimates of this relationship play a central role in estimating WTP.
Logit Regressions of WTP Response (Yes = 1 or No = 0) for Preferred School Assignment Policy

Note. This table presents results from eight separate logit regressions. The dependent variable is an indicator of support for a respondent’s preferred school assignment policy at the randomly selected tax payment amount (i.e., Yes = 1 or No = 0 response to valuation question). Survey weighted standard errors are in parentheses. WTP = willingness to pay; SES = socioeconomic status.
p < .1. **p < .05. ***p < .01.
After estimating the two specifications of Equation (1)—specifications with and without background covariates—over the four distinct respondent samples, we calculate median WTP for each estimation as

where
The result returned from Equation (2) can be interpreted as average WTP for a given school assignment policy among respondents who indicated that they preferred that policy in the advisory referendum. To recover an estimate that can be interpreted as average WTP among all respondents assigned to the track—including those who preferred the alternative school assignment policy and those who abstained from the advisory referendum—we scale each estimate from Equation (2) by the proportion of respondents in the relevant track who indicated their support for that assignment policy in the advisory referendum. For example, in the race track, we scale the WTP estimate for the diversity-enhancing school assignment policy returned by Equation (2) by the 46.1% of respondents who indicated their support for that option in the advisory referendum.
Separately for each track, we present the median scaled WTP estimates for each of the two assignment policies in Table 5. For each assignment policy, we present WTP estimates from models with and without covariates. Starting with results for individuals assigned to the race track, Table 5 shows that median annual WTP for the diversity-enhancing assignment policy ranges from $2 to $6, depending on the specification. By contrast, estimated WTP for the neighborhood-based assignment policy is significantly higher, in the range of $16 to $19 per year. Online Supplemental Table A3 presents median WTP using the data without any certainty recodes, where individuals who said they would pay additional taxes to implement their preferred option were coded as “Yes” responses, regardless of their level of certainty. Unsurprisingly, the estimates in online Supplemental Appendix Table A3 are substantially larger, in the range of $70 to $80.
Median WTP for School Assignment Policy, by Treatment, Preference for School Assignment Policy, and Model Specification
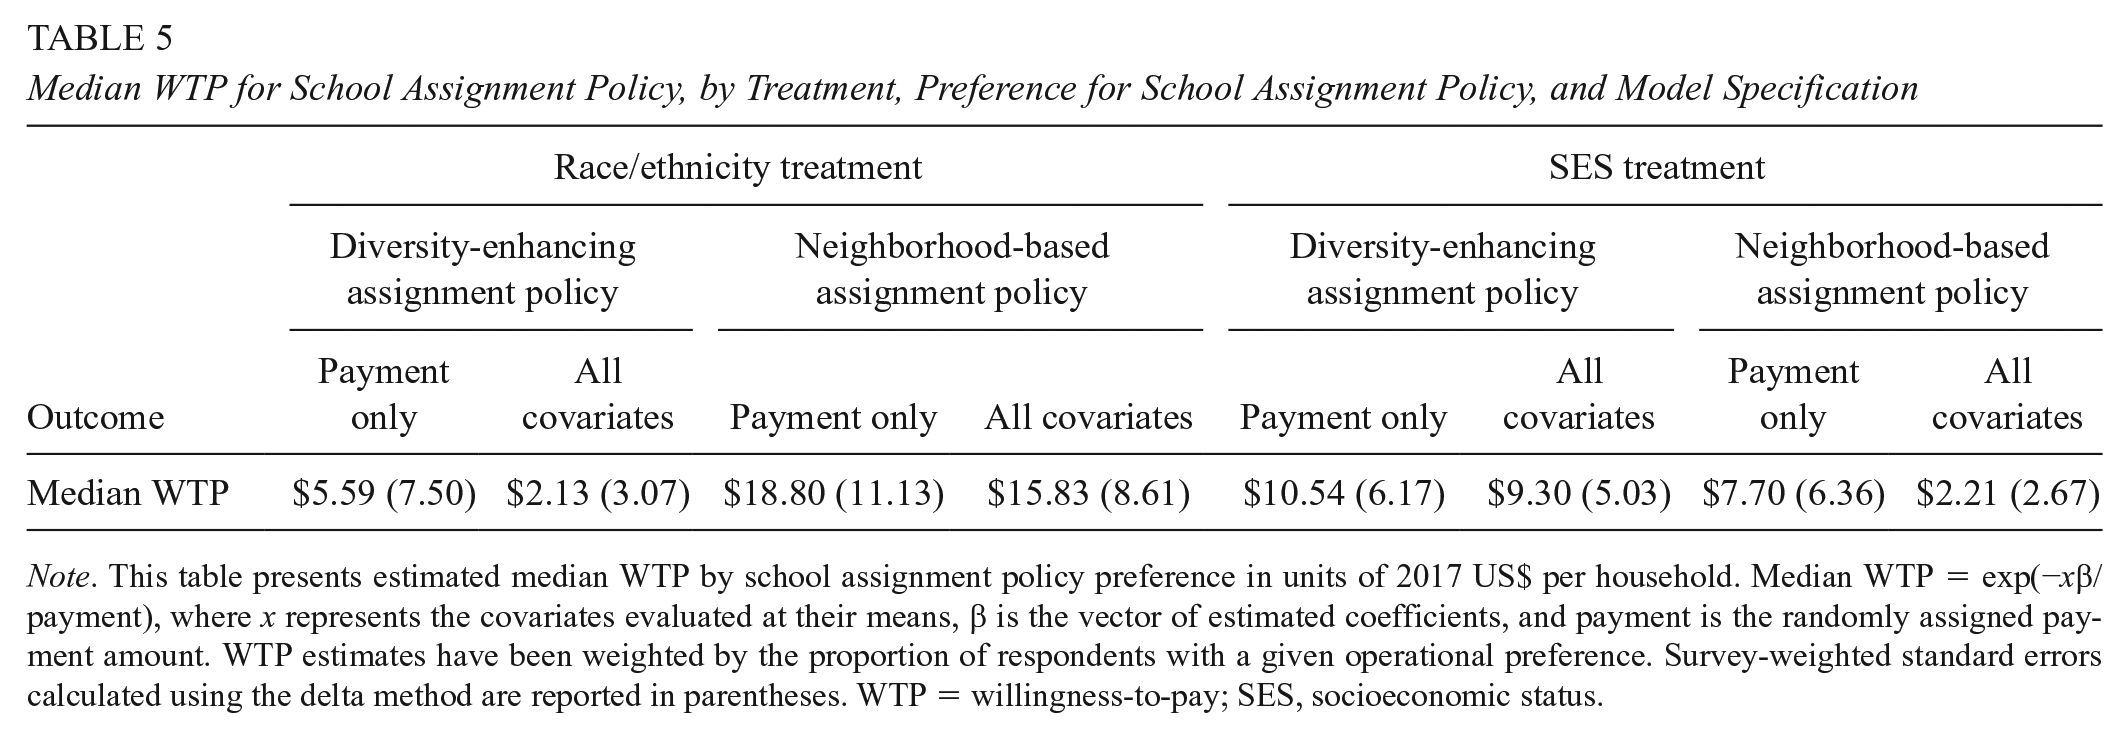
Note. This table presents estimated median WTP by school assignment policy preference in units of 2017 US$ per household. Median WTP = exp(−xβ/payment), where x represents the covariates evaluated at their means, β is the vector of estimated coefficients, and payment is the randomly assigned payment amount. WTP estimates have been weighted by the proportion of respondents with a given operational preference. Survey-weighted standard errors calculated using the delta method are reported in parentheses. WTP = willingness-to-pay; SES, socioeconomic status.
Results for individuals assigned to the SES track paint a somewhat different picture, with estimated WTP for the diversity-enhancing school assignment policy greater than WTP for neighborhood-based schooling assignments. Depending on specification, median annual WTP for the diversity-enhancing assignment policy is $9 to $11 while estimated WTP for the pure neighborhood policy is only $2 to $7. These results differ from the advisory referendum results, where a slight plurality of respondents preferred the neighborhood-based assignment policy. Together, these results illustrate how estimated WTP can provide a nice complement to more conventional survey-based measures of individual policy preferences. Again, online Supplemental Table A3 presents median WTP calculated using the data without any certainty recodes.
As a final step in our WTP analysis, we follow Carlson et al. (2016) and combine the WTP estimates for each policy option into a single estimate of “net” WTP for the diversity-enhancing school assignment policy, relative to the alternative of neighborhood-based schooling assignments. In Table 6, we estimate a net WTP of about −$14 for the diversity-enhancing school assignment option among respondents assigned to the race track. For individuals assigned to the SES track, however, the WTP estimates differ, with a net WTP for the diversity-enhancing school assignment policy of $3 to $7. Therefore, net WTP for a diversity-enhancing school assignment policy is greater among respondents in the SES track than among those assigned to the race track. Together, these results provide further evidence that school assignment policies designed to achieve racial/ethnic versus socioeconomic diversity spark different reactions among the public, and thus, face different political prospects. Online Supplemental Table A4 presents estimated net WTP from our analysis without any certainty recodes.
Net WTP for Diversity-Enhancing School Assignment Policy

Note. Net WTP for the diversity-enhancing school assignment policy calculated as (WTPdiv − WTPnhood) using the estimates in Table 5. Survey-weighted standard errors calculated using the delta method are reported in parentheses. WTP = willingness to pay.
Discussion and Conclusion
Polling routinely finds large majorities of the public expressing support for racially and socioeconomically diverse schools. However, initiatives to achieve meaningful diversity routinely encounter significant public opposition and have proven quite difficult to both implement and sustain over time. In this article, we introduce a novel methodological approach for measuring the political and economic support for integration initiatives that better reflects the full set of factors and trade-offs that individuals consider when determining whether to support an integration or diversity initiative. We build on previous public opinion surveys by providing an advisory referendum format that mirrors the setup of a real information campaign for policy initiatives, in which respondents are informed of the likely effects of each policy option. Therefore, respondents in our survey are likely influenced by the information and evidence we provide on the effects of integration policies when deciding which school assignment policy to support. In contrast to the previous efforts to measure public support for school integration, this allows us to better approximate the stated preferences of respondents in a real referendum.
Our analyses show that presenting respondents with a choice between two concrete options for assigning students to schools—a purely residence-based approach and an approach that works to achieve stated diversity targets—and informing them of the likely effects of each option results in a greater percentage preferring the pure residence-based approach than the diversity-enhancing assignment option. The information provided to respondents was in an identical setup for both the race and SES tracks and respondents were randomly assigned to one of the two tracks, allowing us to make causal inferences regarding the differential support for race-based and socioeconomic-based school integration policies. Specifically, among respondents randomly assigned to the race track who would not abstain from the advisory referendum, 56.3% voted for the pure residence-based assignment policy while 43.7% preferred the race-based integration policy. Respondents assigned to the SES track were somewhat more supportive of integration, with 50.8% voting for a pure residence-based assignment policy and 49.2% of respondents voting for the assignment policy designed to achieve socioeconomic balance across schools. The enhanced political support for the SES-based integration initiative is primarily attributable to White, non-Hispanic respondents and Republicans being much more likely to support the SES-based integration option than the race-based one, although even the SES-based integration initiative fails to command majority support from either group.
Our WTP estimates provide further evidence on individuals’ preferences regarding race- and SES-based integration initiatives. Respondents assigned to the race track exhibited a net annual WTP of about $14 for residence-based schooling assignments, relative to approaches designed to achieve a degree of racial balance across schools. By contrast, respondents randomly assigned to the SES track exhibited average WTPs of about $11 for the diversity-enhancing assignment policy and $8 for the residence-based assignment policy, which results in a net WTP of about $3 for the school assignment policy designed to achieve a degree of socioeconomic balance. Together, these results suggest that respondents are not only more willing to vote for but also more willing to shoulder the costs of SES-based diversity initiatives rather than race-based school assignment.
Our findings contribute to existing literature on public support for school assignment by presenting respondents with an in-depth experiment including an advisory referendum and a contingent valuation exercise where the costs and benefits of school integration are presented before respondents state their vote choice. This setup allows for us to not only capture the causal effect of designing a school integration based on SES rather than race but also the net willingness to pay for diversity-enhancing initiatives, relative to pure residence-based schooling assignments. Together, these insights significantly advance current scholarly understanding on public support for school integration, and provide policy-relevant insights of potential use by policy makers around the nation.
These results suggest a couple of key implications for policy makers. First, race-neutral approaches to school integration will likely command a broader base of public support than those that more explicitly strive for a degree of racial balance. However, these SES-based policies may also be less effective at achieving the district-wide benefits of racially diverse schools, creating a trade-off between political feasibility and efficiency (Carlson et al., 2020; Ellison & Pathak, 2016; Reardon & Rhodes, 2011). Moreover, the SES integration policy still did not command a majority of support relative to the residence-based assignment policy, suggesting that even race-neutral alternatives will be politically challenging to implement. This leads us to our second key takeaway: that efforts to implement school integration initiatives might benefit from careful targeting. Our findings suggest that integration initiatives stand the best chance of success in areas with large populations of Democrats or racial and ethnic minorities that have historical experience with school integration (Orfield & Frankenberg, 2013). On the flip side, efforts to achieve diversity, particularly racial diversity, in heavily White or Republican areas are likely to face a difficult road ahead politically.
Like any study, this one has its share of limitations that should be kept in mind when interpreting the results. We designed our survey exercise in a manner that prioritizes specificity over generality. That is, we presented respondents with two detailed policy proposals and elicited their preferences on the two proposals. We believe that such an approach has substantial benefits, primarily a clear contextual basis for interpreting respondents’ expressed preferences. At the same time, our approach likely limits the generalizability of our results. Districts across the United States have employed a number of different strategies to achieve integration goals, and our findings may not accurately reflect public preferences for each of those strategies, or for school integration writ large. In addition, the fact the design of the survey exercise reflects our reading and interpretation of relevant literatures likely serves to further limit the generalizability of our findings—other designs stemming from alternative interpretations may have returned different results. Even with these limitations, however, the results of our analysis represent a useful contribution to the literature on public preferences regarding school integration.
Supplemental Material
sj-docx-1-ero-10.1177_2332858420986864 – Supplemental material for Socioeconomic Status, Race, and Public Support for School Integration
Supplemental material, sj-docx-1-ero-10.1177_2332858420986864 for Socioeconomic Status, Race, and Public Support for School Integration by Deven Carlson and Elizabeth Bell in AERA Open
Footnotes
Notes
Authors
DEVEN CARLSON is an associate professor in the Department of Political Science at the University of Oklahoma. His research agenda explores the operations of public policies and analyzes their effects on political, social, and economic outcomes of interest.
ELIZABETH BELL is an assistant professor of public administration in the Department of Political Science at Miami University. Her research is at the intersection of public policy analysis and public management, with a focus on education policy and social equity.
References
Supplementary Material
Please find the following supplemental material available below.
For Open Access articles published under a Creative Commons License, all supplemental material carries the same license as the article it is associated with.
For non-Open Access articles published, all supplemental material carries a non-exclusive license, and permission requests for re-use of supplemental material or any part of supplemental material shall be sent directly to the copyright owner as specified in the copyright notice associated with the article.