
Abstract
Using data on a mid-sized community college in northeast Ohio as a case study, we examine patterns of enrollment in petroleum technology credential programs and labor market returns to those credentials. The enrollment analysis yields mixed results. Strong industry conditions represented by an increase in oil prices is associated with a decline in program enrollment; however, higher wages for petroleum workers is associated with increased program enrollment. Earning analyses were unambiguous: Obtaining a certificate or an associate’s degree was associated with outsized quarterly earnings returns of $2,900 and $5,500, respectively. This study suggests that partnerships that align subbaccalaureate postsecondary education to the needs of local labor markets may result in occupational credentials with substantially larger returns than those observed in the literature.
Keywords
A growing concern of educational policy makers and practitioners is whether and how postsecondary education and training providers can adapt both to the changing needs of the labor market, which increasingly requires occupation-specific technical skills, and to the changing needs of college students, who are increasingly diverse in terms of sociodemographic background and career goals. One popular approach to dealing with these dual pressures has been the creation of subbaccalaureate occupational credentialing programs (Holzer, 2015). Composed of complementary certificates and associate’s degrees, these programs are designed to efficiently impart skills and competencies in high demand by local employers. With a more applied focus and with less seat time than 4-year degree programs, occupational credentialing programs provide an attractive alternative for students who struggle with traditional academic subjects and/or students who are balancing their coursework alongside work and family obligations. These programs may provide a manageable “on-ramp” to postsecondary education for disadvantaged populations. In addition, occupational credentialing programs may better meet the needs of employers, translating into improved labor market outcomes for students. Yet while many states have passed legislation to scale these programs (Wilson, 2016), little is known about how they operate within the volatile demands of local economies in which they are located, and how graduates of these programs eventually fare in the labor market.
Our study contributes new knowledge to our understanding of the role that subbaccalaureate postsecondary education plays in providing students with the skills and training necessary to procure gainful employment. Specifically, we examine the emerging energy sector in Ohio as a case study. Home to the Utica and Marcellus shales, which are two of the largest reserves of oil and natural gas in the country, Ohio has experienced a dramatic increase in oil and natural gas extraction over the past decade. This expansion is partially due to the implementation of horizontal drilling and hydraulic fracturing (“fracking”) technology. Fracking involves injecting water, sand, and chemicals underground at high pressures to crack open rock layers and release oil and gas trapped inside. This process requires that workers have specialized knowledge about machine operation, drilling, applied geology, applied engineering, and basic mechanics—all of which require coursework beyond a high school diploma.
Our study addresses two distinct aims: (1) assess whether the expansion in the oil and natural gas industry affected enrollment patterns of students in occupational credentialing programs and (2) examine whether obtaining an oil and natural gas specific occupational credential improved the labor market outcomes of graduates. In addressing our first aim, we will provide new information on whether the provision of subbaccalaureate occupational developed as part of a regional workforce development strategy can induce enrollment to fill demand in an expanding industry. In addressing our second aim, we will contribute to the growing research base on the efficacy of subbaccalaureate occupational credentials as viable alternative postsecondary pathways for technically oriented students. This is particularly timely as subbaccalaureate awards—specifically certificates—are fast becoming a popular option in the postsecondary marketplace: The percentage of adults with a postsecondary certificate as their highest level of educational attainment increased from 2% in 1984 to 12% in 2009 (Carnevale et al., 2012). As of 2017, 9% of adults report having a postsecondary certificate (Cronen et al., 2017). Furthermore, about 40% of students entering college directly after high school enroll in less than 4-year community/technical colleges (Radford et al., 2018). Therefore, any efforts at improving the school-to-work transition among contemporary college students need to consider linkages between less than 4–year community/technical colleges and the local subbaccalaureate economy (Holzer, 2015).
Responding to the Emerging Energy Sector in Ohio
Already a well-established hub of fossil fuel energy extraction and production, since 2011 natural gas resources have further driven the development of Ohio’s energy sector (Gonzalez et al., 2017). The region is also home to a burgeoning and varied energy economy in upstream, midstream, and downstream segments of the industry, including innovations in energy storage (Gonzalez et al., 2015). The oil and natural gas industry, on which this study focuses, includes exploration drilling along with preparation for shipment of crude petroleum and natural gas. Within Ohio specifically, oil production peaked at 26 million barrels in 2015 after dipping to a multidecade low of 4.6 million barrels just 4 years prior (U.S. Energy Information Administration, 2020). Consequently, Ohio stands as the largest oil producer in the region.
Through a broad-based public–private partnership, a consortium of community colleges in Ohio, Pennsylvania, and West Virginia named “ShaleNET” was established in 2010 with initial support from a U.S. Department of Labor Regional Innovation Grant, and later supported by a patchwork of grants from both the United States and Pennsylvania Departments of Labor. This partnership was developed by the Allegheny Conference on Community Development, with the goal of preparing the tristate region to capitalize on the increased production of oil and natural gas. To do this, the ShaleNET consortium, in collaboration with employers and community partners, designed a curriculum around the knowledge, skills, and abilities that employers identified as critical for jobs in their industry. This resulted in the implementation of a family of occupational credentialing programs offered at all schools in the consortium.
One of the goals underlying the creation of these credentials is to permit flexibility for employees who need to work while enrolled, and for employers facing labor shortages who cannot wait two or more years for their potential/current employees to return to school full-time and complete a degree. With sustained support and input from local employers and workforce investment boards, a distinguishing feature of ShaleNET was the ongoing identification of the competencies needed to succeed in the industry and the subsequent refinement of the curricula to enhance those competencies. The rapid emergence of the oil and gas industry met with a unified community response to deliver industry-specific education and training provides a unique case study into understanding the agility of community colleges to address regional workforce needs.
Our study focuses on subbaccalaureate occupational credentials developed in petroleum technology at one of the participating schools in the consortium, Stark State College, located in the northeast quadrant of Ohio in the Canton–Massillon Metropolitan Area directly on the Utica shale and just outside the border of the Marcellus shale. Stark State College is one of 23 community colleges in the Ohio Department of Higher Education System. With an enrollment of approximately 14,470 students, it is much larger than the average enrollment of 7,400 students per community college across the state. However, the demographic composition of Stark State’s students mirrors the rest of the state’s community college population: 31% of Stark State students are non-White and 58% of Stark State students are female, compared with the state averages of 35% and 57%, respectively. Compared with Stark State, the other three schools in the consortium—Pierpont Community and Technical College, Westmoreland County Community College, and Pennsylvania College of Technology—are located in more rural areas, are smaller in size, and have fewer non-White students.
Along with fellow consortium members, Stark State developed a certificate program in petroleum technology in 2012 requiring 34 credit hours and an associate’s degree in petroleum technology requiring 63 credit hours (which include the initial 34 credit hours earned via the certificate). The implementation of this program was accompanied by the provision of resources and services across ShaleNET schools and included new training equipment, virtual training scenarios, distance learning options, counseling, and job placement services (Dunham et al., 2016). Such resources and supports are distinctively designed to expedite graduates’ transitions into the local energy workforce so as to help support the immediate needs of employers. All ShaleNET credentials offered at each school are comparable in their content and standards. At Stark State, the petroleum technology program is open admissions and is available to students who reside within and outside of the state. Because we are analyzing subbaccalaureate occupational credentials accompanied by these unique support services and resources, our study provides a glimpse into the effectiveness of college–employer partnerships as a potential model for proactive regional workforce development strategies.
Determinants and Outcomes of Occupational Credentials in the Energy Sector
The first aim of our study is to assess whether the demand for skilled workers affected enrollment patterns of students in occupational credentialing programs focused on petroleum technology. We situate our analysis on past research which looks at how postsecondary enrollment responds directly to changes in the local labor market. Most prior studies focus on local unemployment rates and find that when unemployment increases, youth are more likely to enroll in college (Betts & McFarland, 1995; Bozick, 2009; Hillman & Orians, 2013). Though the mechanism(s) driving this relationship are not empirically discernible from these studies, it is hypothesized that youth return to and/or stay in school when employment opportunities are limited so as to enhance their human capital and thus, have a greater advantage in the labor market on degree completion. Additionally, the opportunity costs to enrollment are reduced when unemployment is high, as there are fewer alternative productive options.
Unemployment rates send signals to workers about general conditions in the labor market, but they do not convey occupation-specific opportunities that might be accelerating in a region—such as those increasingly available in Ohio’s rapidly expanding energy sector. To get a sense of how these different signals might align/diverge, we show trends in the overall unemployment rate in northeast Ohio (from the U.S. Department of Labor’s Bureau of Labor Statistics) alongside trends in the total number of jobs in oil and natural gas extraction in northeast Ohio (from the U.S. Census Bureau’s Quarterly Workforce Indicators) in Figure 1. Following the Great Recession, there is a steady decline in unemployment dropping from 11.6% at the start of 2010 to 5% at the end of 2017. This overall improvement in the labor market suggests that postsecondary enrollment should decline as well. During this period of increasingly low unemployment there was a dramatic expansion in the energy sector, with jobs in oil and natural gas extraction doubling from 2010 to 2015. However, this boom created an oversupply in natural gas, resulting in a decrease in prices and with it a reduction in new extraction efforts (Gonzalez et al., 2017). As a result, the number of oil and natural gas extraction jobs in the northeast quadrant of the state declined from a high of 1,051 at the end of 2015 to 601 at the end of 2017.

Trends in key labor market indicators in northeast Ohio, 2010–2018.
Given that petroleum technology credentials directly map onto jobs in the oil and natural gas industry, we expect that enrollment in programs leading to these credentials will be more responsive to industry-specific employment trends than to general rates of unemployment. Research shows that the price of gas plays a causal role in job creation within the industry (Weber, 2012). Specifically, we expect that when the price of gas increases and when earnings in the oil and natural gas industry increase, they will send a signal to local residents that there are growing job opportunities in the energy sector. Because these jobs require occupation-specific skills, there should be a corresponding increase in the probability of enrolling in petroleum technology credentialing programs. In the same vein, we expect that when earnings in the oil and natural gas industry increase, enrollment in petroleum technology credentialing programs will follow suit.
The second aim of our study is to examine whether obtaining an oil and natural gas specific occupational credential improves labor market outcomes. It is well established that acquiring an associate’s degree improves earnings (Belfield & Bailey, 2017), but far less is known about the returns to certificates—particularly those that are developed to address specific labor shortages in a volatile labor market. To date, several studies indicate that earnings are substantially improved when adults complete at least one year of college with an advanced-level certificate. For example, in their analysis of national data, Carnevale et al. (2012) identified a 20% earnings premium associated with the acquisition of a postsecondary certificate. Similar benefits have been identified at the state level in Arkansas (Belfield, 2015), California (Stevens et al., 2018), Kentucky (Jepsen et al., 2014), Michigan (Bahr et al., 2015), North Carolina (Xu & Trimble, 2016), Ohio (Bettinger & Soliz, 2016), Virginia (Xu & Trimble, 2016), and Washington (Dadgar & Trimble, 2015). In pooling across these eight states, Belfield and Bailey (2017) find that men with a certificate earn $530 more a quarter than those with no postsecondary education and men with an associate’s degree earn $1,160 more a quarter than those with no postsecondary education. We highlight earnings returns for men because they constitute more than 90 percent of students in petroleum technology programs at Stark State, and so provide a more appropriate benchmark for our own findings.
Of particular geographic relevance to our study is Bettinger and Soliz’s (2016) analysis of community colleges in Ohio. In looking at those who graduated from community and technical colleges across the state in 1998, 1999, and 2000, they found strong effects of associate’s degree receipt on earnings but inconsistent effects of certificate receipt. While informative, their analyses were based on students earning occupational credentials over a decade before the expansion in the state’s energy sector and they focus on occupational credentials in the aggregate (not oil and gas specifically). In addition, their analysis preceded Ohio’s strategic focus on systematic implementation of subbaccalaureate credentials across all postsecondary institutions in the state. Most notably, in 2007, the Ohio General Assembly passed legislation (HB-699) instructing the Ohio Board of Regents and the Ohio Department of Higher Education to develop a statewide system of subbaccalaureate certificates that map onto a set of high-demand occupations.
More recent analyses of Ohio data include Minaya and Scott-Clayton’s (2017) analysis of all Ohio higher education institutions from 2000 through 2013 and Pan’s (2017) analyses of the same institutions from 2000 through 2011. Both studies found strong effects of associate’s degrees and Minaya and Scott-Clayton additionally found effects for long-term certificates, but not returns to short-term certificates. Though these analyses span the time when Ohio systematized the implementation of subbaccalaureate credentials, their analyses remain aggregated and predate the institution of ShaleNET’s efforts to bring together institutions of higher education with industry. The credentials we examine are provided to students in the context of a regional partnership formed explicitly to develop clear occupation-specific pathways from local community colleges to the labor force. Therefore, we hypothesize that acquisition of these credentials—both certificates and associate’s degrees—will yield sizeable earnings returns to workers.
Data
To address our two research aims, we analyze data from three sources: (1) student-level administrative records from Stark State College, (2) earnings data from Ohio’s Department of Labor, and (3) earnings data from Pennsylvania’s Department of Labor. The site of our case study is Stark State College—a public, community college located in Stark County, Ohio. Stark State is part of the ShaleNET consortium, which was created by local employers and community partners to provide subbaccalaureate credentialing programs that teach occupation-specific skills to students set to take high-demand jobs in the expanding energy sector across the region. Though ideally we would like to have examined students in all schools in the consortium, we were only able to establish working relationships with Stark State and thus focus on their program as a case study. Given the collective effort that went into the construction of these programs to ensure that content was consistent across programs and that ShaleNET credits were seamlessly transferrable across all consortium members, we have no reason to suspect that Stark State’s petroleum technology program is substantially different than those at the other ShaleNET schools.
Stark State provided data for students enrolled in two programs between 2013 and 2017: ShaleNET’s petroleum technology program and the heating, ventilation, and air conditioning (HVAC) program (the rationale for which is described later in the Analytic Strategy section). Students in either program could elect to pursue a certificate or an associate’s degree. With these data, we are able to observe all periods in which these students enrolled in Stark State, all programs students enrolled in, all classes taken, and any degrees completed at the school—including those that occurred before 2013. We have structured the data so that all variables of interest are maintained at the person–quarter level, such that quarters correspond to the calendar year (i.e., first quarter = January to March; second quarter = April to June, etc.). Additionally, Stark State provided data on sociodemographic characteristics and educational background. Sociodemographic characteristics include age, gender, race/ethnicity, veteran status, eligibility for trade adjustment assistance, and Pell grant eligibility. Educational background includes high school grade point average (GPA), GED or high school diploma receipt, and scores on placements tests for Algebra, English, and reading. We use these sociodemographic characteristics and educational background measures as control variables in our analyses.
We merge these student-level records from Stark State with data from Ohio and Pennsylvania’s respective Departments of Labor. Earnings data were made available from the fourth quarter of 2010 through the second quarter of 2018, allowing us to measure earnings for at least three years prior to enrollment at Stark State as well as following the completion of an occupational credential. Stark State is 60 miles from the Pennsylvania border, and so is directly adjacent to employment opportunities in Western Pennsylvania. In having earnings data from both states, we are able to more comprehensively document employment dynamics of our sample members. This is an improvement on other studies of occupational certificates using state-level data as those studies are unable to track students who leave the state to pursue job opportunities in neighboring states with similar economies—as is the case in our study. Our analytic sample contains 1,350 students, 238 of which enrolled in the petroleum technology program and 1,112 of which enrolled in the HVAC program. Table 1 provides descriptive statistics on the petroleum technology and HVAC sample.
Descriptive Statistics

Note. Sociodemographic characteristics and educational background data was obtained from the Stark State College of Technology administrative records. Labor market outcome data were obtained from the Ohio Office of Unemployment Insurance Operations and the Pennsylvania Department of Labor and Industry. Labor market outcome data are reported here as the average of all calendar-year quarters from Quarter 4 of 2010 through Quarter 2 of 2018. Missing data for all measures are imputed at the mean. HVAC = heating, ventilation, and air conditioning.
To address our first aim, we augment our individual-level data with time-varying contextual indicators of the health of the regional economy, the oil and gas extraction industry (which is relevant to students seeking petroleum technology credentials) in northeast Ohio, and building equipment contractors (which is relevant to students seeking HVAC credentials) in northeast Ohio. As an overall indicator of the health of the regional economy, we obtain monthly employment rate data for northeast Ohio from the U.S. Bureau of Labor Statistics. As a more proximate indicator of the health of the oil and gas extraction industry, we obtain monthly first purchase price for a barrel of oil in dollars from the U.S. Energy Information Administration (2017) on a monthly basis. We average across months to calculate quarter specific averages of these daily prices to comport with the person–quarter structure of our data. Finally, from the U.S. Bureau of Labor Statistic’s Quarterly Census of Employment and Earnings we obtain average quarterly earnings of workers in northeast Ohio’s oil and gas extraction industry, and the average quarterly earnings of building equipment contract workers in northeast Ohio.
Analytic Strategy
Analytic Strategy for Aim 1
Our first aim is to assess whether the demand for workers in the oil and natural gas industry affected enrollment patterns of students in occupational credentialing programs focused on petroleum technology. In analyzing patterns of enrollment, our treatment group consists of those enrolled in the petroleum technology program at Stark State. We compare enrollment patterns of students in the petroleum technology program with enrollment patterns of students in the HVAC program—who we designate as our comparison group.
In our conversations with Stark State administrators in preparation for our study, they indicated that the HVAC program is a technical, hands-on credentialing program that, in the absence of ShaleNET, many petroleum technology students would have been likely to enroll. Both the petroleum technology and HVAC programs have approximately the same mathematics prerequisites, credit hour requirements, tuition costs, and both programs meet state licensure requirements in the state. Both industries are dominated by men at the time of the implementation of ShaleNET. Additionally, average weekly earnings in Stark County were approximately the same ($1,000) for those in the oil and natural gas industry and for building equipment contractors.
One key feature that distinguishes the treatment and comparison programs from one another is that the demand for HVAC graduates held steady throughout our period of observation while the demand for petroleum technology graduates expanded and contracted (as shown in Figure 1). Employment among building equipment contractors remained stable throughout our period of observation. However, there is seasonal variation such that employment spikes in the summer months—corresponding to the heightened use of air conditioning. The stability of HVAC employment allows us to contrast enrollment patterns into programs associated with industries that are stable and predictable with enrollment patterns into programs that support more dynamic industries, such is the case with oil and natural gas. Both programs provide specialized training, but one is for a more stable, well-founded industry (HVAC) and the other is for a rapidly expanding one (oil and natural gas). It is this distinction that serves as the centerpiece for our comparisons.
To estimate the association between the demand for workers and enrollment in the petroleum technology program at Stark State, we estimate discrete-time hazard regression models of the following form:

Although time to first enrollment is a continuous process, we use a discrete-time hazard model because the data are grouped into discrete intervals (i.e., quarters). In the model, Yit is an indicator for individual, i, having enrolled in a petroleum technology credential program in quarter, t. Sample members are coded “0” in each quarter they are not enrolled, and “1” in the quarter in which they first enroll. After the quarter in which they are observed first enrolling in the program, the sample member no longer contributes person–quarters to the estimator. The hazard or “risk” of enrollment from time t to time t + 1 is assumed to be constant while the hazard may vary across intervals. If an individual never enrolls (or enrolls in a HVAC or other program), all observations through the second quarter of 2018 remain and are coded “0.”
LM it is a vector of time-varying labor market conditions and includes quarterly measures of northeast Ohio’s employment rate, the first purchase price per barrel of oil (in $10s), average quarterly earnings (in $1,000s) in northeast Ohio’s oil and gas extraction industry, and average quarterly earnings in (in $1,000s) northeast Ohio’s building and construction industry—all lagged one quarter. Unlike traditional academic programs, which require up to a year between application and matriculation, these occupationally-focused subbaccalaureate programs are intended to be “quick turnaround” to expedite job training. Three to five months is a typical time period between application and matriculation for these programs, and so a one quarter lag, which encompasses up to 6 months (i.e., the first month of the first quarter to the last month of the second quarter), is appropriate here. β1 includes the coefficients associated with this vector and will indicate how labor market conditions are associated with the probability of enrollment in the petroleum technology program.
In estimating these coefficients of interest, we control for PROG it , a vector that identifies the quarters in which the individual is enrolled in the HVAC or other program and obtaining a HVAC or other non-petroleum technology credential or degree, and EMP it , a vector of variables including an indicator for being employed in a quarter, the cumulative number of quarters employed, and earnings in a quarter. X it is a vector of time-invariant and time-varying variables, including sociodemographic characteristics and educational background. Time-invariant variables include high school GPA, and indicators for holding a GED (as opposed to a high school diploma), being female, non-White, a veteran, trade adjustment assistance eligibility, and Pell grant eligibility. In order to prevent the individual fixed-effects from subsuming these time-invariant variables, we interact them with the quarter. Time-varying variables include age. Finally, we also include individual (αi) and quarter (γt) fixed effects. Individual fixed-effects are particularly important here as they eliminate potential bias owing to time-invariant characteristics of individuals. We limit the sample to quarters in which individuals are 18 years or older. Furthermore, when estimating our discrete-time hazard models we limit the sample to the years 2012–2018. The ShaleNET petroleum technology program at Stark State did not begin until 2013. Thus, students did not have the opportunity to enroll prior to 2012.
Analytic Strategy for Aim 2
Our second aim is to assess whether obtaining an oil and natural gas specific occupational credential improves labor market outcomes. To address this aim, we estimate a series of Mincer-style regression models in which we identify the effect of petroleum technology degree completion on labor market outcomes via an event study model and a difference-in-differences strategy. To execute this approach we separate students into two groups, degree attempters and degree completers. In this framework, degree completers serve as our treatment group and degree attempters serve as our comparison group.
The event study model estimates labor market outcomes between the two groups relative to the quarter before the degree is conferred (in all quarters before and after). This is a more flexible approach than the traditional difference-in-difference approach used in Jepsen et al. (2014) to estimate the returns to subbaccalaureate degrees in Kentucky. The following model illustrates our approach:

where Yit represents one of five labor market outcomes of interest for individual, i, in quarter, t: (1) total quarterly earnings, (2) probability of being employed, (3) log of earnings, (4) average weekly earnings, and (5) probability of employment in the oil and gas industry. Following Jepsen at al. (2014), any student–quarter observation that does not match to either the Ohio or Pennsylvania earnings data is assumed to be a quarter in which the sample member is unemployed, has worked zero weeks, and has zero earnings. Using earnings as an outcome combines the extrinsic and intrinsic earnings’ margins to give a summary measure of the increase in earnings provided by petroleum technology associate’s degrees and certificates. Analyzing the probability of employment will focus on the extrinsic margin and indicate whether the credentials induce previously unemployed workers to obtain a job. The log of earnings and weekly earnings focus on the intrinsic margin of earnings and will provide an estimate of the increase in earnings, conditional on being employed in percentage terms (log of earnings) or on a weekly dollar basis. The wages per week outcome is additionally helpful in helping conceptualize a wage rate for workers while employed. Finally, as these credentials are highly aligned to the oil and gas industry, we analyze the probability of entering this industry after obtaining the credentials. To identify employment in the oil and gas industry we use the North American Industry Categorization System codes contained in the state earnings data. We use ordinary least squares estimation to produce our results. However, we also used probit models to estimate our two binary outcomes (employed and employed in the oil and gas industry), and the results (not shown) are consistent.
To operationalize this model, we center time, τ, on the quarter before obtaining the petroleum technology credential of interest.
The identifying assumption is that earnings of credential attempters are a valid counterfactual for the earnings of the credentials completers. Illustrating a common pretrend in earnings between the two groups provides some evidence for this assumption, as does choosing a comparison group that is as similar as possible to the treatment group. This model allows for a test of this assumption. If the petroleum technology and HVAC samples were following parallel earnings trends prior to enrollment, we would expect δτ = 0, for all τ < 0. Conversely, any factor that differentially affects the two groups over time would undermine the identification strategy. The primary concern in this context is that there are fundamental differences among credential completers and attempters that would make the earnings trend of attempters an invalid counterfactual.
The remainder of the elements in Equation 1 address this concern by accounting for time-varying differences between the two groups. AAit are indicators for having obtained a petroleum technolgoy associate’s degree in a given quarter. These variables take on a value of zero in all quarters before completing the credentials and a value of one in all quarters after obtaining the credential. X it is the same vector of sociodemographic and educational background characteristics in equation 1, with the addition of an indicator for being a minor in a given quarter, the employment rate for northeast Ohio, Pennsylvania, or their average, depending on the state where they worked, the number of quarters employed before enrollment interacted with the quarter, and the number of quarters employed in the oil and gas industry interacted with the quarter. We also include state fixed-effects denoting where earnings were generated in a given quarter (from employers in Ohio, Pennsylvania, or both) as well as a fixed-effect for the quarter of year to account for the seasonal fluctuations in the economy.
Following Jepsen et al. (2014) we also account for possible motivational differences in earnings trajectories by interacting course choices from the first semester at Stark State with the quarter. These choices are contained in the vector INTENT it and include the number of courses attempted, the number of credits earned, and an indicator for the first program in which the individual enrolled. These characteristics were taken from the first enrollment of an individual, even if the individual enrolled in programs in Stark State previous to the implementation of ShaleNET. These measures, whose distributions are shown in Table 1, broadly capture the extent of commitment that students have to completing a degree, with a higher number of courses attempted, a higher number of credits earned, and initial enrollment in petroleum technology indicating a stronger intent to complete the degree. These measures of “motivation” may be related to earnings trajectories. Additionally, we control for a vector of variables for enrollment called ENROLL it which includes an indicator for the two quarters immediately preceding enrollment and the quarter immediately preceding enrollment to account for the “Ashenfelter dip” (Ashenfelter, 1978). It also includes indicators for the quarters in which students were taking classes to account for the opportunity costs of attending school as well as an indicator for all quarters after leaving Stark State (with or without a credential) to capture general returns to college course taking.
Equation 2 illustrates the approach for returns to certificates. A similar analysis was done by centering time on the quarter before receiving an associate’s degree in petroleum technology and including an indicator for holding a certificate in an given quarter.
Finally, the sample contains both petroleum technology credential attempters and attainers as well as HVAC credential attempters and attainers. We include HVAC program participants as their inclusion accounts for any enrollment changes caused by the implementation of the petroleum technology program and controls for trends in more general labor market conditions that affect holders of technical degrees in northeast Ohio. Furthermore, including HVAC students in the sample will allow us to compare the returns of more general technical degrees in a stable industry, which may be more analogous to traditional subbaccalaureate credentials to the returns of credentials aligned to a rapidly expanding sector of the local labor market. X it therefore contains variables for holding an HVAC certificate or HVAC associate’s degree in any given quarter. Additionally, it contains variables for holding a certificate or associate’s degree in any other field in any given quarter. As we show in online Supplemental Appendix A, results are similar when excluding or including HVAC program participants.
In addition to the event model, we also employ a difference-in-difference model akin to the one used by Jepsen et al. (2014). We include this model to further corroborate the results of the event model and to present results that are directly comparable with those seen in the literature. These models are of the following form:

Here, CERTit and AAit are indicators for having obtained a petroleum technology certificate or associate’s degree in a given quarter. These variables take on a value of zero in all quarters before completing the credentials and a value of one in all quarters after obtaining the credential. The remainder of the equation is identical to Equation 2. The coefficients of interest are β1 and β2, which are the estimates of the returns to certificates and associates degrees, respectively, after comparing earnings of degree attempters and completers before and after credential receipt.
Results in Support of Aim 1: Enrollment in Subbaccalaureate Credential Programs
Table 2 illustrates the relationship between industry indicators and the probability of enrolling in petroleum technology credential programs (Equation 1). Model 1, which includes only the lagged northeast Ohio employment rate, shows that a one percent increase in employment in a given quarter is associated with a decrease in the probability of enrolling in petroleum technology credential programs in the next quarter by 0.2 percentage points. This comports with past research which finds that young adults seek to enhance their human capital when general economic conditions are less favorable (Betts & McFarland, 1995; Bozick, 2009; Hillman & Orians, 2013).
Parameter Estimates From Discrete-Time Hazard Regression Models Predicting the Time to First Enrollment in a Petroleum Technology Credential Program
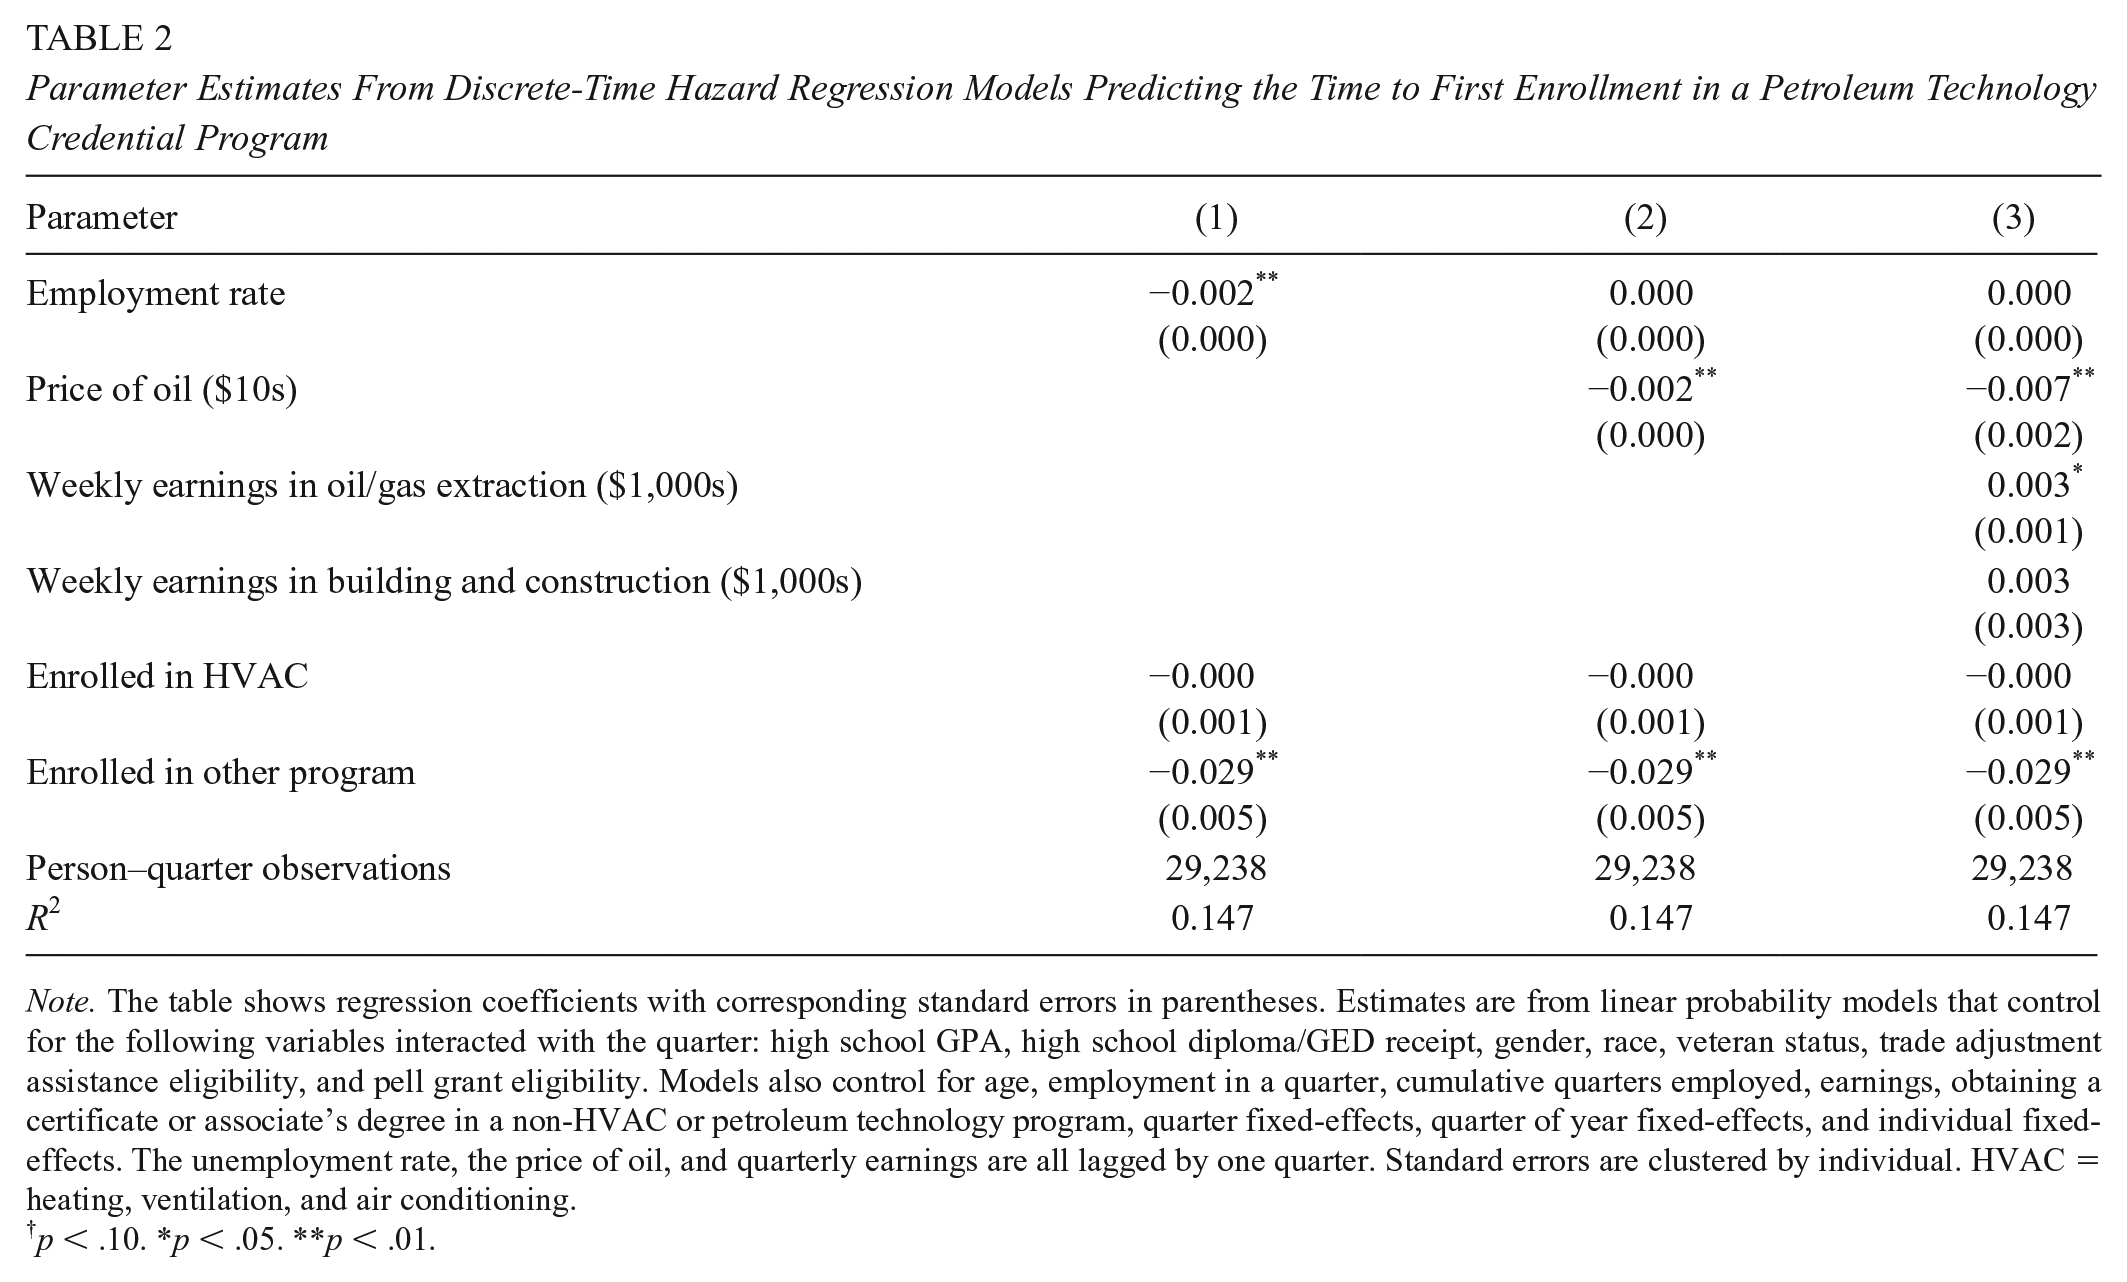
Note. The table shows regression coefficients with corresponding standard errors in parentheses. Estimates are from linear probability models that control for the following variables interacted with the quarter: high school GPA, high school diploma/GED receipt, gender, race, veteran status, trade adjustment assistance eligibility, and pell grant eligibility. Models also control for age, employment in a quarter, cumulative quarters employed, earnings, obtaining a certificate or associate’s degree in a non-HVAC or petroleum technology program, quarter fixed-effects, quarter of year fixed-effects, and individual fixed-effects. The unemployment rate, the price of oil, and quarterly earnings are all lagged by one quarter. Standard errors are clustered by individual. HVAC = heating, ventilation, and air conditioning.
p < .10. *p < .05. **p < .01.
Due to the highly technical and occupation-specific knowledge, skills, and abilities required to work in oil and natural gas extraction, we expected that growth in the industry—as measured by the price of oil and the average quarterly earnings of oil and gas extraction workers—would lead to a rise in enrollment in petroleum technology programs. We test this proposition in Model 2 and in Model 3 by iteratively adding the lagged first purchase price of oil and then the lagged quarterly earnings of workers in the oil and gas extraction industry and the building and construction industry in northeast Ohio. This prediction was only partially borne out by the data. In Model 2 we see that for every 10-dollar increase in the first purchase price of a barrel of oil, the probability of enrollment decreases by 0.2 percentage points the subsequent quarter. The employment rate is now no longer associated with enrollment patterns, suggesting that industry-specific indicators are more relevant to enrollment decisions related to that industry than indicators of general economic strength. As Model 3 illustrates, when adding earnings into the model, the relationship between the price of oil and enrollment in petroleum technology programs increases in magnitude with a $10 increase in the price of oil now associated with a 0.7 percentage point decrease in the probability of enrollment in the subsequent quarter. In contrast, we see that for every $1,000 increase in quarterly earnings in the oil and gas extraction industry the probability of enrollment in petroleum technology programs increases by 0.1 percentage points in the subsequent quarter. Though statistically significant, this represents a substantively small effect.
Results in Support of Aim 2: Labor Market Outcomes
Before presenting the results of the event study and difference-in-differences analyses, we descriptively document changes over time in earnings as context for our multivariate models. Figure 2 shows earnings, plotted by quarter, for four groups of interest: petroleum technology credential attempters, petroleum technology credential completers, HVAC credential attempters, and HVAC credential completers. Prior to 2013, the earnings of all four groups were stable or increasing somewhat. HVAC credential attempters had the lowest quarterly earnings, slightly less than $2,000, while petroleum technology completers had the highest quarterly earnings at about $4,000. Though these groups had different levels of quarterly earnings, the common trajectories over time prior to 2013 lend support for the common trends assumption that is necessary to produce valid difference-in-difference estimates. Beginning in 2013, when members of all groups begin to have the opportunity to earn petroleum technology credentials, their earnings trajectories begin to diverge dramatically. Though earnings for all groups increase, petroleum technology and HVAC attempters gain the least and remain the lowest paid. Meanwhile, the quarterly earnings of HVAC completers rises to about $6,000, while the earnings of petroleum technology completers jumps to $12,000 by the second quarter of 2018. These plots provide the first indication that returns to petroleum technology credentials in Ohio’s emerging energy sector are large.

Quarterly earnings of petroleum technology and heating, ventilation, and air conditioning (HVAC) students, 2010–2018.
Figure 3 presents quarterly earnings for each group of interest but now centered on the quarter before each individual enrols in their respective credential program. The patterns seen in Figure 2 are largely evidenced in Figure 3. All four groups have similar preenrollment trends in earnings, though petroleum technology completers were experiencing a decline in earnings prior to entry, the other groups had relatively stable earnings. Furthermore, this decline was particularly acute in the quarters right before entry, highlighting the need to control for a possible Ashenfelter dip in our models. Postenrollment, the earnings trajectories once again diverge. By the second quarter of 2018, all groups except petroleum technology completers earn between $5,000 and $7,500 per quarter. Even those who do not receive a degree experience an increase in earnings, potentially because of general returns to college course taking, which is controlled for in our models. Petroleum technology credential completers, however, experience the most dramatic increase in earnings and by mid–2018 earn on average over $12,500 per quarter.

Quarterly earnings of petroleum technology and heating, ventilation, and air conditioning (HVAC) students centered on quarter of initial enrollment.
Event Analyses Results
Figures 4 and 5 present these results of the event study analysis (Equation 2) for certificate holders and associate’s degree holders, respectively. For brevity we show only the results for total earnings, and show results for the other outcomes in the difference-in-difference models. We limit results to ten quarters before and after the receipt of the degree to ensure enough observations in any one quarter. In both figures, the estimated average earnings is indicated by the dot, and the whiskers correspond to 95% confidence intervals.

Event analysis of labor market returns to petroleum technology certificates.

Event analysis of labor market returns to petroleum technology associate’s degrees.
Figure 4 shows a downward trend in predegree earnings, indicating that workers experiencing more difficulty in the labor market were more likely to enter petroleum technology certificate programs and complete them. However, few of these estimates are statistically significant and in the eight quarters previous to obtaining a certificate, estimates are generally small and insignificant. After receipt of the certificate, however, workers experience a one-time increase in earnings of approximately $3,000.
Figure 5 reveals a slightly different picture for associate’s degree completers. Unlike the downward pretrends observed for certificate holders, here we see that there is no discernible pretrend in earnings for associate’s degree holders. Most estimates are small and insignificant. After obtaining the degree, however, earnings begin to rise substantially until returns reach about $7,000 dollars per quarter ten quarters after receiving the degree. Figures 4 and 5 confirm that the returns to petroleum technology credentials observed in Figures 2 and 3 are large and statistically significant. These results further suggest that associate’s degrees increase earnings increase over time, while certificate degrees provide a one-time boost to earnings. Please see online Supplemental Appendix Table B1 for the event study point estimates and standard errors depicted in Figures 4 and 5.
Difference-In-Differences Results
In Table 3, we show the parameter estimates from the difference-in-difference specifications (Equation 3). For each of the five outcomes there are a pair of models. The first model in the pair includes estimates for petroleum technology certificates and associate’s degree receipt, controlling only for individual and quarter fixed-effects. The second model in the pair adds in controls for sociodemographic characteristics, educational background, measures of motivation to complete a subbaccalaureate degree, and measures gauging different elements of postsecondary enrollment. On average, petroleum technology certificate completers gain about $2,900 per quarter while petroleum technology associate’s degree completers gain about $5,500 per quarter. To put this finding in context, the average worker in oil and natural gas extraction remains at their job for 5.1 years (U.S. Department of Labor, 2018), translating to an approximate $59,000 premium for certificate completers and $113,000 premium for associate’s degree completers from their first jobs after completing the program.
Parameter Estimates From Difference-in-Difference Models Predicting Labor Market Outcomes
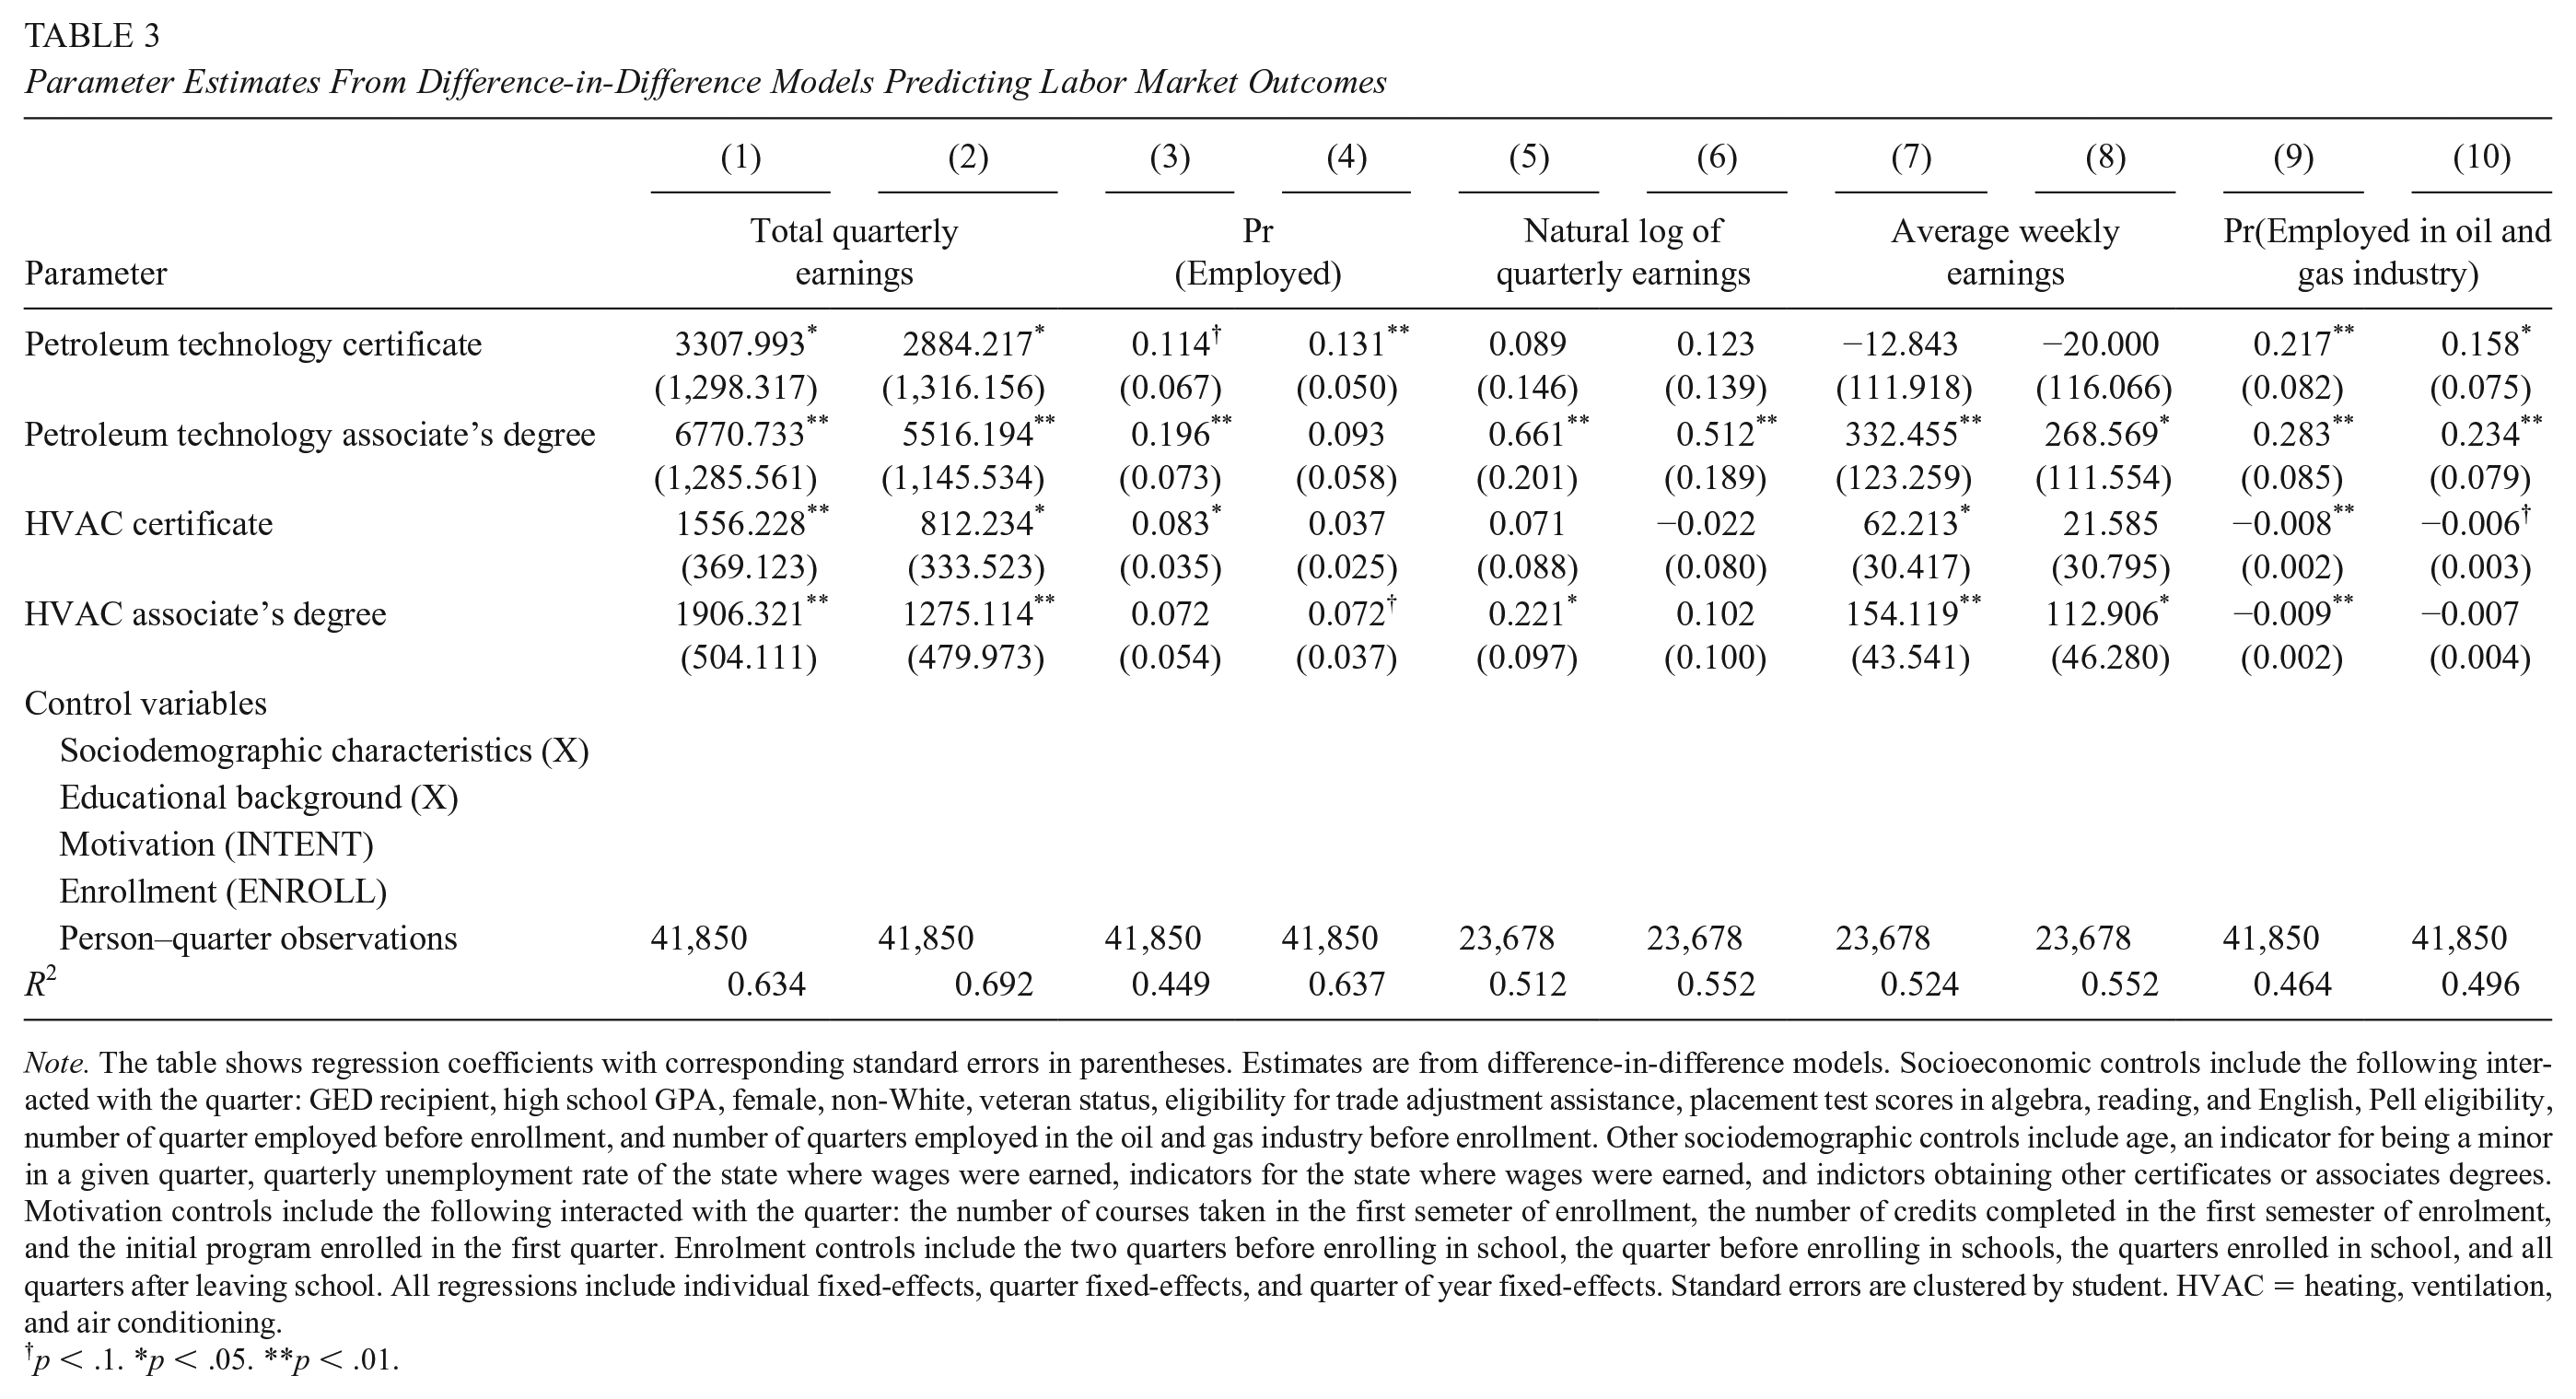
Note. The table shows regression coefficients with corresponding standard errors in parentheses. Estimates are from difference-in-difference models. Socioeconomic controls include the following interacted with the quarter: GED recipient, high school GPA, female, non-White, veteran status, eligibility for trade adjustment assistance, placement test scores in algebra, reading, and English, Pell eligibility, number of quarter employed before enrollment, and number of quarters employed in the oil and gas industry before enrollment. Other sociodemographic controls include age, an indicator for being a minor in a given quarter, quarterly unemployment rate of the state where wages were earned, indicators for the state where wages were earned, and indictors obtaining other certificates or associates degrees. Motivation controls include the following interacted with the quarter: the number of courses taken in the first semeter of enrollment, the number of credits completed in the first semester of enrolment, and the initial program enrolled in the first quarter. Enrolment controls include the two quarters before enrolling in school, the quarter before enrolling in schools, the quarters enrolled in school, and all quarters after leaving school. All regressions include individual fixed-effects, quarter fixed-effects, and quarter of year fixed-effects. Standard errors are clustered by student. HVAC = heating, ventilation, and air conditioning.
p < .1. *p < .05. **p < .01.
Next, looking at the extensive margin, part of the gains for certificate completers is due to an increased probability of employment of 13.1 percentage points. Though a potentially similar increase in employment is present for associate’s degree completers, the result is not significant when controlling for additional covariates. Looking at the intensive margin, the picture diverges for types of credential holders. The effects on the natural log of earnings and average weekly earnings for certificate holders are small and insignificant. For associate’s degree holders, the effects are much larger and significant: Associate’s degree holders experience, on average, a 67% increase in earnings (e0.512 − 1) and about $270 more in weekly earnings. In both cases, however, certificates and associate’s degrees induce workers to enter the oil and gas industry by 15.8 and 23.4 percentage points, respectively.
These earnings gains are substantially larger than those seen in the literature for subbaccalaureate credentials. Recall that Belfield and Bailey (2017) aggregated data across eight states and found quarterly earnings returns between $530 and $1,160 for occupationally focused certificates and associate’s degrees, respectively. Here we find quarterly earnings returns for petroleum technology certificate and associate’s degree holders that are more than four times those aggregated estimates. These returns seen in the literature are similar to the returns to HVAC credentials in our sample. A HVAC certificate produces an earnings benefit of $800 per quarter and a HVAC associate’s degree produces an earnings benefit of $1,240 per quarter. Thus, a technical degree, unaligned to the region’s labor market demands produces more typical returns.
Robustness Tests
We conducted a number of robustness checks to ensure that our results are not an artifact of specification decisions resulting from invalid assumptions: We estimated our models focusing on the calendar year rather than the year since graduation; with and without those individuals with valid merges with labor market outcome data; with and without HVAC students; and with and without controls for time trends. Additionally, our focus on HVAC and petroleum technology enrollees allows for a triple-difference specification, in which we can compare attempters and completers, before and after the introduction of petroleum technology credentials, between enrollees of the two programs. We compare the results from this triple difference with our standard difference-in-difference. Across all of these tests, our results remain robust. Each of these tests are described in more detail, with corresponding results, in the online Supplemental Appendix A.
Conclusions
Policy makers and industry leaders remain concerned about how best to structure their workforce development strategies to accommodate rapid advancements in technology and communication. Such advancements are poised to drastically alter the types of jobs available to workers who in previous decades would have held traditional blue-collar jobs—typically consisting solely of manual tasks—that did not require any schooling beyond high school. To adjust to these advancements, many colleges and trade schools are rapidly implementing and promoting subbaccalaureate occupational credentialing programs that deliver training in applied fields. These programs are dually geared toward recent graduates of high school career and technical education programs as well as mid-to-late career workers facing potential skill obsolescence. Because they are operating in the context of economic restructuring, subbaccalaureate occupational credentialing programs must exhibit versatility both in terms of attracting students when the demand for occupation specific skills increases and providing them the “right kind” of skills so they are able to maintain stable careers amidst volatile economic cycles. In our study, we examine student-level data on students enrolled in one such program – Stark State College’s petroleum technology program—which was explicitly designed to address the shortage of workers in Ohio’s rapidly expanding oil and natural gas industry.
Our study had two aims: (1) to assess whether the demand for workers in Ohio’s emerging energy sector affected enrollment patterns of students in occupational credentialing programs and (2) to examine whether obtaining an oil and natural gas specific occupational credential improved the labor market outcomes of graduates. With respect to the first aim, we found that growth in the demand for workers yielded mixed results, which may have resulted from mixed signals that the local economic climate may send to potential students. The probability of enrolling in the program declined when the price of a barrel of oil in the United States increased (suggesting that demand suppresses enrollment), but the probability of enrollment when the earnings of oil and natural gas workers increased (suggesting that demand spurs enrollment). Though we can only speculate about the mechanisms driving these countervailing findings, it may be the case that growth in the price of oil increases transportation and food costs, which may deter workers from enrollment due to financial constraints. The more potent signal to prospective enrollees may be the compensation. Therefore, the oil and natural gas industry may need to promote the earnings potential of workers when demand surges to sustain a steady stream of skilled workers.
With regard to the second aim, we find that recipients of occupational credentials in petroleum technology experience a substantial boost in earnings: Obtaining a certificate in petroleum technology increases quarterly earnings by approximately $3,000 and obtaining an associate’s degree in petroleum technology increases quarterly earnings by approximately $5,500. During our period of observation, the industry experienced a downturn due to an oversupply in natural gas, but the earnings that accrued to credential holders persisted—suggesting the “durability” of the training received from Stark State’s program to buffer against market fluctuations. In fact, the returns we observe are much larger than those detected in existing studies that analyze returns to certificates and associates degree across fields within a state. This suggests that existing studies of occupational credentials may be masking important heterogeneity because at best they look at very coarse categories of credentials aggregated across institutions. Furthermore, these studies do not differentiate programs that train workers for jobs in high-demand, high-growth industries from those that train workers for jobs in stable industries. Our findings show that earnings returns are substantial when the demand is high. As additional support for this hypothesis, our estimates of returns to HVAC subbaccalaureate credentials were more in line with returns seen in the prior literature. In contrast to the petroleum industry, the HVAC industry is a more established and predictable industry that is not strongly aligned to local economic restructuring.
As a case study focused on a single program in a single state, future research will need to see if the same dynamics undergirding the oil and natural gas industry in Ohio produce the same results for occupational credential programs that prepare students for other high-growth, high-demand industries in different localities. We were only able to observe enrollment patterns for eight years, which tracked with a historically unparalleled expansion in the program’s focal industry. While we were able to observe sustained earnings returns even when the industry experienced a downturn, it remains unclear whether these returns persist once the volatility in the market subsides. Those limitations aside, the site of our study—northeast Ohio—is an ideal case study as the region is experiencing unprecedented expansion in an industry that can offset some of the economic damage caused by decades of deindustrialization, along with an active community response that distinctly requires innovation from colleges to ensure its success.
As the energy sector expands into new geographies such as the once industrial-dominated Midwest, there is a growing need for policy makers in those regions to identify workforce development strategies in conjunction with local community colleges and trade schools that can prepare future and current workers for entry-level positions that increasingly require strong quantitative and analytical skills. Our study shows that subbaccalaureate occupational credential programs jointly designed by employers, educators, and workforce development stakeholders are one promising avenue. These programs are well-suited to respond to fluctuations in demand (inasmuch as demand is signaled to potential enrollees by competitive wages among current workers in the industry), and can lead to substantial earnings growth for their graduates. Further research can explore whether this collaborative approach to designing and implementing subbaccalaureate occupational credentials is viable in other high-need industries in local labor markets and whether this alignment between the local labor market and higher education can produce outsized earnings benefits in other contexts.
Supplemental Material
ERO957250_Supplemental_Material – Supplemental material for Occupational Credentials for Jobs in the Subbaccalaureate Economy: The Case of the Emerging Energy Sector in Ohio
Supplemental material, ERO957250_Supplemental_Material for Occupational Credentials for Jobs in the Subbaccalaureate Economy: The Case of the Emerging Energy Sector in Ohio by Robert Bozick, Christopher Doss, Gabriella Gonzalez and Kyle Siler-Evans in AERA Open
Footnotes
Acknowledgements
This research was generously supported by a grant from the National Science Foundation (NSF #1535322).
Authors
ROBERT BOZICK is a demographer at Rice University’s Kinder Institute for Urban Research. His research focuses on the effects of economic strain on demographic and educational outcomes.
CHRISTOPHER DOSS is an associate policy researcher at the RAND Corporation. His research focuses on evaluations of early childhood education policies, K-12 accountability policies, and alternative teacher and principal preparation programs.
GABRIELLA GONZALEZ is a program officer at Richard King Mellon Foundation. Her research focuses on the future of work and workforce development.
KYLE SILER-EVANS is an engineer at the RAND Corporation. His research focuses on energy systems, infrastructure resilience, cost analysis, and modeling and simulation.
References
Supplementary Material
Please find the following supplemental material available below.
For Open Access articles published under a Creative Commons License, all supplemental material carries the same license as the article it is associated with.
For non-Open Access articles published, all supplemental material carries a non-exclusive license, and permission requests for re-use of supplemental material or any part of supplemental material shall be sent directly to the copyright owner as specified in the copyright notice associated with the article.