
Abstract
Access to community cultural institutions such as museums, zoos, and theaters has the potential to improve students’ educational experiences. This article estimates the impact of School in the Park, a museum-based educational program for low-income students that takes place within the cultural institutions and museums of San Diego’s Balboa Park. We identify the impact of participation in the program on short- and long-term academic and behavioral outcomes using longitudinal, student-level data since 1996; natural variation in the timing of program implementation at two elementary schools; and control groups of students from schools that did not receive the program. Findings indicate that participation in the program has positive short-term impacts, but program impacts were insignificant in the long run.
Keywords
Introduction
Education policy is in the midst of an era of data-driven decision-making, accountability, and high-stakes testing. However, not all educators, policymakers, and parents agree about the efficacy of this approach to improving student achievement. While the benefits of high stakes testing include student achievement measures that are comparable across schools and over time, metrics to gauge teacher effectiveness and to hold schools accountable, and indicators to identify students who are struggling, there are also multiple unintended costs of the high-stakes testing regime (Jones et al., 2003). Concerns about “teaching to the test,” student stress, and a narrow focus on the tested material at the expense of other subjects, such as art or music, raise the question: Does the quest to quantify achievement take away from a more holistic educational experience for students?
Experiential education programs offer students opportunities to learn content that may not be targeted at increasing standardized test scores in the short term. As a result, districts, principals, and teachers face increasing pressure to limit nonstandard experiences in addition to nonacademic activities for students because they may take away from test preparation or do not highlight material that will be tested come year’s end (Bassok et al., 2016; Booher-Jennings, 2005; U.S. Government Accounting Office, 2009). However, it remains an open question whether programs not intentionally aimed at improving test scores actually have academic benefits as measured by test scores. Experiential education programs may stimulate creativity and curiosity, and promote longer term positive outcomes for students, such as the desire to attend college or an interest in a broader set of topics. In addition, No Child Left Behind and the test-based education policies that have defined the recent decade and a half of education policymaking, at least on a national level, do little to address the needs of disadvantaged students or ameliorate the achievement gap between these students and their more advantaged peers (Ladd, 2012). Experiential education programs may provide students who struggle in the classroom context or disadvantaged students an alternative learning environment, and a cultural fluency often only available to middle- and upper-income students, which can translate into opportunities to excel. Programs that occur off the school campus often leverage existing community cultural institutions such as museums, zoos, and theaters. 1 Despite the potential of these programs to improve the educational experience for students, particularly low-income students, and bolster academic achievement, the lack of rigorous research about experiential education makes it difficult for programs to withstand the pressures of the current testing-focused environment.
Although evaluations of some experiential education programs have found positive associations between program participation and a range of student outcomes in the short run, there is little rigorous evidence to support the assumption that these programs affect student achievement. Furthermore, the previous evaluations tell us little about the long-term outcomes of program participants. Out-of-school interventions may make school administrators wary when schools are evaluated on test score gains, with curricula and the school day carefully structured to meet these standards. This article fills the gap in the literature about whether and how experiential education programs affect academic outcomes by evaluating the impact of School in the Park (SITP), a museum-based educational program in San Diego, on both short- and long-term student outcomes. As discussed below, it is rare to have longitudinal data on the impact of an experiential education program. We test for the benefits of SITP using a standard difference-in-differences framework that takes advantage of the staggered implementation of the program across two elementary schools.
Literature Review
The body of research on arts and science programming that happens outside the classroom is limited, and very few studies focus specifically on museum-based education. A meta-analysis of research on the impact of arts programs on academic achievement found only 31 studies to analyze, only one of which was published in a peer reviewed journal (Winner & Cooper, 2000). Among the studies that have attempted to assess the impact of arts learning, there is some indication that high-quality arts enrichment programs may increase the school readiness and educational attainment of students in these programs (Brown et al., 2010). However, these studies suffer from methodological limitations that hamper the authors’ ability to isolate program impacts and limit the generalizability of the results. Specifically, most programs operate on a volunteer basis, making it difficult for researchers to control for selection bias introduced when some students select to participate and others do not. SITP presents a unique opportunity to avoid this common problem. Within the two schools where SITP is offered, all students in the grades served participate in the program; therefore, selection bias is less of a concern.
Recent work by Kisida et al (2016; Bowen et al., 2014) significantly advanced the museum education literature by providing experimental evidence of the impact of single museum visits on student critical thinking outcomes. Using stratified random assignment of school groups to museum visits, the authors were able to convincingly isolate the causal impact of a single visit to an art museum on short-term measures of student ability to critically examine a work of art. The group also found that the museum visits had larger impacts on a range of outcomes, including historical empathy, tolerance, and interest in art museums, for students from rural and high-poverty schools, compared to other students (Kisida et al., 2014; Kisida et al., 2016). Although these studies have greater internal validity than most of the other empirical work on museum education, the treatment was only a single visit, and the control group visited the museum shortly after the treatment group, so the authors were unable to maintain randomization to measure longer term outcomes. However, the findings suggest that even a single museum trip can affect how students process information and think critically—skills that may be correlated with academic achievement, in both the short and long term.
Given the emphasis on test outcomes, museums and school educators have made efforts to expand museum-based experiences beyond one-off guided tours and link these experiences more closely to school curricula. Thus far, only a handful of studies have evaluated the impacts of museum enrichment programs for students. These programs vary significantly in terms of their methods and duration. While some involve multiple visits to a museum, the Hands-On Museum’s program in Ann Arbor takes place exclusively in the students’ school, and programs at the Museum of the City of New York and the Peabody Museum of Natural History consist only of onetime field trips. A science program based out of a Los Angeles County natural history museum involves only a single visit to the museum itself, though the program includes eight additional after-school sessions led by museum educators. Similarly, although the Guggenheim’s program in New York City includes three museum visits, it is predominantly based in the school, with twenty 90-minute sessions led by an artist in residence in the classroom during the course of the school year. Finally, the Urban Advantage program, evaluated by Weinstein et al. (2014), provides intensive museum-based teacher professional development for middle school science teachers in New York City. The authors found that the program improves student achievement on science exams in middle school, but the effects do not extend to high school.
The outcomes measured by evaluations of these programs vary substantially. Some studies measure gains in student knowledge of specific content areas, while others focus on improvements in student attitudes toward subjects. Museum enrichment programs, including those that take place mainly or exclusively in classrooms via partnerships with museums, are associated with improved student attitudes toward the subject at hand (Melber, 2003; Paris et al., 1998; Randi Korn & Associates, 2010). They are associated with improvements in students’ content knowledge (or their perception of their content knowledge) of the subject matter (Melber, 2003; Paris et al., 1998; Randi Korn & Associates, 2010), although some single–museum visit programs with no follow-up instruction either in a museum or a classroom see only modest effects (Cox-Petersen et al., 2003). Some evaluations report improved student problem solving skills after participation (Paris et al., 1998). In most of the evaluations that utilize control groups of similar students or randomly assign the treatment, participating students scored higher on critical thinking evaluations than peers who did not participate (Bowen et al., 2014; Burchenel & Grohe, 2007; Downey et al., 2007; Kisida et al., 2016). One study measures achievement using standardized test scores and finds no statistically significant difference between participants and nonparticipants (Adams et al., 2006). Many of these studies are cross sectional and report only short-term outcomes. A key advantage of the current study is the ability to provide information on longer term outcomes.
Description of the Program
School in the Park is an educational program designed for third-, fourth-, and fifth-grade students held in the cultural institutions and museums of San Diego’s Balboa Park. Participating institutions include the San Diego Museum of Art, the History Center, the Natural History Museum, the Museum of Man, the Junior Theater and the Old Globe Theater, the Reuben H. Fleet Science Center, the Air and Space Museum, the Museum of Photographic Arts, and the San Diego Zoo. 2 The program’s stated goal is for students to experience “visual, auditory, and kinesthetic information” and to provide students with a “foundation of knowledge and a context in which to place new material” as they progress in school (SITP, n.d.). The program has developed an explicit focus on “academic excellence” aimed at helping students excel in school and in the future. To this end, the program’s curriculum initially combined topics appropriate for the lessons at each particular institution with state standards and that are now aligned with Common Core and Next Generation Science Standards (Feldman et al., 2010; Higdon et al., 2017, 2018). Students visit a combination of the institutions specific to SITP’s curriculum for that particular grade level. They do not visit all the institutions every year. Students spend a week at each institution (Higdon et al., 2018) and up to 25% of their instructional year away from their home school (Pumpian et al., 2005). 3 At the institution, museum educators lead instruction with classroom teachers assisting with various learning activities (SITP, n.d.). On a typical day, students arrive at the park at 8:40 a.m. following a 20-minute bus ride that is used for instructional time (Pumpian et al., 2005). Museum educators then lead the first 2 hours of instruction using exhibit areas and classroom space within the museums. The classroom teacher leads the instructional periods before and after lunch, and students return to their school by bus at 1:40 p.m. Examples of programming include a lesson on geometric shapes at the San Diego Art Institute; an exploration of the Renaissance period through painting, costumes, and dramatic play at the Museum of Art; lessons on math and science through an exploration of ancient Egypt and the human skeletal system by measuring mummy bones at the Museum of Man; and a unit on air travel and aerodynamics through studying life-size models of spacecraft at the Air and Space Museum and designing and test-flying their own gliders (Pumpian et al., 2005). Each curricular unit is mapped to state learning standards and goals. The program’s stated mission is to “cultivat[e] curiosity, competence, confidence, and character” among students through authentic learning activities.
During the period of study, students in two inner-city public elementary schools, Rosa Parks and Alexander Hamilton Elementary, participated in SITP activities at Balboa Park for up to 8 weeks (see Appendix A). Both schools are located in the City Heights neighborhood of San Diego, which is a major refugee portal for families from Somalia, Cambodia, Vietnam, Iraq, and Liberia, among other counties, and a destination for immigrants from Latin America. In addition to serving a large refugee and immigrant student population, many of the students who attend these two schools are low-income. In the San Diego Unified School District (SDUSD), 59.4% of school children qualify for free or reduced-price lunch (SDUSD, n.d.), while at the two participating elementary schools over 90% of the students qualify (California Department of Education, 2016). 4
SITP was initially developed in response to overcrowding at Rosa Parks in the late 1990s. The lack of space for instruction prompted administrators to think about how to utilize other community spaces to serve all of the City Heights students. Over time, the program has evolved, hiring full-time staff and museum educators to partner with teachers, expanding to Alexander Hamilton Elementary, and developing curricula for the program that align with district academic standards. Today, district administrators are questioning the ongoing utility of the program. Is it best for students to spend valuable class time outside the classroom, when they could be practicing skills that will appear on the annual standardized exams? Does the program cause struggling students to fall further behind? Is the district getting the most utility out of teachers who are paid even when museum educators are providing instruction? These questions can only be answered with a systematic evaluation of the program.
Research Questions
This article evaluates the impact of SITP participation on short-term and long-term academic and behavioral outcomes using longitudinal student-level data, the natural variation in the timing of program implementation between the two schools, and control groups of students from nearby schools that did not receive the program. The study addresses two primary research questions:
Theory
Experiential education programs like SITP aim to utilize nontraditional strategies to promote learning and to broaden students’ understanding of the world. A conceptual paper by the American Alliance of Museums describes museum-based educational programs as providing “vital, experiential, multi-modal and trans-disciplinary educational opportunities . . . more than the ancillary field trip” (Kratz & Merritt, 2012). The creators of the SITP model built directly on the main tenants of educational theory (Pumpian et al., 2005). They incorporated elements of Constructivism, which holds that learning is a social process requiring students to bring their own personal experience to bear as they “construct” new meaning (Dewey, 1916). Key elements of this theory are inquiry-based education and educational experiences that take place outside of the traditional classroom. A model of the impact of museum experiences on students influenced by Dewey is structured as an educational cycle where students bring previous knowledge from their lives to the initial museum experience; the museum triggers reflection and inquiry, generates new problems and interests, and opens new lines of inquiry; and these new experiences and interests are applied to the student’s life beyond the museum (Hein, 2004). As stated by Gardner (1991), museums have “the potential to engage students, to teach them, to stimulate their understanding, and most important, to help them assume responsibility for their own future learning” (p. 202). Furthermore, SITP aims to have long-lasting effects through building students’ cultural capital (Pumpian et al., 2005). Differences in student achievement between demographic groups may be explained in part by the differences in prior knowledge they bring to learning experiences (Marzano, 2004). By bridging formal and informal learning (Eshach, 2007), SITP aimed to provide structured, scaffolded learning experiences for students outside of the classroom environment, which nonetheless help them meet rigorous academic standards in the short run, and have long-lasting effects over their lifetimes.
Building from these ideas, the conceptual model in Figure 1 presents the hypothesized impact of participation in SITP on short-, medium-, and long-term student outcomes. Inputs into the program include the characteristics and prior experiences of students and teachers, and the school context in which students and teachers generally operate. Exposure to different cultures, ideas, and fields through time in the Balboa Park institutions and the curricular units designed to complement these experiences comprise the outputs of the program. These activities are hypothesized to affect students in the short, medium, and long term. Specifically, in the year of participation in SITP, the process described by Dewey (1916) above may result in improved engagement both during SITP and during regular class instruction. Students may also attend school more frequently because they want to participate in the program. As a result, students participating in the program may achieve higher scores on standardized exams in that year, and may be less likely to be retained, suspended, or expelled from school.

Conceptual model of School in the Park impact.
Alternatively, we may expect a negative or no immediate impact of participation. If the museum education program affects cognitive and behavioral skills that develop over time, the experience may not translate into higher test scores immediately following participation in the program. These types of impacts may only appear over time, as the elementary school participants grow and reflect on those experiences, and have other opportunities to apply new skills. If this is the case, we may expect to see no impact on short-term outcomes.
At the same time, it is possible that participation in the program may have negative effects on achievement for students who are already struggling academically. These students may be better served by spending more time in the classroom and receiving remedial instruction, rather than attending a multiweek unit at Balboa Park. For all of these plausible reasons, the expected direction of the impact of the program on short-term outcomes is ambiguous.
A hope of a program such as SITP is that any benefits of exposure to new concepts and cultures extend beyond the year of participation if students incorporate these new perspectives into their lives. These “broader horizons” might change students’ relationships to museums (Randi Korn & Associates, 2004) and culture (Kisida, Greene, & Bowen, 2014) as well as how they envision their future options, including college attendance and possible careers. One way this may be observable is if the impact of participation in SITP lasts into the high school years. In Figure 1, immediate improvements in engagement, achievement, and behavior are hypothesized to influence academic and behavioral outcomes in middle school and high school and college preparation and enrollment. Even if the program has limited short-term outcomes, the benefit of participation may appear later on, as students use the new motivation and skills learned in the program to persevere through high school and set higher postgraduation goals.
Research Design
To answer the question of how participation in the SITP program affects the academic and behavioral outcomes of students, a standard difference-in-differences framework is employed (see Cannon et al., 2011, for an application of this technique) that takes advantage of the fact that the program was implemented in the two schools at different times. In essence, the research design compares changes in outcomes for students who participate in SITP (before and after participation in the program) to changes in outcomes for students who do not participate. The rich data from the SDUSD allow the development of better control groups than past studies and measurement of short-term as well as long-term outcomes like graduating from high school.
Equation 1 models short-term academic and behavioral outcomes as a function of participation in SITP, time-varying student characteristics, student fixed effects, and school fixed effects, using individual-level panel data:
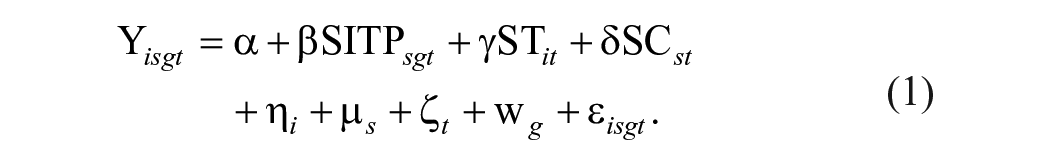
In Equation 1, Y isgt represents the dependent variable for student i in grade g and school s at time t; SITP sgt is a dichotomous variable indicating whether the child attended the SITP program; ST it is a vector of time-varying student characteristics; and SC st is a vector of school characteristics for the school the student attended. In addition, the model includes a student fixed effect (η i ), school fixed effect (µ s ), a time fixed effect (ζ t ), a grade fixed effect (w g ), and an error term (εisgt). The inclusion of the school and time fixed effects allow us to avoid confounding the impact of SITP with other changes that may be happening in the schools at a particular point in time. Furthermore, the student fixed effect controls for all time-invariant characteristics of the student, such as underlying motivation, parental support in the home, or other factors that may affect achievement.
For the long-term outcomes, ordinary least squares and linear probability models are estimated, as shown in Equation 2:

The structure of the data set used in Equation 2 is cross-sectional, with one observation per student. In this equation, Y isg represents the dependent variable for student i in school s in grade g; SITP sg is a dichotomous variable indicating whether the child ever attended the SITP program in third, fourth, or fifth grade; ST i is a vector of student characteristics (including second-grade achievement); and HS s is a vector of dummy variables for the six high school programs that draw upon the elementary schools in our study sample. 5 The remainder of the students are scattered in other high schools throughout the SDUSD. In addition, the model includes a school fixed effect (µ s ) for the elementary school attended, a series of dummy variables for the year the student was in third grade (ζ t ), and an error term (ε isg ). The controls for the third-grade year capture any cohort effects that may affect later outcomes in high school, such as changes in the quality of SITP over time. Standard errors are clustered at the elementary school level.
Identification of the effects on student achievement and behavioral outcomes comes from three primary sources. First, we compare students within Rosa Parks and Alexander Hamilton Elementary schools that did not receive the program, with students from those same schools that received the program in later years (within-treatment cohort comparison). Second, we compare students in Rosa Parks to students in Alexander Hamilton Elementary over the period in which students in Rosa Parks received the program and Alexander Hamilton did not (within-treatment school comparison). This second comparison is particularly important because both schools may have received some resources from other Price Charities investments in the community that could also be affecting achievement independent of the SITP program. Finally, we compare students in these schools to students in comparable schools in SDUSD that do not receive this enrichment program (i.e., other schools in the Hoover High School system, and the schools in the Crawford High School system; control school comparison). A remaining necessary assumption for the identification of a causal impact of SITP is that parents with students who may be stronger do not select into Rosa Parks or Alexander Hamilton elementary simply because the program exists at the schools. 6
Data
We utilize administrative student records from the SDUSD, which includes student-level demographic information, behavioral records, and measures of academic performance. We also have school-level measures of school size and type, and student poverty.
The impact of participation in SITP on individual students is modeled over time, controlling for student demographic characteristics as well as characteristics of their peers, classrooms, and schools. To do so, we leverage student-level academic records from 1996 to 2012 for students in the Hoover High School feeder system (which includes the treatment group) and the schools in the adjacent Crawford High School system (to serve as a control group). All students who stay within the SDUSD are followed through high school, regardless of the schools they attend following elementary school. Furthermore, comparing students in the schools that receive the program to their school peers enhances our ability to distinguish program impacts from characteristics of schools. As expected, not all students that begin in our study schools will conclude their education in SDUSD. The issue of attrition will confound the analysis only if there are systematic differences between those that have participated in SITP and left the school district and those that did not participate in SITP and left the school district.
The length of the program instruction in the museums and cultural institutions of Balboa Park varies across program years, largely due to funding constraints on the SITP program. Following the primary analysis, we estimate dosage models to understand whether the length of time a student participates in the program moderates the effect of SITP on student outcomes.
Measures
The student-level data sets were merged together using unique student identification numbers, school year, and school codes. From this large, longitudinal data set, we created multiple measures for the analysis. The multiple short-term academic outcomes include the probability that students take the standardized exams, the actual scores achieved on those exams, and whether the student performs at or above the standard set by the state.
In the 2001–2002 school year, California changed the standardized test used throughout the state from the SAT9 to the California Standards Test. This makes it difficult to compare results for students over time. Therefore, we have created a standardized test score measure that compares student performance to that of their grade level peers each year. These z-scores have a mean of zero and a standard deviation of 1. During the 2001–2002 school year, both the SAT9 and California Standards Test exams were conducted. For the students who took both exams, we calculated z-scores and then examined how highly correlated the scores were in that year. We find that the z-scores for the two exams are highly correlated—the English language arts (ELA) z-scores are correlated at .894 and the math z-scores are correlated at .878. Therefore, in the models that span the period of time where both exams were given, we rely on the z-score measures of performance.
Following the examination of test scores, we consider whether SITP influences grade retention in the third, fourth, or fifth grades and two short-term behavioral outcome measures—the number of absences in the current year and the number of suspensions in the current year.
As mentioned earlier, one of the aspirations of the SITP program is that the impacts extend well beyond the school year in which the student participates in the program. We investigate longer term outcomes for students as they reach middle school and high school. Three measures explore middle school behavior and achievement—the number of suspensions and expulsions in middle school, and whether the student is retained by the eighth grade. For a subset of students who participated in SITP prior to 2005, we observe progress through high school. For these students, we measure whether they have been retained in high school, whether they have taken an Advanced Placement course or the SAT test (markers for intended college attendance), their SAT scores, whether they pass the California High School Exit Examination, a requirement for graduation, whether they graduate with a diploma or earn a GED, their college enrollment, and whether they attend a 2-year or 4-year college.
We constructed two dropout measures to estimate the impact of SITP on the probability of dropping out of high school (see Appendix B). These measures include only students who are old enough to have enrolled in high school. The “least inclusive” dropout measure includes only students that the District coded as “dropouts.” This results in a dropout rate of 2.11% (out of the total number of students who are old enough to attend high school). The most inclusive measure includes the students coded by the District as dropouts as well as the students who we do not observe completing high school in the data. Students who ultimately received a GED or diploma were coded as nondropouts even if they had previously dropped out. This most inclusive measure may include some students who transfer successfully to other schools but whose transfer was not recorded by the district. The most inclusive measure results in a dropout rate of 22.05%, a much more realistic rate based on national and statewide averages. 7 While the group we have identified as dropouts has a higher average 10th-grade ELA test score than the group labeled by the district as dropouts (−0.210 SD, −0.168, if the district identified dropouts are excluded, compared to −0.600 SD, respectively), their average score is substantially lower than the 10th-grade scores of high school graduates (SD = 0.342), leading us to believe that these struggling students are likely not finishing high school. While we acknowledge this measure to likely be an overestimate of the number of students who dropout, we feel it is more representative, and therefore we report results for the most inclusive dropout measure.
In addition to these outcome measures, the models include a comprehensive set of control variables at the individual, classroom, and school levels. Individual-level controls include measures of gender, race and ethnicity (Black, Hispanic, Asian, White, or other race), English language learner status, special education status, and whether the student moved schools in the current year. The models also control for students’ birth country. Students who were born in Burma, Iran, Iraq, or Somalia are designated as refugees, as these countries have been the largest providers of refugees to the San Diego area. Those born outside of the United States in countries other than those four are classified as nonrefugee immigrants (referred to as immigrants throughout the rest of this article). Those born in the United States are classified as natives. It is important to note that studies of immigrant and refugee youth generally include children born in the United States to immigrant or refugee parents in addition to those born in another country. As the parental birth countries of the students in this sample are unknown, students who would typically be classified as immigrants or refugees are included in the native group. Finally, at the school level, we control for the percentage of students eligible for free or reduced-price lunch (a proxy for poverty), total student enrollment, whether or not the school is a charter school, and the years in which a school health clinic existed at Rosa Parks in the short-term models. In the high school models, we control for whether or not the student attended Clark Middle School, Hoover, or one of the Crawford High Schools; whether or not the high school was a charter school; and whether the student moved in elementary or middle school.
Sample
The analytic sample is restricted to students in Grades 2, 3, 4, or 5 at Rosa Parks, Alexander Hamilton, or one of the other elementary schools in the Hoover High School or Crawford High School system between the 1995–1996 and 2011–2012 school years. Schools are included in the comparison group if we observe at least 10 students in the school in a given year. The sample size changes by the outcome measure of interest because there is a smaller sample of students for which we observe high school outcomes. In the short-term models, the first year of implementation at Rosa Parks, the 1999–2000 school year, is omitted from analysis because only half of the students in the third grade received the program that year. 8 In the long-term models, there is only one observation per student so all of the 1999–2000 Rosa Parks third graders are coded as having received the program. 9
Results
Descriptive Statistics
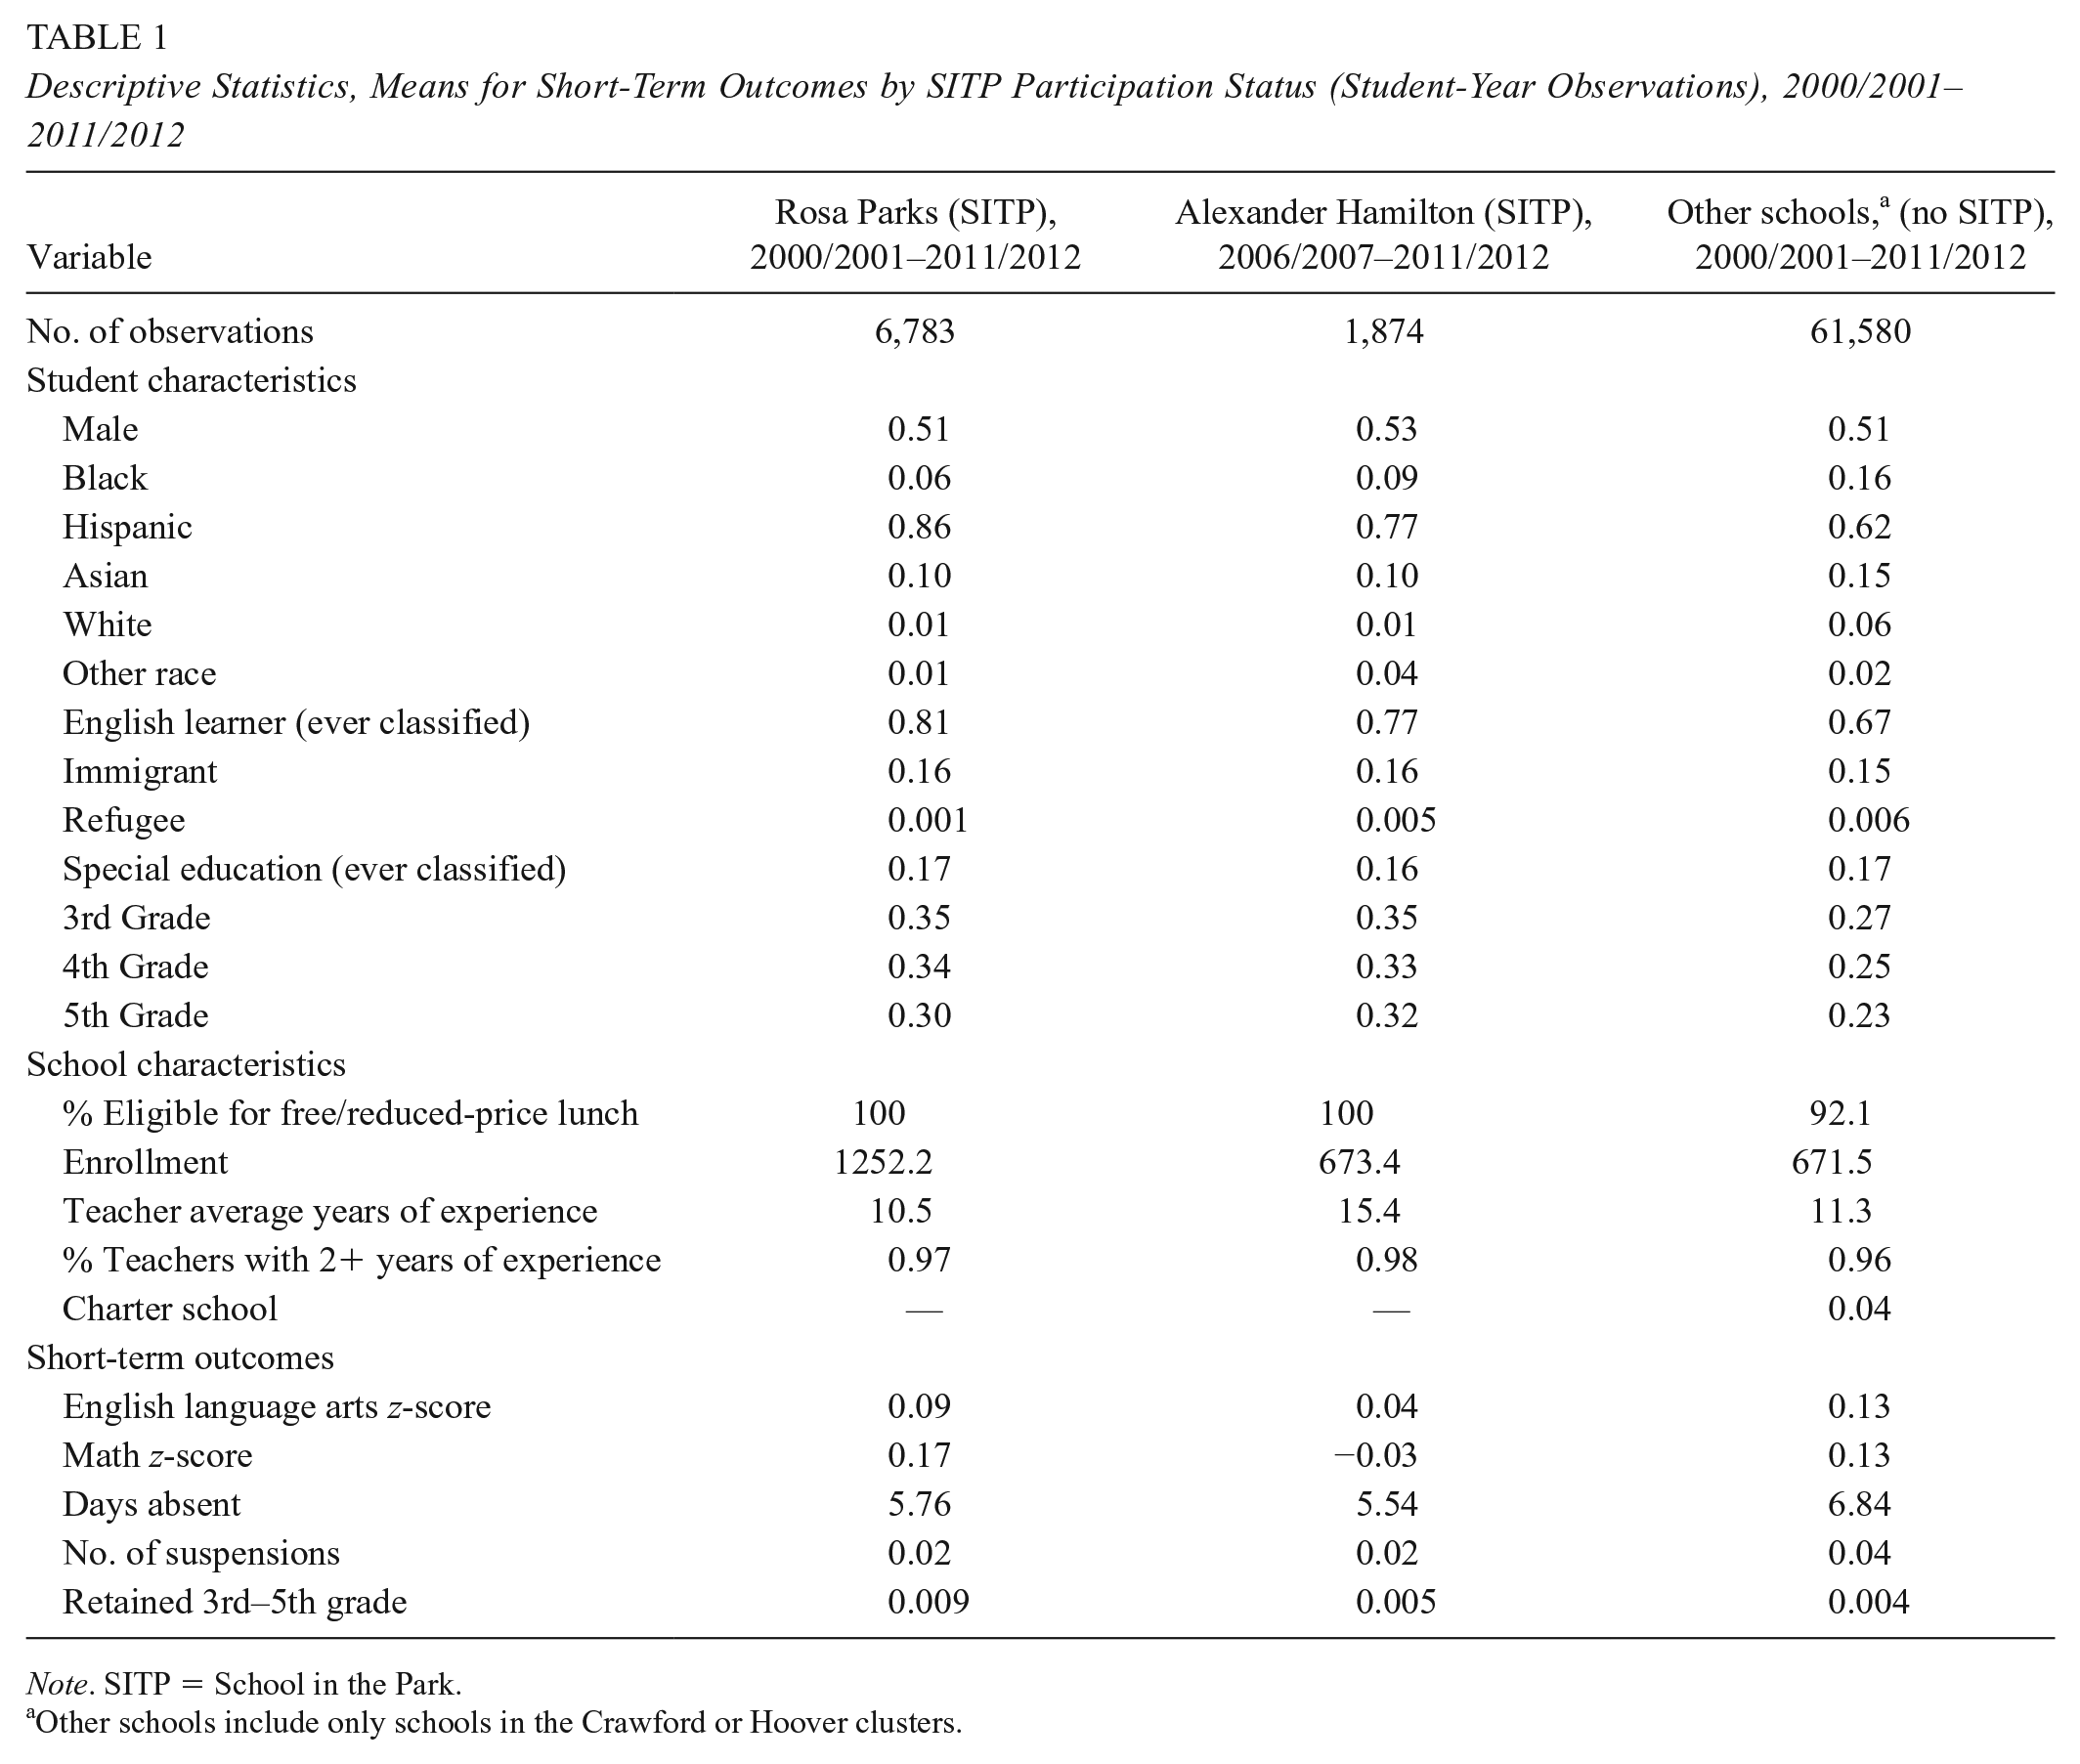
Table 1 presents mean descriptive statistics of the students who attended Rosa Parks between the 2000–2001 and 2011–2012 school years (and received SITP), those who attended Hamilton between 2006–2007 and 2011–2012 school years (and received SITP), and those students who attended the control schools in the Hoover and Crawford High School systems between 2000–2001 and 2011–2012 (who never received the program). Both the Rosa Parks and Hamilton SITP samples are majority Hispanic. While the control group also consists of a Hispanic majority, Hispanic students make up a smaller share of the student population than in either Rosa Parks or Hamilton (59% in the control schools, 80% at Rosa Parks, and 75% at Hamilton). The control group is nearly 18% Black and 14% Asian, whereas Rosa Parks and Hamilton are 7% and 10% Black, respectively, and both are 10% Asian. Students classified as English language learners make up a larger share of the student body at Rosa Parks and Hamilton than the control group average. On all other demographic measures, the treatment schools are comparable to the control schools.
Descriptive Statistics, Means for Short-Term Outcomes by SITP Participation Status (Student-Year Observations), 2000/2001–2011/2012
Note. SITP = School in the Park.
Other schools include only schools in the Crawford or Hoover clusters.
The two schools have roughly the same percentage of teachers with over 2 years of teaching experience as the control group. Rosa Parks and Hamilton also have student populations that are 100% free or reduced-price lunch–eligible whereas the control group population is 93% eligible. Rosa Parks is a larger school, serving nearly 1,300 students on average, compared to Hamilton’s 700 students and the control group’s 800 students on average.
Test-taking rates across all of the groups are high: 92% to 94% on average. Rosa Parks and Hamilton SITP students’ rate of taking standardized tests are on par with that of the control group. However, students in the control schools outperform students at Rosa Parks in both their language arts and math test z-scores, and Rosa Parks students outperform Hamilton students. Students in both treatment schools experience fewer absences (5.8 and 5.5 absences vs. the control group’s 6.7) and fewer suspensions (0.019 and 0.017 compared to 0.044) than the control group.
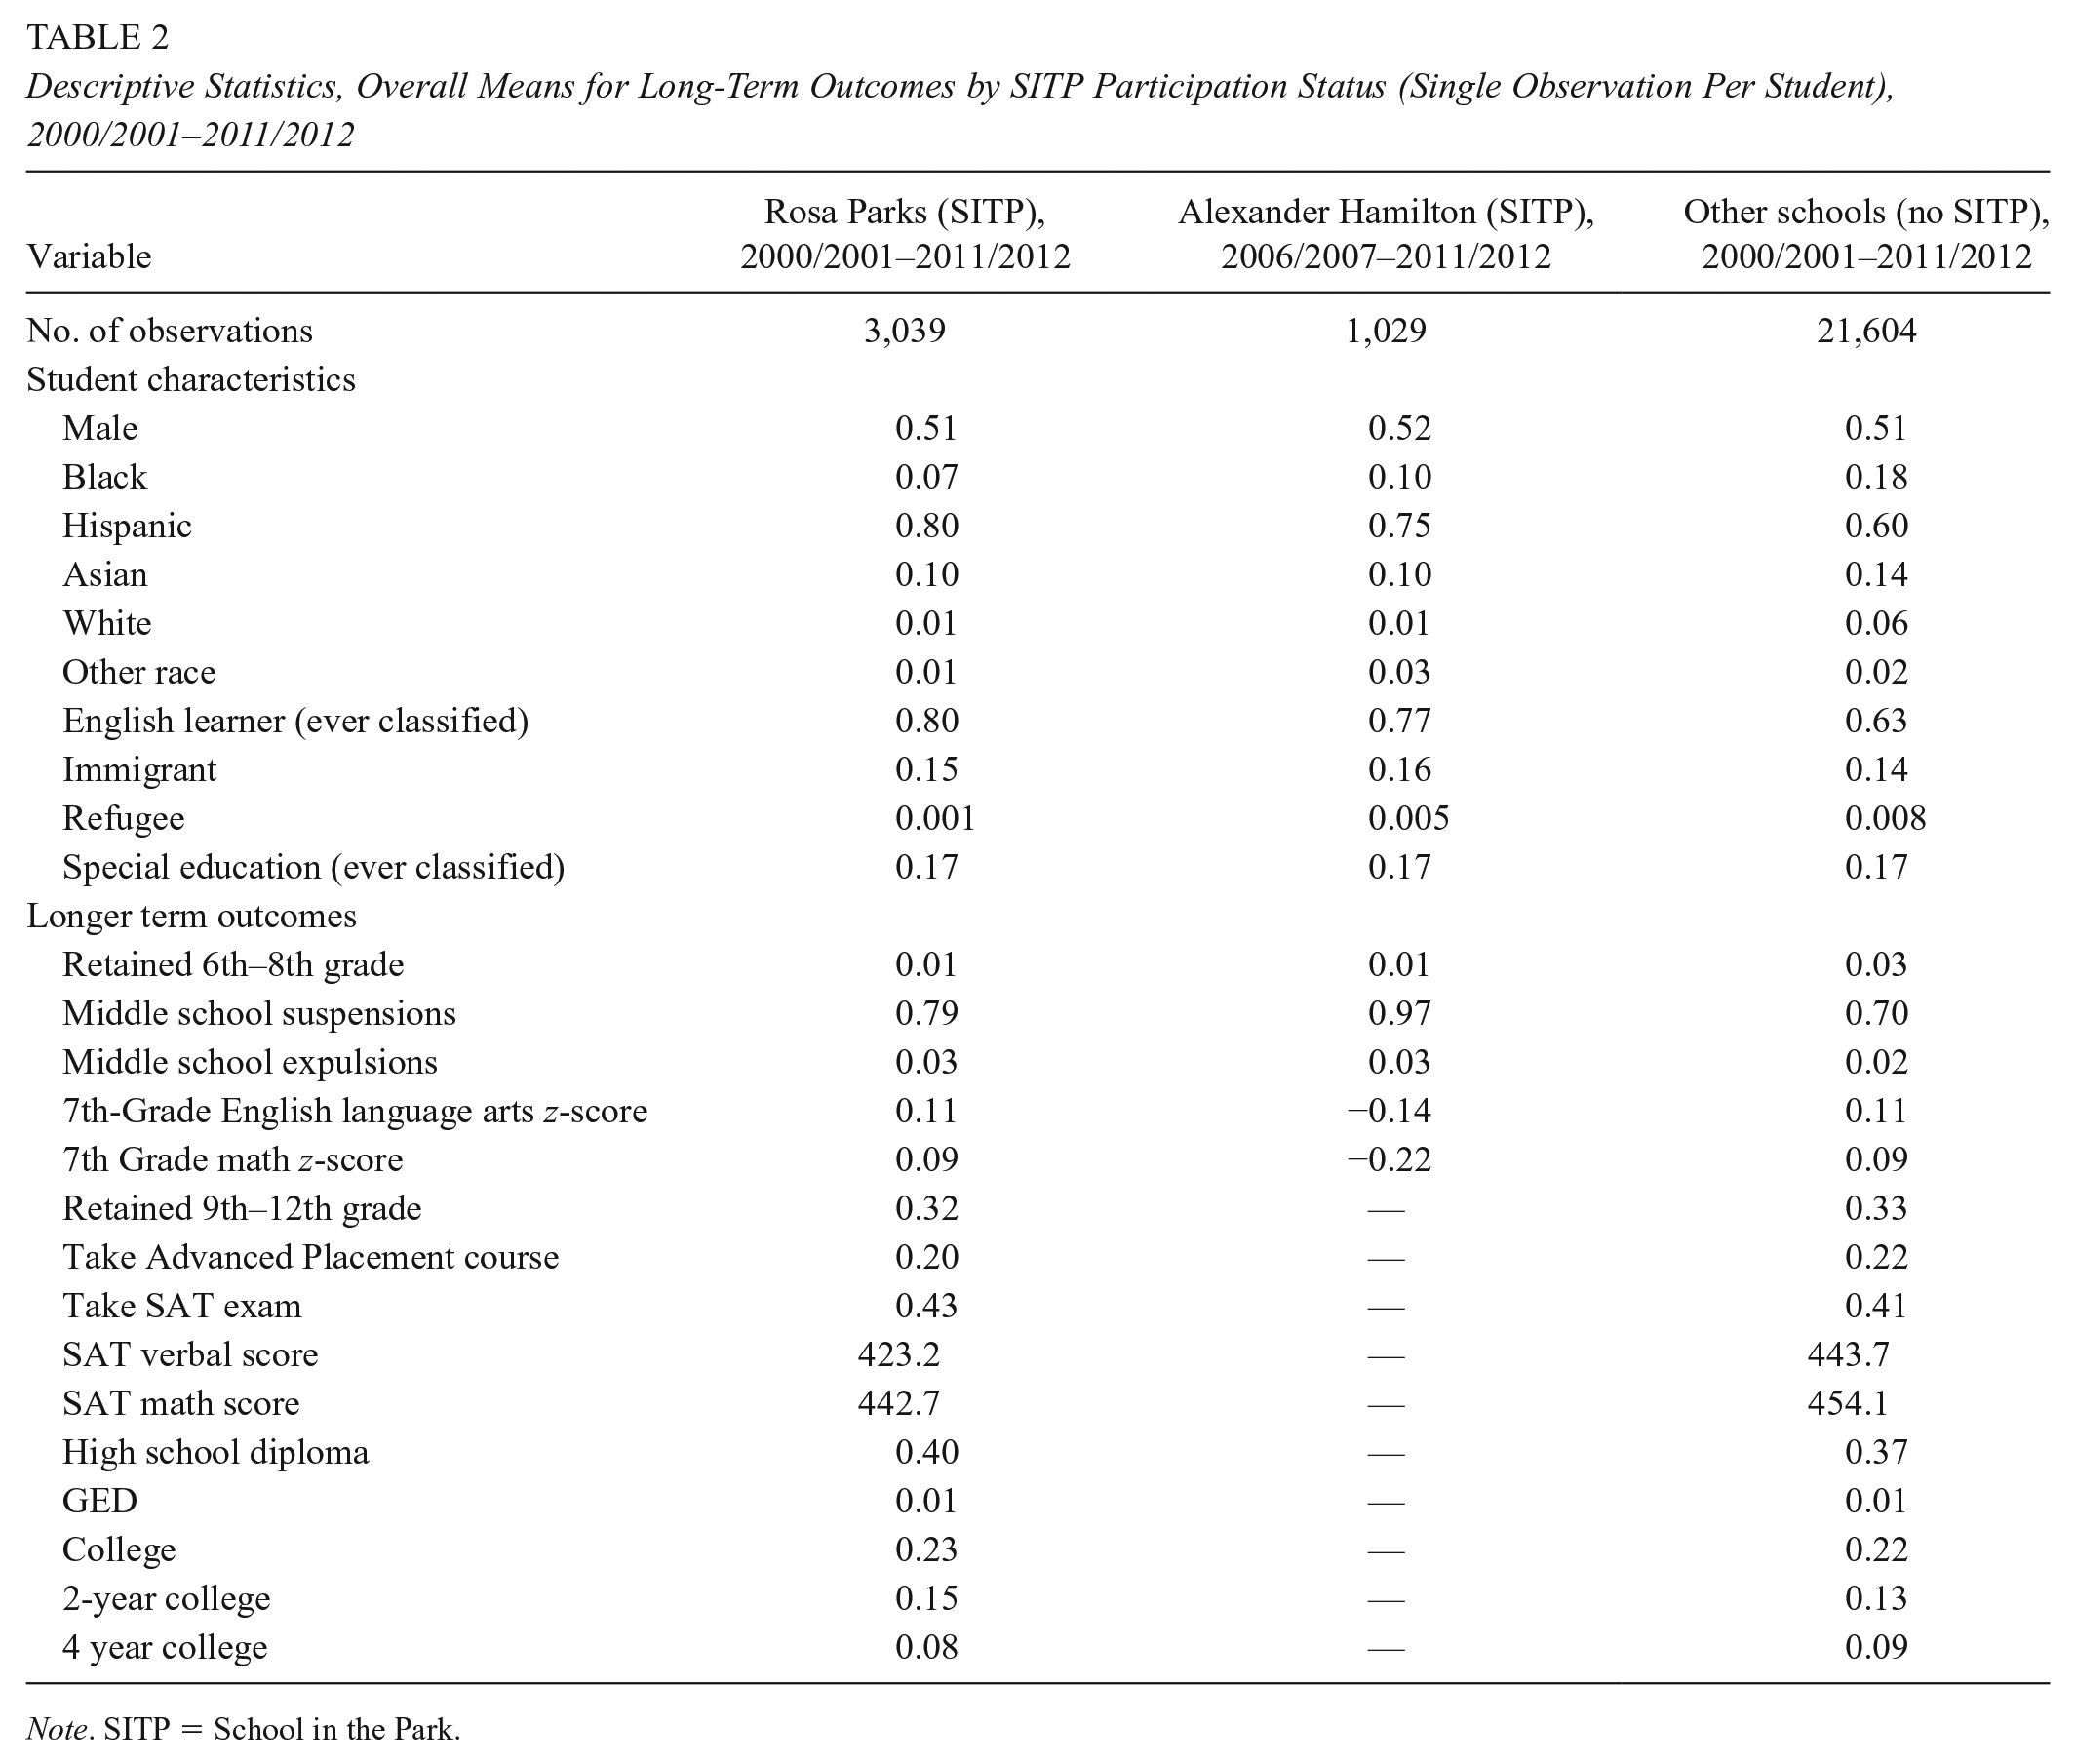
During middle school, Rosa Parks and Hamilton SITP students have similar numbers of suspensions and expulsions, which are higher than the control group’s averages (Table 2). Students at Rosa Parks and in the control group have comparable average math and language arts test z-scores in seventh grade and substantially outperform students from Hamilton.
Descriptive Statistics, Overall Means for Long-Term Outcomes by SITP Participation Status (Single Observation Per Student), 2000/2001–2011/2012
Note. SITP = School in the Park.
For the high school outcomes, we compare only the students who participate in SITP from Rosa Parks students to the control group, as even the oldest Hamilton students who participated in the first year of the program are not yet old enough to have completed high school (Table 2). Rosa Parks students have similar rates of high school suspensions, expulsions, grade retention, and dropouts as the control group. Of students who attended SITP at Rosa Parks, 20.4% take an Advanced Placement course at some point in high school compared to 22.3% of students who attended the control schools as elementary students. The share of students who graduate with a diploma and who take the SAT is similar across the treatment and control groups, although in both cases Rosa Parks students have slightly higher rates of both.
Attrition
One concern in this analysis is that we can track only students within the SDUSD. If students who were relatively disadvantaged were more likely to leave the district, and the sample, before their middle or high school outcomes could be observed, then the estimated impact of SITP would be biased upward. This is an especially relevant issue in a community with a large immigrant and refugee population. The sample provides mixed evidence for this concern. While students who participated in SITP and left the district in middle school were significantly more likely to be Hispanic and classified as English language learners and less likely to be White or Black than those who left who had not participated in SITP, this was also true of SITP participants who stayed in the district during middle school when compared to non-SITP students who also remained (see Appendix D). There were no differences in the second-grade test scores of SITP and non-SITP middle school leavers, and in fact among those who stayed, SITP participants had lower second-grade language arts and math test scores. There were no differences in the second-grade math scores among high school SITP and non-SITP leavers. While the second-grade language arts test scores of SITP participants who left in high school were lower than those of their non-SITP leaving peers, this was also true when comparing SITP participants who were present in high school to non-SITP stayers. SITP participants who were not present in high school were more likely to have experienced a suspension than their non-SITP leavers. Both leaver and stayer SITP participants were less likely to have been retained in middle school than their non-SITP peers. Thus, while there is some evidence that SITP participants who left the sample were more disadvantaged than their non-SITP leaver peers, on most measures there was either no difference between SITP and non-SITP leavers or the difference was consistent across both SITP leavers and stayers.
Short-Term Models
The first set of models in Table 3 present the impact of participation in SITP on outcomes in the year of participation. These models utilize panel data and include individual student fixed effects. We find that participation in SITP results in significant increases in standardized test scores in the year of SITP participation. Rosa Parks SITP students score 0.1 standard deviations higher on the standardized math exam, compared to comparison group students in the same year. SITP participation at Hamilton results in an increase in the likelihood of taking of both the language arts and math exams, as well as a 0.07 standard deviation increase in language arts scores. Furthermore, SITP participation at both schools reduces suspensions. There is no difference in absences between the SITP and comparison groups but a small increase in the probability of being retained in the third, fourth, or fifth grades for Hamilton SITP students.
Short-Term Academic Outcomes (1996–2012, Omit 2000)

Note. Robust standard errors in parentheses. SITP = School in the Park; ELA = English language arts; EL = English learner; FRL = free or reduced-price lunch; FE = fixed effect.
p < .01. *p < .05.
One concern that has been expressed by some educators is that students who are already struggling in school would be adversely affected by an extended period of time outside the classroom to participate in SITP (SDUSD staff, personal communication, 2013). To investigate this issue, in Table 4 we present the short-term results stratified by whether the student passed or failed the second-grade standardized language arts or math exams. Consistent with the previous findings, we find no impact of SITP on language arts scores for students who passed and students who failed their second-grade language arts exam at Rosa Parks. In other words, participation in the program does not appear to hinder the achievement of students struggling in second grade compared to similarly struggling students in comparison schools. Furthermore, the program positively affects math scores for Rosa Parks students who passed the second-grade standardized math test and those who failed it, compared to students with the same second-grade performance in the comparison schools. For Hamilton students, the impact of SITP on language arts scores is concentrated among students who failed their second-grade language arts test, with no effect on students who had passed the second-grade exam. Despite the improvement in language arts scores, SITP students at Hamilton who failed their second-grade math test were slightly more likely to be retained between the third and fifth grades, than comparison group students.
Short-Term Outcomes, Stratified by Second-Grade Test Pass or Fail (1996–2012, Omit 2000)

Note. Robust standard errors in parentheses. ELA z-score models (Columns 1 and 2) are stratified by 2nd-grade ELA test score results, while the rest of the models are stratified by the results of the 2nd-grade math test. Models also control for current EL status, special education status, moved schools, % of student body eligible for free lunch, total enrollment, charter school, and health clinic. SITP = School in the Park; ELA = English language arts; EL = English learner; FE = fixed effect.
p < .01. *p < .05.
Another hypothesis is that experiential education, if conducted in a culturally relevant way, may reach immigrant and refugee students more effectively than traditional educational models. This hypothesis is based on the notion that students bring their prior knowledge to museum experiences, and that the museum generates reflection and inquiry and stimulates new interests, which are carried into students’ outside lives (Hein, 2004). Thus, while immigrant and refugee students’ knowledge of their own cultures may be underutilized in a typical classroom setting, museums may offer these students the opportunity to engage with material more effectively. In order to explore this possibility, we stratify the short-term results by whether the student is a refugee, immigrant, or native-born (see Appendix E). While refugees at Rosa Parks who participated in SITP were more likely to take both language arts and math exams, there were no other significant impacts associated with participation for refugees at Rosa Parks and Hamilton. However, SITP participation among immigrant students at Rosa Parks led to a 0.09 standard deviation increase in their math scores though their Hamilton counterparts experienced a 0.10 decrease. Immigrant students at both Rosa Parks and Hamilton were slightly less likely to be suspended and slightly more likely to be retained between the third and fifth grades. Immigrant students participating in SITP at Rosa Parks also experienced a reduction in their school absences.
Cumulative Weeks Analysis
Changes over the course of the program’s existence led to variation in the amount of time students participate in the program by year and grade (see Appendix A). If participating in SITP generates positive short-term outcomes, students who spent more time in the program may reap larger benefits. Therefore, we analyze the impact of the total number of weeks of SITP participation. One of the reasons that many other museum enrichment programs analyzed in the literature have no impact may be because they simply do not provide enough exposure to the enrichment activities. Our SITP dosage findings provide some initial evidence that this is in fact true. In the short-term, the results depicted in Table 5 indicate that each additional week of SITP participation for students who attended Hamilton is associated with a small (less than 1%) but significant increase in the likelihood that students took their language arts and math standardized tests. At Rosa Parks and Hamilton, each additional week of SITP programming increases student ELA test scores by 0.004 and 0.006 standard deviations, respectively. Given the average length of participation in SITP per year is 7.68 weeks, these coefficients translate into 0.031 and 0.046 standard deviation increases in ELA scores, on average. 10 The marginal week of SITP participation is also associated with a less than 1% decrease in the likelihood of being held back at Rosa Parks and a decrease in suspensions at Hamilton. 11
Cumulative Week Analysis, Short-Term Outcomes (1996–2012, Omit 2000)

Note. Robust standard errors in parentheses. Models also control for current EL status, special education status, moved schools, % of student body eligible for free lunch, total enrollment, charter school, and health clinic. Total SITP weeks is the cumulative number of weeks of SITP programming a student has received in each year. SITP = School in the Park; ELA = English language arts; EL = English learner; FE = fixed effect.
p < .01. *p < .05.
Long-Term Models
The long-term models utilize a data set with one observation per student and outcomes measured through high school. All of the long-term models include elementary school fixed effects, and controls for the third-grade year cohort. There are no significant, lasting effects of participation in SITP through the high school years. Students who participate in SITP as elementary school students have outcomes in high school comparable to those students who did not participate in SITP. In Table 6, there are no significant effects of participation in SITP overall on suspensions, expulsions, or the probability of being retained in high school, dropping out of high school, taking the SAT, passing the high school exit exam, or ever enrolling in college. However, SITP participation did result in a small decrease in SAT verbal scores (Panel B). We ran an additional analysis (not included in these tables) of the effect of the cumulative number of weeks of SITP participation on high school and college outcomes and found similarly insignificant results. An additional week of SITP participation does not result in any significant outcomes for Rosa Parks SITP students. These models suggest that while the length of participation in SITP is important in the short term, by high school these benefits fade regardless of the duration of participation.
Long-Term Outcomes (1996–2012)

Note. Robust standard errors in parentheses. Models include individual student characteristics (gender, race/ethnicity, EL status, immigrant, refugee, special education, 2nd-grade ELA scores, attended Clark Middle School dummy, elementary and middle school move dummies), school characteristics (% eligible FRL, high school charter dummy), and controls for Crawford and Hoover High Schools. ELA = English language arts; EL = English learner; AP = Advanced Placement; CAHSEE = California High School Exit Examination; FRL = free or reduced-price lunch; FE = fixed effect.
p < .01. *p < .05.
Discussion and Policy Implications
Students who participate in SITP experience small short-term gains in test scores, and positive effects on behavioral outcomes (decreases in suspensions and retention). Furthermore, there is evidence of an SITP dosage effect: An increase in the number of weeks of SITP participation is associated with positive, albeit somewhat different, outcomes at both schools. However, we find no effect of ever participating in SITP on the students’ long-term academic and behavioral outcomes.
These findings support several important policy implications. First, there is no evidence that exposing students to a new learning environment in lieu of traditional class time harms their educational achievement. In fact, we observe gains for the students who are struggling prior to the program, compared to similar students who do not receive the program. The perceived tradeoff between out-of-classroom time and achievement is not grounded in the evidence from this program.
Second, in the short term, we find consistent improvement in behavioral outcomes, including a decrease in the probability of suspension. These behavioral changes might translate into improved academic achievement in the longer term. One way to invest in student achievement may be to indirectly build behavioral competencies—such as sitting still, paying attention, and speaking in turn—that will facilitate learning for years to come.
Third, although our analysis captured no lasting effects of the SITP program on academic and behavioral outcomes in high school, it should be noted that given the timing of the program and the years contained in our data, most of the long-term outcome findings are based solely on the first 4 years of the program, as only those SITP participants are old enough in our data to have completed high school. SDUSD educators indicated that the program has been redesigned substantially over time, and it may be that an analysis incorporating subsequent years would produce results more consistent with our short-term findings. Additional research in other contexts is needed to better understand if long-term impacts exist for museum enrichment programs such as SITP.
Fourth, the program utilizes existing community resources that many cities and states nationwide may also be able to access. At first, the program repurposed museum space as classroom space, when Rosa Parks was unable to accommodate all of the students in the neighborhood. Over time, the program grew to serve more students in more grades, utilizing multiple cultural institutions at Balboa Park, with teachers partnering with museum educators to provide lessons to the students. Although the program has associated costs, by leveraging existing physical resources and partnering with museum-based educators to adapt existing curricula to meet the needs of the district, the costs are potentially lower than other experiential education programs.
Overall, the program demonstrates impacts in the short term, well beyond those intended by the program in its design. If we are concerned with affecting student achievement in the short run by taking time from traditional classroom activities, these concerns are not consistent with the evidence from SITP. In fact, the most at-risk students could receive the largest benefits from investing in experiential education programs that offer prolonged and structured experiences for students outside the classroom. Indeed, in the data we did find a positive long term association between SITP based on the length of exposure, but the positive impacts should not be interpreted as causal due to the fact that students who moved the most often were also those who experienced the least exposure. Additional research is required to determine what might allow the short-term benefits to persist over time. Finally, programs like SITP do require resources, and cost-benefit analyses or cost-effectiveness analyses should be used to compare new educational inventions that have demonstrated increased achievement.
Footnotes
Appendix A
Participation in School in the Park by School, Grade, and Year

| Year | School participants |
Grade participants |
Program weeks |
Student participants |
|||||||||||
|---|---|---|---|---|---|---|---|---|---|---|---|---|---|---|---|
| Rosa | Hamilton | 2nd Grade | 3rd Grade | 4th Grade | 5th Grade | 2nd Grade | 3rd Grade | 4th Grade | 5th Grade | 2nd Grade | 3rd Grade | 4th Grade | 5th Grade | Total | |
| 1999/2000 | Yes | No | No | Yes | No | No | — | 12 | — | — | — | 180 | — | — | 180 |
| 2000/2001 | Yes | No | No | Yes | Yes | No | — | 12 | 9 | — | — | 280 | 240 | — | 520 |
| 2001/2002 | Yes | No | No | Yes | Yes | Yes | — | 9 | 7 | 5 | — | 280 | 240 | 240 | 760 |
| 2002/2003 | Yes | No | No | Yes | Yes | Yes | — | 9 | 7 | 5 | — | 200 | 270 | 270 | 740 |
| 2003/2004 | Yes | No | No | Yes | Yes | Yes | — | 9 | 7 | 5 | — | 280 | 210 | 270 | 760 |
| 2004/2005 | Yes | No | No | Yes | Yes | Yes | — | 9 | 7 | 6 | — | 260 | 270 | 240 | 770 |
| 2005/2006 | Yes | No | No | Yes | Yes | Yes | — | 9 | 8 | 6 | — | 240 | 240 | 270 | 750 |
| 2006/2007 | Yes | Yes | No | Yes | Yes | Yes | — | 9 | 9 | 6 | — | 360 | 390 | 420 | 1170 |
| 2007/2008 | Yes | Yes | No | Yes | Yes | Yes | — | 9 | 8 | 6 | — | 260 | 300 | 330 | 890 |
| 2008/2009 | Yes | Yes | No | Yes | Yes | Yes | — | 9 | 8 | 5 | — | 260 | 240 | 270 | 770 |
| 2009/2010 | Yes | Yes | No | Yes | Yes | Yes | — | 8 | 8 | 8 | — | 240 | 250 | 250 | 740 |
| 2010/2011 | Yes | Yes | No | Yes | Yes | Yes | — | 8 | 8 | 8 | — | 220 | 240 | 240 | 700 |
| 2011/2012 | Yes | Yes | No | Yes | Yes | Yes | — | 8 | 8 | 8 | — | 240 | 240 | 240 | 720 |
Appendix B
Specifying the Dropout Measure

| Dropout (least inclusive measure) | Dropout (most inclusive measure) | Total | ||
|---|---|---|---|---|
| No dropout | Dropout | Missing | ||
| No dropout | 25,099 | 9,207 | 0 | 34,306 |
| Dropout | 0 | 975 | 0 | 975 |
| Missing | 0 | 0 | 11,639 | 11,639 |
| Total | 25,099 | 10,182 | 11,639 | 46,920 |
Appendix C
Descriptive Statistics, 3rd Through 5th Grades, 2006/2007–2011/2012

| Variables (means) | Treatment | Comparison: Other schools a | |
|---|---|---|---|
| Rosa Parks | Hamilton | ||
| Total observations | 2,834/1,504 | 1,874/1,029 | 20,832/10,405 |
| Student characteristics | |||
| Male | 0.509 | 0.525 | 0.508 |
| Black | 0.061 | 0.101 | 0.156 |
| Hispanic | 0.827 | 0.754 | 0.639 |
| Asian | 0.095 | 0.100 | 0.135 |
| White | 0.008 | 0.013 | 0.043 |
| Other race | 0.009 | 0.031 | 0.027 |
| English learner | 0.833 | 0.769 | 0.704 |
| Immigrant | 0.172 | 0.160 | 0.155 |
| Refugee | 0.001 | 0.005 | 0.005 |
| Special education | 0.166 | 0.165 | 0.175 |
| 3rd Grade | 0.334 | 0.354 | 0.350 |
| 4th Grade | 0.331 | 0.327 | 0.330 |
| 5th Grade | 0.335 | 0.318 | 0.319 |
| School characteristics | |||
| % Eligible for free/reduced-price lunch | 100 | 100 | 94.671 |
| Enrollment | 984.953 | 673.409 | 552.874 |
| Teacher average years of experience | 13.546 | 15.426 | 12.991 |
| % Teachers with 2+ years of experience | 0.995 | 0.983 | 0.994 |
| Charter school | 0 | 0 | 0.016 |
| Short-term outcomes | |||
| CST ELA test taken | 0.895 | 0.918 | 0.894 |
| CST math test taken | 0.903 | 0.922 | 0.900 |
| CST ELA score | 334.658 | 332.065 | 338.207 |
| CST math score | 363.112 | 352.046 | 367.044 |
| Passed CST ELA test | 0.738 | 0.723 | 0.755 |
| Passed CST math test | 0.801 | 0.743 | 0.792 |
| ELA z-score | 0.091 | 0.040 | 0.140 |
| Math z-score | 0.119 | −0.027 | 0.149 |
| Days absent | 5.377 | 5.540 | 6.351 |
| No. of suspensions | 0.026 | 0.017 | 0.058 |
| Retained 3rd–5th Grade | 0.002 | 0.005 | 0.005 |
| Longer term outcomes | |||
| Retained 6th–8th grade | 0.004 | 0.014 | 0.014 |
| Middle school suspensions | 0.710 | 0.967 | 0.548 |
| Middle school expulsions | 0.026 | 0.027 | 0.014 |
| 7th Grade ELA z-score | 0.098 | −0.140 | 0.085 |
| 7th Grade math z-score | −0.102 | −0.218 | 0.090 |
Note. ELA = English language arts; CST = California Standards Test.
Other schools include only schools in the Crawford or Hoover clusters.
Appendix D
Means for SITP Participant High School Stayers and Non-SITP Stayers

| Non-SITP stayers, total observations = 10,116 |
SITP stayers, total observations = 1,510 |
t | p | |||
|---|---|---|---|---|---|---|
| M | SD | M | SD | |||
| Male | 0.507 | 0.500 | 0.520 | 0.500 | −0.932 | .352 |
| Female | 0.493 | 0.500 | 0.480 | 0.500 | 0.932 | .352 |
| Black | 0.176 | 0.381 | 0.060 | 0.237 | 11.574** | .000 |
| Hispanic | 0.588 | 0.492 | 0.807 | 0.395 | −16.552** | .000 |
| Asian | 0.159 | 0.365 | 0.113 | 0.316 | 4.647** | .000 |
| White | 0.061 | 0.240 | 0.011 | 0.106 | 7.990** | .000 |
| Other race | 0.016 | 0.125 | 0.009 | 0.096 | 1.978* | .048 |
| English learner | 0.640 | 0.480 | 0.817 | 0.387 | −13.672** | .000 |
| Immigrant | 0.130 | 0.336 | 0.136 | 0.343 | −0.670 | .503 |
| Refugee | 0.010 | 0.101 | 0.001 | 0.037 | 3.392** | .001 |
| Special education | 0.178 | 0.382 | 0.179 | 0.384 | −0.155 | .877 |
| 2nd-Grade ELA z-score | 0.059 | 1.012 | −0.094 | 0.918 | 5.527** | .000 |
| 2nd-Grade math z-score | 0.076 | 1.005 | 0.028 | 0.931 | 1.767 | .077 |
| 7th Grade ELA z-score | 0.125 | 0.992 | 0.128 | 0.985 | −0.103 | .918 |
| 7th Grade math z-score | 0.102 | 1.014 | 0.115 | 1.018 | −0.412 | .680 |
| Middle school suspensions | 0.831 | 2.145 | 0.849 | 2.405 | −0.291 | .771 |
| Middle school expulsions | 0.027 | 0.174 | 0.031 | 0.184 | −0.802 | .423 |
| Retained 6th–8th grade | 0.025 | 0.156 | 0.007 | 0.082 | 4.398** | .000 |
Note. SITP = School in the Park; ELA = English language arts.
p < .01. *p < .05.
Appendix E
Short-Term Outcomes, Stratified by Immigrant and Refugee Status (1996–2012, Omit 2000)

| Dependent variable |
Take ELA test |
ELA z-score |
Take math test |
Math z-score |
||||
|---|---|---|---|---|---|---|---|---|
| Immigrant/refugee status | (1) Immigrant | (2) Refugee | (3) Immigrant | (4) Refugee | (5) Immigrant | (6) Refugee | (7) Immigrant | (8) Refugee |
| SITP * Rosa | 0.014(0.013) | 0.223*(0.092) | 0.028(0.031) | −0.621(0.358) | 0.009(0.011) | 0.240*(0.101) | 0.085*(0.033) | −0.350(0.199) |
| Rosa | −0.028(0.075) | 1.048(0.667) | 0.318(0.199) | −0.584(0.847) | −0.027(0.071) | 1.326*(0.571) | 0.303(0.196) | 0.695(0.464) |
| SITP * Hamilton | 0.004(0.016) | 0.131(0.086) | 0.043(0.042) | −0.219(0.446) | −0.004(0.016) | 0.097(0.075) | −0.102**(0.035) | −0.192(0.143) |
| Hamilton | 0.008(0.053) | 1.038(0.537) | 0.301*(0.138) | −0.433(0.427) | 0.016(0.050) | 1.213*(0.478) | 0.297*(0.125) | −0.260(0.398) |
| Constant | 0.872*(0.370) | 1.031(1.028) | −2.848**(0.643) | 3.271(2.690) | 0.787*(0.300) | 1.025(1.047) | −4.418**(0.620) | −5.843**(1.685) |
| Observations | 10,665 | 490 | 10,047 | 460 | 10,665 | 490 | 10,075 | 461 |
| R 2 | .498 | .576 | .837 | .825 | .476 | .592 | .824 | .828 |
| Year FE | Yes | Yes | Yes | Yes | Yes | Yes | Yes | Yes |
| School FE | Yes | Yes | Yes | Yes | Yes | Yes | Yes | Yes |
| Grade FE | Yes | Yes | Yes | Yes | Yes | Yes | Yes | Yes |
| Student FE | Yes | Yes | Yes | Yes | Yes | Yes | Yes | Yes |
| Clusters | 22 | 22 | 22 | 22 | 22 | 22 | 22 | 22 |
| Dependent. variable | Days absent | Suspensions | Held back 3/5 | |||||
| Immigrant/refugee status | (9) Immigrant | (10) Refugee | (11) Immigrant | (12) Refugee | (13) Immigrant | (14) Refugee | ||
| SITP * Rosa | −0.326*(0.146) | 1.536(2.148) | −0.029**(0.007) | −0.134(0.256) | 0.178*(0.083) | — | ||
| Rosa | −0.862(1.094) | 16.00(13.64) | 0.022(0.055) | 0.343(1.110) | −0.158(0.080) | — | ||
| SITP * Hamilton | −0.016(0.408) | 0.215(1.847) | −0.045*(0.019) | −0.230(0.186) | 0.023**(0.007) | −0.068(0.074) | ||
| Hamilton | −0.748(0.849) | 10.69(10.40) | −0.038(0.044) | −0.017(0.970) | −0.011(0.012) | −0.999(0.581) | ||
| Constant | 8.352*(3.220) | −4.328(9.796) | −0.222(0.236) | −0.652(0.572) | −3.962**(0.387) | −6.958**(0.889) | ||
| Observations | 10,652 | 484 | 10,665 | 490 | 7,302 | 304 | ||
| R 2 | .667 | .673 | .500 | .629 | .711 | .830 | ||
| Year FE | Yes | Yes | Yes | Yes | Yes | Yes | ||
| School FE | Yes | Yes | Yes | Yes | Yes | Yes | ||
| Grade FE | Yes | Yes | Yes | Yes | Yes | Yes | ||
| Student FE | Yes | Yes | Yes | Yes | Yes | Yes | ||
| Clusters | 22 | 22 | 22 | 22 | 22 | 22 | ||
Note. Robust standard errors in parentheses. Models also control for current EL status, special education status, moved schools, % of student body eligible for free lunch, total enrollment, charter school, and health clinic. Total SITP weeks is the cumulative number of weeks of SITP programming a student has received in each year. SITP = School in the Park; ELA = English language arts; EL = English learner; FE = fixed effect.
p < .01. *p < .05.
Acknowledgements
The authors thank the staff at School in the Park and the San Diego Unified School District for their insights and partnership on this project.
Declaration of Conflicting Interests
The author(s) declared no potential conflicts of interest with respect to the research, authorship, and/or publication of this article.
Funding
The author(s) disclosed receipt of the following financial support for the research, authorship, and/or publication of this article: The USC Sol Price Center for Social Innovation and the John Randolph and Dora Haynes Foundation provided for funding this research.
Notes
Authors
JOHANNA LACOE is research director of the California Policy Lab at the University of California, Berkeley. She is a policy scholar with expertise in criminal and juvenile justice, education, employment, and housing.
GARY D. PAINTER is a professor in the Sol Price School of Public Policy at the University of Southern California, and director of the Sol Price Center for Social Innovation and the Homelessness Policy Research Institute. Professor Painter is a leading figure in the field of social innovation and has extensive expertise in housing, urban economics, and education policy.
DANIELLE WILLIAMS is a doctoral student in the Sol Price School of Public Policy at the University of Southern California. Her research interests include program evaluation, prisoner reentry, and antipoverty programs.