
Abstract
The current article reexamines the correlation between achievement test scores and earnings by providing new evidence on the association between academic skills and measures of adult earnings assessed when participants were in their 30s, 40s, and 50s. Results suggest that math and reading scores are strong predictors of economic attainment throughout participants’ careers, but these associations may also be sensitive to controls for other characteristics—including measures of the early family environment, general cognitive functioning, and socioemotional skills. Although these associations demonstrate the likely importance of achievement skills in determining labor market productivity, the variability in the achievement-to-earnings correlation suggests that researchers should apply caution when using the correlation to project the long-run effects of educational interventions.
A substantial body of longitudinal evidence has shown that high school academic skills increase early career earnings (e.g., Chetty et al., 2011; Currie & Thomas, 2001; Dougherty, 2003; Duckworth et al., 2012; Heckman & Vytacil, 2001; Heckman et al., 2006; Jencks & Phillips, 1999; Murnane et al., 2000). These studies have fueled interest in educational programs designed to raise student achievement levels in mathematics and reading, and have supported the use of mathematics and reading test scores as the primary measures of academic achievement in educational program evaluation (e.g., Chetty et al., 2011; Curto & Fryer, 2014; Deming, 2009; Krueger, 2003; Loeb et al., 2007).
Every state tests public school students in mathematics and reading, and recent federal guidelines have encouraged states to make these test scores publicly available for education research (Every Student Succeeds Act, 2015). Consequently, mathematics and reading test scores are ubiquitous throughout the educational program evaluation literature and studies reporting correlations between test scores and earnings continue to fuel the expectation that an observed program impact on test scores implies a future impact on earnings (e.g., Bartik et al., 2012; Cho et al., 2012; Curto & Fryer, 2014; Deming, 2009; Krueger, 2003). Furthermore, this assumption reinforces the idea that educational policies designed to combat inequality should necessarily boost academic skills, possibly to the detriment of policies that could promote other “noncognitive” child capacities (see Brighouse et al., 2018).
However, a closer inspection of this correlational literature raises three crucial issues. First, most studies reporting correlations between academic achievement and adult earnings have only observed early-career outcomes (e.g., Chetty et al., 2014; Currie & Thomas, 2001; Jencks & Phillips, 1999; Murnane et al., 2000; Neal & Johnson, 1996; Rose, 2006), leaving unresolved how the achievement-to-earnings correlation unfolds over the course of participants’ careers. Altonji and Pierret (2001) argue that the returns to cognitive skills should rise as work experience grows, as employers are better able to judge the abilities of their employees over time. Indeed, using the National Longitudinal Survey of Youth, Lin et al. (2018) recently found that associations between general cognitive ability (IQ) and earnings increased over the span of participants’ careers. However, these findings may not translate to more narrowly defined achievement skills, as other work has shown that intervention-spurred changes in mathematics skills may not lead to changes in general cognitive ability (Bailey et al., 2014; Watts et al., 2017). Thus, we still lack estimates of the long-run returns to more narrowly defined achievement skills, which are often the focus of educational programs.
Second, most studies have not considered the independent contributions of mathematics and reading achievement to labor market success. Instead, studies examining achievement-to-earnings correlations have often used an aggregated measure of general cognitive ability (e.g., Heckman et al., 2006; Lin et al. 2018), or have ignored reading and language ability altogether (e.g., Currie & Thomas, 2001; Murnane et al., 2000). Such approaches make it difficult to project how programs that targeted only one academic domain might affect earnings (e.g., a mathematics or reading curriculum intervention) and leave questions regarding the differential contribution of mathematics and reading skills to later economic attainment.
Finally, previous studies have paid little attention to the sensitivity of the achievement-to-earnings correlation to the inclusion of controls for possible sources of confounding variation, with most studies merely controlling for a handful of demographic and family background characteristics (e.g., Chetty et al., 2011; Currie & Thomas, 2001; Murnane et al., 1995; Neal & Johnson, 1996). Yet, these studies are often cited as evidence that educational intervention impacts on achievement scores should imply future impacts on earnings (e.g., Hanushek et al., 2015; Nomi & Raudenbush, 2016; Watts et al., 2014). Interestingly, the practice of projecting future earnings impacts based on the observed correlation 1 between test scores and earnings has produced mixed results in the evaluation literature in the rare instances with adult outcomes can be observed for educational programs (see examples in Chetty et al., 2011; Chetty et al., 2014; Dynarski et al., 2013; Fredriksson et al., 2013; Krueger, 2003).
This apparent variability could be due to underlying factors that drive the observed correlation between test scores and earnings. If other child capabilities, such as socioemotional skills, or characteristics of the child’s family, influence the achievement-to-earnings correlation, then this correlation may have varying utility for projecting adult impacts of educational programs. In other words, if the achievement-to-earnings correlation is sensitive to controls for factors that educational interventions may or may not alter (e.g., general cognitive ability, personality, family income, etc.), then program evaluators should probably use caution when using the correlation to project earnings impacts in cost-benefit analyses (see Bartik et al., 2012; Cho et al., 2012; Curto & Fryer, 2014; Deming, 2009; Duncan et al., 2010; Kline & Walters, 2016; Krueger, 2003).
Current Study
The current study reexamines the link between academic skills and economic attainment by providing new evidence on the association between adolescent measures of mathematics and reading achievement and multiple measures of lifecycle earnings. Drawing on nationally sampled data from the United Kingdom, I estimate longitudinal associations between measures of mathematics and reading skills taken when study subjects were 16 years old and earnings measures taken throughout the heart of subjects’ careers (the earliest earnings record was taken at age 33 years, the latest at age 50 years). I provide a range of estimates from various modeling approaches, some of which adjust for early measures of IQ, socioemotional skills, and family background characteristics. Given that these estimates were all generated from nonexperimental data, none of the reported correlations should be interpreted as the causal effect of achievement skills on later earnings. Rather, by comparing models that include various sets of control variables, we can better gauge the extent to which the achievement-to-earnings correlation may be influenced by factors that might fall outside the scope of educational programs. Thus, these models can help researchers gauge the plausibility of the assumption that observed impacts on test scores may imply future impacts on earnings.
Method
Analytic Approach
For each respective earnings outcome, I begin with the bivariate association between a given age-16 achievement test and later earnings:

where Earni represents log-transformed earnings for the ith participant measured at either age 33, 41, 46, or 50, and Achievementi represents a standardized measure of either age-16 mathematics or reading achievement. In this model, β 1 represents the unadjusted correlation between a single age-16 achievement measure and later earnings. This correlation could be interpreted as the expected return to a 1-SD gain in achievement for an educational program that changed academic skills and all other unobserved factors that also cause variation in achievement scores and later earnings (i.e., nonrandom error will be a component of ε i ).
To gauge the extent to which the unadjusted correlation might be affected by other factors that could cause achievement and earnings, I then introduce a host of additional controls:

where Earni, and Achievementi are defined as before. In Equation 2, I include additional vectors of control variables that account for other child and family characteristics measured at either age 7 or age 11 years. Specifically, Fam&Healthi represents a host of family measures (e.g., socioeconomic status), as well as indicators of the child’s health. The Beh&Personalityi vector captures child socioemotional skills and personality characteristics assessed by the child’s teacher at age 11 years, and the Cogi vector includes direct and teacher-rated assessments of the child’s general cognitive ability (i.e., IQ) and achievement skills. Finally, in this model, I also include age-11 measures of mathematics and reading achievement, denoted by Pretestsi, which tests the projected returns to growth in mathematics and reading during adolescence. These “pretests” should further adjust for any unobserved characteristics that would produce stable variation in achievement at ages 11 and 16 years.
In this model, β1 could be interpreted as the expected return for a 1-SD gain in mathematics achievement for a program that targeted high school achievement skills, but did not change factors related to family life, health, socioemotional skills, or general cognitive capacity. However, even with these controls added, β1 is still unlikely to capture the causal effect of gains in achievement skills on later earnings, given that Equation 2 likely does not include controls for all possible confounding factors.
In the results that follow, I present estimates falling in between Equations 1 and 2 (i.e., models with varying sets of controls), as well as specifications that estimate the independent contributions of both math and reading achievement, respectively. I also test specifications that include other factors measured at age 16, such as teacher ratings of socioemotional skills and personality. This allows me to view the independent association between earnings and other, “noncognitive” skills that also might be of interest to educational interventions (e.g., Duckworth et al., 2018). Finally, to gauge the extent to which the observed relations between academic skills and later earnings were driven by educational factors, I also introduce to Equation 2 measures of school quality taken during high school. If β1 is fully reduced to “0” after the inclusion of school characteristics, this would suggest that the school factors measured in the current data were responsible for producing the positive association between achievement and later earnings.
In all models presented, high school achievement scores were transformed to z scores so that results could be likened to effect sizes, and earnings at each wave were log-transformed. As is described in further detail below, all models are presented separately for men and women to account for gender differences in work trajectories. Because many of the control variables had missing data, I used multiple imputation to adjust for missing responses on all covariates. This imputation process was conducted using the multivariate normal imputation procedure in Stata 15.0 (StataCorp, 2017). All regression estimates reported were generated using 25 mutliply imputed data sets with Stata’s “mi estimate” commands.
Data
Data were drawn from the publicly available National Child Development Study (NCDS; University of London, Institute of Education, Center for Longitudinal Studies, 2019), a longitudinal study that drew a population sample of approximately 17,000 newborns living in England, Scotland, and Wales during 1 week in 1958. Since recruitment, the study has followed participants throughout their lives, collecting information on physical health and development, cognitive ability, education, employment, family life, and personality. The current study relies on data collected at ages 7, 11, 16, 33, 42, 46, and 50 years. Unsurprisingly, many participants have lost touch with the study over time. By the age-16 survey, study administrators collected data on approximately 12,000 participants. By age 33, most of these participants remained in the study (approximate n = 11,400), and by age 50, approximately 9,790 of the cohort members participated in data collection.
In the current study, sample inclusion was limited to participants who had nonmissing mathematics and reading achievement tests from age 16 (n = 11,919), as well as at least one nonmissing employment survey response from the age 33, 42, 46, and 50 follow-up waves (n = 9,857). To limit the influence of outliers, I then further limited the sample by dropping the top 1% of earners (calculated separately for men and women) at each earnings interview, providing a final analytic sample of 9,659 observations. Estimates with the top 1% of earners included are available on request.
Data Availability
The data for the current study can be accessed via the U.K. Data Service website (https://www.data-archive.ac.uk/). All Stata syntax files for the current analysis and instructions for downloading the data can be found on openICPSR (https://doi.org/10.3886/E119183V1).
Measures
Mathematics Achievement
The primary measure of mathematics achievement was assessed at age 16. The NCDS Mathematics Test contained 31 questions that covered both numerical and geometric concepts and procedures, and 27 of the questions were multiple choice items while 4 were true-or-false questions. The measure was constructed specifically for use in this study, and it was found to have strong internal reliability (α = .85).
The mathematics achievement measure taken at age 11 years was also used as a control variable in certain model specifications (i.e., models with “pretests”). For this assessment, students were given a pencil and paper arithmetic assessment that contained 40 items involving numerical and geometric procedures (α = 0.94).
Both mathematics tests have been used by previous studies that investigated associations between academic skills and adult outcomes (e.g., Currie & Thomas, 2001), and more information regarding the development of the measures can be found in Shepherd (2012).
Reading Achievement
At age 16 years, students were administered the NCDS Reading Comprehension Test, a 35-item measure that asked students to complete sentences by filling in a missing word. For each item, students were provided with a selection of five words, from which one word would correctly complete the sentence presented. The measure was found to have strong internal reliability (α = .86).
As with mathematics achievement, I also used the reading measure assessed at age 11 as a control variable in certain models. For this test, students were given an exam similar to the age 16 Reading Comprehension Test, as they were presented with sentences missing a key word and asked to fill in the blank (α = .82). For more information regarding the reading achievement measures, see Shepherd (2012).
Earnings
Adult labor market earnings were measured via a telephone survey administered at ages 33, 41, 46, and 50 years. At each survey, study examiners asked participants about their current employment. If a participant indicated that they were currently employed either part- or full-time (self-employment was included), then study examiners asked them to report the amount of their last take-home pay after deductions for tax. Respondents then indicated the period over which this pay was assessed. For each wave, I converted all reported earnings to monthly earnings, and transformed this monthly income amount to 2018 U.S. dollars.
Table 1 presents descriptive statistics for the employment and earnings measures taken at each follow-up wave. As Table 1 reflects, 4,828 men and 4,831 women were included in the analysis sample, and both groups had, on average, approximately three valid employment survey responses and two valid earnings measures. However, large differences between men and women in work behavior can be observed at each follow-up wave, as approximately 89% of men reported working full-time across all four waves, compared with only 44% of women. This gap largely drives the earnings differences reported by men and women, and reflects historical and cultural differences for this cohort (e.g., in 2014, 57% of adult women were in the labor force, compared with 70% of adult men [U.S. Bureau of Labor Statistics, 2015]).
Descriptive Statistics for Employment and Earnings Measures
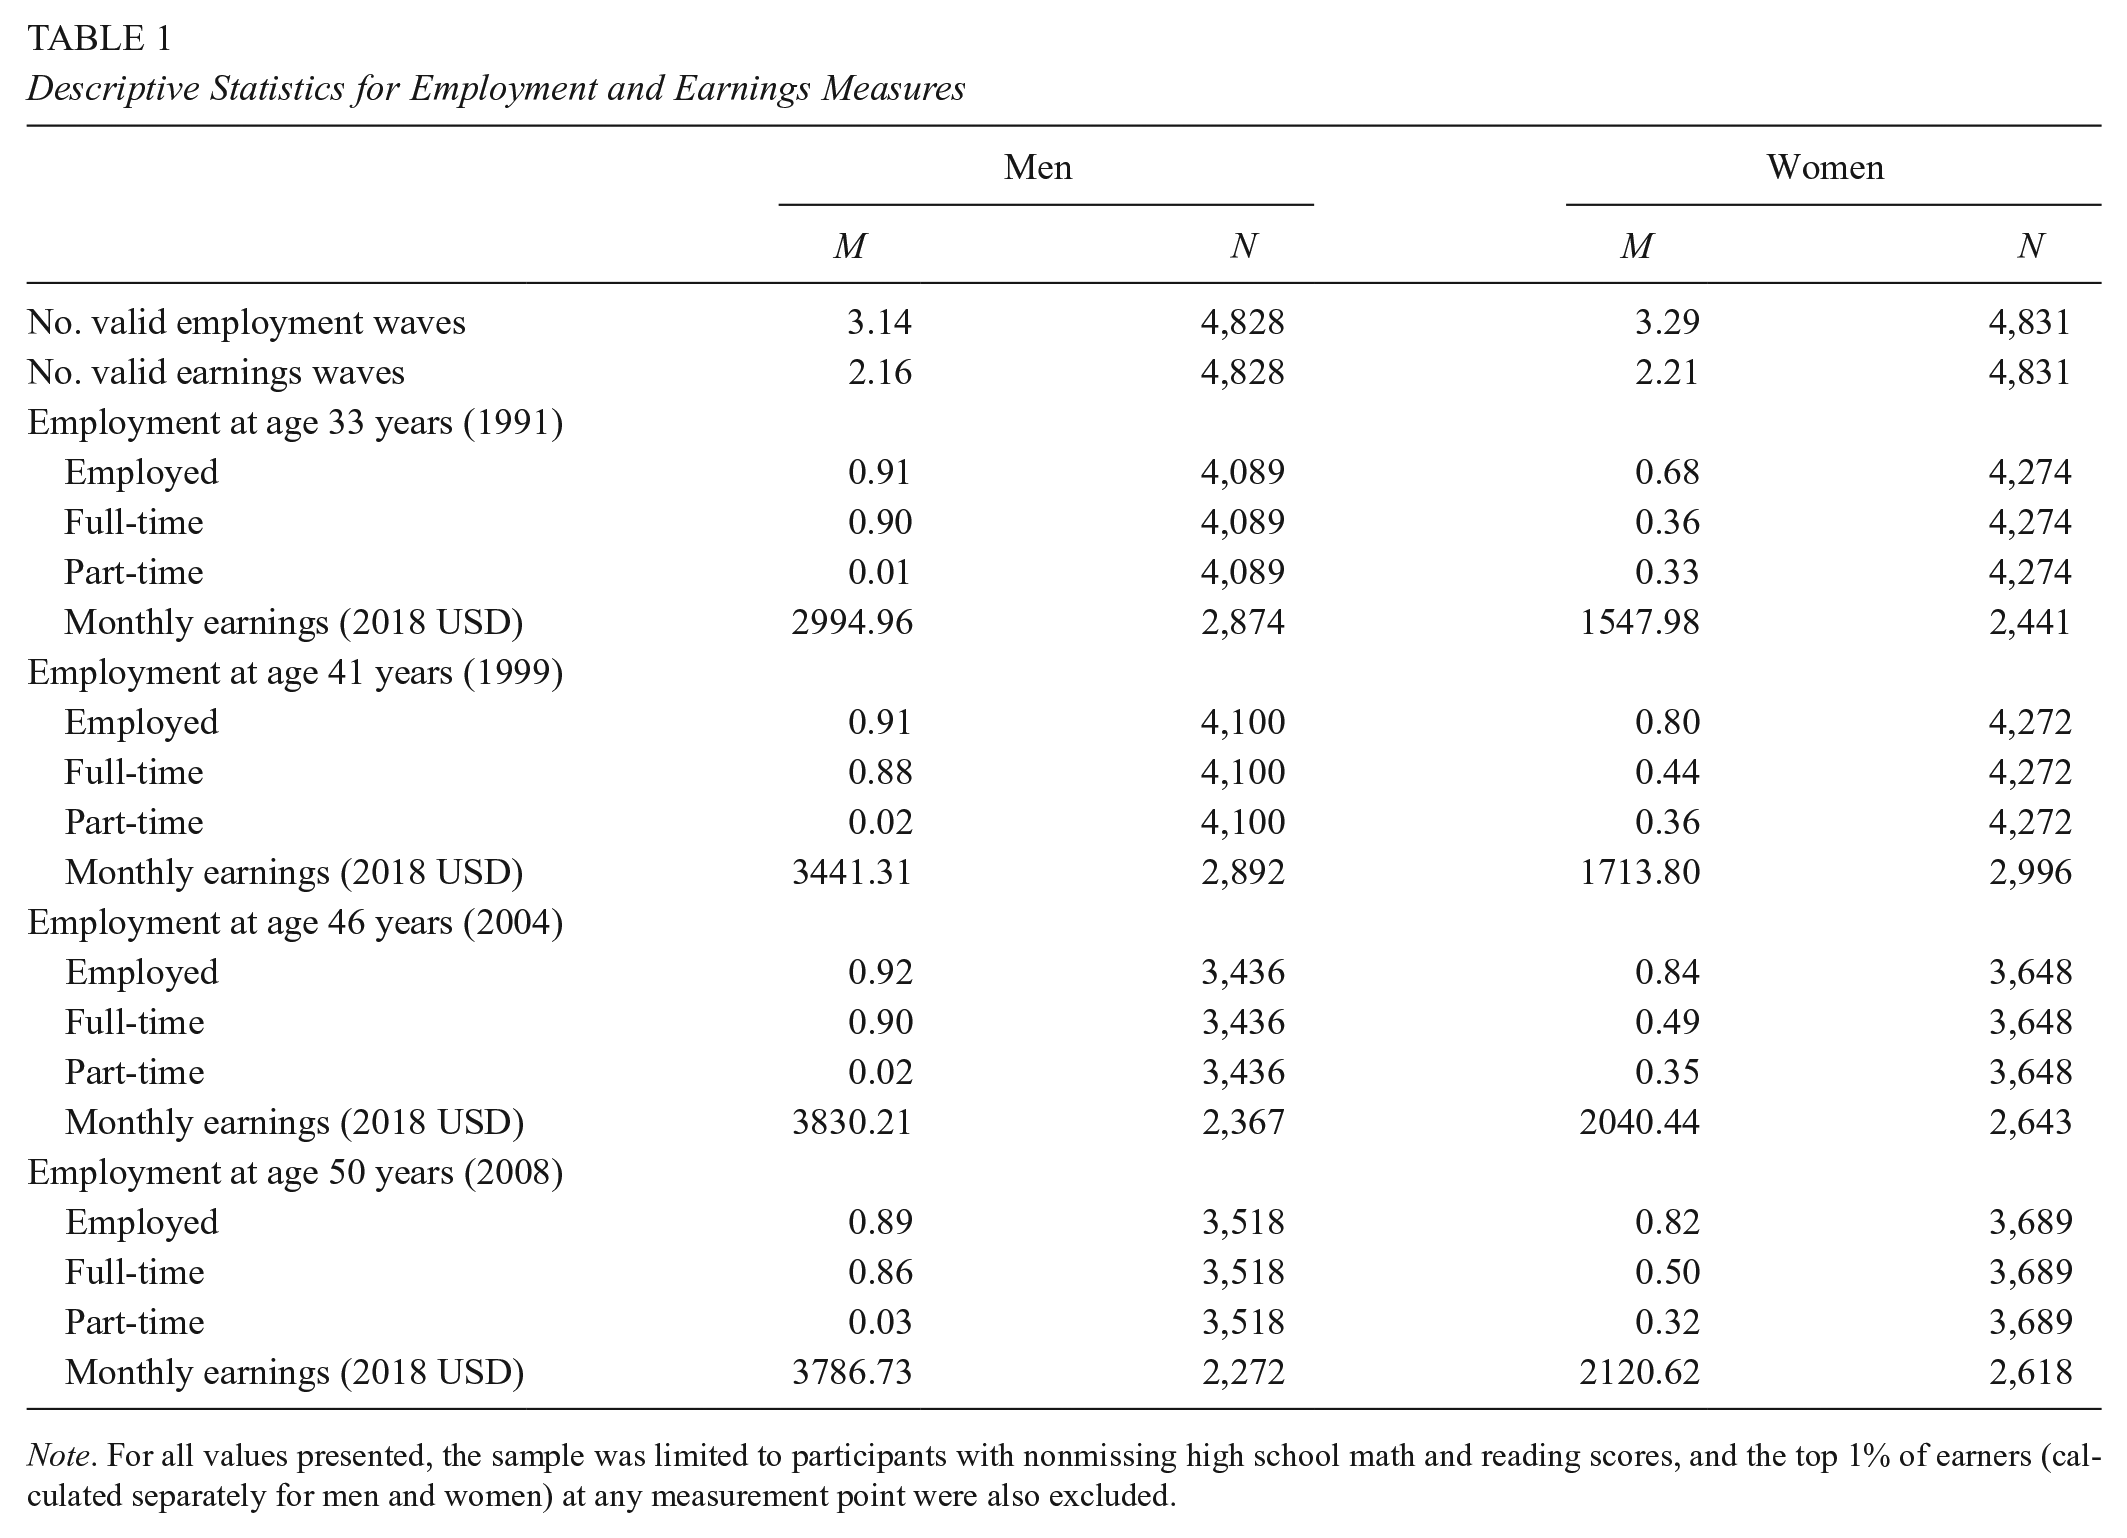
Note. For all values presented, the sample was limited to participants with nonmissing high school math and reading scores, and the top 1% of earners (calculated separately for men and women) at any measurement point were also excluded.
In the analyses that follow, I rely most heavily on models that were conditional on full-time employment and therefore included only participants who reported an actual earnings amount. This emphasis matches the approach used by several widely cited studies reporting correlations between achievement tests and earnings using panel surveys (e.g., Currie & Thomas, 2001; Murnane et al., 2000) and also allows for the study of academic skill and earnings associations for both men and women in this dataset. However, in models described below, I tested alternative approaches that included unemployed workers, and I also examined whether results differed after adjusting for selection into full-time work.
Control Variables
The fully controlled model specifications (i.e., Equation 2) include a host of control variables assessed at ages 7 and 11; in some additional models, control variables were also assessed at age 16. These variables were primarily measured via parent and teacher surveys, and some cognitive skill measures were collected via student direct assessment. In the following section, I give brief descriptions of the measures used. In the appendix, I present descriptive statistics for every control variable included in the models (see Supplementary Table A1).
Family Background and Child Health
Family background characteristics were measured via parent surveys administered at ages 7, 11, and 16 years. At the age-7 wave, family socioeconomic status (SES) was assessed as a measure of father’s occupational prestige, income, and educational level. Children were then placed into one of seven discrete SES levels, and dummy variables for SES level were used as controls in various models. I also controlled for age-7 indicators of the child’s birth order, whether they lived with their birth mother or father, formal early care arrangement, and number of rooms in the house. Measures of family background characteristics assessed at age 11 included number of children in the home, dummy variables for the father’s region of birth, the father’s level of involvement in home life, whether each household member had their own room, whether family income came from employment, and whether the child qualified for free lunch. For models that included “concurrent” environmental characteristics, I included many of these same measures assessed again at the age 16 survey wave, with the addition of a continuous measure of family income, indicators of parent work status, and an indicator for family home ownership.
Characteristics related to the child’s health and physical development were assessed at age 11. I created an index of the number of diseases (e.g., whooping cough, chicken pox, etc.) that the child was reported as ever having contracted. I also included an index of how many times the child had visited a hospital by age 11, and I included a dummy variable indicating whether they had been diagnosed with epilepsy. Teachers also rated children on their health via a “yes” or “no” question, where “yes” indicated that the child was generally “in good health.” For models that included “concurrent” child characteristics, I also included an age-16 measure of the number of illnesses diagnosed over the previous 12 months.
Child Characteristics
Measures of general cognitive ability and motor skills were assessed at age 11. General cognitive ability (i.e., IQ) was measured via a nonverbal test that asked students to interpret and predict patterns and a verbal test that involved identifying how sets of four words related to one another (α = 0.94). Motor ability was assessed by a copying test in which the child was asked to copy various designs using a pencil and paper.
Various socioemotional skills and behaviors were measured at age 11. Teachers rated children on their attention, social skills, antisocial behavior and affect, among other characteristics, and these items were primarily assessed via Likert-type scales that ranged from 1 to 3 or 1 to 5. At age 16, teachers rated children on their personality characteristics, and these characteristics were assessed via items that asked teachers to indicate where a child fell on various personality continua. For example, teachers rated children on a 1 to 5 scale for work ethic, where a score of “1” indicated “laziness” and a score of “5” indicated that the child was “hardworking.” Teachers rated children on 6 different personality characteristics that included aggression, flexibility, sociability, impulsivity, work ethic, and affability. Teachers also rated children’s academic abilities in math, reading, language, science, and social studies at age 11. These ratings were scaled from 1 to 5, with a score of “1” indicating that the child was a “very good learner” and a score of “5” indicating that they had “very little ability” in a given subject.
School Characteristics
In high school, teachers were surveyed about school characteristics. In certain specifications, I include measures of school enrollment, whether the school was coed, the proportion of boys enrolled, whether the school had a PTA, the proportion of students taking O-level exams, the proportion of students expected to continue education past secondary school, student to teacher ratio, whether the school had adequate facilities, and an index indicating the number of punitive disciplinary methods used by the school.
Results
Descriptive Results
Table 2 presents descriptive statistics for on key measures for participants in the sample, and descriptive characteristics are disaggregated by whether a participant was, on average, in the top or bottom 50% of earners across the four measurement waves. As Table 2 reflects, higher income earners tended to have better academic achievement scores and more favorable ratings on the socioemotional and personality measures at age 16. Across the sample, students answered approximately 13 of the 31 math questions correctly, on average, and 26 of the 35 reading questions. Teacher-rated personality and behavior measures, which were all positively scaled from 1 to 5, tended to hover around 3.5 across the six dimensions assessed.
High School Descriptive Characteristics by Average Adult Earnings for Men

Note. The top 50% of earners represent men or women that, on average, were at or above the 50th percentile in earnings across each of the earnings waves (sample restricted to participants who indicated full-time work at a given follow-up wave). The behavioral and personality scales were measured on a continuum from “1” to “5” (e.g., for “Timid to Aggressive,” a value of “1” would indicated maximum timidness and a value of “5” would indicate maximum aggressiveness).
Effects of Math and Reading Skills on Earnings
Table 3 presents associations between adult measures of log-earnings and age-16 measures of math and reading achievement for men, while Table 4 presents the same estimates for women. In both tables, estimates were conditional on working full-time at any given earnings survey. For ease of interpretation, I report coefficients as the predicted percentage change in earnings expected for a 1-SD gain in either mathematics or reading achievement at age 16 years (calculated as eβ − 1). Actual estimated coefficients and standard errors are presented in the tables, and because almost all estimates were highly statistically significant, I note in the text any estimate that was not statistically significant at the .05 level.
Associations Between High School Test Scores and Log-Monthly Earnings Conditional on Working Full Time for Men
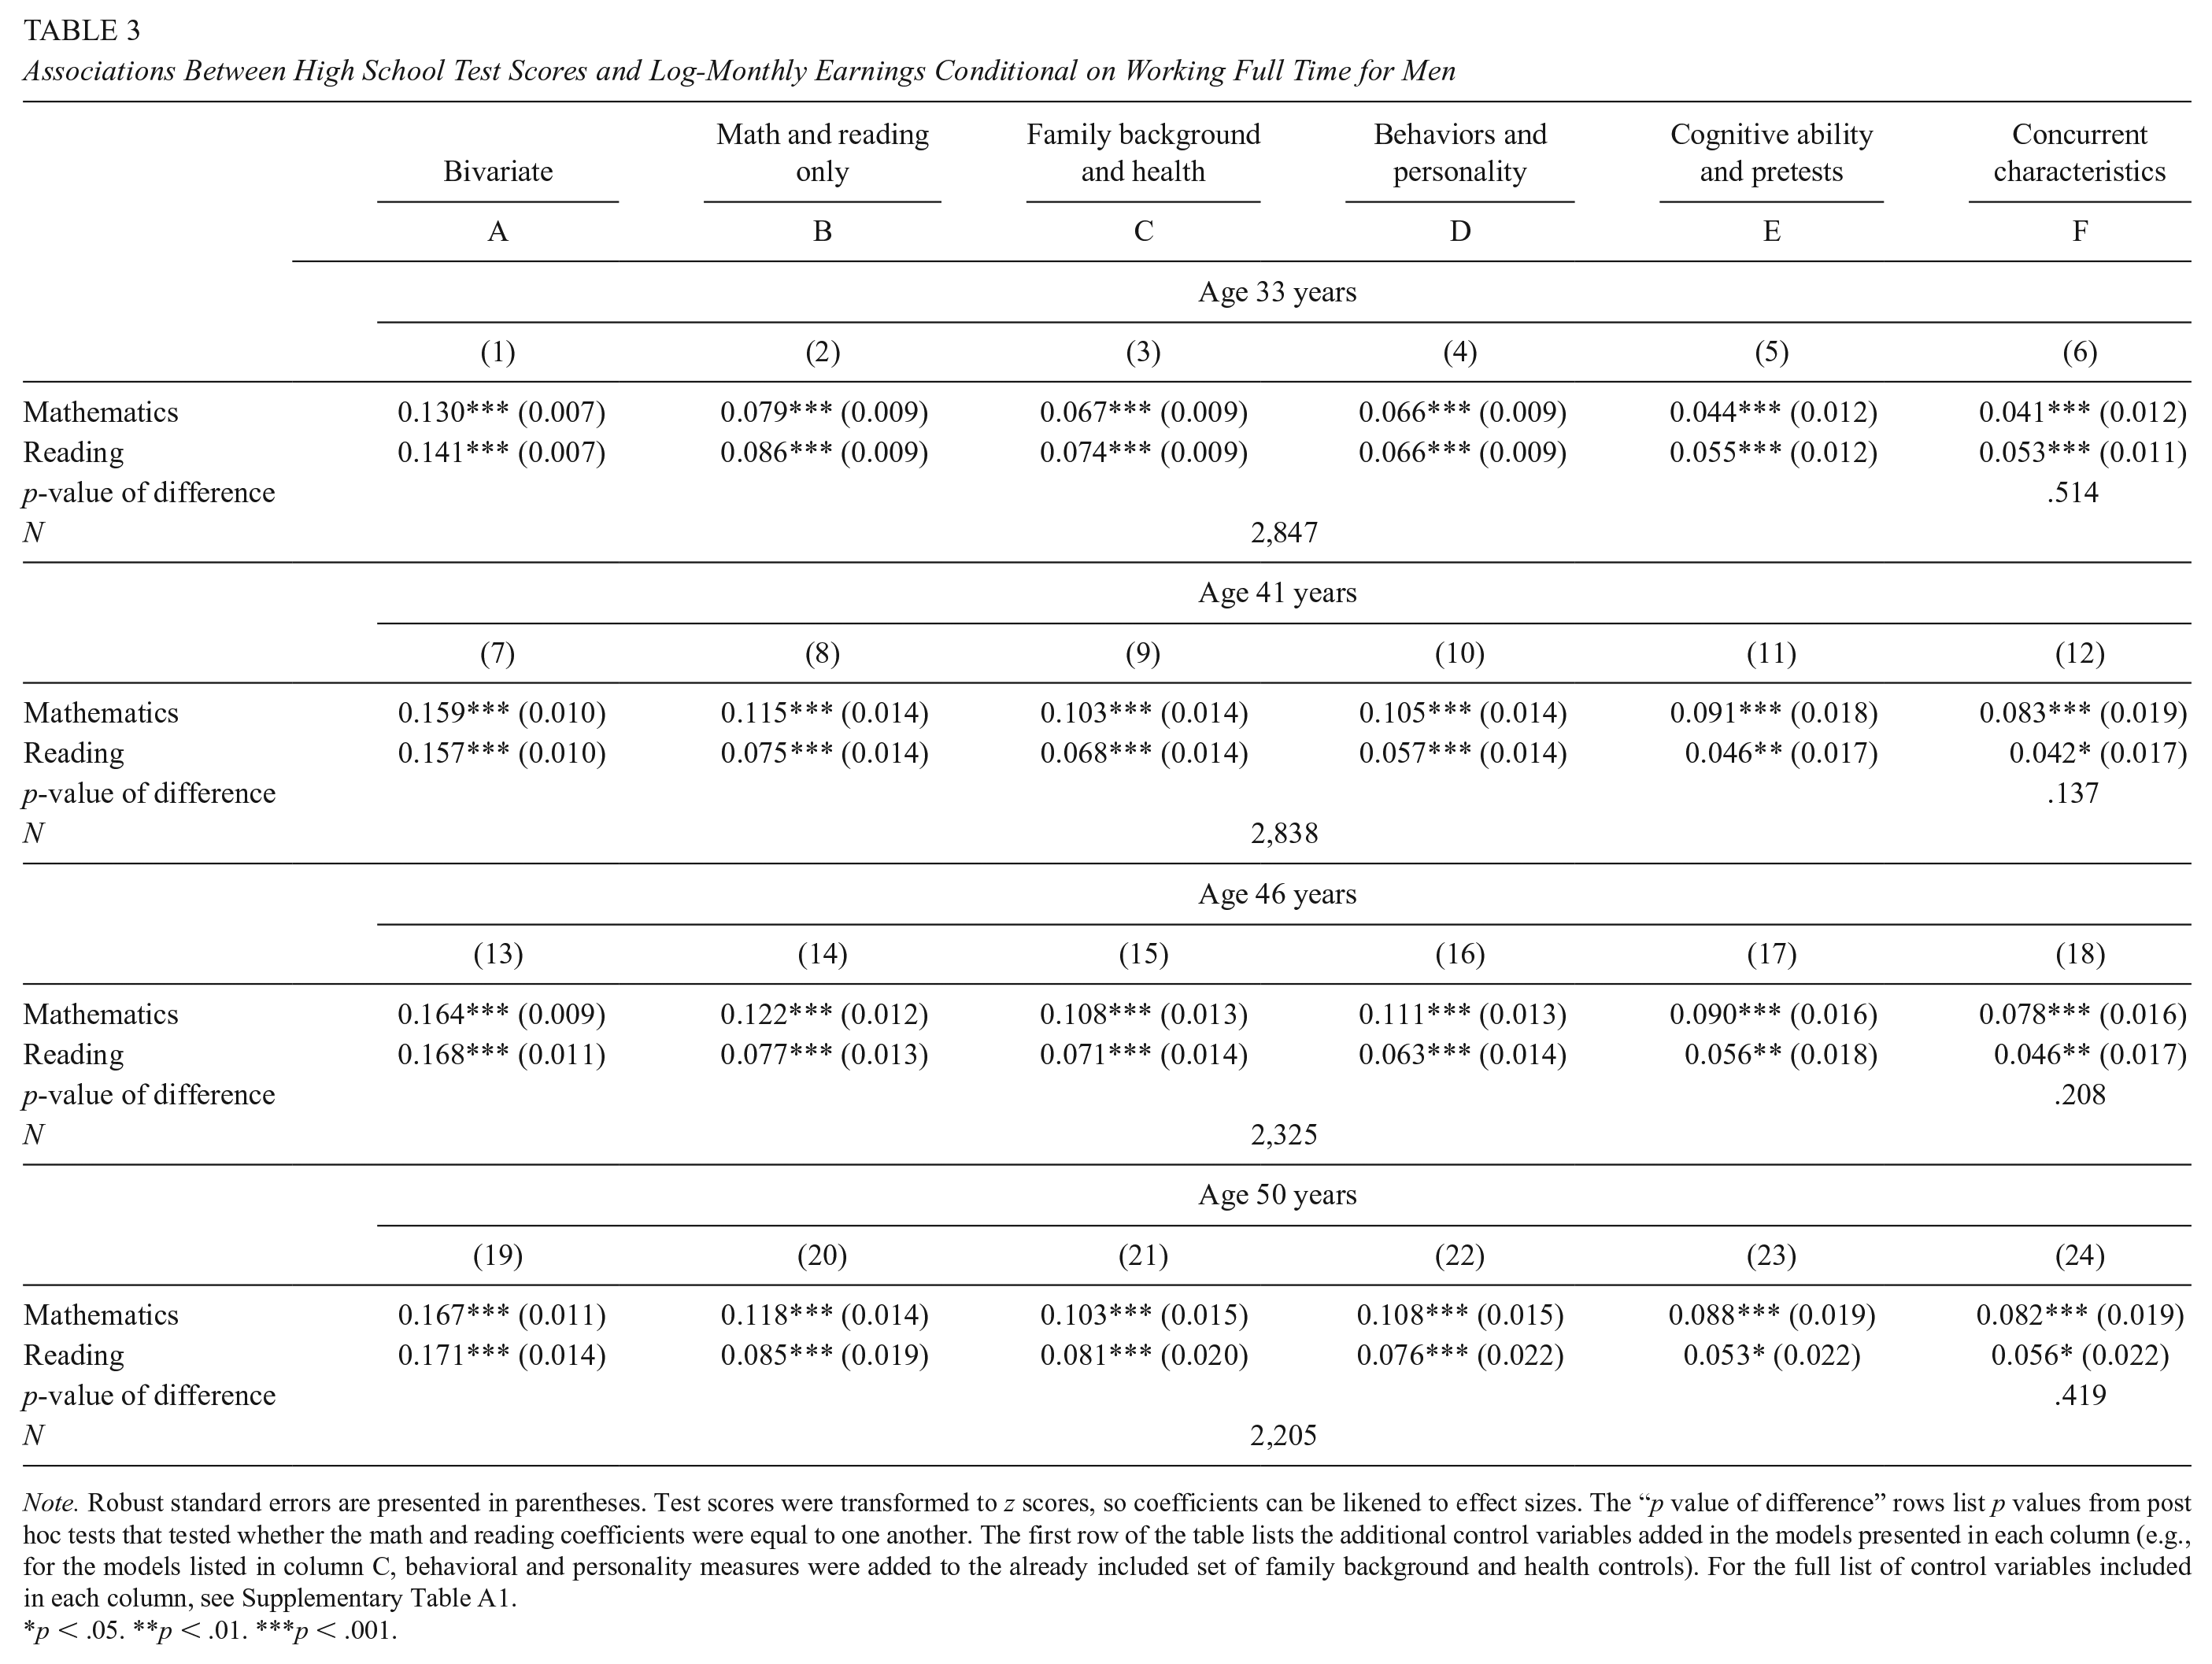
Note. Robust standard errors are presented in parentheses. Test scores were transformed to z scores, so coefficients can be likened to effect sizes. The “p value of difference” rows list p values from post hoc tests that tested whether the math and reading coefficients were equal to one another. The first row of the table lists the additional control variables added in the models presented in each column (e.g., for the models listed in column C, behavioral and personality measures were added to the already included set of family background and health controls). For the full list of control variables included in each column, see Supplementary Table A1.
p < .05. **p < .01. ***p < .001.
Associations Between High School Test Scores and Log-Monthly Earnings Conditional on Working Full Time for Women
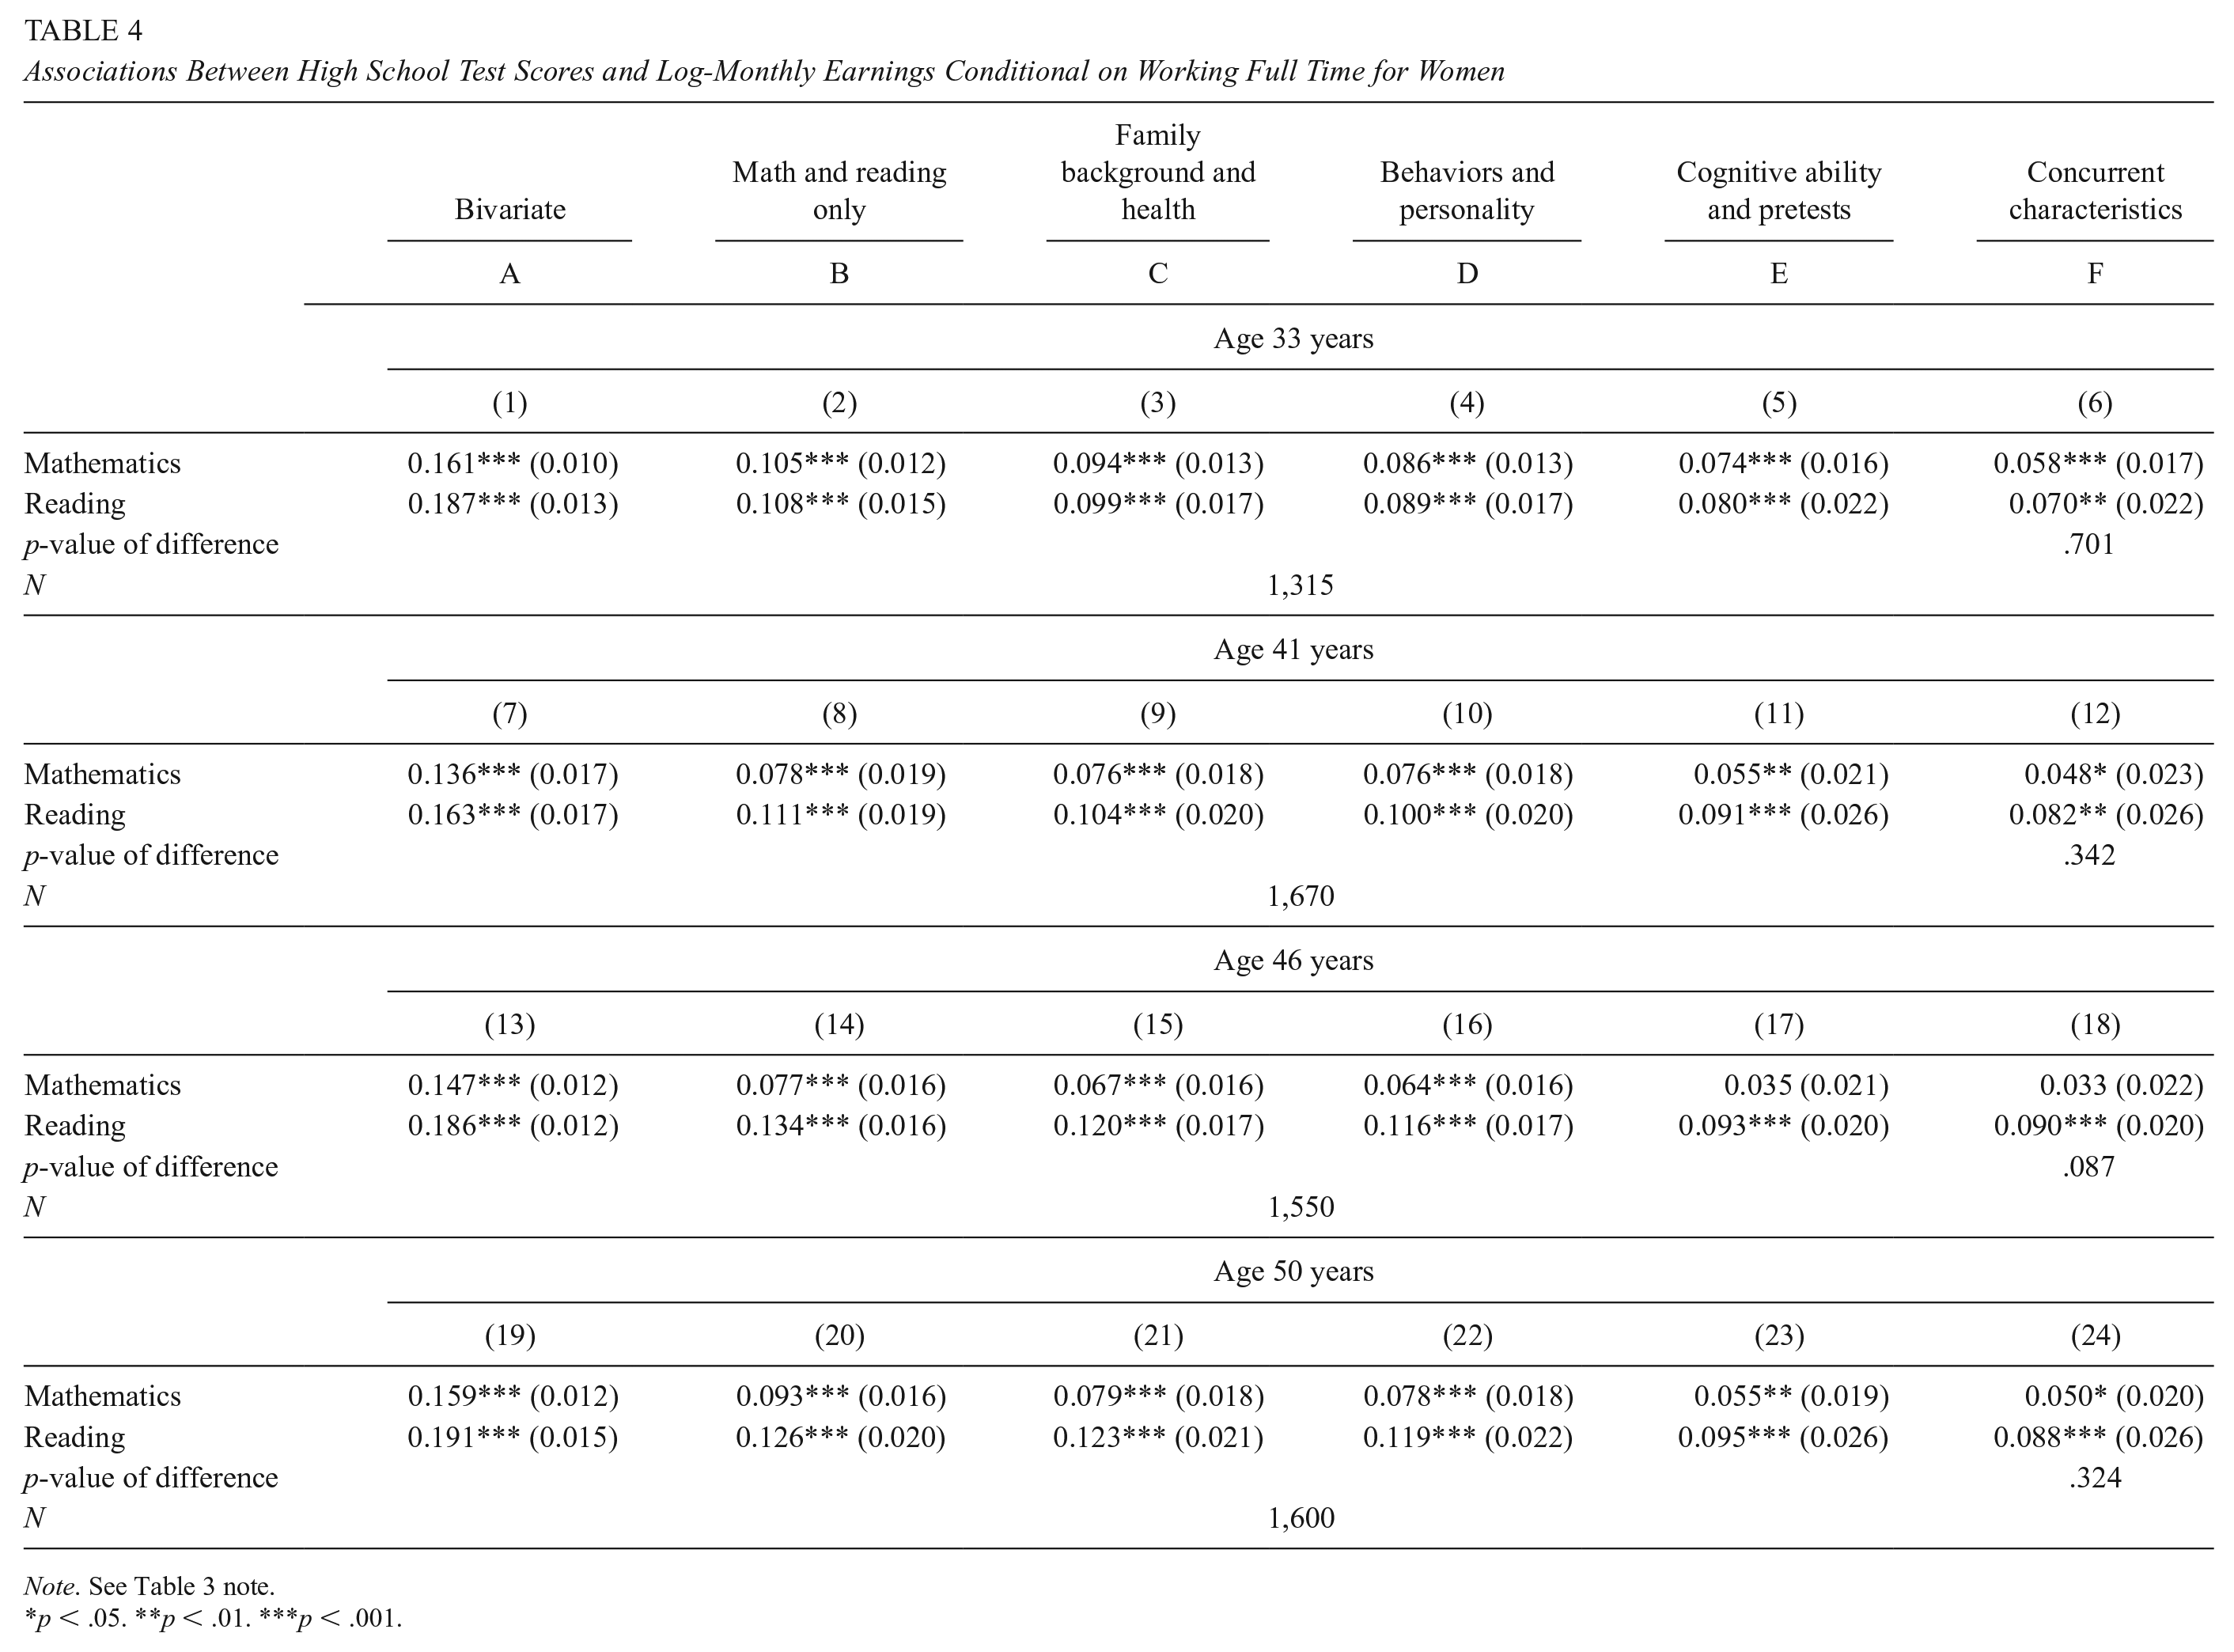
Note. See Table 3 note.
p < .05. **p < .01. ***p < .001.
Column A of Tables 3 and 4 presents coefficients and standard errors derived from bivariate models in which each measure of log-earnings was regressed on a single test score (i.e., either the mathematics or reading test score; Equation 1), and column B presents results generated from models that included both the math and reading scores simultaneously. In columns C, D, and E, vectors of control variables were progressively added, with column E matching the specification shown in Equation 2.
Beginning with results for men (i.e., Table 3), the bivariate association between achievement scores and earnings was large and positive, and it appeared to grow with age. A 1-SD gain in age-16 math achievement predicted 14% more earnings at age 33, and approximately 18% more earnings at age 50. The trajectory for reading achievement was similar.
The remaining columns of Table 3 show that this unadjusted association was fairly sensitive to the inclusion of control variables. When mathematics and reading achievement were considered simultaneously (column B) both coefficients fell considerably. For example, at age 50, the return for math achievement fell from approximately 18% to 13% once reading achievement was controlled, and the return to reading achievement showed a similar pattern.
Coefficients fell further, but remained statistically significant, as more control variables were added in columns C, D, and E. At age 50, the predicted effect of a 1-SD gain in mathematics achievement, conditional on the entire set of background covariates measured at ages 7 and 11 (i.e., Equation 2), was 9%, and the corresponding association for reading achievement was 5%. Finally, in column F, I included concurrent measures of family characteristics and teacher-ratings of socioemotional skills and personality (see full list in Supplementary Table A1), which left the math and reading test score coefficients nearly unchanged.
Results for women (i.e., Table 4) were similar, though the bivariate estimates showed little sign of growth between the age-33 and age-50 model. However, when control variables were added, the expected return for reading tended to be slightly higher than the expected return for math, while results for men produced the reverse trend. It should be noted that for models shown in column F, I also tested whether the coefficients produced by the mathematics and reading achievement tests statistically significantly differed in magnitude from one another. As the “p-value of difference” rows in both Tables 3 and 4 reflect, this difference was never statistically significant.
Composite Measure of Academic Achievement
Because many of the studies that have investigated links between achievement tests and earnings relied on achievement measures calculated by averaging together math and reading scores (e.g., Chetty et al., 2014), I also tested the association between earnings and a standardized average of the age-16 math and reading tests: The two measures were strongly correlated, r(9,659) = .65. Table 5 presents results for men, with Table 6 containing results for women. All models included the same specifications shown in Tables 3 and 4. When mathematics and reading achievement were averaged together, returns were larger—reflecting the added benefit of producing gains in both academic domains. However, as was the case with the models that considered mathematics and reading independently, the inclusion of covariates reduced estimates by approximately 40% (this varied somewhat across the follow-up waves). For women, a 21% expected return from the age-50 bivariate model fell to 14% when the age 7 and age 11 background variables were included. The results for men produced a nearly identical pattern.
Associations Between Composite Math and Reading Scores and Log-Monthly Earnings Conditional on Working Full Time for Men

Note. See Table 3 note. The “achievement composite” variable is the standardized average of the age-16 math and reading tests.
p < .05. **p < .01. ***p < .001.
Associations Between Composite Math and Reading Scores and Log-Monthly Earnings Conditional on Working Full Time for Women

Note. See Table 5 note.
p < .05. **p < .01. ***p < .001.
Pooled Models
To provide an average estimate of the association between achievement skills and earnings across the age 33, 41, 46, and 50 earnings waves, I pooled the data across the follow-up waves and reestimated the key models shown in Tables 3 through 6. For these models, each follow-up earnings wave was considered a single observation, and subjects were included in the sample if they had at least one nonmissing earnings measurement (3,826 men and 2,772 women were included in these models). These “pooled models” included fixed effects for the earnings wave, and standard errors were adjusted to take the nonindependence of the repeated earnings measures into account (i.e., person-level clustering).
In columns 1 and 2, I present models that correspond to column F in Tables 3 and 4, respectively. Thus, these models test the return to mathematics and reading achievement, conditional on one another, across the four measurement waves. For these pooled estimates, I also present the coefficients and standard errors produced by age-16 teacher ratings of socioemotional skills and personality.
The results shown in Column 1 of Table 7 indicate that, conditional on working full-time, a 1-SD gain in mathematics achievement for men had an average return of 7% more earnings between the ages of 33 and 50 years, and a 1-SD gain in reading achievement had an average return of 5% over the same period. For women, the magnitudes of the coefficients were similar, with an SD gain in math achievement predicting 5% more earnings across the follow-up waves and an equal gain in reading achieving predicting 9% more earnings. In columns 3 and 4, I present results from analogous models, but included the “achievement composite” score rather than separate measures of mathematics and reading achievement. A 1-SD gain in the achievement composite score predicted approximately 12% more earnings between ages 33 and 50 for both men and women, respectively.
Pooled Models: Associations Between High School Test Scores and Log-Average Earnings Between Age 33 and Age 50 Unconditional on Employment

Note. Robust standard errors were adjusted for student-level clustering and are presented in parentheses. All independent variables shown were transformed to z scores. All models include the full set of controls used in the “Column F” models of Table 3. Pooled models were generated by treating each respective earnings measure (taken at ages 33, 41, 46, and 50, respectively) as an independent observation, and “follow-up” wave fixed effects were included in each regression. Columns 1 and 2 correspond to the models shown in Tables 3 and 4 (i.e., math and reading achievement modeled independently). Columns 3 and 4 correspond to the “achievement composite” estimates shown in Table 5 and 6. In columns 5 and 6, measures indicating high school quality were added to the model. Inc. = included.
p < .05. **p < .01. ***p < .001.
When compared with the teacher ratings of socioemotional skills and personality, the achievement test effects were slightly larger, but several “noncognitive” skills also had consistent earnings effects for men. A 1-SD gain in the “Lazy to Hardworking” scale predicted approximately 3% more earnings, and the effect for the “Timid to Aggressive” scale was nearly identical. The “Withdrawn to Sociable” scale produced a slightly larger effect, as a 1-SD gain in sociability was associated approximately 4% more earnings between ages 33 and 50. These effects, which were estimated conditional on concurrent changes in math and reading achievement, suggest that changes in certain socioemotional capacities may also have long-lasting effects on earnings. However, the ratings of cautiousness, flexibility and temperament produced point estimates close to 0. Furthermore, none of the socioemotional and personality ratings produced statistically significant predictions for women.
Finally, in columns 5 and 6, I added controls for high school characteristics measured during the age-16 survey. By adding these controls to the model, we can gauge the extent to which school differences account for the association between achievement scores and earnings. For both men and women, the inclusion of the school characteristics accounted for very little of the achievement to earnings effect, as coefficients remained nearly unchanged. This indicates that school differences, at least in the dimensions measured by the NCDS, are unlikely to account for the association between test scores and labor market productivity. However, it should be noted that although the NCDS measured an interesting set of school characteristics that likely captured dimensions of school quality for this context (e.g., percentage of students taking O-level exams), these variables do not measure many of the school and classroom policies investigated by educational researchers today (i.e., specific curricula, charter schools, etc.).
Additional Results
Although the estimates shown in Tables 3 through 6 provided little indication that returns to mathematics and reading skills changed with age, I formally tested this hypothesis by running pooled models with interactions for follow-up wave (Supplementary Table A2). As expected, I saw little indication that returns changed over time, as most of the tested interactions produced statistically nonsignificant estimates. I also tested for nonlinearity in the returns to math and reading skills by splitting the achievement variables into quintiles (i.e., dummy variables indicating the quintile within which a given observation fell; see Supplementary Table A.3). For men, returns were largely linear through the achievement distribution, though evidence suggested that for women, returns were primarily driven by achievement gains at the top of the skill distribution.
I also included several tests that examined how selection into full-time work might have affected results. First, I report results from models that included part-time and unemployed workers (Supplementary Tables A4 and A5). Because women in this cohort were less likely to work than men, I only tested these models with adult males, and I imputed “0s” for unemployed men at each wave (a constant value of $500 was added to all earnings for the logarithmic translation). In these models, average returns for math and reading were slightly larger (math achievement: ~11%; reading achievement: ~7%). I further tested how selection into work might have affected results by examining “Heckit” selection models (Supplementary Table A6), which used a two-step procedure to adjust for the fact that unemployed workers reported no earnings (these models lacked a variable meeting the exclusion restriction for predicting employment selection—see discussion in Wooldridge, 2012). With these models, I found that estimated returns to achievement for men were similar in magnitude to those shown in Table 3. Estimates for women showed more variability.
Finally, I also tested whether results were sensitive to alternative adjustments for missing data and nonresponse. First, I tested whether results were sensitive to various adjustments for missing data on covariates (see Supplementary Tables A7 and A8), and I found little indication that results were affected by the imputation procedure used in the main models. Second, I tested whether results were sensitive to various adjustments for attrition (see Supplementary Tables A9 through A13). Supplementary Tables A11 and A12 present results adjusted using inverse probability weighting, and Table A.13 present estimates using a modified version of the Lee (2009) bounds procedure for continuous independent variables (see Carrell et al., 2018). Although I observed that students with higher achievement scores were more likely to remain in the sample, I found little indication that attrition patterns influenced key results.
Discussion
Education researchers consistently reference the correlation between achievement test scores and later earnings to suggest that programs targeting mathematics and reading skills should lead to long-run effects on economic attainment (Bartik et al., 2012; Cho et al., 2012; Curto & Fryer, 2014; Deming, 2009; Duncan et al., 2010; Kline & Walters, 2016; Krueger, 2003; Watts et al., 2014). However, this assumption has largely depended on older correlational literature that (a) only assessed early career earnings, (b) gave little consideration to the independent effects of mathematics and reading, and (c) paid little attention to the potential influence of unobserved confounds. Perhaps not surprisingly, I found that across participants’ careers, adolescent math and reading skills were important predictors of later earnings. Yet, the magnitude of this prediction depended on the control variable considered, and as the models presented in the appendix demonstrate, results were also somewhat sensitive to assumptions regarding unemployed workers and study attrition.
When the sample was restricted to full-time workers, I found that standardized gains in age-16 math and reading scores, conditional on child and family background controls, had respective effects ranging between 5% and 9% on measures of adult earnings; a composite score of math and reading achievement had an effect of approximately 12% on earnings. These effects were largely consistent across earnings measured between ages 33 and 50 years.
When compared with previous studies reporting achievement-to-earnings correlations (e.g., Chetty et al., 2011; Currie & Thomas, 2001; Dougherty, 2003; Lin et al., 2018; Murnane et al., 2000; Neal & Johnson, 1996), the estimates reported here were often smaller. To ease comparisons, I present results in the appendix (see Supplementary Table A14) from several studies that estimated associations between math achievement and earnings. Here, I focused only on studies of math achievement (fewer studies have estimated earnings returns to reading achievement). As Supplementary Table A14 reflects, studies that estimated returns to earnings measured early in participants’ careers (e.g., Deke & Haimson, 2006; Rose, 2006; Tyler, 2004) tended to report very small returns to math achievement (e.g., 5%; Rose, 2006). However, studies that estimated returns past age 30 reported returns ranging from 10% (Dougherty, 2003) to 21% (Duckworth et al., 2012).
Yet, it should be noted that these studies all varied in the modeling approaches used, and these differences likely reflect variation in the conceptualization of the achievement-to-earnings correlation. Because program evaluators continue to use achievement-to-earnings correlations to make program impact projections, understanding how the correlation changes a result of various modeling specifications can help us better forecast how impacts might unfold given a range of educational interventions. Like most findings reported from studies shown in Supplementary Table A14, the results reported in the current study suggest that academic skills strongly predict later earnings throughout participants’ careers. However, the fully controlled estimates also imply that programs that narrowly affect mathematics or reading skills, without changing underlying capacities and environmental characteristics, might have rather limited effects on later earnings.
Indeed, studies that have used the correlation between test scores and earnings to project adult impacts have found mixed returns to this method when adult observations become available. In an examination of the effects of the Tennessee STAR experiment on postsecondary attainment, Dynarski et al. (2013) found that short-term impacts on test scores were accurate predictors of college success. Similarly, Chetty et al. (2014) found that the test-score-and-earnings correlation produced accurate projections of the effect of high-quality teachers on future earnings. In contrast, Krueger (2003) used the test-score-and-earnings correlation to project positive earnings effects of the Tennessee STAR experiment, and Chetty et al. (2011) later found no detectable effect of the class size program on participants’ adult earnings (though these estimates were imprecise). Moreover, some research also indicates that the test-score-and-earnings correlation could lead researchers to underestimate the effect of a given program on earnings (see Fredriksson et al., 2013), as educational programs might affect other crucial skills not captured by test scores alone.
The estimates reported here also highlight the potential contributions of “noncognitive” skills to labor market success. Indeed, I found that for men, measures of socioemotional skills relating to work ethic and sociability produced statistically significant associations with earnings, although these associations tended to be smaller than the predictions observed for achievement tests. Other recent work has suggested that certain “noncognitive” skills, such as social skills (Deming, 2015), effort (Hitt et al., 2016), and self-control (Moffitt et al., 2011) may have even larger associations with earnings than the estimates reported here. Moreover, some have speculated that achievement tests could carry much of their predictive validity due to their ability to measure socioemotional capacities (see Borghans et al., 2016). It should be noted that I found little support for this hypothesis in the current models, as the math and reading predictions were hardly affected by the inclusion of age-16 socioemotional skills (i.e., column F of Tables 3 and 4). Yet, the measures of socioemotional skills considered here were hardly as sophisticated as the measures included in other studies focusing on noncognitive capacities. For example, Moffitt et al. (2011) generated a composite scale of self-control taken from multiple raters observing children’s behavior over several years. Thus, interpretations of the socioemotional skill effects reported here should be considered alongside the apparent limitations of the measures.
Taken together, the results reported here clearly demonstrate the continued importance of cognitive skills for shaping outcomes across the lifespan. However, the variability in the estimates also underscores that educational program evaluators should apply caution when using an observed correlation between achievement scores and earnings to project program impacts. If such a projection is based on the unadjusted correlation between test scores and earnings (or even a correlation adjusted for demographic characteristics), then the evaluator is betting that the educational program in question also affected a host of unmeasured characteristics of the child that also influence the association between test scores and earnings. The validity of such assumptions likely depends on the specific features of the program in question (Brick & Bailey, 2020). Thus, the field sorely needs more longitudinal research of experimentally evaluated educational programs to better understand how short-term impacts translate to longer-term effects (see Athey et al., 2019; Watts et al., 2019).
Limitations
Several limitations should be noted. First, generalizations to populations today should be made carefully. Indeed, the sample of children followed by the NCDS entered the labor market approximately 40 years ago. Further, although the achievement test measures used by the NCDS reflected many of the same math and reading skills assessed by achievement tests today, the NCDS tests were not designed and normed using many of the psychometric practices that have become commonplace with today’s achievement measures. Yet, the results reported here align with estimates from more recent U.S. samples (e.g., Chetty et al., 2011; Dougherty, 2003). For example, Chetty et al.’s (2011) examination of Tennessee STAR (which ran in the mid-1980s with participants reaching adulthood in the late 1990s), reported that a 1-SD gain in a composite score of math and reading achievement predicted 18% more earnings conditional on basic demographic characteristics (earnings were assessed at age 27). Here, I found that conditional on family background controls, a 1-SD gain in achievement predicted approximately 22% more earnings at the age 33 follow-up wave.
Further, the lower labor market participation rate for women in this sample should also be kept in mind when interpreting results. To partially address this issue, I based most comparisons on models that included only full-time workers. Interestingly, in these models I found that math returns tended to be higher for men than reading returns, and the reverse trend was true for women. These results lend support to the theory that math and reading skills may have unique contributions to labor market outcomes. These findings could also reflect real gender differences in math education (Penner, 2015) or access to STEM careers (Beede et al., 2011)—issues that are still present for young adults entering the workforce today. Nevertheless, interpretations of the differential predictions for math and reading should be tempered given that across follow-up waves the coefficients produced by the math and reading tests did not statistically significantly differ from one another for either group. Moreover, the returns to the composite score of math and reading were nearly identical for men and women.
Finally, these results were likely influenced by measurement error, though both achievement tests were measured with relatively high reliability. It is difficult to gauge how measurement error and omitted variables bias both affect the results, as omitted variables bias probably positively inflates coefficient estimates, while measurement error is likely to push estimates toward 0. Also, the standard errors for “fully-controlled” estimates tended to hover around 2.5%, leading to fairly wide confidence intervals. The size of the standard errors was partly due to the low R2 values in most of the models. As the pooled estimates in Table 7 show, even with all the control variables included, R2 values hovered around 0.19 for men and 0.16 for women. Thus, even a substantial set of child and family characteristics measured throughout childhood and adolescence still amounts to relatively little explained variation in earnings.
Conclusion
Researchers and education policymakers can still point to strong theoretical and empirical reasons to believe that the skills measured by mathematics and reading tests should translate into adult economic success. Across the models reported here, measures of math and reading achievement were particularly potent predictors of adult economic productivity. However, expecting that test score impacts will necessarily lead to large economic gains is a projection based on strong assumptions, and results from the current study suggest that the achievement-to-earnings correlation was sensitive to the inclusion of control variables for other child and environmental characteristics. Consequently, researchers should apply caution when using the correlation to make projections and should consider the multiple pathways through which educational programs could affect eventual economic attainment.
Supplemental Material
Achievement_and_Earnings-Supplementary_Appendix_Corrigendum – Supplemental material for Academic Achievement and Economic Attainment: Reexamining Associations Between Test Scores and Long-Run Earnings
Supplemental material, Achievement_and_Earnings-Supplementary_Appendix_Corrigendum for Academic Achievement and Economic Attainment: Reexamining Associations Between Test Scores and Long-Run Earnings by Tyler W. Watts in AERA Open
Footnotes
Acknowledgements
Research reported in this publication was supported by the Eunice Kennedy Shriver National Institute of Child Health and Human Development (P01HD065704; R01HD0935930). The content is solely the responsibility of the author and does not necessarily represent the views of the National Institutes of Health. The author wishes to express his thanks to Drew Bailey, Damon Clark, Carol Connor, Greg Duncan, Jacque Eccles, George Farkas, Jade Jenkins, Cybele Raver, and the UK Data Archive for making the National Child Development Study available.
1.
The observed relation between test scores and earnings is typically referred to as a “correlation” (e.g., Chetty et al., 2014), though it most often represented as a semielasticity because earnings are typically log-transformed in regression models.
Author
TYLER W. WATTS is an assistant professor at Teachers College, Columbia University. His research examines the long-run effects of early childhood educational programs.
References
Supplementary Material
Please find the following supplemental material available below.
For Open Access articles published under a Creative Commons License, all supplemental material carries the same license as the article it is associated with.
For non-Open Access articles published, all supplemental material carries a non-exclusive license, and permission requests for re-use of supplemental material or any part of supplemental material shall be sent directly to the copyright owner as specified in the copyright notice associated with the article.