
Abstract
This article shows that the traditional narrative of Black-White high school graduation gaps is inverted among economically disadvantaged female students. Two nationally representative surveys and statewide administrative data demonstrate that low-income White females graduate at rates 5 to 6 percentage points lower than Black peers despite having higher test scores. Greater rates of tobacco, alcohol, and illicit drug use among White females account for one third of the attainment disparity. Since the early onset of substance use among low-income White females predicts lower attainment, more research on the factors leading to risky behaviors and their correlates during early adolescence is warranted. Examining racial gaps in high school graduation at the intersection of gender and income categories can inform more tailored interventions.
Introduction
Researchers have long documented widespread disparities in educational and labor market outcomes by race. On average, African Americans have lower test scores, lower educational attainment, and worse outcomes in terms of wages and labor market participation (Altonji & Blank, 1999; Bowen et al., 2009; Clotfelter et al., 2009; Fryer & Levitt, 2006; Murnane et al., 2006; Reardon & Robinson, 2008). Existing evidence shows that the Black-White gap in high school graduation is approximately 8 to 9 percentage points for those born in the 1980s (Heckman & LaFontaine [HL], 2010; Murnane, 2013). Attainment disparities carry significant implications for future economic well-being (Tamborini et al., 2015); for example, high school dropouts fail to capture the substantial college wage premium in the labor market (Card, 1999; Grogger & Eide, 1995; Heckman et al., 2006). Closing high school graduation gaps across different racial and ethnic groups is therefore of concern to researchers and policymakers.
In this article, we uncover a result not in accordance with perceived wisdom on racial disparities: economically disadvantaged Black girls complete high school at higher rates than their disadvantaged White peers. Graduation rates for low-income White girls are 5 to 6 percentage points lower than poorer Black girls across both national longitudinal surveys and statewide administrative data. We do not observe this reversal in racial gaps across any other gender and income category, including low-income boys. This finding underscores the importance of examining racial gaps at more granular sociodemographic categories to inform tailored interventions on attainment.
We examine the influence of three sets of measures for this graduation deficit among low-income White females: variation in family, neighborhood, and schooling contexts; differences in cognitive skills; and a range of students’ behavioral and socioemotional attributes that proxy for noncognitive skills. Specific measures include grade retention, absences, tardies, delinquency, self-esteem, substance use, and expectations. We operationalize the analyses using the National Longitudinal Survey of Youth 1997 (NLSY97) and the National Longitudinal Study of Adolescent to Adult Health (Add Health), which provide detailed family background attributes, schooling variables, and student behaviors and attitudes. We supplement these national samples with administrative statewide data from the North Carolina Education Research Data Center (NCERDC) and its variables on student standardized test scores, class-level, and school characteristics.
Our results show that students’ behavioral and socioemotional attributes matter for explaining the attainment deficit among low-income White girls. The use of alcohol, tobacco, and illicit drugs accounts for one third of the overall disparity. Low-income White girls exhibit markedly higher rates of substance use across both national surveys, with the largest differences in the use of illicit drugs. The concentration of these behaviors among the low-income White population is concerning given previous research on the sensitivity of non-Hispanic Whites’ educational attainment to health-related factors (Jackson, 2009). These behaviors not only have ramifications for educational outcomes (Chatterji, 2006; Marie & Zölitz, 2017) but they also have negative consequences for longer term health (Carpenter & Dobkin, 2009; Hall & Degenhardt, 2009). Our results point to concerning patterns among economically disadvantaged White populations in their adolescent, prelabor market years, which can meaningfully influence later life outcomes.
In contrast to the role of behavioral factors, analyses show that lower graduation rates among low-income White females remain after accounting for detailed family earnings, neighborhood and school characteristics, urban versus rural contexts, and cognitive skills. Income differences cannot explain this phenomenon, as both national surveys show that low-income White females come from higher earning households relative to Black peers. Moreover, lower graduation rates among low-income White females persist despite their higher standardized test scores and related measures of academic performance, such that accounting for cognitive skills exacerbate rather than narrow differences in attainment. These findings motivate a reexamination of the traditional narrative on racial attainment gaps among economically disadvantaged populations, since White students fail to translate advantages in these domains to higher attainment.
In examining an understudied phenomenon, this article contributes to a substantial literature on high school completion and dropout. Previous studies document high school graduation patterns using household surveys, including the Current Population Survey and the American Community Survey, the Common Core of Data, and longitudinal data sets. It is well established using these sources that Black students graduate at lower rates, with only a subset of studies documenting graduation and dropout for finer-grained subgroups such as by gender and race (Heckman & LaFontaine, 2010; Mishel & Roy, 2006; Murnane, 2013; Stillwell et al., 2011). Studies show that Black students reliably trail White students across high school graduation and completion rates. Similarly, event dropout rates show subgroups such as Black or low-income students as leaving school at higher rates over a given period (Chapman et al., 2011; Rumberger, 2011). While this article replicates previously documented racial graduation gaps, an exploration of more granular categories (in this case the interaction of gender, race, and income) reveals an unusual case of White students falling behind in attainment. 1
We draw upon a large literature on the predictors of graduation or dropout to inform the choice of mediating factors. The contributions of family income, school, and neighborhood characteristics feature prominently in the literature from sociology to economics to developmental psychology (Autor et al., 2016; Coleman et al., 1966; Cook & Evans, 2000; Jencks, 1972; Rumberger, 2011). 2 We then consider cognitive ability because it is a well-established as a determinant of educational attainment (Heckman & Krueger, 2005; Paglin & Rufolo, 1990; Weinberger, 1999). The majority of literature finds a significant role of academic achievement on attainment outcomes (Rumberger, 2011). Finally, we examine socioemotional and behavioral dimensions at the individual level, given previous studies’ findings on the importance for attainment of engagement and attitudes as measured by misbehavior, self-esteem, participation, expectations, and goals (Finn, 1989; Fredricks et al., 2004). While these aspects have long been studied in fields such as sociology and developmental psychology, our examination of socioemotional and behavioral dimensions reflect the shift in economics from a unidimensional focus on cognitive abilities toward the contributions of a wider range of noncognitive factors (Bowles et al., 2001; Cunha et al., 2010; West et al., 2016).
The remainder of the article proceeds as follows. The next section outlines the sample construction using two national longitudinal surveys as well as the North Carolina administrative data. The third section summarizes racial gaps in graduation rates by student subgroup and focuses on the unexpected deficit low-income White females have relative to Black females. The fourth section investigates the contributions of household income. The fifth section examines the role of neighborhood and school contexts, while the sixth and penultimate section provides evidence on the contribution of various cognitive and socioemotional or behavioral measures such as substance use. The final section concludes with a discussion of our findings.
Data
Our analyses use multiple longitudinal and administrative data sources. We follow Heckman and LaFontaine (2010) and Murnane (2013) in using two recent longitudinal data sets to capture U.S. graduation patterns: NLSY97 and Add Health. An advantage of these longitudinal surveys in addition to geographic coverage is the availability of measures on family context, behaviors, and attitudes that are not typically present in administrative data. 3 In contrast, administrative statewide records allow us to study a large population of students and characterize in detail the schools and peers these students were exposed to throughout primary and secondary schooling. We therefore supplement national-level surveys with statewide data from the NCERDC.
NLSY97
The NLSY97 sample comprises 8,984 individuals who were between the ages of 12 and 17 years during the initial interview in 1997. The sample follows these individuals through the 2015 survey wave, when respondents were 30 to 36 years old. We construct student groups at the intersection of race, gender, and economic disadvantage as measured by free or reduced-price lunch (FRL) eligibility, which occurs when an individual’s household income is at or below 185% of the federal poverty guideline. We use ethnicity data to define non-Hispanic White and African American students and code high school graduation based on students’ reporting of enrollment status and the highest degree received during each interview. The sample excludes students who graduated with a GED, in keeping with official measures of high school graduation and previous studies documenting racial gaps in attainment. 4
In addition to high school graduation, we rely on an array of survey questions to document students’ academic achievement, behaviors, and attitudes. Cognitive scores derive from the Armed Services Vocational Aptitude Battery (ASVAB), a multiple-choice test covering aptitudes ranging from arithmetic reasoning to paragraph comprehension. Other school-based measures include tardies, absences, and grade retention. Family characteristics include a respondent’s household income, while behavioral attributes cover tobacco, alcohol, marijuana, and other illicit drug use. To create the final sample, we first limit to the 8,768 students that complete eighth grade with nonmissing high school graduation outcomes. 5 Of these respondents, approximately one quarter were neither White nor African American. We then restrict to White or Black females with nonmissing family income data, before limiting the analytic sample to individuals who are low-income.
Add Health
We supplement the NLSY97 sample with Add Health, which surveyed students of a similar age and at a similar time. The initial wave of Add Health in 1994–1995 involved in-home interviews with 20,745 adolescents in Grades 7 to 12, when they were largely between the ages of 12 and 18. Add Health then followed these respondents through the latest Wave IV interview round in 2007–2008, when the remaining 15,701 participants were between 24 to 32 years old. The similarities between these two national data sets also extend to the timing of follow-up interviews. As such, this sample has a similar age distribution in any given year as the NLSY97.
We construct student groups using sociodemographic information taken in Wave I. A combination of parent-reported household income and household size determine the ratio of income to the federal poverty threshold. As with the NLSY97, we designate respondents as low-income if they are eligible for FRL. Attainment data comes from a Wave IV survey question on high school graduation status. Consistent with the NLSY97, we define graduation as finishing high school with a diploma instead of receiving a GED and exclude respondents who ever received a GED from the sample.
Add Health records a number of cognitive, socioemotional, and behavioral covariates. Achievement scores come from the Add Health Picture Vocabulary Test, an abridged version of the Peabody Picture Vocabulary Test with age-standardized scores. School variables include an indicator for ever repeating a grade, and the number of excused and unexcused absences. We expand the set of socioemotional measures to include self-esteem and expectations taken during the initial interview. The former derives from a modified Add Health version of the Rosenberg Self-Esteem Inventory. 6 The latter comes from survey questions eliciting participants’ interest in and probabilities of going to college. 7 The final set of covariates capture individuals’ tobacco, alcohol, and illicit substance use during Wave I. The sample restriction process is analogous to that of the NLSY97. We restrict to students who were in grade 9 or earlier during Wave I to ensure that baseline covariates are measured in earlier schooling years. These 7,069 observations decrease by nearly one fifth after dropping respondents who were not White or African American. We further exclude respondents who were male or missing income data. The final analytic sample restricts to only low-income Black or White females.
NCERDC
We complement these two national longitudinal surveys with administrative data on the universe of North Carolina high school students. The NCERDC allows us to follow ninth-grade students in 2008 to 2011 through high school graduation. We construct student subgroups using race, gender, and FRL eligibility from student roster files. 8 Notably, FRL eligibility can fluctuate across time as parental incomes change or because of administrative errors. To ensure we are distinguishing families that are persistently economically advantaged or disadvantaged from families experiencing income shocks, we rely on the longitudinal nature of the data and compile FRL eligibility for students going as far back as third grade. Our measure for low-income is students who were ever eligible for FRL, whereas higher income refers to students who were never eligible.
The outcome variable is whether a student graduated high school within 4 years of beginning ninth grade. 9 Specifically, a ninth grader in 2008 is matched to 2011 graduation files and 2008 to 2011 dropout and school exit data to ensure a comprehensive view of their manner of exit. 10 School-level attributes include whether the high school is classified as urban, suburban, or rural. 11 School rosters permit us to construct grade-level student composition by gender, race, and economic disadvantage. The final analytic sample spans the 2008–2011 ninth-grade cohorts. We exclude students who exit for reasons that are exempt from statewide graduation rate calculations, as well as students with missing exit reason or timing. 12 We retain unique individual observations by only including the first time an individual was observed in a ninth-grade cohort. The full sample comprises 406,349 students, while the restricted sample with only White and African American students with nonmissing sociodemographic data includes 342,246 individuals.
An Exception to the Black-White Attainment Gap
The U.S. high school graduation rate is a barometer for both the performance of schools as well as the population’s skill level (Heckman & LaFontaine, 2010). As such, the overall rate as well as the graduation outcomes of student subgroups by race and gender is the subject of ample scholarly attention. We begin by corroborating the overall graduation rates reported in this literature using our three analytic samples (Table 1). The first panel shows broad consistency across the two national samples with rates that closely adhere to previous estimates. The Add Health and NLSY97 samples report that 78% and 77.7% of students earn a high school degree, respectively. 13 Likewise, 81.1% of students in North Carolina public schools graduate within 4 years of beginning ninth grade, which is within 0.3 percentage points of official 4-year graduation rate reports. 14 Any disparities between national- and state-level estimates can depend on differences in student composition, cohorts, and choice of attainment measure. 15
Graduation Rates

Note. Add Health = National Longitudinal Study of Adolescent to Adult Health; NLSY97 = National Longitudinal Survey of Youth 1997; GED = general educational development. The Add Health sample of 7,069 respondents includes those first observed no later than ninth grade and have nonmissing graduation data in Wave IV. Racial gap estimates furthermore exclude non-White or non–African American respondents and observations with missing family income or household size data. Results are weighted using GSWGT4_2 to account for nonrandom attrition from sample. Completion outcomes observed in Wave IV excludes GED recipients. The NLSY97 sample of 8,768 respondents includes those that completed eighth grade, with nonmissing highest grade completed and high school graduation data by the 2015 survey wave. Results are weighted using the Round 1 sampling panel weight (R1236201). Completion outcomes observed in the 2015 survey wave excludes GED recipients. The North Carolina sample includes students who enroll in the ninth grade for the first time in 2008 to 2011. The outcome is a dichotomous variable for whether a student graduates high school within 4 years. The full North Carolina sample includes 406,349 observations. Note that we do not weight the Add Health or NLSY97 estimates in the fourth panel, since we condition on household income. See text for discussion.
We proceed next to examine Black-White disparities. 16 The graduation gap ranges from 8.5 to 10.3 percentage points across the three samples, consistent with gaps reported in Heckman and LaFontaine (2010). Research on women’s attainment advantage over men and the increasing divergence between the academic trajectories of Black boys and girls motivates further segmenting the sample by gender (McDaniel et al., 2011; Saunders et al., 2004). The racial gap among boys of 12.0 to 14.6 percentage points is consistently larger than the female racial gap. Even then, we observe the empirical regularity of White students graduating high school at higher rates than their Black peers across samples and subgroups.
Previous studies examined how graduation rates vary by the interaction of gender and race, but less attention is given to how attainment outcomes vary by socioeconomic background (Murnane, 2013). 17 Research on the Black-White achievement gap that controls for socioeconomic status find that the latter accounts for anywhere between a quarter up to 85% of disparities at various points of the educational experience (Clotfelter et al., 2009; Fryer & Levitt, 2004, 2006; Murnane et al., 2006; Reardon & Robinson, 2008). 18 Moreover, there exists substantial heterogeneity by gender conditional on income (Chetty et al., 2018). A growing body of evidence finds that the effects of socioeconomic status on development and academic performance vary significantly across gender groups (Autor et al., 2016, 2019; Bertrand & Pan, 2013; Owens, 2016). This motivates a closer exploration of racial gaps in graduation for specific gender and income subgroups.
We use income as a proxy measure for socioeconomic status and report racial differences in attainment among the economically disadvantaged in the final panel of Table 1. 19 Among boys, Black students lag significantly behind girls in graduation across both national samples and are closer to parity in the North Carolina data set. Economically disadvantaged girls, on the other hand, reverse the traditional narrative of Black students falling behind in high school graduation. Low-income White girls graduate at a rate between 5.4 and 6 percentage points lower than their Black peers. 20 This unexpected graduation deficit for White girls is not limited to particular samples and birth cohorts. Our national and statewide administrative samples match the characteristics of similar samples used in the literature and the official statistics published by the state board of education. Furthermore, each of these data sets find graduation gaps that are consistent in sign and magnitude across birth cohorts spanning the late 1970s through the mid-1990s.
The question arises, then, of why low-income White females lag behind in high school graduation relative to Black females. We begin our inquiries by examining three sets of possible explanations for our findings. First, we verify that our results are not explained by higher household income among Black females and that results are robust to alternative definitions of economic disadvantage. Second, we explore the role played by a student’s family, neighborhood, and school context, such as the urbanicity of her neighborhood or the peer composition of her high school. Third, we examine whether low-income Black women graduate at higher rates because of greater endowments of cognitive and socioemotional skills as measured by school retention and delinquency, risky behaviors, and related attributes that predispose them to higher rates of high school graduation. After scrutinizing these factors, we consider reasons for why attainment patterns among low-income females differ markedly from well-established patterns of attainment, including among similarly disadvantaged males.
The Role of Economic Disadvantage
We first consider the possibility that among students who are economically disadvantaged, Black students may still have higher average family incomes when using an alternative, more fine-grained measure, and this can contribute to their better attainment outcomes. To the contrary, we show that low-income Black females come from households earning significantly less on average than White females. Both national longitudinal surveys find that low-income White females come from households at 108% to 113% of the federal poverty limit, while Black females come from households earning just 82% to 89% (Table 2). 21 Black students succeed in graduating high school in spite of their income levels, not because of them.
Family Incomes Among Low-Income Females
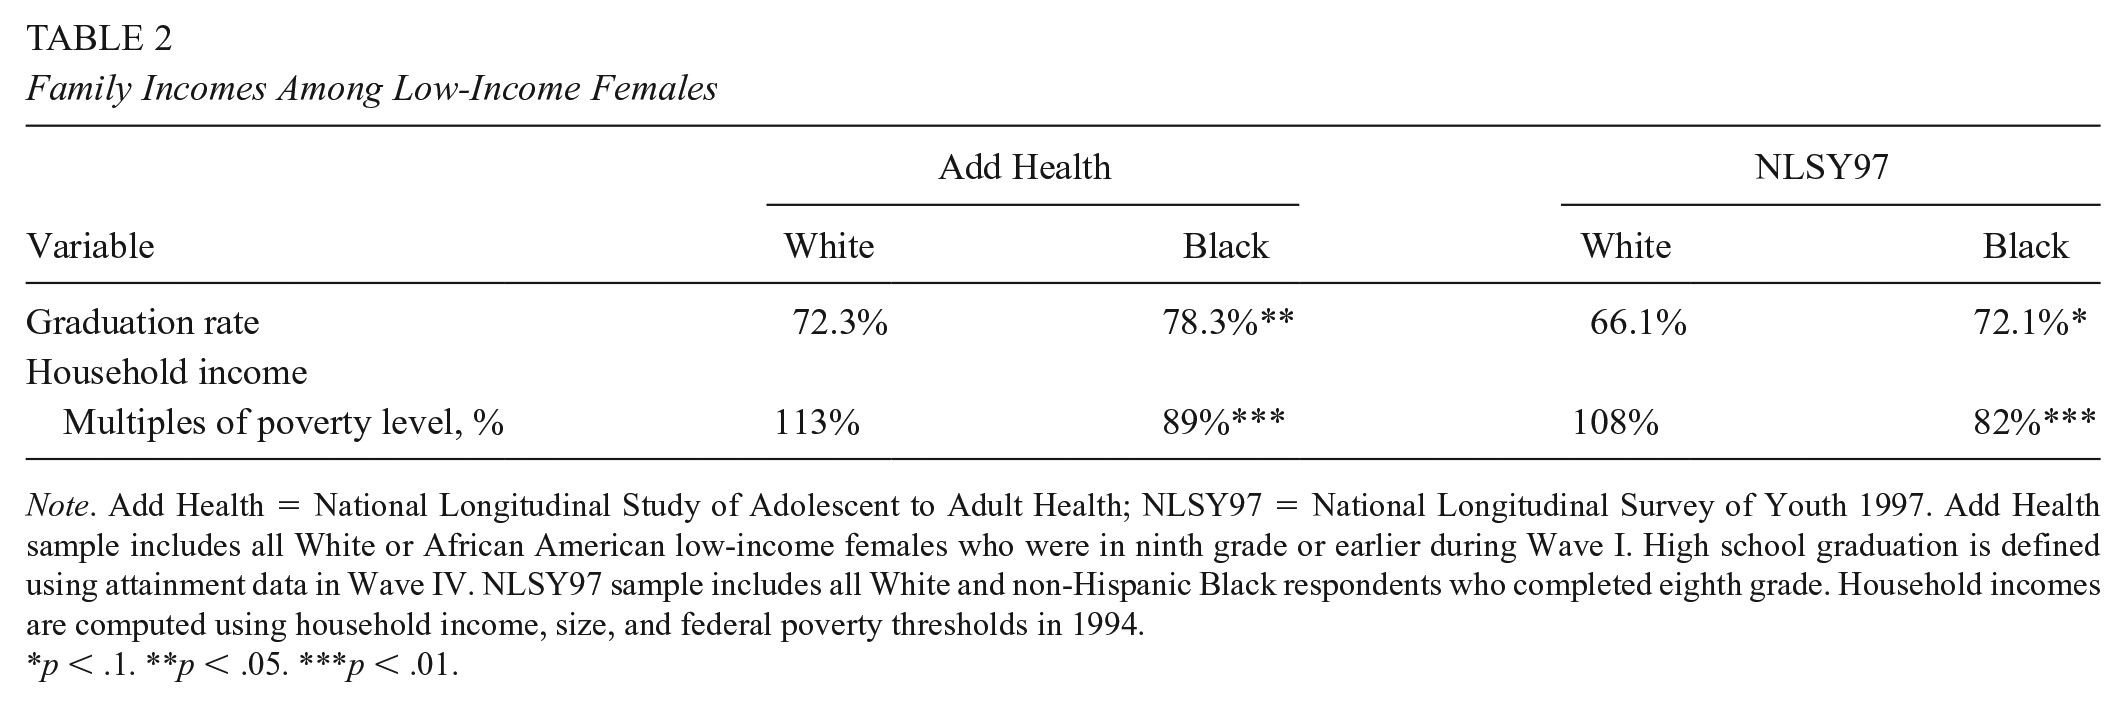
Note. Add Health = National Longitudinal Study of Adolescent to Adult Health; NLSY97 = National Longitudinal Survey of Youth 1997. Add Health sample includes all White or African American low-income females who were in ninth grade or earlier during Wave I. High school graduation is defined using attainment data in Wave IV. NLSY97 sample includes all White and non-Hispanic Black respondents who completed eighth grade. Household incomes are computed using household income, size, and federal poverty thresholds in 1994.
p < .1. **p < .05. ***p < .01.
A related concern is that our binary income classification masks important heterogeneity within the low-income female population; namely, the magnitude of the racial attainment gap for individuals from the most impoverished families relative to those near and above the 185% threshold is unclear. We therefore examine the sensitivity of our results across the full spectrum of socioeconomic backgrounds. Figure 1 plots a LOWESS-smoothed graph of the high school graduation rate for both the NLSY97 and Add Health across the ratio of income to poverty level, with a vertical marker for the 185% cutoff. The figure shows that the graduation advantage among economically disadvantaged Black females is robust to the choice of income cutoff. Black females have a higher graduation rate than White females over a broad income range, from zero to over two times the federal poverty level. Across both samples, White and Black females in households earning between four and five times the poverty level have similar graduation rates. These results underscore the importance of parsing racial gaps among females into its parts: differences in the distribution of household incomes for White and Black females, and differences in graduation rates at a given household income level.

Graduation rate by ratio of income to poverty.
Our analysis of North Carolina administrative data further supports the view that low-income White students underperform despite coming from families that are more economically privileged than their Black peers. The present categorization of economic disadvantage includes students who were ever eligible for FRL between 8th and 10th grades. This groups students experiencing transitory negative income shocks around the 185% threshold with those experiencing more permanent shocks and students misclassified as low income. Appendix Table A2 divides this lower income population into those who were consistently FRL eligible during elementary and middle school (bottom income level) versus those who had mixed eligibility records over time (middle income level). We supplement these results with median incomes of the student’s residential block group from the American Community Survey. We find that Black women consistently graduate at higher rates than White women across all income categories. The lower graduation rates of economically disadvantaged White females are most pronounced among the worst-off, even though White students reside in block groups with family incomes that average $6,400 higher. These results from North Carolina echo findings in Figure 1 that the lagging graduation rates of White students is starkest among the most economically disadvantaged families. 22
The Role of Neighborhood and School Contexts
We rely on geocoded data from North Carolina to explore whether the sorting of students by race into urban or rural neighborhoods contributes to the graduation patterns we observe. Population density can be associated with varying levels of social service provision, labor market opportunities, and the quality of education and related support services that may influence graduation outcomes. Table 3 shows estimates from linear probability models accounting for students’ residential block groups. The baseline Black attainment edge is 5.4 percentage points in North Carolina, with low-income Black females graduating at 80.3%, while their White counterparts lag at 74.9% (Table 1). This disparity increases with the addition of block group fixed effects, suggesting that the phenomenon we observe is pervasive even within fine-grained neighborhoods. 23 Notably, we find no evidence that these patterns vary by the rurality of students’ residential locations.
North Carolina—Neighborhood Factors

Note. The full sample includes economically disadvantaged ninth-grade Black and White female students during 2008–2011. Standard errors clustered at the school level.
Housing units in block group are classified as a mix of urban and rural in the 2010 Census. bAll housing units in block group are classified as rural in the 2010 Census.
p < .10. **p < .05. ***p < .01.
We next examine students’ school and classroom environments in contributing to observed graduation disparities. One potential explanation for the gap is that low-income Black females systematically attend schools that graduate students at higher rates. These schools could have programs that better serve students at risk of dropping out or credit recovery programs that affect the probability of completion. We assess whether increasing racial segregation and sorting by school attributes play a role by augmenting the base model with school fixed effects. The first column in Table 4 shows the same unadjusted graduation advantage of 5.4 percentage points among poorer Black females. Similar to the neighborhood analysis, the graduation gap increases in the school fixed effects model to 8.1 percentage points. This suggests that the graduation edge of low-income Black females persists within schools. Further restraining the racial comparison to within school and year combinations shows that low-income Black females graduate at 8.3 percentage points higher than their White peers.
North Carolina—School Sorting and Student Composition

Note. The full sample includes economically disadvantaged ninth-grade Black and White female students during 2008 to 2011. The omitted group is the share of non-White and Black students in the individual’s ninth-grade class. Standard errors are clustered at the school level.
p < .10. **p < .05. ***p < .01.
Finally, we interact the coefficient of interest with school-level student composition variables to assess the extent to which the graduation gap’s magnitude depends on the prevalence of each sociodemographic subgroup. Column (4) shows that the Black female attainment advantage is increasing in the share of economically disadvantaged White students and decreasing in the share of better-off White students. The gap is not significantly affected by other student groups. The association between graduation rates and peer composition within the school setting suggests a social dimension to these patterns. Social networks and its influence on risky behaviors and attainment may merit closer attention (Kawaguchi, 2004; Lundborg, 2006).
The Role of Cognitive and Socioemotional Skills
We shift from neighborhood and school-level attributes to individual characteristics. We start by examining the role that cognitive factors play in explaining the attainment gap and follow with a detailed analysis of how socioemotional and behavioral attributes account for observed disparities.
Cognitive Skills
It is well documented that cognitive skills shape educational attainment, labor market outcomes, and other dimensions of individual well-being (Hanushek & Woessmann, 2008; Heckman, 2008). The first step in our analysis explores the variation in this determinant of schooling to see whether higher graduation rates among low-income Black females is explained by superior cognitive ability. To do so we focus on standardized test scores and average student GPAs on a 4-point scale. 24 Even though many social science researchers use achievement test scores, GPA, and IQ to capture dimensions of cognitive functioning, it is increasingly recognized that personality traits and other noncognitive skills play a role in the formation of grades (see, e.g., Heckman & Kautz, 2012). While we use GPA as a cognitive measure, our qualitative results are robust to excluding GPA as a measure of cognitive ability.
Table 5 summarizes test scores and grades. Low-income Black females have test scores that are up to two thirds of a standard deviation lower, and eighth grade GPAs that are between 0.1 and 0.14 points lower than economically disadvantaged White females. 25 These means suggest that conditioning on test scores and GPA would only reinforce the Black female graduation advantage, under the assumption that they are positively correlated with graduation outcomes. Table 6 regresses high school graduation on being a low-income Black female with baseline controls, with additional models augmented with household income and cognitive attributes. Column (1) shows that poorer Black females in Add Health and NLSY97 graduate, respectively, at 6.6 and 6.4 percentage points higher than their White counterparts. When we include household income, the attainment edge of economically disadvantaged Black women increases. The same occurs when conditioning on test scores and GPA, suggesting that equalizing these measures of cognitive ability further increases the graduation advantage of low-income Black females who lag in these positive correlates of completion. The findings are robust to the use of multiple imputation. Appendix Table A4 shows a graduation advantage among low-income Black females that are similar in magnitude after accounting for missing values.
Cognitive Skills Among Low-Income Females

Note. Add Health = National Longitudinal Study of Adolescent to Adult Health; NLSY97 = National Longitudinal Survey of Youth 1997; GPA = grade point average. Add Health sample includes all White or African American low-income females who were in ninth grade or earlier during Wave I. High school graduation is defined using attainment data in Wave IV. NLSY97 sample includes all White and non-Hispanic Black respondents who completed eighth grade. Test scores from the Picture Vocabulary Test in Add Health and the Armed Forces Qualifications Test scores in the NLSY97 are standardized to z scores. GPA from Add Health is the average math and English GPA on a 4-point scale.
p < .1. **p < .05. ***p < .01.
Income, Cognitive Measures, and High School Graduation

Note. Add Health = National Longitudinal Study of Adolescent to Adult Health; NLSY = National Longitudinal Survey of Youth 1997; GPA = grade point average; SES = socioeconomic status. The table shows coefficients corresponding to linear probability models regressing high school graduation outcomes on an indicator for being a low-income Black female, birth year, and additional covariates. The Add Health sample includes low-SES White or African American respondents who were in ninth grade or earlier during Wave I. Standard errors are clustered at the school level. The NLSY97 sample includes low-SES White and non-Hispanic Black respondents who completed eighth grade. Standard errors are clustered at the NLSY97 primary sampling unit and stratum. The coefficient for the Black female indicator varies from the summary statistics because these specifications adjust for birth year and drop respondents with missing values for the additional controls.
p < .1. **p < .05. ***p < .01.
Socioemotional and Behavioral Attributes
A substantial body of research relates the role of noncognitive factors such as behaviors and attitudes to educational and labor market outcomes (Bowles & Gintis, 1976; Farkas, 2003; Heckman & Rubinstein, 2001; Rumberger, 2011). The capacity of these characteristics to influence earnings independent of traditional cognitive measures is well-recognized (Almlund et al., 2011; Borghans et al., 2014; Jencks, 1979; Murnane et al., 2001). Research increasingly documents the relevance of such inputs for drop out and graduation (Alexander et al., 1997; Aucejo, 2015; Heckman et al., 2006). 26
We examine the role of socioemotional and behavioral attributes for the observed graduation gap. Survey items taken during initial waves, when students were at the beginning of their high school education or in middle school, cover a range of schooling and health behaviors and socioemotional attributes. We follow previous literature in the selection of these variables to capture ability outside of cognitive domains. Measures from school records include retention, absences, tardies, or general delinquency (Jackson, 2018). We rely on risky behaviors during childhood such as the use of alcohol, tobacco, marijuana, and illicit drugs that have been shown to predict academic outcomes (Crosnoe, 2006; Cunha & Heckman, 2008). We use the Rosenberg Self-Esteem Scale in Add Health due to its correlation with the traditional Big Five typology used as a long-standing socioemotional measure (Almlund et al., 2011). Remaining measures including self-reported desire and likelihood of attending college and life experiences such as bullying approximate individual expectations and hardships.
Summary statistics in Table 7 show that White females lag behind across a number of these measures. While low-income Black females are more likely to be retained at least one grade before entering high school, they have fewer absences and score one sixth lower on a delinquency index than low-income White females. An even starker contrast is apparent when examining measures of substance use. Low-income Black females are significantly less likely to have reported ever using tobacco, alcohol, marijuana, and other illicit drugs during adolescence. In addition to striking differences at the extensive margin, results not shown here document that economically disadvantaged Black females who have been initiated into these substances also use them at lower frequency. These racial gaps among the focal group of disadvantaged females echo findings from a broad literature spanning epidemiology and public health that Black adolescents record lower alcohol, tobacco, and illicit drug consumption than their non-Hispanic White peers (Keyes et al., 2015; Swendsen et al., 2012). 27 Black females furthermore profess greater intention as well as likelihood of attending college compared to White peers.
Socioemotional Attributes Among Low-Income Females
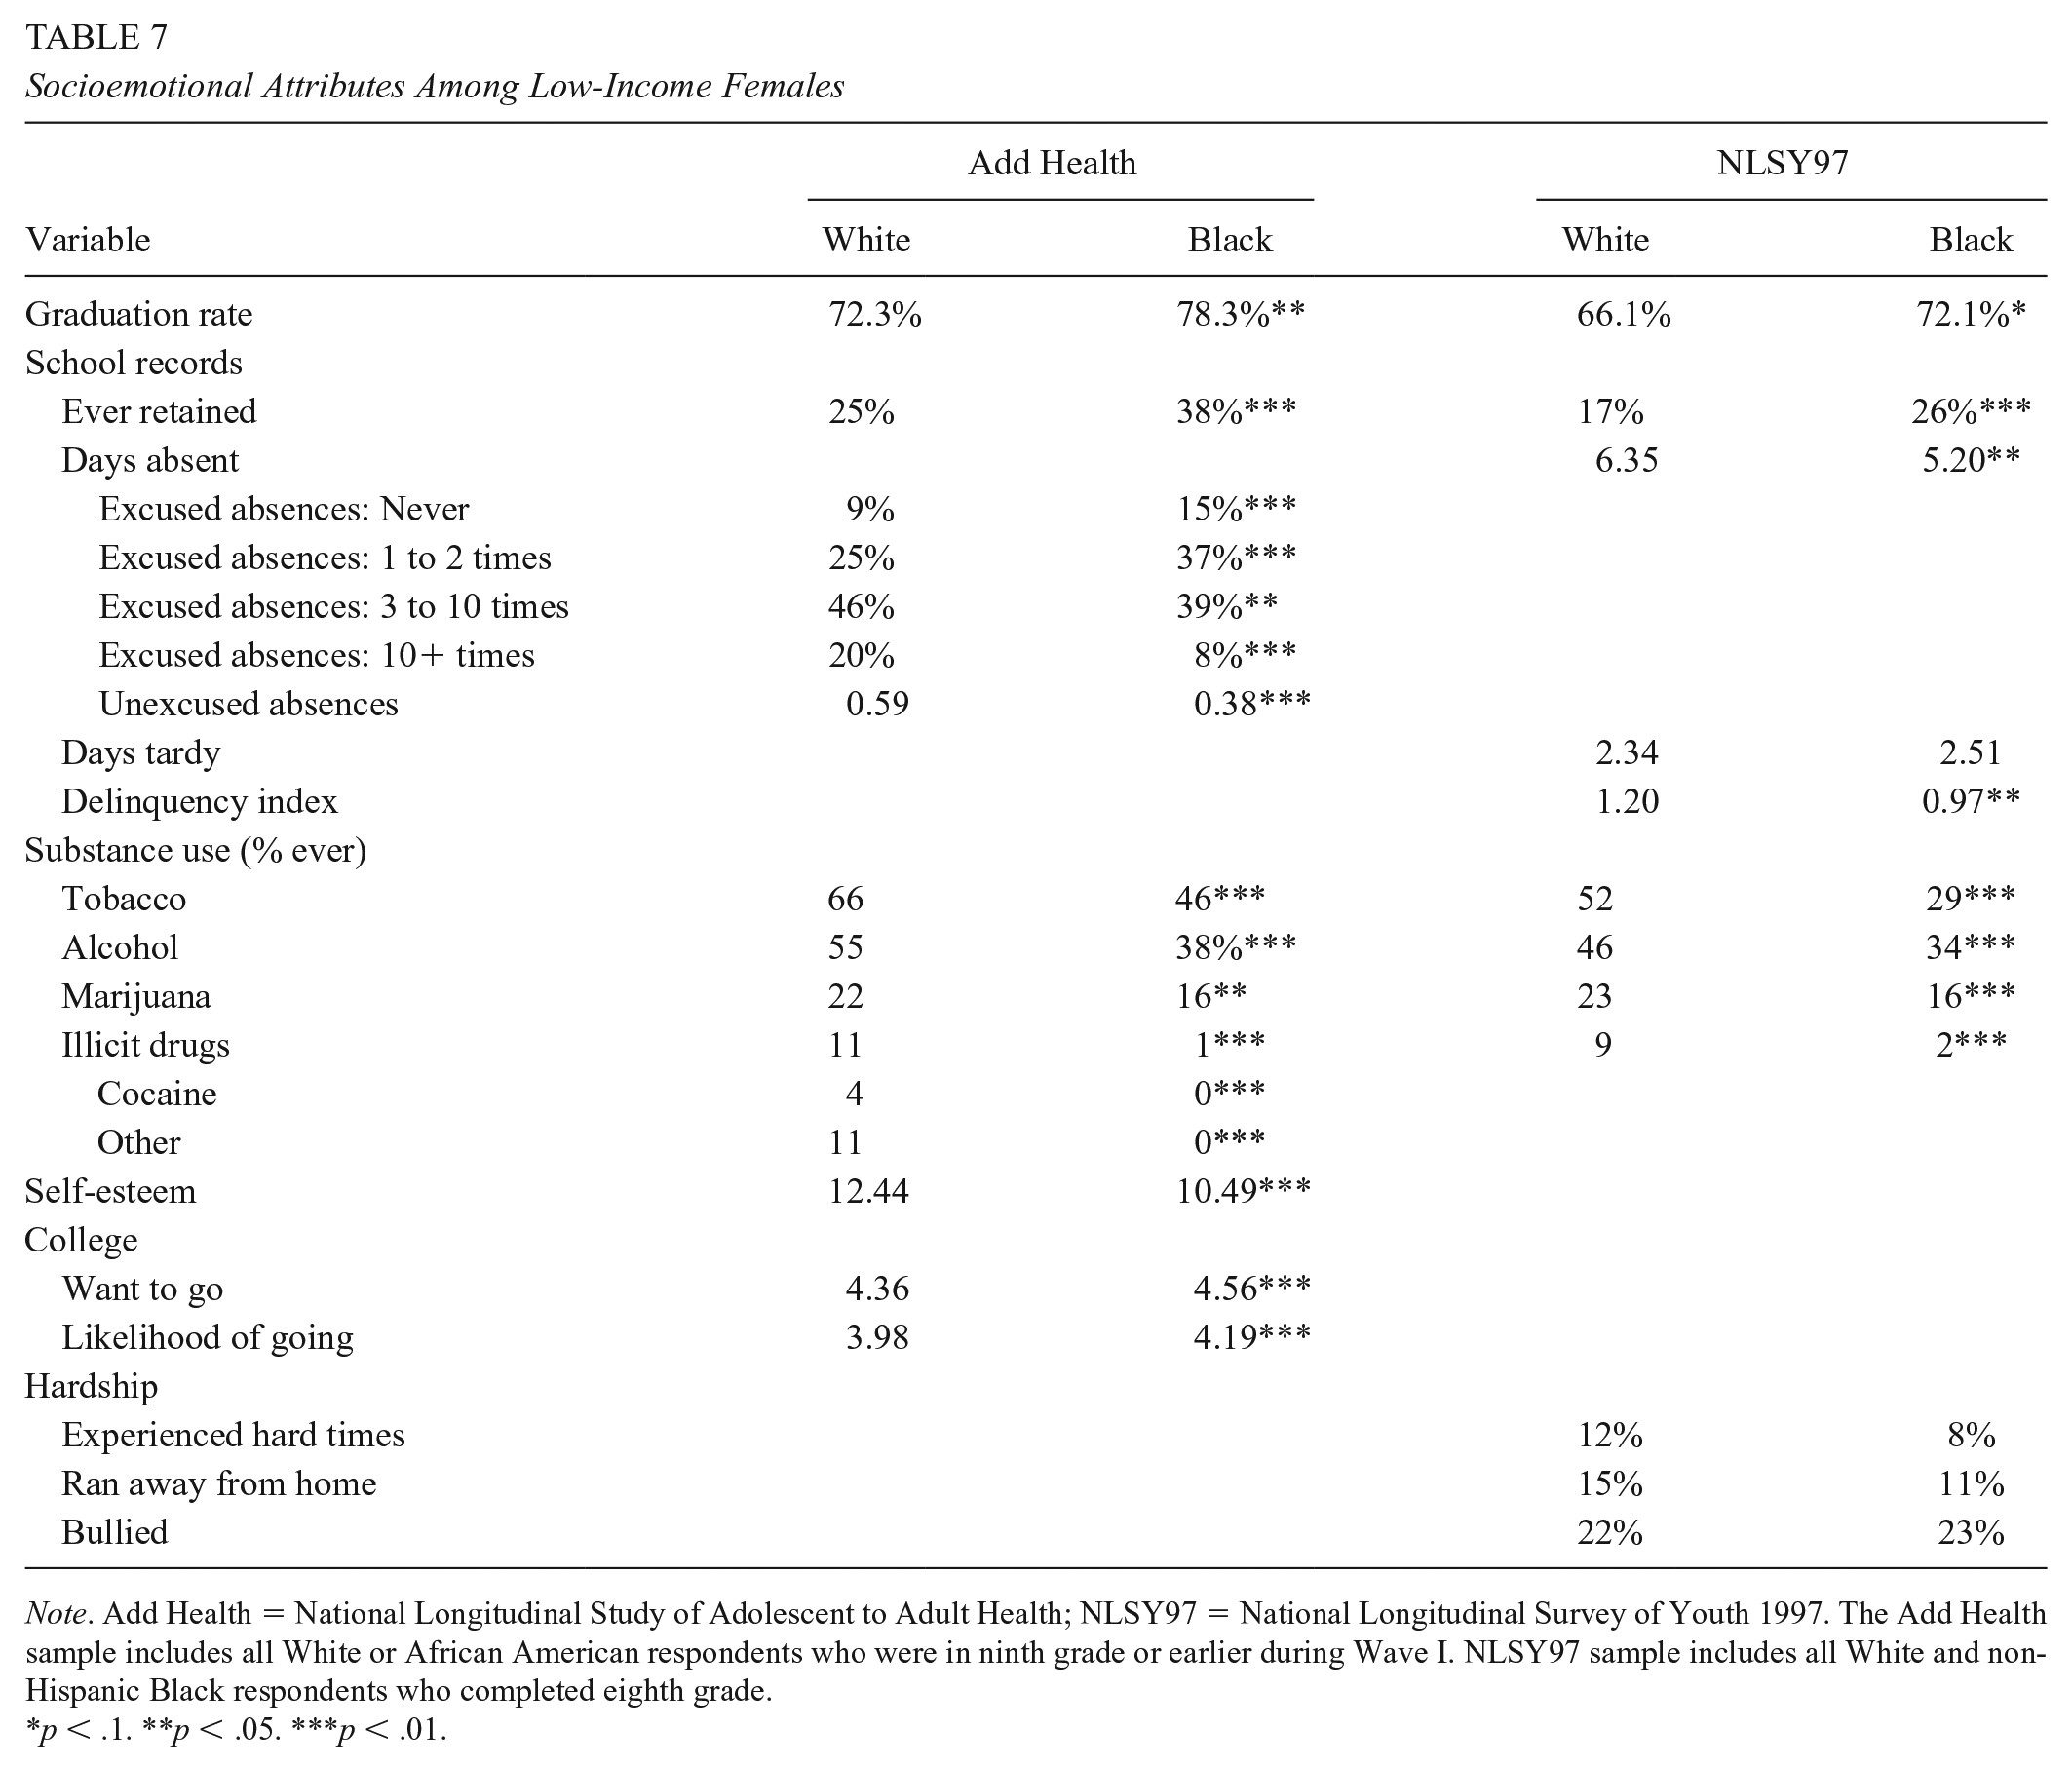
Note. Add Health = National Longitudinal Study of Adolescent to Adult Health; NLSY97 = National Longitudinal Survey of Youth 1997. The Add Health sample includes all White or African American respondents who were in ninth grade or earlier during Wave I. NLSY97 sample includes all White and non-Hispanic Black respondents who completed eighth grade.
p < .1. **p < .05. ***p < .01.
Table 8 examines the extent to which these measures account for the observed Black female attainment advantage by reporting coefficients from linear probability models regressing high school graduation on being a low-income Black female, baseline controls, and socioemotional or behavioral attributes. The first specification confirms low-income Black females in both longitudinal surveys graduate at rates that are more than 6 percentage points higher than White females.
Socioemotional Measures and High School Graduation

Note. Add Health = National Longitudinal Study of Adolescent to Adult Health; NLSY = National Longitudinal Survey of Youth 1997; SES = socioeconomic status. The table shows coefficients corresponding to linear probability models regressing high school graduation outcomes on an indicator for being a low-income Black female, birth year, and additional covariates. The Add Health sample includes low-SES White or African American respondents who were in ninth grade or earlier during Wave I. Standard errors are clustered at the school level. There are 886 observations across all specifications. The NLSY97 sample includes low-SES White and non-Hispanic Black respondents who completed eighth grade. Standard errors are clustered at the NLSY97 primary sampling unit and stratum. There are 872 observations across all specifications. The coefficient for the Black female indicator varies from the summary statistics because these specifications adjust for birth year and drop respondents with missing values for the additional controls.
p < .1. **p < .05. ***p < .01.
Specifications in columns 2 to 7 consider the role of socioemotional and behavioral measures. Accounting for absenteeism and retention, substance use, self-esteem, and college expectations in the Add Health sample leaves a graduation gap of 3.2 percentage points that is no longer significantly different across racial groups. Similarly, adding controls for absenteeism, delinquency, retention, substance use, and hardship in the NLSY97 sample decreases the graduation gap to a nonsignificant 2.7 percentage points. 28 A consistent feature of these models is an attenuated racial graduation disparity when accounting for the use of tobacco, alcohol, marijuana, cocaine, or other illicit drugs during early adolescence.
We estimate the contribution of individual socioemotional and behavioral measures by relying on the Gelbach decomposition technique. This approach, based on the sample omitted variables bias formula, addresses the issue of sequencing sensitivity to render estimates invariant to the order in which variables are added to the specification (Gelbach, 2016). The relevance of a covariate derives from two factors when we apply this technique to the Black-White graduation gap: (1) Black-White differences in this covariate after partialing out all other explanatory variables in the base regression and (2) the extent to which the covariate is correlated with educational attainment. 29 Results from the decomposition are consistent estimates of the conditional contribution of each variable.
We find that behavioral and personality proxies for students’ noncognitive skills collectively explain between 51% and 59% of the Add Health and NLSY97 samples, respectively (Table 9). Factors such as absenteeism, delinquency, retention, and self-esteem play no significant role. 30 The largest contributor accounting for between 34% and 38% of the graduation gap between low-income Black and White females in both samples is adolescent substance use. Economically disadvantaged White females are significantly more likely to use every drug: 20 to 23 percentage points more likely to use tobacco, 12 to 17 percentage points more likely to use alcohol, and 6 to 7 percentage points more likely to use marijuana. Even more alarming is the finding that low-income White women are overwhelmingly more likely to use illicit drugs like cocaine, heroin, and methamphetamines than Black women. No more than 2% of low-income Black females use these illicit drugs in our samples, while between 9% and 11% of low-income White females do so across our two samples.
Decomposition

Note. Add Health = National Longitudinal Study of Adolescent to Adult Health; NLSY97 = National Longitudinal Survey of Youth 1997. The Add Health sample includes all White or African American respondents who were in ninth grade or earlier during Wave I. NLSY97 sample includes all White and non-Hispanic Black respondents who completed eighth grade. The attainment advantage in the Add Health base model of 6.6 percentage points decreases to 3.2 percentage points in the full sample.
p < .1. **p < .05. ***p < .01.
Discussion
Our findings show that the early onset of substance use among low-income White females predicts lower attainment. We cannot rule out the possibility of omitted variables, as hard-to-observe factors that induce greater substance use may also adversely affect schooling attainment. Substance use can exert an influence on educational attainment on its own, or its explanatory power can derive from correlated factors. It has been documented, for instance, that mental health issues and substance use often co-occur among adolescents, which motivates studies of their joint consequences for educational attainment (Breslau et al., 2011; Macleod et al., 2004). A growing body of research also finds that mental health problems are directly associated with lower high school completion (Breslau et al., 2008; Evensen et al., 2016; Kessler & Saunders, 1995). In light of previous evidence, we verify that our findings are robust to the inclusion of mental health variables in both national longitudinal surveys. We show that these factors do not have a sizable impact on the Black-White attainment gap when included on their own or concurrently with substance use covariates (Appendix Table A6). Note that this does not preclude an association between mental health factors and educational attainment and only suggests that these variables play a lesser role than substance use for racial disparities in attainment.
Our results call to attention literature showing the effect of substance use on schooling outcomes. Chatterji (2006) documents a relationship between illicit drug use and attainment while Marie and Zölitz (2017) show that substance use lowers academic performance. 31 Beyond academic outcomes, tobacco, alcohol, and drug use also have negative ramifications for health, spanning from cardiovascular disease to increased injuries and mortality (Carpenter & Dobkin, 2009; Hall & Degenhardt, 2009). Recent findings of rising mortality and morbidity among less-educated non-Hispanic White adults emphasize the role of drug overdoses, suicides, and alcohol-related liver mortality in disproportionately affecting this sociodemographic group, with evidence suggesting worsening labor market opportunities with accompanying cumulative disadvantage for this group (Case & Deaton, 2017). While our study timeline stops far short of later life morbidity and mortality, it prompts questions about the prelabor market origins of such patterns among the low-income White population.
The question remains of why the Black-White graduation gap is only reversed for low-income females instead of males of similar economic standing. It may be that economically disadvantaged White women fare particularly poorly in educational attainment relative to White men, or Black women perform better than predicted. The former possibility has an analogous result in the recent “deaths of despair” literature, which documents a higher mortality increase for non-Hispanic White women than men (Gelman & Auerbach, 2016; Woolf et al., 2018). Causes for rising female death rates include drug overdoses linked to the epidemic of prescription opioids, smoking- and obesity-related illnesses, and suicide (Astone et al., 2015; Woolf et al., 2018). 32 The observation that these patterns are particularly salient among middle-aged White women in the southern United States suggests closer study is warranted for understanding afflictions that are specific to this population (Gelman & Auerbach, 2016).
At the same time, the Black-White reversal in graduation rates may be attributed to relatively better performance among low-income Black girls. A growing literature documents academic resilience among economically disadvantaged minority populations (Catterall, 1998; Strand, 2014). Researchers are also repeatedly documenting a gender difference in sensitivity to family disadvantage, with boys’ behavioral and academic outcomes more adversely affected than girls’ (Autor et al., 2019; Bertrand & Pan, 2013). 33 Taken together, these strands of research suggest that Black females from low-income households may fare better than their brothers in ways that contribute to the graduation patterns we observe.
Conclusions
Black-White disparities in educational achievement and attainment are a well-documented empirical regularity (Fryer & Levitt, 2006; Murnane et al., 2006; Reardon & Robinson, 2008). However, disaggregating by income and gender reveals a striking finding: high school graduation rates among low-income White females are consistently 5 to 6 percentage points lower than their Black female peers. Data from two national longitudinal surveys and administrative records from the state of North Carolina verify that these patterns persist despite economically disadvantaged Black females averaging lower household incomes and standardized test scores. As such, the achievement gap we observe between Black and White students does not translate to an analogous disparity in high school graduation rates.
To account for White students’ relative underperformance in high school graduation, we examine disparities in cognitive skills and a range of socioemotional and behavioral attributes spanning school delinquency, substance use, and self-esteem. Accounting for standardized test scores and grades magnifies the attainment advantage of poorer Black females. In contrast, behavioral factors markedly close the gap, with substance use explaining approximately one third of the overall disparity across both national samples. Low-income Black females average significantly lower average rates of tobacco, alcohol, marijuana, and illicit drug use than their White peers.
The evidence shows that socioemotional proxies such as the early onset of risky health behaviors are relevant factors for high school graduation. Closer scrutiny of these inputs is warranted for improving graduation rates across student groups, particularly given the rising labor market returns to schooling. Two thirds of earnings inequality in the United States from 1980 to 2005 is attributable to greater schooling premiums (Autor, 2014; Goldin & Katz, 2007), such that the difference between dropping out and completing high school with the option to pursue higher education is increasingly stark. 34
A key implication of this study is that examining attainment inequality from an exclusively racial or gender lens obscures the trends that are distinct to groups at the intersection of sociodemographic categories. Similar levels of economic disadvantage can materialize in different ways for each group to put downward pressure on high school graduation rates. By examining patterns at the intersection of race, gender, and income, we are able to show that disadvantaged Black females challenge the conventional narrative on racial graduation gaps. They maintain lower rates of substance use and school-related delinquencies despite residing in some of the most underprivileged neighborhoods and scoring below White peers on standardized tests. Their unexpected edge in educational attainment suggests that efforts to improve graduation outcomes can focus on Black females’ resilience to disadvantage and challenges disproportionately faced by their White peers. More broadly, a closer examination of students in granular sociodemographic categories can inform tailored policies to improve high school graduation outcomes.
Footnotes
Appendix
Mental Health Factors and High School Graduation

| Variable | 1 | 2 | 3 |
|---|---|---|---|
| Add Health (n = 886) | |||
| Black female | 0.066* (0.034) | 0.060 (0.038) | 0.039 (0.037) |
| Additional controls | |||
| Mental health | Y | Y | |
| Absenteeism and retention | N | Y | |
| Substance use | N | Y | |
| Self-esteem | N | Y | |
| Expectations | N | Y | |
| NLSY97 (n = 872) | |||
| Black female | 0.064* (0.037) | 0.067* (0.035) | 0.033 (0.033) |
| Additional controls | |||
| Mental health | Y | Y | |
| Absenteeism, delinquency, and retention | N | Y | |
| Substance use | N | Y | |
| Hardship | N | Y | |
Note. Add Health = National Longitudinal Study of Adolescent to Adult Health; NLSY97 = National Longitudinal Survey of Youth 1997. The table shows coefficients corresponding to linear probability models regressing high school graduation outcomes on an indicator for being a low-income Black female, birth year, and additional covariates. The Add Health sample includes all White or African American respondents who were in ninth grade or earlier during Wave I. Mental health factors include four Wave I variables on the frequency of crying, feeling moody, blue, or depressed. Standard errors are clustered at the school level. There are 886 observations across all specifications. The NLSY97 sample includes all White and non-Hispanic Black respondents who completed eighth grade. Mental health factors include three variables taken in 2000 on how often the respondent felt nervous, blue, or depressed over the previous month. Standard errors are clustered at the NLSY97 primary sampling unit and stratum. There are 872 observations across all specifications.
p < .1. **p < .05. ***p < .01.
Acknowledgements
This study was funded by the Institute for Education Sciences (Award R305B130017). The authors declare that they have no conflict of interest. We are thankful to Peter Arcidiacono, Charles Clotfelter, V. Joseph Hotz, Marie Hull, Seth Sanders, Jacob Vigdor, and seminar participants at the AEFP and APPAM conferences for their helpful feedback. We gratefully acknowledge funding from the Institute for Education Sciences (Award R305B130017).
Notes
Authors
BRIAN CLARK is an economist in the Antitrust Division of the U.S. Department of Justice. His research focuses broadly on the effect of students’ educational choices on labor market outcomes.
YING SHI is an assistant professor of public administration and international affairs at Syracuse University. Her research focuses broadly on the causes and consequences of educational inequality.