
Abstract
Although convergent research demonstrates that well-designed graphics can facilitate readers’ understanding of text, there are select situations where graphics have been shown to have no effect on learners’ overall text comprehension. Therefore, the current meta-analytic study examined 39 experimental studies published between 1985 and 2018 measuring graphics’ effects on readers’ comprehension. We first quantified the overall effect on reading comprehension. Then, we considered interactions with learners’ characteristics, graphic types, and assessment formats. Our analysis revealed that the inclusion of graphics had a moderate overall positive effect (Hedges’s g = 0.39) on students’ reading comprehension, regardless of grade level. Regarding graphic type, we did not find a significant difference among pictures, pictorial diagrams, and flow diagrams. Only when compared to mixed graphics, pictures had a greater effect on comprehension. Additionally, compared with true and false assessments, graphics differentially benefited students’ comprehension on open-ended comprehension assessments and mixed format assessments. Implications for future research are presented.
Modern texts, both print and electronic formats, have become increasingly multimodal and complex (Coleman & Dantzler, 2010; Maeda, 2006). Yet the literacy field continues to overemphasize the verbal (relative to visual) aspects of texts—a phenomenon documented by Winn 30 years ago as verbal bias (Winn, 1987). He argued that an unfortunate by-product of this bias is that students underdevelop the mental structures endemic to visual processing. Furthermore, verbal bias relegates graphical representations to a distant secondary role in the process of learning from texts (Schnotz et al., 1993). Particularly with modern texts, such an approach can limit readers’ comprehension. Looking to the future, when acknowledging current trends in communication, various modes of representation may soon replace language as a core unit of communication (e.g., emojis are already supplanting words in text messages); thus, we need a better understanding about how people learn from graphics (Kress, 2003).
Despite increased use of visuals for communication, our knowledge base for visual text comprehension is nascent and disorganized compared with verbal text comprehension. Research on the effect of graphics on reading comprehension contains problematic discrepancies. While readers generally benefit from having both verbal and visual sources of information, research demonstrates certain situations where graphics have no, or even negative effects, on learners’ comprehension (Ardasheva et al., 2018; Hayes & Reinking, 1991; McTigue, 2009). Furthermore, the diversity of outcome measures quantifying learning from graphics adds extra challenge for comparing findings. For example, Levie and Lentz’s (1982) review included five unique forms, Peeck’s (1987) review added delayed recall, while Mayer and Gallini’s (1990) work focused on application. Additionally, such reviews are dated, which is particularly problematic in a field that has changed rapidly in recent years. Therefore, the purpose of this work is to quantify and describe the impact of instructional graphics on learners’ reading comprehension to better understand under what conditions graphics facilitate comprehension.
Why Do We Need a Review of Graphics’ Contribution to Reading Comprehension?
Before proceeding further, it is necessary to define our outcome measure—reading comprehension. Extending the definition from the RAND Reading Study Group (2002), we conceptualized reading comprehension as the process of simultaneously extracting and constructing meaning through interaction with both verbal and visual texts. We assume active and intentional thinking are involved in the interactions between the text and reader (Durkin, 1978). Although we recognize that texts can include animation, within this review, we only considered static visuals embedded within connected print, either traditional or electronic. Thus, we excluded computer simulations, narrated visuals, and visuals with only verbal labels. Our interest is pragmatic because readers most commonly encounter these texts in school.
Although graphics possess the potential to facilitate readers’ comprehension (e.g., Carney & Levin, 2002; Hannus & Hyönä, 1999), and graphical comprehension skills represent a unique contribution to overall comprehension (Roberts et al., 2015), they also add to text complexity (Renkl & Scheiter, 2017). As such, readers experience a cost-benefit interaction with graphics. The cost of graphics can be particularly high for novice readers with developing decoding skills and thereby limited cognitive capacities for other tasks (i.e., competitive processing), whereas when decoding is automatic, the verbal and visual comprehension processes work collaboratively (Kirby, 1993).
Supporting this hypothesis, Reid and Beveridge (1990) and Hannus and Hyönä (1999) found that graphics benefited higher ability children but diminished learning in lower ability children. However, other researchers found that graphics had limited or no effects on reading comprehension (e.g., Brookshire et al., 2002; Schnotz & Bannert, 2003). Adding to the intricacy, other inquiries compared the impact of graphical displays on students’ learning but offered no control condition (e.g., Schrader & Rapp, 2016) so any cost-benefit calculations cannot be determined. Thus, it is challenging to compare results between studies due to disparate definitions of learners’ abilities and outcome measures. To determine both what is known, and what is not yet known, the literacy field needs greater efforts to synthesize findings.
Previous Reviews Connecting Graphics and Reading Comprehension
Below, we summarize those few reviews that have considered the relationship between graphics and reading comprehension, highlighting that the impact of visual on students’ reading comprehension remain unclear. Most relevant, Readence and Moore (1981) reviewed 16 studies considering the effects of graphics on reading comprehension. Findings revealed a small positive effect of adjunct pictures on reading comprehension, with more robust results for university readers over K–12 students. However, their research only examined line drawings, shaded drawings, and (often black and white) photographs, which do not represent the complex and colorful graphics students now encounter, such as diagrams, flow diagrams, and maps (Fingeret, 2012; Guo et al., 2018).
Carney and Levin’s (2002) quantitative review examined empirical studies published between 1990 and 2002 exploring “why” and “when” graphics are effective. Findings indicate that illustrations with specific functions improved students’ learning. However, these researchers only analyzed graphical functions without considering interactions with learner variables.
This exclusion of participant variables is problematic because, as indicated by Kirby (1993) and reinforced by Vekiri’s (2002) systematic review, learner characteristics affect the benefit of graphics. Vekiri concluded that graphics are effective only when they allow readers to interpret and integrate information with minimum cognitive processing. Furthermore, when designing graphics, one must simultaneously consider the nature of the task, characteristics of the intended readers, and the type of information conveyed. Notably, Vekiri’s principles for graphics overlap with both Ainsworth’s (2006) conceptual framework of learning from multiple representations and Kirby’s (1993) framework for multimedia learning, but with key differences: Ainsworth elevated the role of representation, proposing that design parameters are endemic to particular representations and functions. Kirby focused on the nature of information and individual differences but also attended to issues of interference and learners’ attention. When overlaying these three frameworks, it becomes self-evident that research in this realm must consider nuanced questions such as “Under which conditions do graphics support learning?”
Answering this call, Renkl and Scheiter (2017) aimed to identify learners’ prominent challenges when reading graphics. Findings demonstrated that students’ information processing skills affected their learning from graphics. For instance, learners often have underdeveloped strategies for deriving information from graphics and can struggle to integrate visual and textual information. To optimize learning, Renkl and Scheiter suggested support procedures, including material design, learning-centered interventions, and pretraining interventions. However, before this line can be fully inquired, we still need to more clearly consider questions such as “What type of visuals should be taught?” and “Who should we instruct?”
In summary, these reviews indicate that learners tend to derive a small, but positive, effect from graphics. When graphics help organize, interpret, or transform textual information, they may offer the greatest benefits. However, effects of graphics on learning are mediated by learners’ skills and the task, although there is less agreement regarding the specific predictions for these mediations. Therefore, the purpose of the present meta-analysis is to quantify the impact of graphics specifically on reading comprehension. As literacy researchers, we considered visual literacy within reading comprehension, separating this analysis from previous work (e.g., Renkl & Scheiter, 2017; Vekiri, 2002) in which researchers conceptualized learning more globally. Furthermore, due to the nature of narrative analyses, Renkl and Scheiter (2017) did not quantify the impact of graphics. Our work allows us to complement their narrative findings via effect sizes. Finally, in line with guidelines by Kirby (1993), Vekiri (2002), and Ainsworth (2006), we sought to consider specific interactions between learners and graphic types through our moderator analysis.
Supporting Theories and Literature
First, we define graphics and outline theories that help account for the effects of graphics and underlie our research questions. Then, we examine the variables that may attenuate the effectiveness of graphics for comprehension.
Describing and Categorizing Graphics
Despite their importance in text comprehension, literacy researchers lack consistent definitions for graphics (Slough et al., 2010). Based on existing literature, we define graphics as both polysemic and monosemic representations, including diagrams, maps, graphs, tables, photographs, and images. Transitioning to specific graphical types, Vekiri (2002) classified graphics based on presentation (i.e., diagrams, maps, and network charts), whereas Hegarty et al. (1996) categorized graphics based on their functions (i.e., iconic diagrams, charts, and graphs). In an iterative process of synthesizing previous works while coding studies (e.g., Hegarty et al., 1996; Roberts et al., 2013; Vekiri, 2002), we categorized graphic display into four types: pictures, pictorial diagrams, flow diagrams, and mixed graphics (if the study used more than one type of graphic).
Theoretical Foundations for Use of Graphics in Text
We approached this work from a cognitivist viewpoint, relying on two related, but distinct, theoretical stances.
Dual Coding Theory
Dual coding theory (DCT; Paivio, 1971) has frequently been used to justify including graphics with text (e.g., Hannus & Hyönä, 1999; Vekiri, 2002). When learners encode information in both verbal and visual forms, they can more easily retrieve knowledge from their long-term memory, facilitating robust mental models. Applied to reading comprehension (Sadoski & Paivio, 1994), DCT predicts that, when approaching abstract texts, readers have relatively few mental images to support the language and cannot capitalize on nonverbal cognition. As such, abstract texts require more mental energy. Adding concreteness (e.g., graphics) enriches mental representations by adding specificity. Additionally, graphics can prompt learners to store information in two forms (i.e., visual and verbal), which reduces cognitive overload and aids memory by having two pathways to the same information. For example, a science text may present how water is composed of hydrogen and oxygen via a verbal description and a diagram. When later quizzed, a reader may forget the wording but be able to visualize the diagram, and thereby recall essential content.
Regarding learner variables, DCT has been assessed with both young and adult learners (Sadoski & Paivio, 2013) with both groups appearing to benefit similarly from concreteness and struggle with abstractness. Regarding the design of graphical representations, because DCT posits that mental imagery assists in comprehension, more realistic graphics (e.g., photographs) may better promote comprehension.
Cognitive Theory of Multimedia Learning
Cognitive theory of multimedia learning (CTML; Mayer, 2001), grounded in DCT, predicts learning in multimodal environments and informs principles of multimedia design (Mayer, 2009). According to CTML, three essential processes contribute to the successful comprehension. In the first process, selection, learners extract relevant information from verbal text and graphics. Then, learners organize relevant information for comprehension. Last, learners integrate these two models. It is important to note that Renkl and Scheiter (2017) identified that many learners had difficulty with these exact cognitive processes, therefore learning from graphics can be diverted at many points.
Moreover, CTML predicts that graphics promote higher level learning. For example, Mayer et al. (1984) found positive effects of diagrams for comprehension of texts describing systems (e.g., mechanical and biological). However, the presence of diagrams actually had negative effects on subjects’ verbatim text recall. The authors hypothesized that readers use diagrams to create a mental model of the concept, but during the phase of integration readers maintained only the key ideas.
In reference to diagram design, CTML emphasizes the coherence principle (Mayer, 2009) in which extraneous information is removed, thus focusing learners’ attention on the essential information. This work promotes designs such as flow charts, which focus on the essential components of a system and the relations within. In contrast, detailed and realistic portrayals (e.g., photographs) contain extraneous information that may distract learners.
Regarding individual learner differences, CTML has been tested almost exclusively with college students (e.g., Mayer, 1989; Mayer & Gallini, 1990), who represent highly skilled readers. Attempts to translate Mayer’s principles to younger readers has been less successful (McTigue, 2009; Schrader & Rapp, 2016). Such findings bring to question if skill and developmental age may interact with theoretical predictions.
Factors That May Affect the Effectiveness of Graphics
Learners’ comprehension of graphics is affected by multiple, interrelated factors, which we worked to capture through moderators. Therefore, we present empirical findings related to characteristics of learners, graphic type, assessment format, and text genre. While not exhaustive, including these variables in our analysis provides an avenue to parse out why graphical research produces variable results.
Characteristics of Learners
Readers interact with graphics differently depending on age and developmental level. For instance, younger readers consider components in isolation rather than processing the graphic holistically (Gerber et al., 1995). They tend to fixate on isolated components of graphics, complicating their efforts to extract discrete pieces of information. Additionally, they may be unaware of graphical conventions, such as the meanings of arrows (McTigue & Flowers, 2011), only partially understand the information graphics convey (e.g., Roberts & Brugar, 2017), or may not perceive the intended message (Stylianidou, 2002). Researchers who attempted to apply multimedia design principles to adolescents showed only modest improvement from the addition of diagrams (McTigue, 2009; Schrader & Rapp, 2016). Even when presented with high-quality graphics, readers who are unable to employ appropriate strategies will struggle to distinguish important graphical information (Duke et al., 2013). Therefore, cost versus benefit of graphics for young learners is still unclear.
Graphic Type
As described previously, specific design principles can enhance the utility of a graphic. For instance, Mayer and Gallini (1990) examined three variations of the same diagram, aiming to determine the most effective features for promoting college students’ learning. Results indicated that only the most detailed diagram (which depicted both the parts and steps of a system) consistently improved performance on conceptual information and problem solving. Yet findings regarding the effect of even very similar graphics can be discrepant. For example, selected studies found that adding pictures benefited students’ reading comprehension (Ehlers-Zavala, 1999; Jalilehvand, 2012), while others did not (Eng & Chandrasekaran, 2014; Liu et al., 2009). Limited work has compared different forms of visual representations (e.g., photograph vs. diagram) across multiple learning tasks. One exception is McCrudden, McCormick, et al. (2011) who compared three different study conditions (i.e., lists, spatial diagrams, and pictorial diagrams). While both visual conditions supported learning better than the list, neither visual condition outperformed the other.
Assessment Format
In a previous meta-analytic study, Levie and Lentz (1982) examined the extent to which outcome measures moderated the impacts of visual graphics on learning. They classified learning measures into four categories: drawing (similar to recall test, students recall the main points by writing/drawing); identification (similar to true/false comprehension tests, students verify statements); terminology (which access understanding of terms and facts); and multiple-choice questions (which access understanding of procedures). Interestingly, this work demonstrated that graphics most benefited recall tasks. However, findings from selected studies supporting CTML (e.g., Mayer, 1989; Mayer & Gallini, 1990) are inconsistent with this finding, demonstrating that graphics better support conceptual rather than verbatim comprehension. Therefore, it is necessary to consider assessment as a moderator.
Text Genre
Due to visuals’ unique roles in narrative and expository texts, we also consider the impact of genre on comprehension. It is often argued that narrative structures (compared with expository) are easier to understand—deemed the psychological privilege of the narrative (Willingham, 2004). Therefore, potentially, a narrative multimodal text may require less effort to comprehend than a similarly complex expository text. Informational texts typically contain fewer familiar structures, requiring students to apply disciplinary literacy strategies (Duke, 2000; Shanahan & Shanahan, 2008). Furthermore, the graphics in informational texts tend to be far more prominent, integrated, and complex than those within narrative storybooks (Smolkin & Donovan, 2005).
Moreover, according to DCT, in either genre, the addition of graphics should facilitate students’ comprehension by adding concreteness. However, a graphically dense text may also create challenges, as readers need to select a pathway for extracting and integrating information from visuals with that from text (Duke et al., 2013; McTigue & Flowers, 2011). In summary, the interaction between genre and graphics remains undefined.
Research Questions
We began this study with two questions and derived our hypotheses directly from our theoretical and empirical review:
Research Question 1: To what extent do graphic displays have a positive effect on students’ reading comprehension?
Based on empirical and theoretical findings, we hypothesized that overall, graphics have a modest positive effect on readers’ comprehension.
Research Question 2: To what extent are graphics’ effects moderated by (a) grade level, (b) graphic type, (c) assessment format, and (d) text genre?
We first predicted that adult readers differentially benefit from graphics due to issues of young readers’ cognitive overload. Second, we predicted that, based on CTML (e.g., Mayer & Gallini, 1990), simple graphics that provided greater focus on a system (the gestalt) would be most beneficial (e.g., flow diagrams). Next, based on CTML and Levie and Lentz’s (1982) work, we predicted that graphics would better facilitate comprehension with production tasks/open-ended assessments compared with close-ended assessments. Finally, due to the often abstract nature of informational texts, we predicted that graphics differentially benefit informational text readers.
Method
The studies included in this meta-analysis measure the impact of graphics on reading comprehension, yet focused on diverse populations and highlighted dissimilar pedagogies.
Database Search and Inclusion Criteria
We set the search parameters to include peer-reviewed articles and dissertations, published from January 1, 1985, to December 1, 2018, in the following databases: ERIC, Education Resource, PsycINFO, and ProQuest Dissertations & Theses Global. This period allowed us to overlap with both Renkl and Scheiter (2017) and Carney and Levin’s (2002) reviews. All articles included at least one keyword (i.e., “graphic,” “picture,” “diagram,” “illustration,” “table,” or “chart”) in the text, along with “reading” or “comprehension.” This search yielded 9,724 articles. By screening the titles, we eliminated duplicates and irrelevant articles. Following this screening, 168 articles remained for abstract-level screening.
For the abstract-level screening, we searched for information that would support the study’s inclusion in our meta-analysis. We used the following criteria: (a) study included an experimental or quasi-experimental design; (b) study reported the results of a graphics comprehension experiment, which we defined as a study in which one group read a “text plus accompanying graphics” or “graphics” and a control group read the same information in “text-only” format; (c) researchers directly measured reading comprehension as a dependent variable; (d) participants completed tasks independently without instruction; (e) study reported sufficient quantitative information that allows us to calculate effect size. This step yielded 65 articles for inclusion.
Then, we conducted the full text screening using the same criteria. Through these procedures, 34 articles met our inclusion criteria.
Ancestral Search Procedure
We also conducted an ancestral search examining the 34 included articles’ reference lists and consulted multiple visual literacy researchers and asked them to provide a list of seminal articles on visual literacy for additional examination. These steps added two articles to the corpus. In total, we began the analysis with 36 articles (see Figure 1).

Article retrieval and identification process.
Seven articles (Coleman et al., 2018; Dwyer et al, 2010; Ehlers-Zavala, 1999; Mayer & Gallini, 1990; McCrudden et al., 2007; McCrudden et al., 2009; Reid & Beveridge, 1986) included more than one study meeting our inclusion criteria. Before calculating effect sizes, we examined issues of sample dependence. We determined that two studies in Coleman et al. (2018), two studies in McCrudden et al. (2009), and two studies in Reid and Beveridge (1986) used independent samples (e.g., from different schools). We therefore retained samples from both studies in these three articles. The samples in the remaining three articles were overlapping, so we combined the studies. This process resulted in 36 articles (39 studies) included for effect size calculation.
Coding Procedures
The first and second authors coded study features including sample size, participant grade level, graphic type, assessment format, text genre, independent and dependent variables, and statistical information (e.g., standardized mean, standardized deviation). Table 1 presents qualitative descriptions of each study. The interrater reliability coefficient was estimated through the weighted Cohen’s Kappa statistic at 97%.
Qualitative Descriptions and Coding of Moderators in Each Study

Note. exp. = experiment. In the column Participants, Experiment (E), and Control (C) Sample Sizes, L1s refer to native speakers and ELLs refer to English language learners.
Model Selection
According to Borenstein et al. (2009), a random effect model should be selected when researchers anticipate the true effect size is not identical across studies. With different study designs, populations, and assessment formats, we hypothesized that the true effect size would vary across the 39 studies. Thus, we selected the random effect model. Moreover, compared with fixed effect models, a random effect model presumes that studies’ standardized mean differences represent true variation, not simply sampling error (Lipsey & Wilson, 2001).
Effect Size Calculation
We calculated standardized mean differences as Hedges’s g (Hedges, 1984). We selected alternative ways to calculate Hedges’s g for studies that did not report mean or standard deviation, such as transformation from Cohen’s d, t-test statistics, and F-test statistics (Lipsey & Wilson, 2001). For studies that reported multiple measures or conducted multiple experiments, we calculated a weighted average Hedges’s g with the mean standard error based on a number of measures. Specifically, we first input the different means, standard deviations, and sample sizes into a spreadsheet. Then, we calculated each Hedges’s g, and the associated weight, and divided the sum of weighted Hedges’s g by the sum of weights (i.e., ∑wigi/∑wi) to produce a weighted average Hedges’s g for that study. We calculated the mean standard error of a study by using 1 to divide by the square root of the weight of the study’s mean Hedges’s g. Through these procedures, we ensured the independency of our samples. Then we recorded all 39 Hedges’s g, standard errors, and the mean Hedges’s g, using the R package “Metafor” (Viechtbauer, 2010). All subsequent calculations were conducted in R (Version 3.5.1). A confidence interval (CI) of 95% was selected to determine if a result was statistically significant and applied this criterion to all calculations.
Heterogeneity
To assess heterogeneity, we calculated Q, τ2, and I2 statistics to estimate the variation among studies. The τ2 estimates the between study variance and I2 estimates the ratio of that variance to total variance (Borenstein et al., 2009; Schwarzer et al., 2015). We estimated the τ2 using the restricted maximum likelihood method. Cornell et al. (2014) suggest this method over the DerSimonian Laird method because the latter may produce biased results. The Q statistic and the associated p value were supplied to test the significance of τ2.
Publication Bias
We used four methods to estimate the sensitivity of our results to publication bias: Funnel plot, Egger’s test of publication bias (Egger et al., 1997), Duval and Tweedie’s (2000) Trim and Fill analysis, and cumulative forest plot (Borenstein et al., 2009). Meta-analyses assume that effect sizes are symmetrical to the mean, and results may be biased if the funnel plot depicts an asymmetrical distribution. We applied an Egger’s linear regression test to examine the assumption of “asymmetry.” The Trim and Fill procedure examines the funnel plot, “trims” the outlying studies on one side, “fills” them to the other to make the distribution symmetrical, and reestimates Hedges’s g (Schwarzer et al., 2015). If the adjusted Hedges’s g dropped below zero, our results may be sensitive to potential publication bias. Finally, a cumulative forest plot can detect the impact of studies with small sample sizes. We first sorted the studies by variance, in ascending order, and inspected the effect sizes for fluctuation with small sample studies (Borenstein et al., 2009).
Moderator Effect
Moderator Operationalization
We first dummy-coded the moderators (i.e., grade level, graphic type, assessment format, and text genre) and performed subgroup analysis within each group. Then, we input dummy codes into the model simultaneously to control for confounding effects.
Characteristics of learners
We initially aimed to test participants’ reading skill and age. However, fewer than half of the studies reported participants’ reading skill (n = 18) or biological age (n = 18). Due to the small sample size, using these variables as moderators could lead to biased results. In contrast, the majority of studies reported grade level, or we could infer grade level from participants’ age (e.g., Pike et al., 2010). Therefore, we conducted a moderator analysis on grade level. We coded the studies into three groups: elementary (Grades 1–6), secondary (Grades 7–12), and adults (college and above). We recognize that grade level encompasses both developmental level and experience in school.
Graphic type
We based our categorization of graphic types on Hegarty et al.’s (1996) distinctions, and aligned our terminology with that of Guo et al. (2018), who provide concrete definitions of diagrams frequently used in instructional materials. We defined pictures as realistic illustrations that provided concreteness, engagement, or relevance to a text (see Figure 2 for examples). We also identified two types of diagrams: (a) flow diagrams referred to organizational charts used to explain structures or procedures (e.g., a chart with arrows depicting the pathway of blood through various structures) and (b) pictorial diagrams referred to pictorial representations with explanatory annotations (e.g., a drawing of a heart with labels showing specific components). Last, mixed type referred to studies that used more than one type of graphics (e.g., picture and pictorial diagram).

Examples of graphic type (cited from https://openclipart.org/detail/22749/girl-jumping; https://openclipart.org/detail/4975/elimination-de-la-pollution; https://openclipart.org/detail/2311/children-reading).
Assessment format
We organized the assessment format into five categories: (a) true or false (t/f); (b) multiple-choice (three or more alternatives); (c) short-answer (oral or written assessment, graded by trained raters); (d) mixed (more than one type of assessment); and (e) others (e.g., cloze test). We originally intended to code outcome measures by type of learning (e.g., recall or application), however, authors did not consistently include such information or sample questions in their studies, rendering our original coding system unfeasible. Thus, we focused on the assessment format.
Text genre
We classified texts as narrative or informational. According to Pappas (1991), the main purpose of a narrative text is to tell a story and such text tends to follow a sequential text structure. Extending this definition, Ohlson et al. (2015) defined narratives as typically fictional, written for the purpose of entertainment, and following a story grammar. In contrast, we defined informational text as one that conveys information about a phenomenon, event, situation, or procedure with the main purpose of informing readers (Duke, 2000; Fox, 2009). Informational text structures include description, cause and effect, sequence, problem/solution, and argumentation (Duke, 2000). The majority of the informational texts in these studies followed a descriptive structure, although one study (Dwyer et al., 2010) used an argumentative text.
Moderator Analysis
For the moderator analysis, we adopted the function rma.uni in the R “Metafor” package, using a random effect model and the restricted maximum likelihood method to evaluate between-group difference and the joint effects of various moderators. Each moderator (i.e., grade level, graphic type, assessment format, and text genre) had a reference group: (a) grade level (elementary, secondary, and adults [reference group]); (b) graphic type (picture [reference group], pictorial diagram, flow diagram, and mixed); (c) assessment format (t/f [reference group], multiple-choice, short answer, mixed type, and other types); (d) text genre (narrative text [reference group], informational text, and mixed type).
First, we conducted subgroup analyses to calculate the effect sizes. We then performed a meta-regression to examine the relationship of each moderator with reading comprehension effect sizes after controlling for other moderators. This model can also be referred as a mixed effect model because we have both random-effect terms (i.e., the τ2 estimated from the 39 studies), and fixed effect terms (i.e., the standardized coefficients of each moderator, or β). To check for possible multicollinearity, we used the R package “car” (Fox et al., 2017) to estimate the variance inflation factor statistic, and the independence of residuals (to test whether the residual correlation is statistically significant). Fox (1991) suggests that if the square root of the variance inflation factor for a moderator exceeds 2, the model estimation is imprecise, and that moderator should be dropped.
Results
There were 2,103 participants in the 39 included studies, with sample sizes of 1,053 in the experimental group and 1,050 in the control group.
Effect Size Calculation
Hedges’s g ranged from −0.23 to 1.24 for each individual study (see Table 2). A random effect model yielded an average Hedges’s g of 0.39 (SE = 0.06, z = 6.63, p < .001, 95% CI [0.26, 0.51]). This indicates that under a random effect model, incorporating graphics with text has a moderate, positive effect on students’ reading comprehension (Cohen, 1992).
Effect Sizes of Included Studies

Note. All sample sizes are averaged and rounded down. exp. = experiment; ES = effect size (Hedges’s g); SE = standard error; CI = confidence interval.
Heterogeneity
The τ2 was 0.07 (95% CI [0.02, 0.17]), and the I2 was 45.91% (95% CI [17.63%, 68.62%]), suggesting the existence of true variance that may be explained by study-level covariates (Borenstein et al., 2009). The overall Q(38) was 69.55, p = .001 (i.e., <.01), indicating the τ2 is significant at 95% CI, which further suggested a need to conduct a moderator analysis (Borenstein et al., 2009).
Publication Bias
The funnel plot showed that the studies were almost symmetrical to the mean effect size (see Figure 3). The Egger’s test of publication bias was not statistically significant (t = 1.28, p = .21), indicating no potential threats due to publication bias. Duval and Tweedie’s (2000) Trim and Fill analysis did not provide evidence that our results are sensitive to potential publication bias. The decreased Hedges’s g (from 0.39 to 0.28) after being adjusted by Trim and Fill (adjusted studies = 7) was still statistically significant (p < .001, 95% CI [0.15, 0.42]). We also plotted a cumulative forest plot (see Figure 4), showing a stable effect size even when small-sample studies were added into the model. Therefore, we interpreted our findings with confidence that they were likely not the result of publication bias.

Trim and Fill funnel plot (x-axis = Hedges’s g; y-axis = standard error); white dots indicate “filled” studies.

Cumulative forest plot.
Moderator Analysis Descriptive Results
We report the subgroup results (see Table 3) for descriptive purposes only. For statistically comparing groups, we rely on the results of the meta-regression, because the influence of the other moderator in the model can be controlled.
Subgroup or Simple Regression Analyses
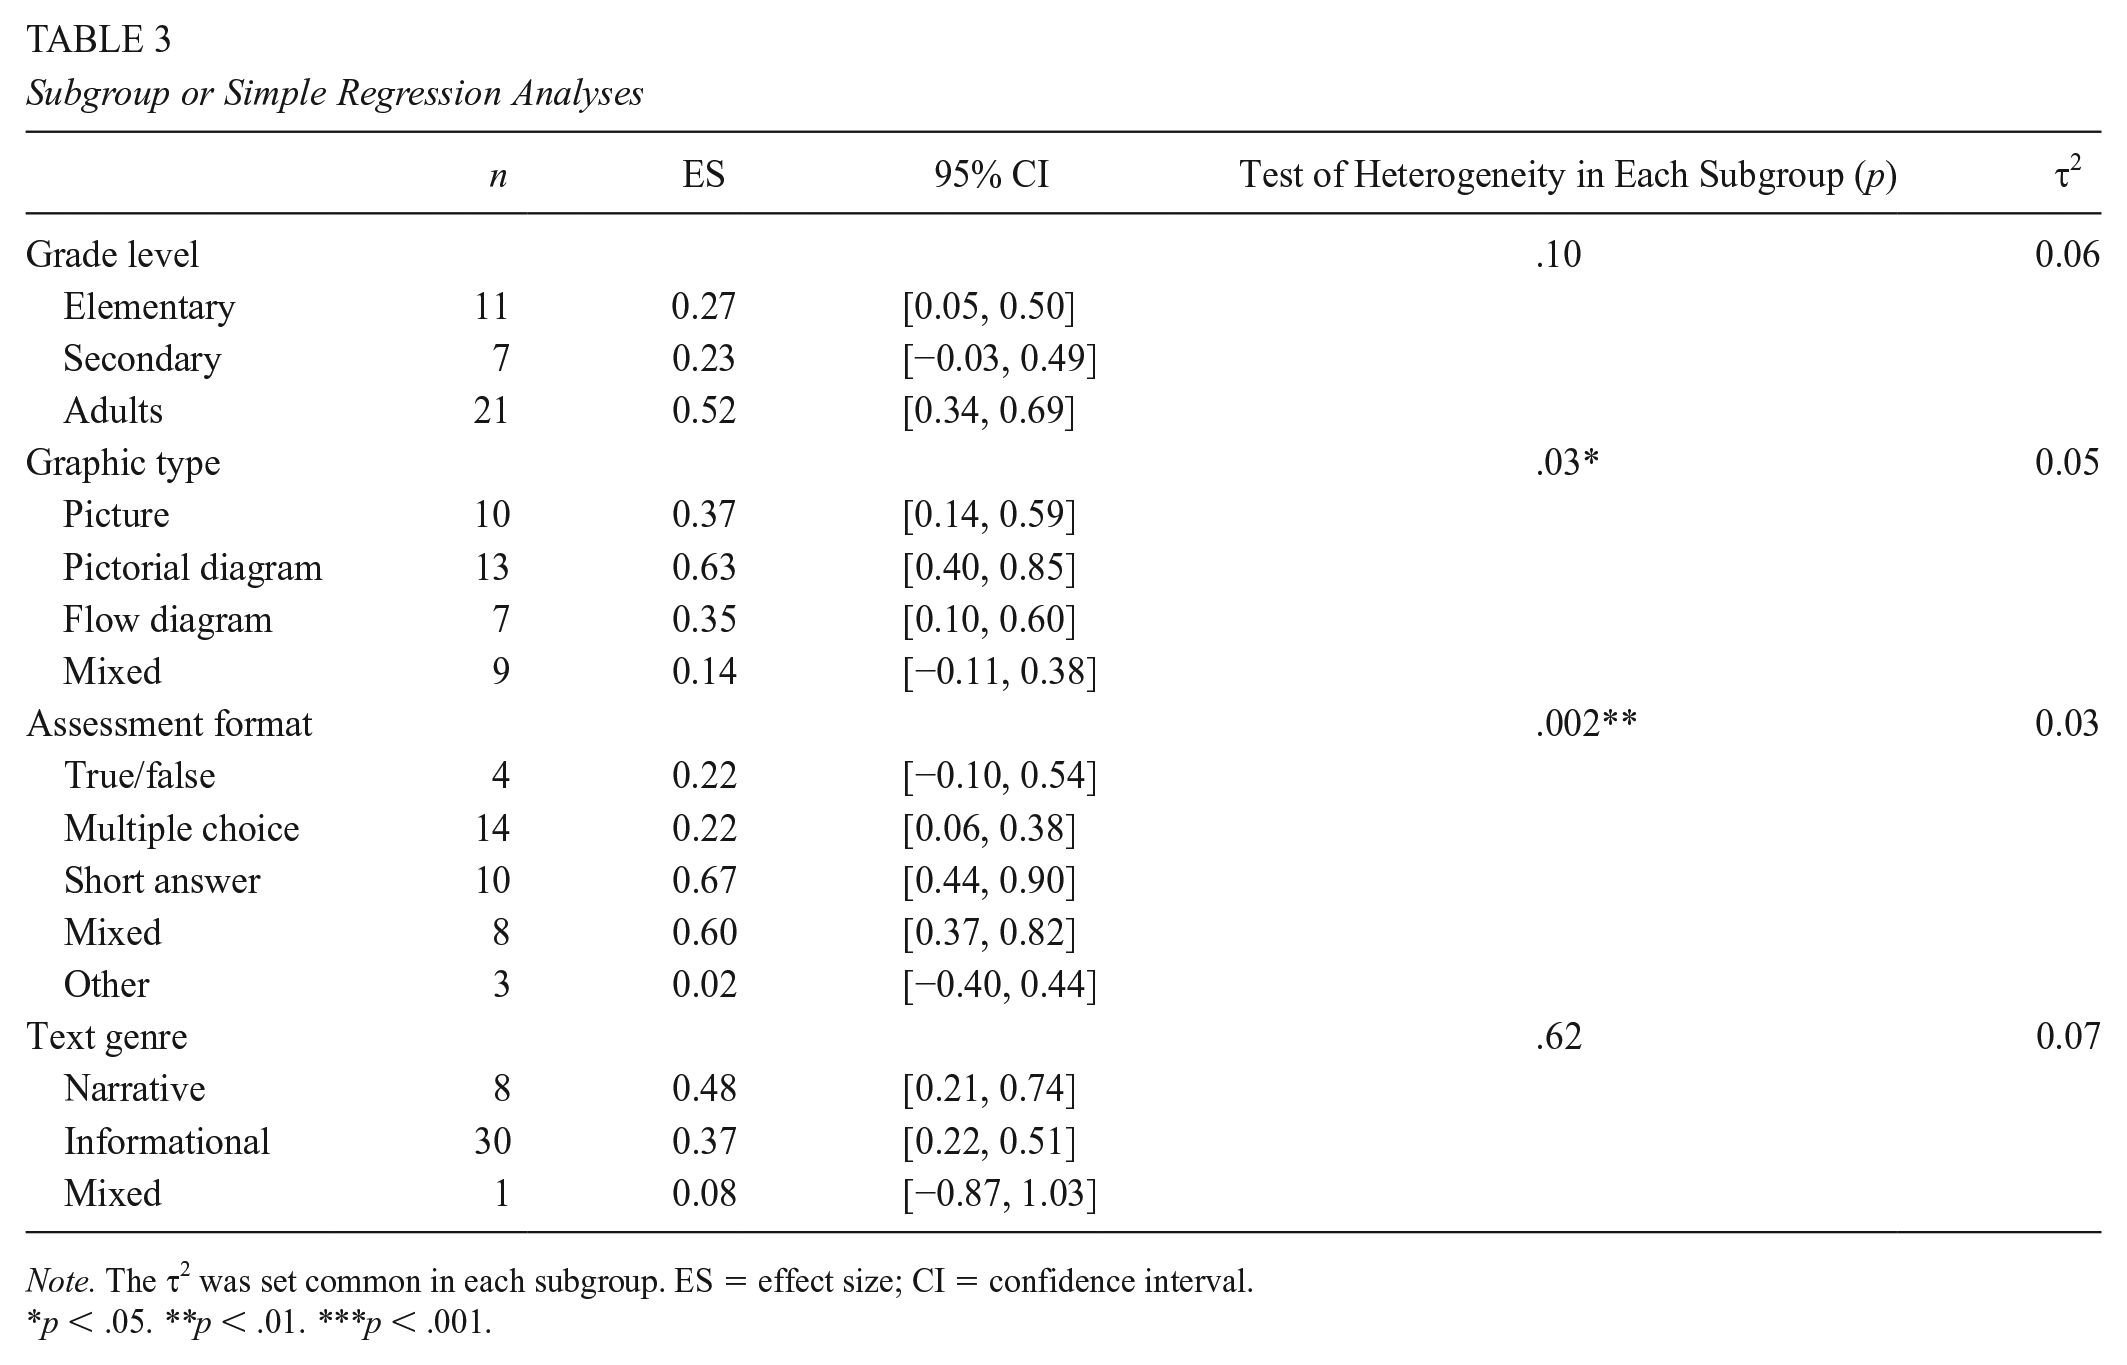
Note. The τ2 was set common in each subgroup. ES = effect size; CI = confidence interval.
p < .05. **p < .01. ***p < .001.
Meta-Regression Analysis
When assessing multicollinearity, we found a high correlation between text genre and graphic type. Our coding revealed that graphical type depended on text genre (i.e., if text genre was “narrative,” the graphic display type were very likely to contain a picture). After eliminating text genre, the remaining moderators showed no multicollinearity issues (R function sqrt(vif) > 2 is “FALSE” on all moderators; Durbin-Watson Test of residual correlation: r = .04; p = .55). All remaining moderators were put into the model, consisting of three categorical variables. All variables were input into the regression model simultaneously (i.e., multiple regression), and the residual between study variance became very low (0.01; see Table 4). The effects of each moderator are described below.
Meta-Regression Analysis

Note. t/f = true/false; SE = standard error; CI = confidence interval.
p ≤ .05. **p < .01. ***p < .001.
Grade level
Grade level was not a significant moderator of reading comprehension. Compared with adults, elementary and secondary students demonstrated a lower but nonsignificant effect (Grades 1–6 vs. adults: β = −0.22, p = .17, 95% CI [−0.53, 0.09]; Grades 7–12 vs. adults: β = 0.01, p = .95, 95% CI [−0.37, 0.40]).
Graphic type
Texts with pictures produced higher effects than texts with mixed graphics (mixed vs. picture: β = −0.31, p = .0388 (i.e., <.05); 95% CI [−0.59, −0.02]). No other comparisons were significant.
Assessment format
Compared to t/f assessments, results indicate that studies of short answer and mixed types had higher effect sizes (short answer vs. t/f: β = 0.58, p < .001, 95% CI [0.21, 0.96]; mixed vs. t/f: β = 0.55, p < .001, 95% CI [0.19, 0.90]).
Discussion
In response to often-discrepant reports regarding the effects of graphics, as well as overall increase in graphical use, the first aim of this meta-analysis was to quantify the general effect of including graphics with text on reading comprehension. Our analysis revealed that, in comparison with reading texts alone, the inclusion of graphics had a medium positive effect on reading comprehension (Hedges’s g = 0.39). This finding supports our hypothesis and indicates that overall, graphics facilitate readers’ comprehension, and their potential effect on reading comprehension may be larger than previously estimated (see Readence & Moore, 1981), which may reflect improvement in the productive value of modern graphics.
Our second aim was to identify which moderators (i.e., grade level, graphic type, assessment format, and text genre) affected readers’ learning from graphics. Text genre was removed from the analysis due to interdependence with graphical display type. Of the remaining moderators, both graphical type and assessment format were significant predictors of comprehension. Readers’ comprehension improved when text was supported by pictures, compared with a combination of different graphical types. Regarding assessment format, when students’ reading comprehension was assessed with short answer or mixed formats, graphics produced larger effects than when assessed with t/f formats.
The Main Effect: Meaningful or Not?
To interpret the main effect size (Hedges’s g = 0.39) favoring graphics for comprehension, it is important to consider that, when compared with decoding aspects of reading, improving reading comprehension is particularly effortful. For example, a recent meta-analysis (Edmonds et al., 2009) synthesized comprehension outcomes of reading interventions and determined an effect size of 0.89 after an average of 23 hours of instruction. Thereby graphics, which require only a minimal, material investment can yield meaningful change for students’ comprehension on at least a single, target text. We are not implying that the inclusion of graphics can (or should) substitute for instruction, but instead we are highlighting that focusing students to capitalize on the visual channel can be a powerful comprehension tool. Thereby, we advocate that, within comprehension instruction, greater attention should be given to the visuals so that we do not perpetuate the verbal bias described by Winn 30 years ago (Winn, 1987). Particularly when considering the findings of Renkl and Scheiter (2017), indicating that many students do not have strong graphic interpretation skills, readers likely are only capturing a small percentage of graphics’ potential benefits for comprehension support.
Attention to (Visual) Detail
It is important to consider that the pictures and diagrams presented within each study were intentionally crafted for the goal of promoting learning for a single target text. Such focused attention, however, is not typical for the selection of graphics in textbooks (Goldsmith, 1987; Hubisz, 2000), or in scientific journals, in which artists (not scientists or educators) usually create the images (Ottino, 2003). As such, we caution that the results of this analysis may be partially inflated by the high quality of the graphics within these studies. Such robust effects may not occur with more typical classroom texts, which tend to have a greater density of illustrations, but of arguably lower quality (Guo et al., 2018) and would demand even greater skill from readers.
Theoretical Implications
Our main finding is consistent with both DCT (Paivio, 1971) and CTML (Mayer, 2001). According to both theories, the concurrent presentation of information in multimodal text enables students to store the same material in two formats. When acquiring information from both sources, students can encode in their memory and make connections between the two formats. This helps create two paths that learners can take to retrieve and process information more efficiently (Clark & Paivio, 1991).
Yet current theories lack aspects of specificity, which reduces their predictive and explanatory power. For example, these theories do not differentiate between graphics versus graphic organizers, which readers interact with in markedly different ways. When graphics are interactive in nature, it is unclear whether comprehension benefits resides in the visual form or by prompting students to interact with the material. As Ainsworth’s (2006) framework describes, beyond design, we should consider the cognitive tasks required by the learner, and this also has consequences for how we should present graphics in learning materials.
Therefore, if we compare our results, in which students more passively studied visual representations, with graphic organizer research, in which students are compelled to construct or complete a graphic, we can begin to untangle which benefits derive from the visual channel and which derive from cuing active comprehension processes (e.g., organizing information). For example, in Nesbit and Adesope’s (2006) meta-analysis regarding concept maps (i.e., flow diagrams), when students constructed the graphic organizer, the average effect size was 0.82, but when they only studied the graphic organizer the effect size was 0.37. In our work, the effect size of reading flow diagrams from subgroup analysis was 0.35 (95% CI [0.10, 0.60]), which is consistent with Nesbit and Adesope’s finding. The contrast between the more active and passive approach indicates that the activity or cognitive task significantly assists comprehension; however, even without creating or completing an image, the presence of visuals alone benefits readers’ meaning construction.
A second theoretical limitation is that most current theories of reading comprehension (see Cain & Parrila, 2014) may provide exquisite detail regarding the role of decoding and vocabulary, but do not typically address the role of visuals within reading comprehension. In short, the theoretical advances have not kept pace with graphical advances. As such, there continues to be a need for more unified theories in the field of reading (Sadoski & Paivio, 2007) that both capture diverse perspectives and are aligned with modern multimodal texts. Thereby, to consider graphics in greater specificity, we transition to our moderator analysis.
Effects of Moderators: Who? What? and When?
Our second aim was to examine the extent that grade level, graphic type, assessment format and text genre moderate the efficacy of graphics.
Grade Level
Due to cognitive load, we predicted that older readers would benefit more from graphics. Contrary to our hypothesis, the moderator analysis revealed no significant effects of grade level. In other words, visuals benefitted students across different grades. This result, while optimistic for instruction, seems inconsistent with Readence and Moore’s (1981) conclusion, which indicated that college-level students benefited from pictures more than K–12 students. One possible explanation for this inconsistency is connected to analysis approaches: When examining grade level as a moderator, Readance and Moore split students into four subgroups (traditional K–12 public school, traditional university, nontraditional K–12 public school, nontraditional university), whereas we split the group into elementary, secondary, and adults. It is also notable that Readance and Moore compared standard deviations and means among these four subgroups without calculating effect sizes.
However, albeit not statistically significant, our results did suggest a larger effect for adult readers when compared with elementary and secondary students (see Table 3). This is concerning as younger students are often expected to independently “read-to-learn” multimodal texts. However, understanding graphics involves semantic processing and information integration (Schnotz, 2014). Therefore, we need additional research on such readers’ processes and skills related to decoding graphics. Younger readers may need instructional scaffolding to benefit fully from graphics. Additionally, it is important to consider that Mayer’s extensive work in this area (e.g., Mayer et al., 1984; Mayer & Gallini, 1990), which is based exclusively on research with college readers, and attempts at translating principles to younger readers have not been directly replicated (McTigue, 2009). Therefore, our findings do little to clarify the understanding of developmental levels for graphical comprehension but provide an optimistic view for using graphics with all ages of students.
Graphic Type
Only when compared with texts with mixed graphics, texts with pictures had a greater effect on students’ reading comprehension. This finding may relate to the visual complexity, which is composed of the density and variety of visuals, the intricacy of individual visual representations, the spatial and semantic integration of text and visuals and formatting features (Guo et al., 2018). Analogous to how it is challenging to read a text that shifts text structure, a text that shifts the types of visuals may require greater effort.
Regarding the comparison of individual graphical types, after controlling for other moderator effects, pictures, pictorial diagrams, as well as flow diagrams showed similar, positive effects on students’ reading comprehension. DCT (Paivio, 1971, 1986) predicts that readers benefit from this realism (i.e., pictures). In contrast, CTML (Mayer, 2001) emphasizes that reducing extraneous and emphasizing essential information supports learning (i.e., flow diagrams), even if sacrificing realism. Our findings support neither theoretical position. Perhaps research cannot determine a preferred design or type of graphical displays in supporting comprehension because it is not essentially a design issue. Rather, as described by Ainsworth (2006), design parameters are endemic to a particular representation and function. Design quality may be more of a feature of alignment between reader, text, and task.
Assessment Format
Comprehension can be measured in many formats, with each type capturing different aspects of learning. We predicted that graphics would be most beneficial to students’ ability to answer open-ended assessments, which are production tasks and typically assess more gestalt understandings. Our findings partially confirmed our prediction: When compared with two other assessment forms (short answer and mixed), graphics provided the least benefit for t/f outcome measures. This finding may be related to these outcome measures being production tasks. However, rather than the nature of the task, we suggest a possible statistical interpretation regarding assessment reliability. According to Crocker and Algina’s (2006) item analysis theory, binary questions may result in lower score reliability as item difficulty (i.e., rate of correctness in each item) depends on the number of alternatives. The t/f questions yield lower effect sizes because there are only two response options in each question, and even students with no content knowledge can guess with 50% accuracy on each item. Therefore, the effect of graphics may not be assessed accurately when using t/f format.
Alternatively, t/f assessments may be capturing qualitatively different types of learning than the other assessment formats. In previous research (e.g., Mayer, 2001), graphics promoted conceptual understanding (typically measured by open-ended questions) but not verbatim recall. In fact, Mayer demonstrated that while diagrams facilitated conceptual knowledge, they simultaneously produced negative effects on subjects’ verbatim recall of the text. Due to the brevity and closed nature of the task, the t/f format may prioritize recall over conceptual understanding.
Limitations
There are several methodological limitations in the current study. First, to employ a meta-analytic method, we only included studies that reported sufficient quantitative information. Therefore, we could not consider qualitative research (e.g., think-alouds). Second, we suspect that factors such as reading time, prior knowledge, and academic skills may moderate the effects of graphics on reading comprehension. For instance, although multiple studies used open-ended questions to assess students’ reading comprehension, most did not report students’ writing skills, which may potentially moderate the learning effect, or students’ capacity to demonstrate their learning. As few studies reported these types of factors, there was insufficient data for moderator analysis.
Additionally, in our moderator analysis, we grouped students into three categories: elementary (Grades 1–6), secondary (Grades 7–12), and college and up. Grades 1 to 6 were grouped into a single grade-level category. Although we attempted to group elementary students into two groups based on the development stages of foundational reading skills (i.e., Grades 1–3 vs. 4–6; Chall, 1983), we found several studies included mixed age-groups (e.g., Pike et al., 2010, recruited second- to sixth-grade students). Therefore, we were unable to examine students into more meaningful age-groups.
Moreover, the materials in the included studies typically did not represent the complexity of modern texts. The majority of designs featured a single graphic supporting the text. In contrast, many contemporary texts contain multiple graphics on a single page spread (Guo et al., 2018). Nine studies did not report the source of texts used and, in total, only six used materials from students’ textbooks. Others used texts adapted from articles, book excerpts, websites, or videos (n = 12), standardized tests (n = 1), previous research (n = 9), or texts were developed by researchers (n = 2). Thus, it may not be possible to generalize these findings to modern, graphically dense texts.
Implication for Research
As a field, we require further empirical studies that consider when, how, and for whom graphics enhance reading comprehension (Carney & Levin, 2002). While this work provides additional insight toward answering these questions, our findings are not unequivocal. Although individual studies demonstrated rigor, the lack of systematicity and standardizations between research studies greatly limited the results of this synthesis and slows down progress in the field of visual literacy. This work, therefore, suggests multiple areas for future inquiry.
Participant-Level Descriptions
First, future research should collect and report detailed information of participant-level variables that influence study results. Of most salience, few of the included studies measured students’ prior knowledge and reading and writing skills, which contributed to reading comprehension (Anderson & Pearson, 1984). Related to skills, recent work with eye tracking indicates that reading ability interacts with the use of pictures in science texts (Jian & Ko, 2017). Furthermore, the format of outcome measures, particularly if they require writing to complete, may affect students’ performance. This information should be standard data to report.
Language Status
Notably, most of the included studies investigated only native speakers’ comprehension of multimodal texts. Despite that visuals have long been recommended as best practices for teaching English language learners (ELLs), there is a dearth of studies investigating how ELLs respond to graphics and texts (Wright et al., 2014), indicating an assumption of generalization from research with native speakers. Therefore, it is essential to explore ELLs’ use of graphics, as their information processing may be different and possibly more complex (Praveen & Rajan, 2013).
Graphical Type
Our findings indicate that there is not a clear benefit regarding specific forms of graphics. This suggests that the optimum format relies on the alignment between the graphical design and the cognitive tasks. Future research should explore issues of alignment rather than searching for aspects of generic, effective designs. Furthermore, in the manner of disciplinary literacy, such research should be grounded in the expectations of that discipline.
Assessments
First, we encourage future researchers to provide the actual assessments used in research. By providing only descriptions and select examples, it was challenging to code and compare assessments. The second implication relates to the types of outcome measures that were not used among included studies. The reviewed studies focused on a single correct interpretation of text rather than on other types of comprehension (e.g., critical comprehension). More research is needed in understanding how visuals, especially photographs, can be viewed critically (e.g., what is the photographer’s goal for the upward gaze?).
Classroom Implications
The conclusions of this study encourage the use of graphics for all grade levels. However, our conclusions also provide some caution that younger learners, particularly secondary students, may not benefit from graphics in the same manner as adult readers. Our findings and Renkl and Scheiter’s findings (2017) suggest that greater modeling and instruction for using graphics would be beneficial.
Furthermore, to best reap the benefits of graphics, we recommend the careful selection of high-quality multimodal texts. As an exemplar, children’s literature author Gail Gibbons describes her rigorous process of decision making regarding a composition of text and illustration (see Donovan & Smolkin, 2011). Such texts provide an opportunity for critical analysis (e.g., Serafini, 2010), so students can evaluate the logic and effectiveness of various graphical devices and decisions.
Additionally, the contrasting omnibus findings between graphic organizers and graphics suggest that increasing readers’ interaction with visuals benefits learning. Teachers can accomplish this through activities such as having students create new labels or captions for graphics or critiquing and redesigning existing graphics in school texts.
Conclusion
Our findings contribute to the field by updating previous reviews and quantifying the impact of graphics on reading comprehension. Researchers and teachers can draw the following conclusion: The presence of graphics have a moderate positive effect on reading comprehension. However, the more granular details of for whom, when, and how using graphics will deepen students’ comprehension is endowed with less certainty. Regarding for whom graphics are effective, our analysis demonstrated that the effects of graphics did not differ significantly by grade level, indicating that all levels of readers have the potential to learn from graphics. With regard to when and how graphics are effective, we examined graphic type and assessment format. Regarding graphic type, pictures, when compared to texts with mixed graphics, better facilitated students’ reading comprehension. This suggests that visual complexity may challenge readers’ comprehension. We did not, however, find a significant difference among pictures, pictorial diagrams, and flow diagrams, indicating no benefit from either realism or simplicity of form. Compared with using t/f assessments, studies that used short answer or had multiple formats of assessment questions showed higher comprehension effects. Looking forward, while the lack of consistency across studies limited our analysis possibility, future research can provide details about individual differences so that work may better build on past findings. Additionally, issues of graphical quality, complexity, and authentic classroom use need further exploration.
Footnotes
Authors
DAIBAO GUO is an assistant professor at Boise State University. Her research interests focus on integrating theories and practices to improve K–12 students’ literacy skills and provide striving readers with effective instruction.
SHUAI ZHANG works at Appalachian State University, Department of Reading Education and Special Education. His research interests include early literacy acquisition and intervention for students with special needs.
KATHERINE LANDAU WRIGHT is an assistant professor at Boise State University. Her research aims to deepen our understanding of disciplinary literacy, specifically how helping students read, write, speak, and think like field experts can increase access and close achievement gaps.
ERIN M. M