
Abstract
With increased tensions and political rhetoric surrounding immigration enforcement in the United States, schools are facing greater challenges in ensuring support for their students of immigrant and Latino/a origin. This study examined the associations between deportations near school districts and racial/ethnic gaps in educational outcomes in school districts across the country. With data from the Stanford Educational Data Archive, the Civil Rights Data Collection, and the Transactional Records Access Clearinghouse, this study used longitudinal, cross-sectional analyses and found that in the years when districts had more deportations occurring within 25 miles, White-Latino/a gaps were larger in math achievement and rates of chronic absenteeism. No associations were found for gaps in English language arts achievement or rates of bullying. Implications for researchers, policymakers, and school leaders are discussed.
Keywords
Schools are at the forefront of the current national immigration crisis. Current estimates indicate that 10.7 million people, just over half of whom are of Mexican origin, are living in the United States without formal legal status (Passel & Cohn, 2018). Roughly 675,000 children under the age of 18 years are included in this total (Passel & Cohn, 2018). Moreover, approximately 5 million children, or 7% of all children enrolled in public and private K–12 schools in the United States, are living with at least one undocumented parent (Passel & Cohn, 2018). Immigration policies, including those that govern enforcement, thus have the potential to exert widespread influence on the lives of millions of students in U.S. schools, particularly immigrant-origin and/or Latino/a students, whose families are often the direct targets of vitriolic political rhetoric and punitive policies (Chaudry et al., 2010; Dreby, 2015). This study examined the relationship between the deportations conducted by the Office of Immigration and Customs Enforcement (ICE) and racial/ethnic gaps in educational outcomes in school districts across the United States between 2009 and 2016. Our study examined the extent of these associations within a framework that focuses on the large potential for exacerbated gaps between White and Latino/a students.
Between 2009 and 2016, nearly 5.3 million people were deported, more than half a million of whom were parents of U.S.-citizen children (Chishti et al., 2017). These figures reflect a dramatically stepped up deportation operation, resulting in critics disapprovingly naming President Barack Obama the “Deporter in Chief.” Part of this increase in deportations resulted from the Secure Communities policy, which was in place between 2008 and 2013. It required local and state law enforcement agencies to automatically submit the fingerprints of arrested individuals to the U.S. Department of Homeland Security’s Automated Biometric Identification System to identify people who were “unlawfully present in the U.S. or otherwise removable” (U.S. Office of Immigration and Customs Enforcement, 2018). The Secure Communities policy was suspended in November 2014 and replaced by the 2014 Priorities Enforcement Program, which more narrowly targeted unauthorized immigrants who had been convicted of serious crimes and modified the local and state reporting requirements regarding detained immigrants (Winkowski & Kerlikowske, 2014). Beginning in August 2013, immigration enforcement followed the guidelines of “prosecutorial discretion,” an approach intended to take into consideration family ties in the United States (including U.S.-citizen children) and prioritize deportation of individuals who posed risks to national security or public safety (Zatz & Rodriguez, 2015). Despite these changes, the large numbers of deportations effectuated during the Obama presidency had serious implications for the well-being of individuals and families (Capps et al., 2016); Gelatt et al., 2017).
Tougher immigration enforcement was a cornerstone of President Donald Trump’s campaign platform, and in the first days in office, he began moving swiftly to fulfill these promises. Almost immediately, the Department of Homeland Security abandoned prosecutorial discretion and reinstated the Secure Communities policy. Both changes have resulted in a major increase in deportations and heightened fears of deportation among immigrants and their children (Dickerson, 2017). In addition to repeated threats from the U.S. Department of Justice (2018) to withhold federal funding to “sanctuary cities” that fail to release information about arrests to federal agents, ICE has ramped up the number of arrests of undocumented immigrant parents occurring near school grounds and other formerly sensitive locations such as hospitals and court houses (Burnett, 2017; Meltzer, 2017; Nieto-Munoz, 2018). This marks a stark reversal in tactics from those utilized under the previous administration (Zatz & Rodriguez, 2015). It also raises important questions about the in-school effects of deportations on students and how students’ educational outcomes—particularly those of which factor into school accountability metrics—may be affected by different immigration policies.
Although many of the key Obama-era policies have since been changed, this study provides an evidence base for the influence of deportations on racial/ethnic gaps in educational outcomes from 2009 to 2016, on which future studies using data from the current ICE regime can build. We ask the following research questions:
Research Question 1: What is the association between deportations and racial/ethnic achievement gaps in elementary and middle school districts?
Research Question 2: What is the association between deportations and racial/ethnic gaps in rates of chronic absenteeism in elementary and secondary school districts?
Research Question 3: What is the association between deportations and racial/ethnic gaps in rates of overall bullying and rates of bullying based on race in elementary and secondary school districts?
Background and Theoretical Framework
There is a growing body of literature examining the challenges associated with being undocumented and/or living in mixed-status families. Evidence suggests that children of unauthorized immigrant parents (who may themselves be unauthorized) have a greater propensity to suffer from anxiety, stress, and other mental health disorders (Chaudry et al., 2010; Gonzales et al., 2013; Hainmueller et al., 2017; Suárez-Orozco et al., 2011; Zayas et al., 2015). Additionally, children living with unauthorized parents are less likely to be enrolled in early-childhood education programs (Yoshikawa, 2011), tend to have slower cognitive and language development (Yoshikawa, 2011; Yoshikawa & Kholoptseva, 2013), and on average have less access to health and medical care (Vargas, 2015; Vargas & Pirog, 2016).
Recent studies have begun to isolate the effects of immigration enforcement on a range of outcomes, including food insecurity and material hardship (Amuedo-Dorantes et al., 2018; Potochnick et al., 2017), foreclosures (Rugh & Hall, 2016), and students’ educational engagement and performance. In one study, Amuedo-Dorantes and Lopez (2015) found that among children of “likely unauthorized immigrants,” the probability of repeating a grade increased by 6% and the probability of dropping out increased by 25.2% with increases in immigration enforcement. In another study, Bellows (2019) examined the effects of the staggered rollout of the Secure Communities policy on student achievement measures using the Stanford Education Data Archive (SEDA) and found that the implementation of Secure Communities and its associated removals had a negative impact on both Latino/a and non-Latino/a Black students’ scores in English language arts (ELA) as well as non-Latino/a Black students’ scores in math. Work by Dee and Murphy (2019) also showed that agreements between ICE and local police to enforce immigration laws had strong effects on Latino/a student mobility. They found that local ICE partnerships reduced the number of Latino/a students by almost 10% in a 2-year period, with nearly 300,000 Latino/a students moving districts between 2000 and 2010.
Less research has focused specifically on the consequences of enforcement on student absenteeism, although media coverage has shown substantial effects, at least in the short term (Blitzer, 2017, 2018). In one study using data from the Early Childhood Longitudinal Study: Kindergarten Class of 2010–11, Sattin-Bajaj and Kirksey (2019) found that an increase in the number of apprehensions by a child’s nearest immigration enforcement jurisdiction was associated with a decrease in absenteeism in kindergarten. They interpret this finding to suggest that under certain conditions—specifically when immigration enforcement policies are guided by humanitarian concerns, such as family ties in the United States, which was the case in the latter part of Obama’s second term—schools may be perceived by families as sanctuaries, at least for children in kindergarten. Sattin-Bajaj and Kirksey also explored these relationships in a small, urban California secondary school district using reports of ICE raids and arrests occurring in the city as the measure for immigration enforcement. Results suggest that each documented ICE raid in the residential areas of the school district was associated with two additional periods of absence from school for every student in the high school district. This association was stronger for migrant students and Latino/a students, and during the 2016–2017 school year—the first year when ICE operated under the Trump administration. These findings contributed to the purpose of this study, which was to examine whether deportations are related to exacerbated racial/ethnic gaps in outcomes for Latino/a students.
There is also mounting evidence about the negative relationship between heightened immigration enforcement policies and anti-immigrant rhetoric, and students’ (and adults’) well-being inside and outside schools. According to data released by the Federal Bureau of Investigation, hate crimes in K–12 schools and colleges increased by 25% in 2017, the second year in a row of growth of this magnitude (U.S. Department of Justice, 2018). Moreover, in a 2018 Pew Research Center survey, about half the Latino/a respondents said that the situation for Latino/as in the United States had worsened over the past year, the majority worried that they or someone they know could be deported, and two thirds said that the Trump administration’s policies were harmful to Latino/as (Lopez et al., 2018). These patterns were reflected in a study of bullying by Huang and Cornell (2019), which found that in school localities in Virginia, in which a majority of voters had supported Trump in the 2016 election, student rates of reporting bullying incidents were 18% and 9% higher for responses indicating that they had been teased “because of their race or ethnicity,” respectively. The authors found no meaningful differences across schools for these two indicators before the 2016 presidential election. Finally, a survey by the Civil Rights Project at the University of California, Los Angeles, reported school personnel’s perceptions of the widespread and troubling consequences of the current immigration enforcement regime on immigrant (and other) students’ physical and mental health and educational engagement (Gándara & Ee, 2018). Considering the size of the population of students (and parents) affected by issues related to unauthorized immigration status, there is a need for additional studies that systematically examine the implications of immigration enforcement on achievement measures alongside students’ socio-emotional and physical safety in school.
Theoretical Framework
The notion of a pyramid of enforcement effects on children of immigrants (Dreby, 2012) is the key framework guiding our study. This framework considers the wide-ranging consequences of immigration enforcement policies for children with parents who are citizens, children with parents who are legal immigrants, and children with parents who are unauthorized immigrants. In this conceptualization, there are numerous ways in which deportations might relate to racial/ethnic gaps in educational outcomes for elementary and secondary schools in districts. In this study, we examined gaps in achievement, chronic absenteeism, and bullying as three discrete outcomes because, while they are interrelated, we hypothesized that deportations may affect each differently.
Academic Achievement
To begin, repeated studies of the achievement gaps between White and Latino/a students show a large and persistent gap in student proficiency as measured by standardized tests. At the national level, results from the National Assessment of Educational Progress indicate improvement in Latino/a students’ performance over time and a slight narrowing of achievement gaps since the 1990s, but Latino/a fourth- and eighth-grade students continue to score significantly below their White peers. Hansen and colleagues (2018) analyzed the most recent results and found that Latino/a eighth graders’ median math score was at the 25th percentile in the distribution of White students’ math and reading scores. In their study of achievement gaps among elementary school districts using data from the Early Childhood Longitudinal Study—Kindergarten Class of 1998–99, Reardon and Galindo (2009) identified variation in the size of the White-Latino/a achievement gaps by Latino/a subgroups by categorizing Latino/a students according to national/regional origin, immigrant generation, socioeconomic status, and language use. Significantly, they documented sizable differences in students’ math and reading skills on entry into kindergarten and showed a reduction in the gap (by about a third) in the first 2 years of children’s schooling. However, there was limited further narrowing of the gap over time, helping explain the ongoing disparities in Latino/a and White students’ educational trajectories.
Scholars have attributed the gaps in White and Latino/a students’ achievement in part to unequal educational opportunities (Galindo & Reardon, 2006; Gándara & Aldana, 2014), language proficiency (Fry, 2008; Kieffer, 2010), as well as family socioeconomic factors (Fryer & Levitt, 2006). The consequences of immigration enforcement and the associated psychological, physical, and material implications for students have not been adequately investigated. The current political and policy context dominated by anti-immigrant rhetoric and activities renders it essential to focus on how students are being affected and what these actions mean for achievement gaps.
Nonachievement Outcomes
Separate from achievement, absenteeism may either increase or decrease depending on whether individual students and families see their particular school as a safe place to be in times of increased risk of deportation or arrest. Although school attendance and achievement are strongly linked (Balfanz & Byrnes, 2006; Gottfried, 2010), the educational performance of those students likely affected by immigration enforcement may be depressed even if they are not absent. The significant psychological and health effects of “living in limbo” (Gonzales, 2015) may be evident among those students who continue to attend school despite ramped-up immigration enforcement. Last, while bullying is closely associated with declining achievement and engagement and long-term mental health issues among young people (Benedict et al., 2014; Eisenberg et al., 2003; Juvonen et al., 2011; McDougall & Vaillancourt, 2015), we chose to examine it as a separate outcome to detect the unique effects of immigration enforcement on this aspect of students’ experiences in schools.
Some studies have attempted to analyze the effects of immigrant enforcement on students in families with undocumented immigrant members by estimating the “likely undocumented” populations (see Amuedo-Dorantes & Lopez, 2015, Hainmueller et al., 2017). Other recent research has operationalized Dreby’s framework by expanding the analyses to include all Latino/a students—regardless of parents’ legal status (Capps et al., 2015; Gándara & Ee, 2018). This suggests that the relatives, friends, and peers of immigrant-origin students are within the scope of potential impacts of immigration enforcement policy. For example, Arbona and colleagues (2010) found similar levels of fear associated with deportation among students with authorized immigrant parents as among students with unauthorized immigrant parents. Gándara and Ee (2018) conducted a survey of roughly 750 schools in school districts across the country asking teachers, school counselors, and administrators about the impacts of immigration enforcement on students and schools. Their results suggest that in schools with the highest concentrations of immigrant-origin children, all students suffered academically and psychologically from the fear and trauma associated with deportation. We follow the approach taken by these and other scholars of immigration enforcement who examine the total effect of immigration enforcement activities and policies on Latino/a students and compare this with the effect on non-Latino/a peers (Bellows, 2019; Dee & Murphy, 2019).
The present study contributes to the existing literature in a number of ways. First, to our knowledge, this is the first study to use a large, national data set to geocode deportation data from more than 250 locations across the United States. Thus, our study has a particular focus on how deportations might predict educational outcomes based on proximity. Additionally, our study is the first to exploit longitudinal and cross-sectional variation in deportations for school districts at such scale. This is key to identifying and generalizing the true effects of immigration enforcement on Latino/a students in U.S. school districts and avoid confounding the estimates with other time-variant factors. According to the U.S. Immigration and Customs Enforcement (n.d.) website, variation in the rate and frequency of deportations may be due to a number of factors, including: “1) the level of cooperation from state and local law enforcement partners; 2) the level of illegal migration; and 3) changing migrant demographics.” Given the well-documented differences in the types of laws and provisions adopted and the degree of cooperation or resistance to federal immigration enforcement within and across states (Capps et al., 2018; Gelatt et al., 2017), variation in ICE activities provides a valuable opportunity for empirical investigation of their impacts. Moreover, this study is the first to examine both achievement and nonachievement measures for school districts in relation to deportations from two large, national data sets. Finally, this study stands to identify future directions for research and policy concerned with understanding (and responding to) the multitude of ways in which immigration enforcement relates to racial/ethnic gaps in educational outcomes for districts.
Method
Data
To examine the relationship between deportations and gaps in educational outcomes in elementary and secondary school districts, we utilized two data sets with information on all public school districts in the United States: the SEDA and the Civil Rights Data Collection (CRDC). To answer the first research question, we relied on the SEDA data set, which provides data on educational contexts and grade-level achievement gaps in school districts from 2009 to 2015 (Reardon et al., 2016). To answer Research Questions 2 and 3, we relied on the CRDC data set, which is publicly available from the U.S. Department of Education’s Office of Civil Rights for the 2013–2014 and 2015–2016 school years. CRDC contains district-level information on student enrollment, educational programming for students, chronic absenteeism, and reports of bullying disaggregated by race/ethnicity, grade, disability status, and English learner status. Each data set was used separately for the analyses given that there was just 1 year of overlap between the two publicly available data sets.
Deportation data come from the Transactional Records Access Clearinghouse (TRAC), which is a research and data distribution organization based at Syracuse University. Given our study’s focus on how school districts are existing in a situation of heightened immigration enforcement, we narrowed our analyses to examine school districts with schools within 1 standard deviation of the mean distance to areas from where individuals in the United States were deported: 100 miles. After narrowing down to this set of districts, we then restricted the sample to include districts for which complete, nonmissing data were observed for 2 years or more. After these restrictions, we arrived at a final analytic sample of N = 228,780 district grade-level observations for analyses using SEDA and N = 12,710 district-level observations for analyses using CRDC.
Outcomes
The first set of outcomes in this study were district-level ELA and math racial/ethnic achievement gaps in 2009 to 2015 on state-mandated assessments for Grades 3 to 8. By transforming state assessment data to make cross-state, cross-grade comparisons, SEDA allows us to examine the district-level standardized achievement gaps between White students’ mean achievement and non-White students’ mean achievement (Reardon et al., 2016). Specifically, we used the White-Latino/a, White-Asian, and White-Black ELA and math achievement gap variables provided in the data set. Precision-weighted mean outcomes from the SEDA data are listed in Table 1 along with available time-varying covariates, which are detailed in the table. The use of precision weighting accounts for the fact that many of the /observations’ assessment scores have standard errors that are larger than the means, so as suggested by Reardon et al. (2016), we have used precision weighting to discount these observations.
Descriptive Statistics of School Districts Within 100 Miles of the Nearest Deportation Using SEDA
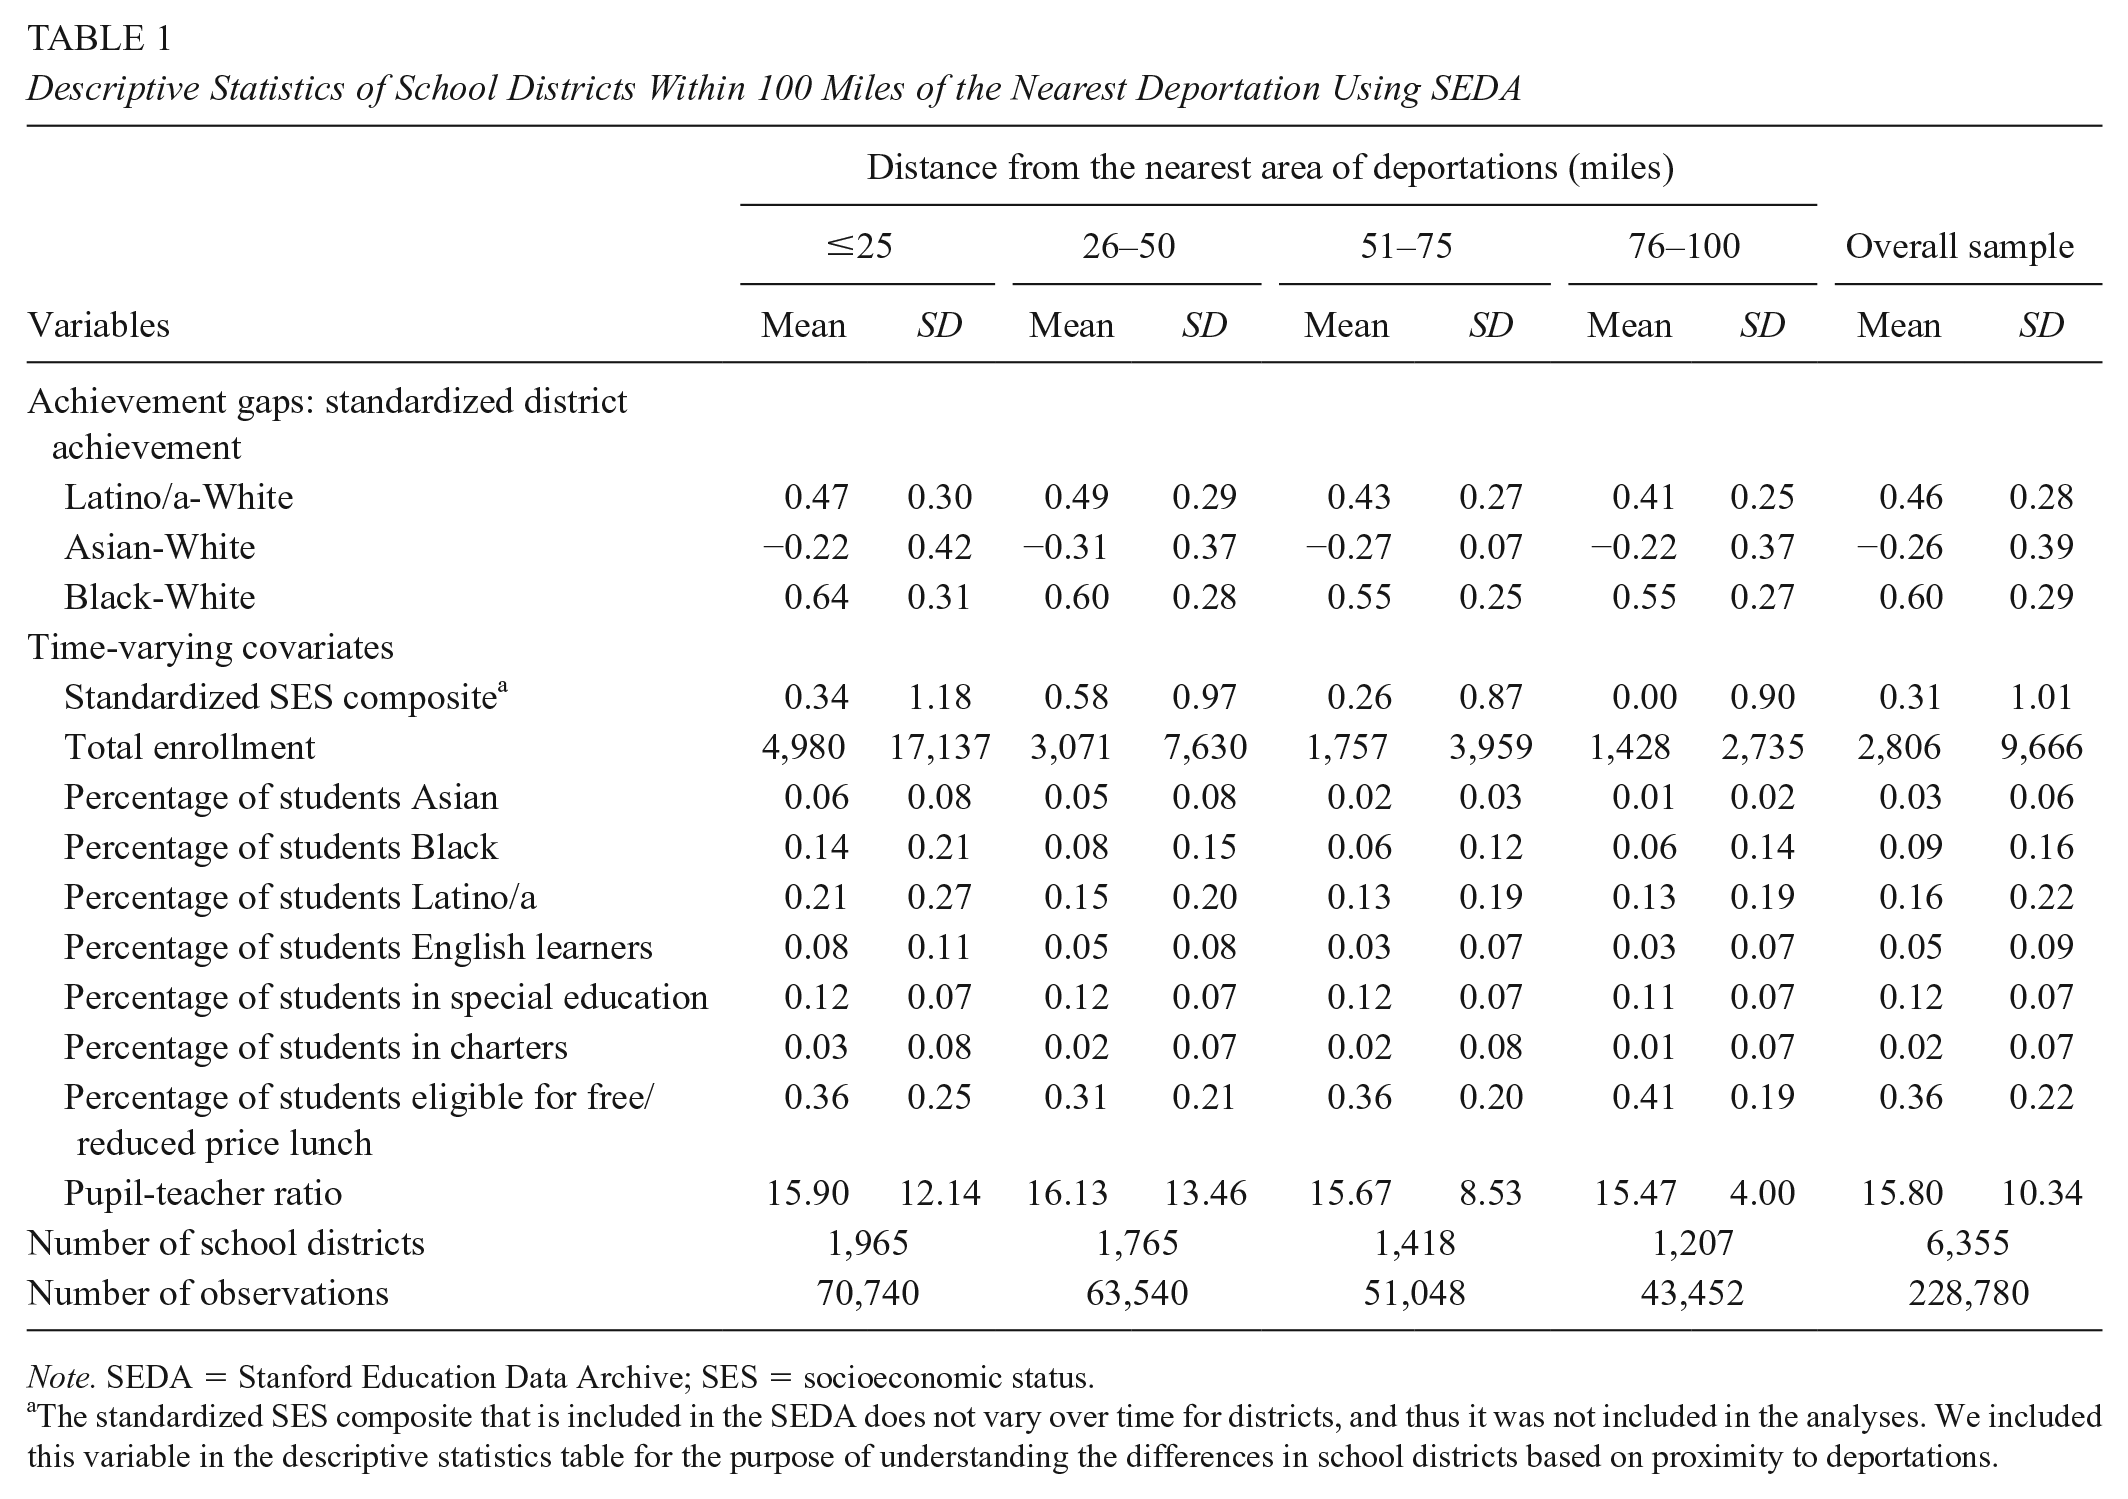
Note. SEDA = Stanford Education Data Archive; SES = socioeconomic status.
The standardized SES composite that is included in the SEDA does not vary over time for districts, and thus it was not included in the analyses. We included this variable in the descriptive statistics table for the purpose of understanding the differences in school districts based on proximity to deportations.
When examining these gaps in Table 1, note that a positive number indicates that White students in the districts tend to perform better on state assessments than non-White students; whereas a negative number indicates that White students in the districts tend to perform worse on state assessments than non-White students. An outcome of 0 would indicate that there is no achievement gap between White and non-White students.
To answer the second research question, racial/ethnic gaps in the rates of chronic absenteeism in 2013–2014 and 2015–2016 were derived from CRDC, which provides the number of chronically absent students, disaggregated by race/ethnicity. While there is no consensus in research or policy on the definition of chronic absenteeism, it is most frequently defined as missing 10% or more of the school year (Gottfried & Hutt, 2019). But while states define chronic absenteeism differently across the United States, the Office of Civil Rights defines chronic absenteeism as missing 15 or more days of the school year. With this definition, districts were asked to report the number of students who were chronically absent. We divided these numbers by the number of enrolled students by race/ethnicity in the district to calculate the variables for the rates of chronic absenteeism among Latino/a, Asian, Black, and White students. Finally, given our focus on gaps in educational outcomes, we subtracted the Latino/a, Asian, and Black rates from the White rates. This yields the gaps in chronic absenteeism rates between White and non-White students, which are shown in Table 2. A positive number indicates that White students had higher rates of chronic absenteeism than non-White students, and a negative number indicates that White students had lower rates of chronic absenteeism than non-White students. As seen from Table 2, the gaps between White and Latino/a students and White and Black students favored White students, and the gap between White and Asian students favored Asian students.
Descriptive Statistics of School Districts Within 100 Miles of the Nearest Deportation Using CRDC
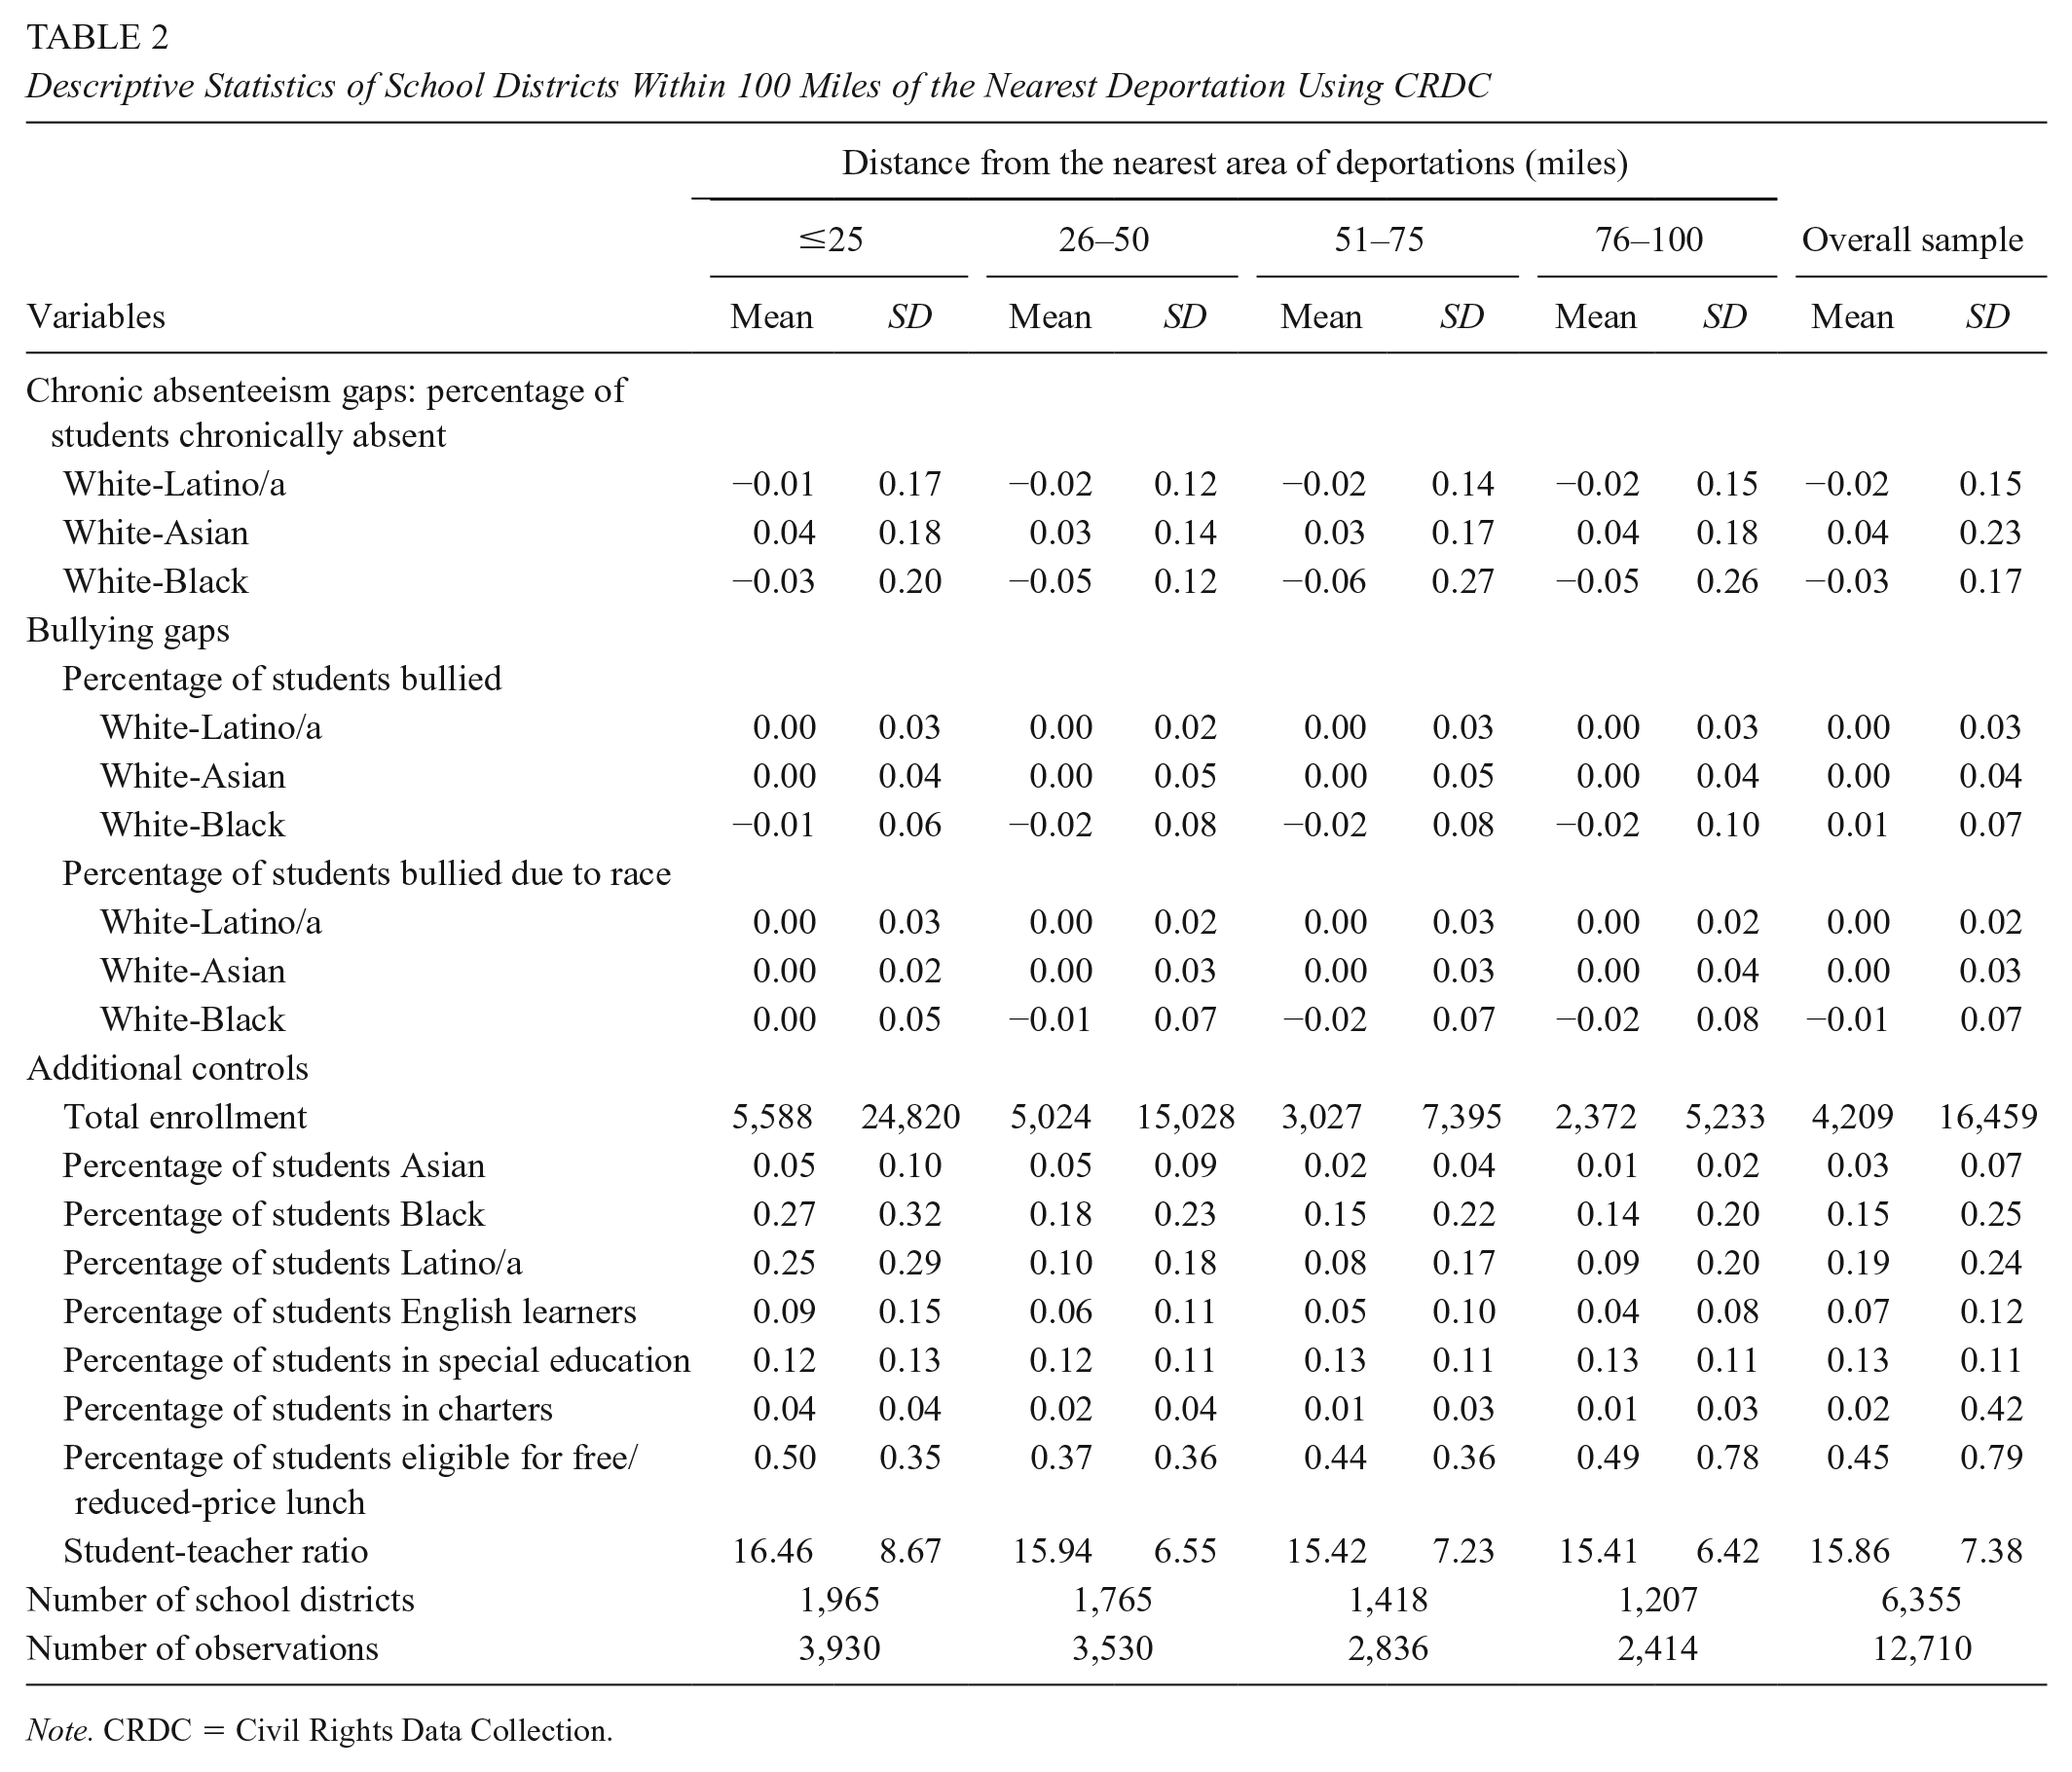
Note. CRDC = Civil Rights Data Collection.
Similarly, gaps in overall bullying rates and rates of bullying based on race were also calculated using data from CRDC. Reported numbers of incidents for each racial/ethnic subgroup were divided by the number of students enrolled by race/ethnicity. Finally, we subtracted the bullying rates for Latino/a, Asian, and Black students from those of White students, and descriptive statistics for these outcomes are also listed in Table 2. A positive number indicates that White students experienced disproportionately higher rates of bullying, and a negative number indicates that White students experienced disproportionately lower rates of bullying. As seen from Table 2, there appears to be some consistency that indicates that Black students experienced higher rates of bullying than White students.
Immigration Enforcement Activities
TRAC published information on the number of deportations from 2002 to 2017. Data can be disaggregated in various ways. We utilized a three-step process for narrowing down the data to be used for our analysis. First, we included data on deportations that were conducted in the interior as opposed to the border, as these data represent deportations occurring for individuals currently residing in the United States as opposed to individuals who were arrested at the border (TRAC Immigration, n.d.). Second, data were then disaggregated by the year in which the deportations occurred. Finally, data were disaggregated to the city from which the persons were deported. This provides a continuous variable for the number of deportations that occurred in 262 unique locations across the years of the sample.
To better understand how the deportations varied both over time and geographically, we show the frequencies of the deportations that occurred in a selection of major U.S. cities across the years in the sample. As seen from Table 3, the number of deportations varied dramatically based on geography. When looking across time, our data validate the general consensus that deportations in the United States decreased from 2009 to 2016. Interestingly, this was not a consistent decrease for all cities. Namely, major cities in Arizona and Texas as well as the city of San Diego experienced similar decreases in deportations compared with the other cities from 2009 to 2015. In the 2015–2016 school year, the trend reversed for these cities, and deportations increased slightly.
Number of Deportations Across Major U.S. Cities Between School Years 2009 and 2016
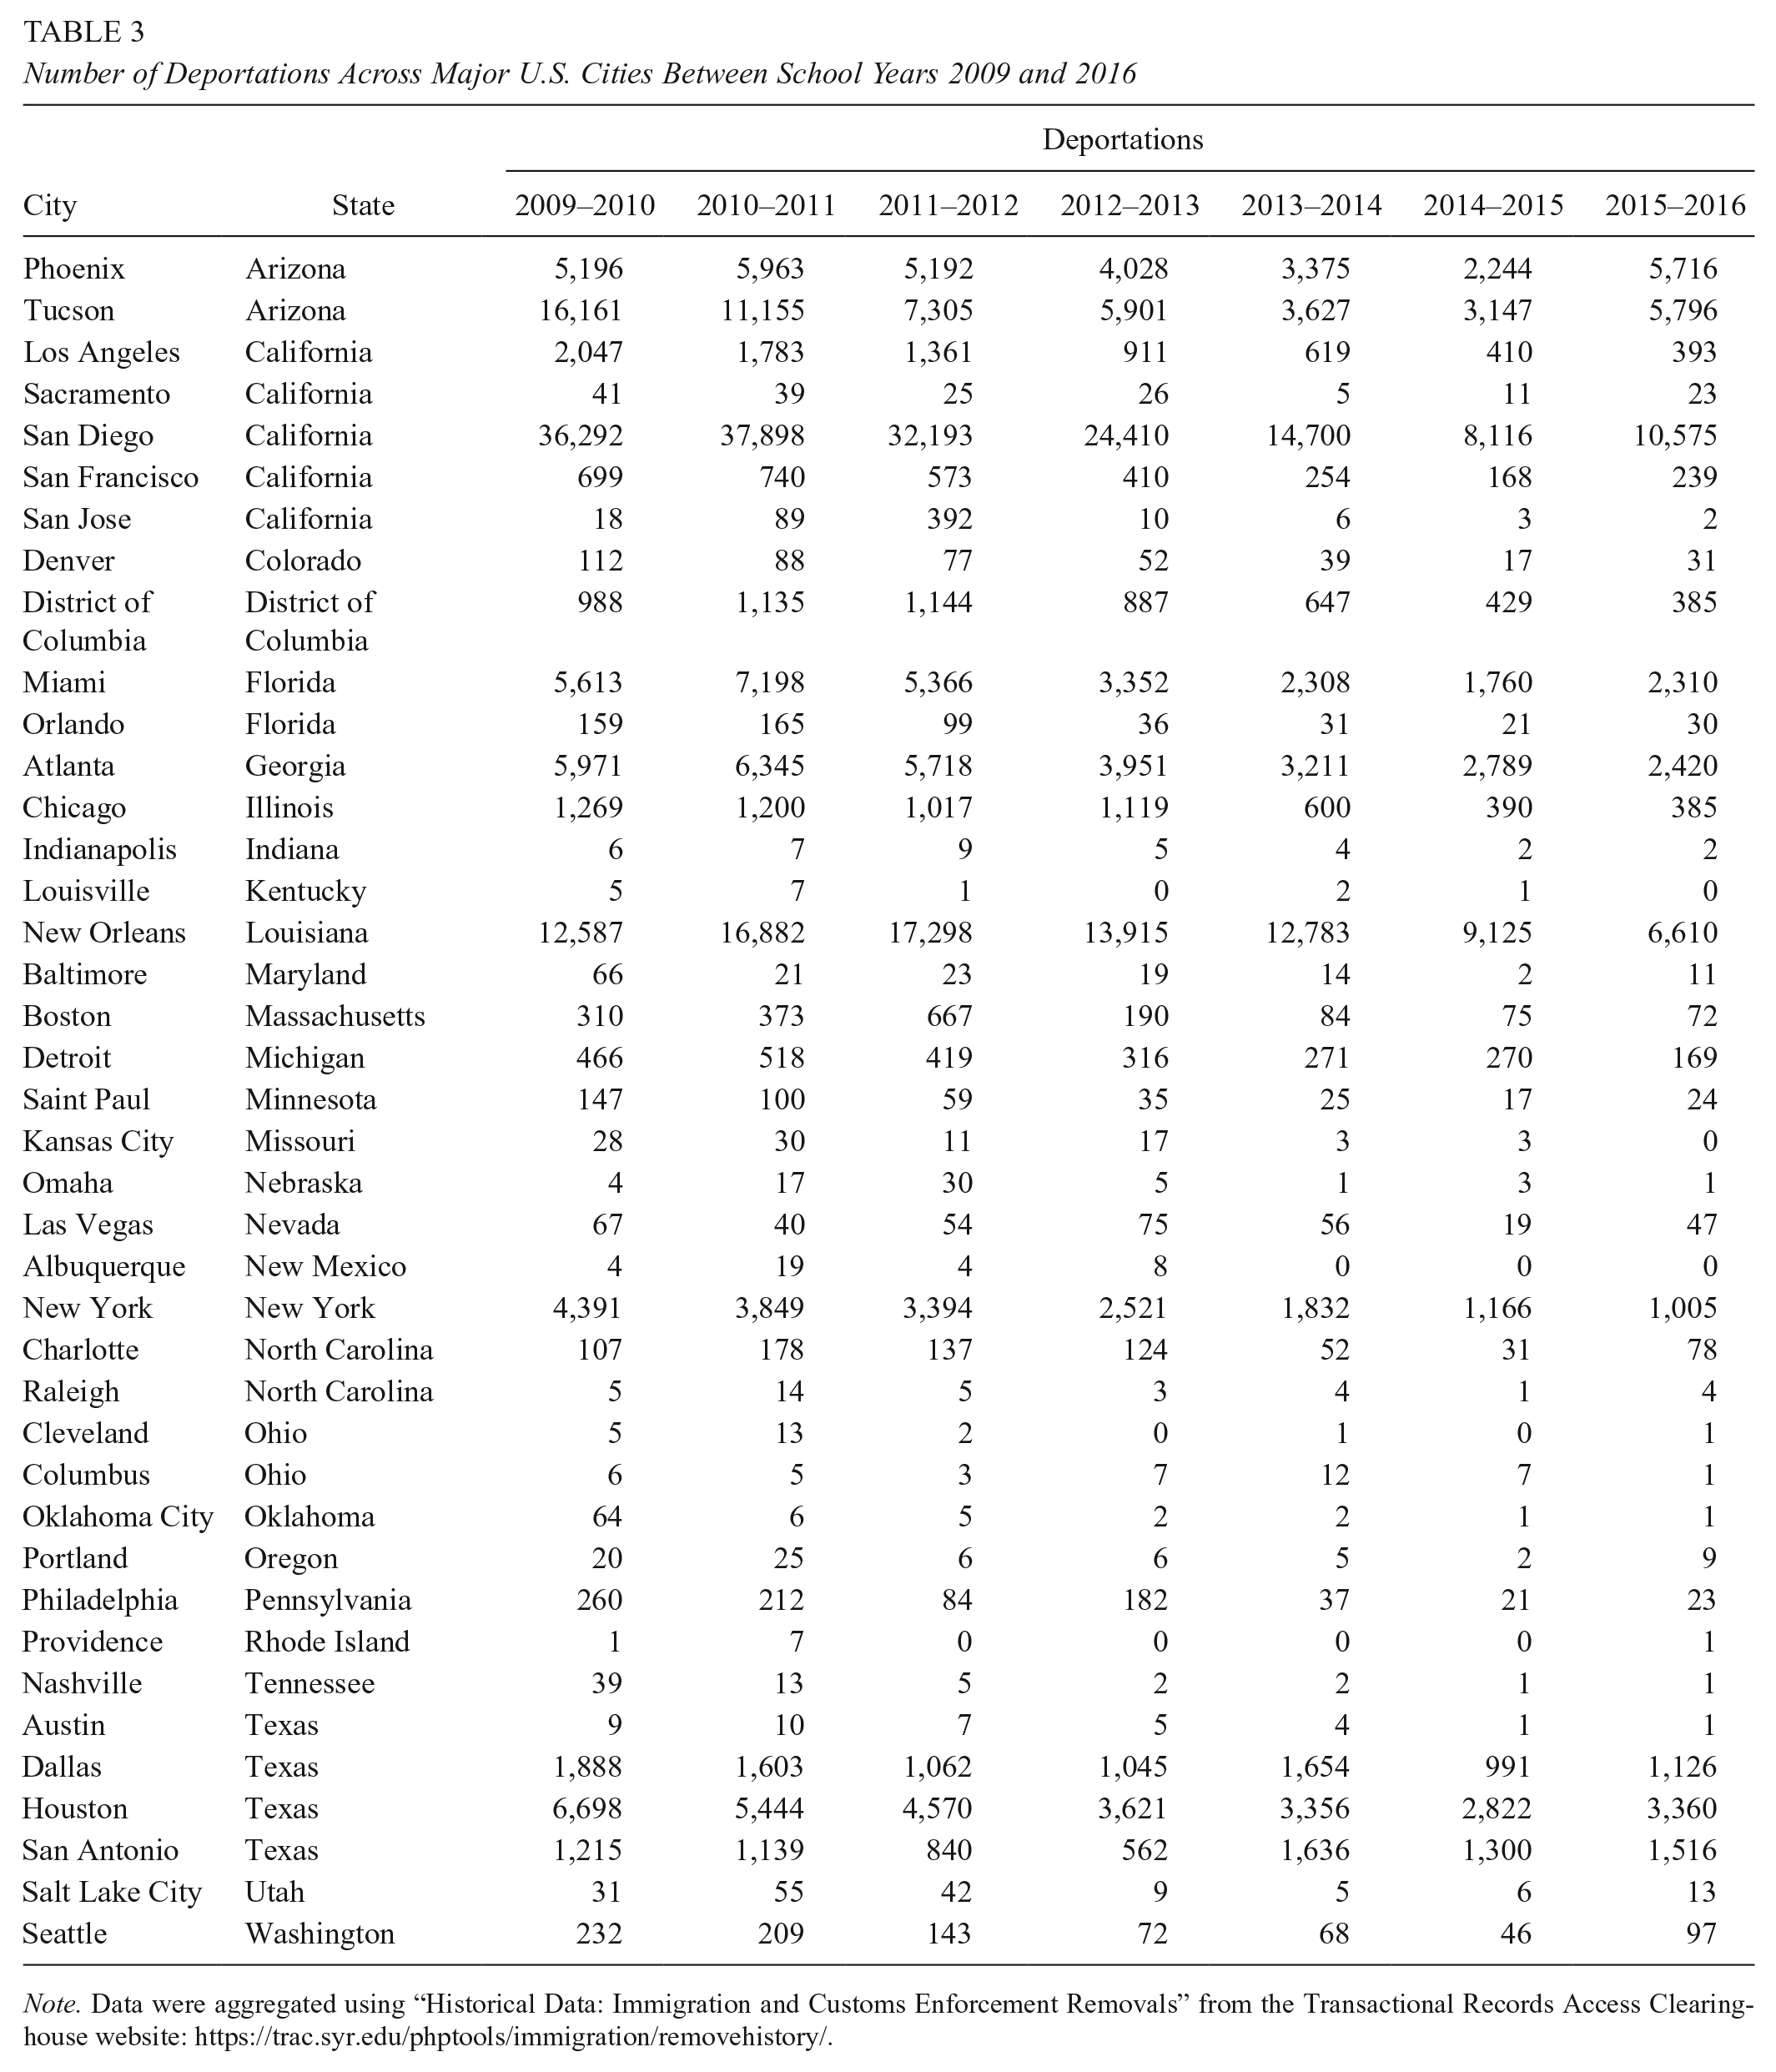
Note. Data were aggregated using “Historical Data: Immigration and Customs Enforcement Removals” from the Transactional Records Access Clearinghouse website: https://trac.syr.edu/phptools/immigration/removehistory/.
To model the relationship between deportations and educational outcomes, we narrowed our sample of districts to those that resided within 1 standard deviation of the mean distance between all school districts and areas from where individuals in the United States were deported. This includes districts within 100 miles of the deportation sites. We viewed this restriction of the sample as necessary, as we were interested in examining outcomes for districts whose students are within a reasonable proximity of deportations. Similarly, we thought that our measure of immigration enforcement should reflect the fact that proximity to deportations likely relates to the degree of their impact. One method of modeling this nonlinear effect is through “binning,” which parses out the one continuous independent variable—overall deportations—into discrete independent variables. Prior research has shown that distance to occurring deportations might be an important moderator (Sattin-Bajaj & Kirksey, 2019), so we cannot assume linearity in the relationship between deportations and educational gaps. Moreover, this method of binning into discrete independent variables allows our models to avoid making parametric assumptions when the continuous variable of interest—deportations—is suspected to have a nonlinear relationship (Keele, 2008).
Thus, the first set of key variables in this study were four bins that represent the amount of deportations that occurred based on ranges of miles to districts: deportations that occurred within 0 to 25 miles to the school district, deportations that occurred within 26 to 50 miles to the school district, deportations that occurred within 51 to 75 miles to the school district, and deportations that occurred within 76 to 100 miles to the school district. Such calculation of these measures of deportations was important given the fact that we believed deportations that occurred closer to school districts deserved more weight in the analysis than those that occurred farther away.
Using the continuous deportation variable derived from TRAC, we took the following steps to combine with the SEDA and CRDC data sets. First, the number of deportations occurring in the 262 cities were mapped onto every school district in the data set, regardless of where the cities were with respect to the school districts. Second, using the longitude and latitude coordinates of each of the cities’ midpoints, we used the geodist command in STATA15 to calculate the distance between each of the 262 cities and the cities in which the school districts were located. Finally, the number of deportations that occurred in or near the cities were added together based on whether these cities were 0 to 25, 26 to 50, 51 to 75, or 76 to 100 miles from school districts.
Additional variables of interest include the distance to the nearest deportations (calculated via geodist) and an interaction between this distance measure and the number of individuals being deported from that city.
Time-Varying Covariates
This study utilized year and district fixed-effects models to make comparisons within a school district over time based on changes in the number of individuals being deported in the area. This type of analysis (as described below) subsumed the time-invariant variables (i.e., urbanicity or U.S. state where a school district is located). Each school district served as its own control since multiple observations of a district exist over time. As such, the models included a set of covariates derived from SEDA and CRDC that vary across time and control for potentially confounding factors when examining deportations and outcomes.
The variables included in each of the models include measures of total enrollment; the percentage of students in the district who are Asian, Black, or Latino/a; the percentage of students in the district who received free or reduced-price lunch; the percentage of students who had a disability; the percentage of students who were English learners; the student-teacher ratio; and the percentage of students in charter schools. These were the common covariates across the SEDA and CRDC data sets.
Unique to the SEDA data set, Reardon and colleagues (2016) calculated a time-invariant socioeconomic status composite of school districts that was calculated based on a series of variables. They utilized data from individuals in the surrounding Census neighborhoods in the school district, including the percentage of adults who were employed, the single-parent family rate, the poverty rate, the percentage of adults with a bachelor’s degree, the median family income, and the Supplemental Nutrition Assistance Program eligibility rate. These data were compiled into a continuous variable representing the socioeconomic status of the district for each year. We have chosen to include the descriptive statistics of this variable in Table 1 to assist us in examining the differences between districts based on their proximity to deportations. However, given that our models control for all time-invariant variables, this variable was not used in the analyses.
Differences Based on Proximity to Deportations
Using the steps outlined above, districts had different deportation and distance-related statistics, predicting gaps in educational outcomes based on where the districts were located in the United States and the year in which the outcomes and deportations were observed. This cross-sectional, longitudinal design rules out confounding factors that also affected district outcomes around the same time or in the same schools that witnessed changes in the number of deportations conducted in the area. Tables 1 and 2 display descriptive statistics for all the variables utilized from the SEDA and CRDC data sets, separated by school districts that are 0 to 25, 26 to 50, 51 to 75, or 76 to 100 miles from the nearest site of deportations. There are two notable differences between school districts based on their proximity to deportations, as shown in the tables. First, looking at Table 1, districts that were farther away from the nearest deportation site were more likely to have lower socioeconomic status and lower overall enrollments, particularly districts that were 50+ miles away from the nearest deportation area. It could be that these districts tend to be farther away from urban centers and in more rural areas of the country. Note that when descriptively looking across the districts in Tables 1 and 2, there are no differences in educational outcomes based on the distance measure.
To further explore differences based on proximity, we mapped the deportations to give a visual sense as to where these deportations are occurring. Figure 1 shows every unified or elementary school district located within 100 miles of an interior deportation site, with the color of the district’s marker adjusted for how close it is to the site.

School districts within 100 miles of interior deportations from 2009 to 2016.
Analysis
As noted above, we utilized the SEDA and CRDC data sets separately. For ease of interpretation, we have outlined our analyses using two empirical specifications.
To answer Research Question 1, we began our analysis with the following model with the SEDA data set:

where Y represents the standardized achievement gap outcomes of grade i in district j in year t; D represents a set of key predictor variables: the number of deportations occurring within 0 to 25, 26 to 50, 51 to 75, or 76 to 100 miles from school districts; M represents the miles between the district and the closest city where the deportations occurred, and the interaction between D and M represents the moderating variable between deportations and distance to the nearest deportation site.
1
By including this interaction term, the estimates from
Next, we included a series of grade, year, and district fixed effects in the model, which is a series of binary indicators for every grade level i, school year t, and district j in the data set. This use of fixed effects accounts for observed and unobserved variation in the data that could confound our estimates at the respective unit levels. For instance, U.S. states dramatically altered their focus of time and resources on the use of standardized assessments after the introduction of the No Child Left Behind waivers in 2011 (McGuinn, 2016). By not accounting for year-to-year variation, our estimates between the rise in deportations and potential changes to racial/ethnic achievement gaps would be likely confounded simply based on when the data were being observed and the changes occurring to both variables over time.
As another example, district fixed effects restrict the comparisons of the associations between deportations and educational outcomes to the same school district that is being observed. In other words, the associations between deportations and outcomes were observed for a district in one time period, and these estimates in one time period were compared with the estimates in the next. This essentially makes each individual district its own control, and all observed and unobserved variation is eliminated to avoid biasing estimates. To illustrate why district fixed effects is an important modeling technique, the Southwest Detroit National Center for Families Learning program provides families from predominantly Latino/a, English-learning, and low-income backgrounds with educational resources meant to strengthen ties to schools in the area. Additionally, Detroit Police Chief James Craig has emphasized that Detroit’s police officers will not cooperate with immigration enforcement officials, which is often one of the primary ways in which ICE identifies and apprehends individuals suspected of not having legal status (CBS Local Detroit, 2017; Lewis et al., 2013). For our analysis, the added resources for students as well as local support for immigrant-origin populations would confound our results by not accounting for those unobserved characteristics that are beyond the relationship between deportations and educational outcomes.
Finally,
We examined the next two research questions using the following model with the CRDC data set:

where
Results
Achievement Gaps
Table 4 presents the results from Model 1 to estimate the association between deportations and racial/ethnic achievement gaps. All coefficients are presented as standardized-beta effect sizes, which constitute effect size estimates similar to those of Cohen’s d (Cohen, 1992; Cohen et al., 2013). Standard errors are presented in parentheses. Recall that these models account for all observed and unobserved variation at the grade, year, and district levels, as noted by the fixed-effects specifications at the bottom of the table. The variables of interest are displayed in the first column of the table.
Estimates of the Effects of Deportations on Racial/Ethnic Achievement Gaps

Note. Robust standard errors are in parentheses. ELA = English language arts.
p < .05. **p < .01. ***p < .001.
The second column illustrates the estimated associations between deportations and the White-Latino/a achievement gaps in ELA. The third column illustrates the associations between deportations and White-Latino/a achievement gaps in math. Positive coefficients indicate higher relative average performance of White students versus Latino/a students. Because White students generally perform higher on average than Latino/a students, we describe positive coefficients as indicating larger gaps and negative coefficients as indicating smaller gaps.
As seen in column 2, there were no statistically significant estimates of the association between the measures of deportations and the White-Latino/a achievement gap in ELA for school districts. However, there were statistically significant estimates for math achievement gaps, as seen in column 3. The way to interpret this coefficient is that a standard deviation unit increase in deportations between 0 and 25 miles, which is about 850 deportations, predicts an increase in the White-Latino/a math achievement gap by 0.08 standard deviation unit. Recall that we included an interaction term between the deportations occurring in the nearest site and the distance to this site for districts, which allows us to interpret this as a main effect for school districts that reside in cities where deportations occurred (miles to nearest site of deportations = 0 and interaction term = 0). This magnitude in effect size is comparable to what has been found in other studies on the impacts of deportations on achievement that examined the relationship between student absenteeism during the period of standardized testing and students’ standardized achievement (Gottfried & Kirksey, 2017).
Turning attention to the interaction term, it appears that school districts located farther away from the nearest deportations were less affected than districts in closer proximity, as the interaction term is negative (effect size = −0.04). In other words, holding the number of deportations constant, the more miles a district was from the closest area with deportations, the smaller the district’s observed White-Latino/a math achievement gap. This coefficient combined with the estimates of the main effect of deportations on the White-Latino/a math achievement gap indicates that distance is a moderator of the estimated association found in the first row of the table.
The next four columns of the table display findings for the association between deportation measures and White-Asian and White-Black achievement gaps in ELA and math, respectively. As seen from these columns, there were no statistically significant associations between deportations and achievement gaps between White and Asian and White and Black students. The only statistically significant finding from Table 4 relates to White-Latino/a achievement gaps in math.
Chronic Absenteeism
Table 5 presents standardized effect size estimates of the association between deportations and racial/ethnic gaps in rates of chronic absenteeism. Positive coefficients indicate higher relative rates of chronic absence among White students versus Latino/a students. Because White students are generally less absent than Latino/a students, we describe negative coefficients as indicating larger gaps and positive coefficients as indicating smaller gaps. Positive coefficients represent a movement in the gaps in rates of chronic absenteeism for districts in the direction of White students having higher rates of chronic absenteeism than any other subgroup. Negative coefficients represent an increase in the gaps in rates of chronic absenteeism for districts where White students would have lower rates of chronic absenteeism than any other subgroup. As with achievement gaps, Table 5 illustrates descriptively that the gaps tend to favor White students, with Latino/a and Black students having higher rates of chronic absenteeism. Thus, negative coefficients represent an exacerbation of this gap in the status quo. Recall than these models account for variation between years and between districts using year and district fixed effects.
Estimates of the Effects of Deportations and Racial/Ethnic Gaps in Rates of Chronic Absenteeism

Note. Standard errors are in parentheses.
p < .05. **p < .01. ***p < .001.
Looking at the first column of Table 5, the findings indicated that when there was a 1 standard deviation increase (~850) in the number deportations occurring within 0 to 25 miles of school districts, White-Latino/a gaps in chronic absenteeism widened, with an effect size of 0.28. Again, this estimate represents the predicted main effect for school districts with all else held constant (miles to nearest site of deportations = 0 and interaction term = 0). The size of this association is considered a moderate to large effect size in social science research (Keith, 2006). Specific to the chronic absenteeism outcome, this effect size is similar to the estimated effect of having familiar classmates from year to year in elementary school (Kirksey & Gottfried, 2018) and the impact of school climate (Brookmeyer et al., 2006) on chronic absenteeism. Then, looking at the interaction term, it appears that this association was also moderated by distance. As deportations increased, the observed chronic absenteeism gaps for school districts that were farther away from the deportation sites were smaller compared with schools districts in cities closer to the deportation sites (effect size of −0.28). Note that no other statistically significant effects arose, including associations from the covariates.
In contrast, it does not appear that increased deportations were correlated with increased chronic absenteeism gaps for students of other races versus White students in the school districts. Columns 3 to 5 illustrate these null effects. Similar to the results of Table 4, the only statistically significant associations between deportations and gaps in the rates of chronic absenteeism were for Latino/a-White students in districts.
Bullying
Two outcomes related to bullying of Latino/a and non-Latino/a students were examined: racial/ethnic gaps in the rates of overall bullying and in the rates of bullying reported based on racial discrimination. Table 6 presents effect sizes of the associations between deportations and these two outcomes, in columns 2 and 3, respectively. Again, both models include year and district fixed effects.
Estimates of the Effects of Deportations and Racial/Ethnic Gaps in Rates of Bullying

Note. Standard errors are in parentheses.
p < .05. **p < .01. ***p < .001.
As seen from Table 6, no statistically significant associations between the number of deportations and gaps in bullying rates arose from the models. There were no statistically significant associations that emerged from any of the independent variables included in the models.
Discussion
Questions about how immigration enforcement policies affect students’ educational engagement and outcomes have never been more relevant. With the substantially higher numbers of arrests and removals of immigrants made during the 2017 fiscal year compared with the previous year and the inclusion of more people without prior criminal convictions among those arrested and deported, millions of families are living in fear and suffering the consequences (Dickerson, 2017). Unauthorized immigrants’ already tenuous relationship with public institutions is often further weakened in times of increased enforcement or more stringent policy environments (Potochnick et al., 2017). This pattern has borne out dramatically in the Trump era.
Motivated by the ongoing deportation machine, this study sought to examine the relationship between deportations across the United States and racial/ethnic gaps in educational outcomes for Latino/a students in public school districts during the previous administration. We show that the number of deportations correlates with widening White-Latino/a gaps in math achievement and chronic absenteeism in school districts within 25 miles of the deportation sites. Ultimately, our findings aim to offer insight for schools, districts, and states seeking to mitigate the widening gaps that might occur during times of heightened immigration enforcement.
There are several possible explanations for these findings. First, previous research has noted the numerous psychological consequences of immigration enforcement for undocumented families. These include trauma, stress, anxiety, and other mental health disorders (Chaudry et al., 2010; Hainmueller et al., 2017, Gonzales et al., 2013; Suárez-Orozco et al., 2011; Zayas et al., 2015). There is also research noting that these same effects exist in communities with larger proportions of Latino/a students and communities with greater percentages of immigration-origin residents (Gándara & Ee, 2018). Students attending school districts in areas with more immigration enforcement activity might be more routinely exposed to enforcement near their homes. These students may be more likely to be exposed to friends or family members who have been apprehended and/or media and rhetoric exacerbating the effects of immigration enforcement (Kirksey et al., 2018).
Thus, it could be the case that these mental health consequences of general exposure to immigration enforcement may disrupt students’ learning experiences in school. Notably, increased deportations near school districts did not correlate to widening Latino/a-White achievement gaps in ELA. Prior research may help explain the decline in math achievement that we found in our study. Studies show that math achievement tends to be most affected by disruptions to the learning context (i.e., distressed students) given that instruction in this domain tends to introduce content in a linear fashion, scaffolding student knowledge and requiring efficient retrieval cognitive processes (Monk & Ibrahim, 1984). Incidents involving deportations or immigration-related arrests could be experienced by some students as sudden disruptions, which interrupt their opportunities to learn math concepts in school, with each concept relying on the previous to advance understanding of math content.
With regard to absenteeism, it could be the case that students or parents of students attending school districts in areas with greater immigration enforcement experience greater fear in coming to school. Recently, multiple accounts of ICE coming onto school grounds and arresting parents and students have been documented via news outlets and mass media, and there is a large concern that such heightened enforcement may be keeping students from attending school (Castillo, 2017). For example in March 2017, 2,000 students in Las Cruces, New Mexico, stopped going to school in the days following raids by ICE agents (Blitzer, 2017), illustrating the ways in which immigration enforcement activities can directly affect students in schools. In Charlotte, North Carolina, a 19-year-old boy was arrested by ICE on his way to high school, demonstrating yet another case in which enforcement is utilizing schools to corral students who are not legal citizens (Price, 2016). In light of the established relationship between absenteeism and many short- and long-term outcomes for students (Balfanz & Byrnes, 2006; Gottfried, 2010; Gottfried & Kirksey, 2017; Kirksey, 2019), fear of coming to school may interconnect with the achievement gaps also shown to be exacerbated in this study.
Furthermore, the associations between nearby deportations and widening gaps in math achievement and chronic absenteeism for Latino/a students, specifically, across school districts may relate to political rhetoric regarding immigration enforcement that is primarily geared toward Latino/a families. Teachers, school leaders, families, and students are exposed to the consistent language surrounding immigration enforcement measures (Gándara & Ee, 2018), and this language may be accentuated when there is greater deportation activity near school districts.
Finally, we should note that this study complements the work of Bellows (2019), who also used SEDA and data on removals in the United States. Together, our studies present two distinct ways to measure immigration enforcement, which ultimately have implications for the outcomes we observe and our interpretations of these outcomes. As some of the early empirical work contributing to an emerging field, our study alongside that of Bellows highlights the importance of detailing how different measures of immigration enforcement relate to other known confounding factors and how these differences may shape our understanding of the implications of our research findings. By focusing on the rollout of the Secure Communities program, one specific immigration policy that changed the nature of enforcement, Bellows is able to measure its impact on student achievement at the county level in the United States. Moreover, she provides evidence of the correlation between demographic trends and student achievement. By contrast, our study did not examine one particular immigration policy but relied on a new measure of deportation that included those effectuated under the scope of Secure Communities as well as other programs. We also prioritized capturing the role of proximity to deportations to understand the role of proximity of immigration enforcement activities. Both studies note a key limitation: the potential confounding of geographic factors in the identified relationships between immigration enforcement and student outcomes. It is likely the case that unobserved attributes of a community predict both the number of deportations occurring within 25 miles of a school district as well as gaps in educational outcomes for students in that school district. And as Bellows notes, there is potential that county-level attributes predict both the activation of Secure Communities as well as student achievement. Researchers should build on these two approaches to work toward more accurate identification of the effects of immigration enforcement and more nuanced understandings of the mechanisms producing such effects.
Limitations
There are several limitations to this study that should be acknowledged. First, this study sought to understand the relationship between deportations and racial/ethnic gaps in educational outcomes in public school districts, but we were unable to disentangle our questions from the question of the effects of immigration enforcement for specific subgroups of Latino/a students. Subpopulations of particular interest include students who are first or second generation, students who were not born in the United States, migrant students, and Latino/a students with other types of demographic differences. These populations might be of interest to researchers and policymakers considering that they are often the direct targets of immigration enforcement and related rhetoric. Second, this study relied on large, secondary data to answer a set of research questions. Thus, we were not able to parse out cause and effect between deportations and racial/ethnic gaps in educational outcomes for districts. Third, the general relationship between immigration enforcement and educational gaps might be confounded by unobserved variables related to the geographic distribution of school districts. As noted in Table 3, we noticed that trends in the numbers of deportations were not the same for all cities. Thus, it could be the case that there is an unobserved characteristic related to both educational gaps and the numbers of deportations that is biasing our results. This is a key issue when utilizing a research design that considers immigration enforcement at such scale. Future research focused on specific case studies can eliminate this potential for selection bias by exploiting more rigorous quasi-experimental methods that we could not use for this study. Finally, while this study relied on the best-known source of data on immigration enforcement, it is worth noting that all publicly available data on apprehensions or deportations of immigrants in the United States are significantly limited in their information on the background of individuals facing deportation and the area where individuals were arrested. Smaller-scale studies might add to our understanding of the effects of immigration enforcement with more accurate, perhaps locally collected, measures of enforcement.
Conclusion
Our study sheds light on the ways in which deportations are a concern regarding educational outcomes for Latino/a students in U.S. school districts. These findings set the stage for future work that investigates what districts have done and can do to best support students facing negative consequences or uncertainty and potentially minimize the harmful effects of immigration enforcement policies on young people. We see this study as a call for researchers, policymakers, and educational leaders to consider the role and responsibilities of schools in supporting their students, to investigate these questions empirically, and to work to eliminate the obstacles to providing an equitable education and equal opportunity for students.
Footnotes
Appendix
Notes
Authors
J. JACOB KIRKSEY is a PhD candidate at the University of California, Santa Barbara, and a Graduate Research Fellow with the National Science Foundation. His research is concerned with promoting equitable outcomes in schools by drawing attention to unintended consequences in education policy.
CAROLYN SATTIN-BAJAJ is an associate professor at the University of California, Santa Barbara. Her research focuses on issues of educational access and equity for immigrant-origin youth and other historically underserved student populations.
MICHAEL A. GOTTFRIED is a professor at the University of California, Santa Barbara. His research focuses on absenteeism, schooling context, STEM, and students with disabilities.
JENNIFER FREEMAN is a PhD student at the University of California, Santa Barbara, and a Graduate Research Fellow with the National Science Foundation. Her research concerns policy issues in K–12 education and transfer student pathways in higher education.
CHRISTOPHER S. OZUNA is a PhD student at the University of California, Santa Barbara. His research interest is in how policies enacted outside the classroom affect what happens inside the classroom.